Article

Does a Certain Rule Exist in the Long-Term Change of a City’s Livability? Evidence from New York, Tokyo, and Shanghai

Shanghai Key Lab for Urban Ecological Processes and Eco-Restoration, School of Ecological and Environmental Sciences, East China Normal University, Dongchuan Road 500, Shanghai 200241, China
*
Author to whom correspondence should be addressed.
Sustainability 2017, 9(10), 1681; https://doi.org/10.3390/su9101681
Submission received: 23 August 2017 / Revised: 19 September 2017 / Accepted: 19 September 2017 / Published: 21 September 2017
(This article belongs to the Section Sustainable Urban and Rural Development)

Abstract

:
Livability is the ultimate goal of city development. However, the question of whether the changing pattern of a city’s livability follows a certain rule or not has seldom been argued. To address the question, three cities, including New York, Tokyo, and Shanghai are selected for case studies. Based on a proposed assessment framework, the long-term trend and determinants of three cities’ livability are quantified and investigated. The results suggest that the livability of three cities demonstrates a similar changing pattern during the last decades, with the level going through a three-staged N-curve development, increasing at the beginning, then declining in the mid-term, and rebounding afterward. It implies that the staged development rule should be followed when constructing a livable city. Efforts should be targeted towards the most underlying aspects in different periods. The empirical analysis of the three cities ascertains the existence of a development rule regarding livability, and suggests many potential uses for decision-making support.

1. Introduction

It is generally agreed that people-oriented rather than economy-oriented development should be the target of societal evolution [1,2,3,4,5]. Due to the close relationship between people-oriented development and livability, the improvement of livability is therefore considered to be highly desirable and a premise for sustainable development [6,7,8,9,10]. Currently, over 50% of world population lives in cities, and this fraction is supposed to rise to 70% in 2050 [11]. In addition to the substantial concentrations of population in cities, we will also see massive depletion of energy and other natural resources, environmental deterioration, and climate change, which in return hinder socio-economic development and lower the integral wellbeing of cities [12,13,14]. It is reasonable to believe that livability, which calls for a harmonious nature–human living environment for citizens, will be the ultimate goal for city development and will solve the abovementioned problems effectively [15,16,17,18,19]. Thus, comprehensive and quantitative assessments of the scale and dynamic patterns of livability have been increasingly focused on and demanded by a wide range of stakeholders.
Internationally, a number of studies have been attempting to evaluate livability with their own developed indicator system. Most of them focused on the ranking and comparison of livability among cities at some specific points of time [20,21,22,23,24]. Undoubtedly, this kind of research can help to diagnose the deficiencies in a city’s livability construction. However, when policy-makers make relevant changes, the questions of whether those changes could play a positive role or not, and how well those changes would improve the livability have seldom been touched upon or answered well through the aforementioned cross-sectional research (the ranking and comparison of livability among cities at a time point), since in many cases they cannot ensure continuity in time and the consistency of indicators employed for evaluation [24,25]. Even a well-known research institution like the Economist Intelligence Unit (EIU) has only released its global livability ranking report annually since 2010, and paid little attention to those questions above. Currently, an increasing number of cities have targeted the improvement of livability as an important development goal in their long-term planning, and their inhabitants want to know whether the livability has been truly improved according to their implemented policies. Therefore, there is an urgent need for a long-term livability study based on a continuous, consistent, and comparable evaluation criterion.
In this sense, we have developed an indicator system for assessing the long-term change of livability and applied it to three cities (New York, Tokyo, and Shanghai) in both developed countries and emerging economies. The research objectives are to answer the following two questions: (1) Do the changing pattern of cities’ livability follow a certain rule, or not? and (2) If the rule exists, what policy implications can we learn in order to improve the livability of cities?
The rest of the paper is organized as follows. Section 2 reviews the contemporary studies of livability. Section 3 introduces the characteristics of the case study cities and data sources used for analysis. Section 4 describes the indicator system and methods for livability assessment. Section 5 presents the results regarding the two questions raised in the study and discusses the potential improvements of the proposed methodology and results. Section 6 concludes the study.

2. Contemporary Studies of Livability

Since the pioneer work has been reported by the World Commission on Environment and Development (WCED) on livability in the 1980s [26], a significant number of scholars and research institutes have been dedicating themselves to develop livability theories and evaluation systems to increase our knowledge on livability (as summarized in Table 1).
Accordingly, a broad picture of livability emerged, but with its definition and quantification varying across studies. For instance, United Nations Environmental Program (UNEP) published a report entitled “Cities in a Global World: Global Report on Human Settlements 2001”, which defines a livable city as a place where residents are able to find high enough wages to sustain life [27]. The United Nations Human Settlements Programme (UN-Habitat) indicated that livability is “the quality of life felt by inhabitants from a city or region” [28]. Vuchic defined livability as “a notion that is generally understood to encompass those elements of home, neighborhood, and metropolitan area that contribute to safety, economic opportunities and welfare, health, convenience, mobility, and recreation” [29]. The generality among the different notions of livability is the key characteristics of a city or region that are attractive to people’s living and wellbeing.
However, the scopes and indicators of livability range from macroscopic ones (for example, GDP (Gross Domestic Product) growth, government effectiveness, greenhouse gas emissions, and so on) to specific ones that are close to people’s daily lives (for example, number of hospital beds, public parks and schools, and so on). The methods for determining the weights of scopes and indicators also differ from one another. In specific, Zanella et al. [30] established their livability index through a data envelopment analysis (DEA)-based composite indicator model, which focuses more on the achievements of indicators. Tan and Thye [22] evaluated the livability based on the perspectives of ordinary persons. Five scopes and several specific indicators closely related to an ordinary person’s life, such as the number of hours worked per year and the number of hospital beds, were selected and weighted equally for analysis. The Livability Index of America Association of Retired Persons (AARP) considered seven equally-weighted categories (housing, neighborhood, transportation, environment, health, engagement and opportunity) in the neighborhood level livability assessment [31]. In addition, some scholars and institutes also determined the weights of scopes and indicators according to their own consideration. For example, the Economist Intelligence Unit (EIU) has been conducting a global livability ranking assessment since 2010, in which the livability of over 200 cities is ranked based on the performance on stability, healthcare, culture, environment, education, and infrastructure. The weight of each category is slightly different, while the underlying indicators are assigned an equal value within the same category [20]. The Mercer Quality of Living Ranking (2017) employed 10 categories and 39 factors for livability assessment, and highlighted city infrastructure (easy access to transportation, reliable electricity, drinkable water, etc.) as an especially important factor [23]. Numbeo [24], the world’s largest livability database, established its assessment model by using an empirical formula, in which scopes and indicators were weighted differently. Li et al. [25] established a kind of bottom-up model for livability assessment. They classified 25 indicators into several categories by cluster analysis rather than firstly defining a hierarchical scopes and then selecting corresponding indicators.
In sum, the diverse aspects of human life that are embraced by the concept of livability, and the differences among researchers from various disciplines make it difficult to reach a consensus on livability study.

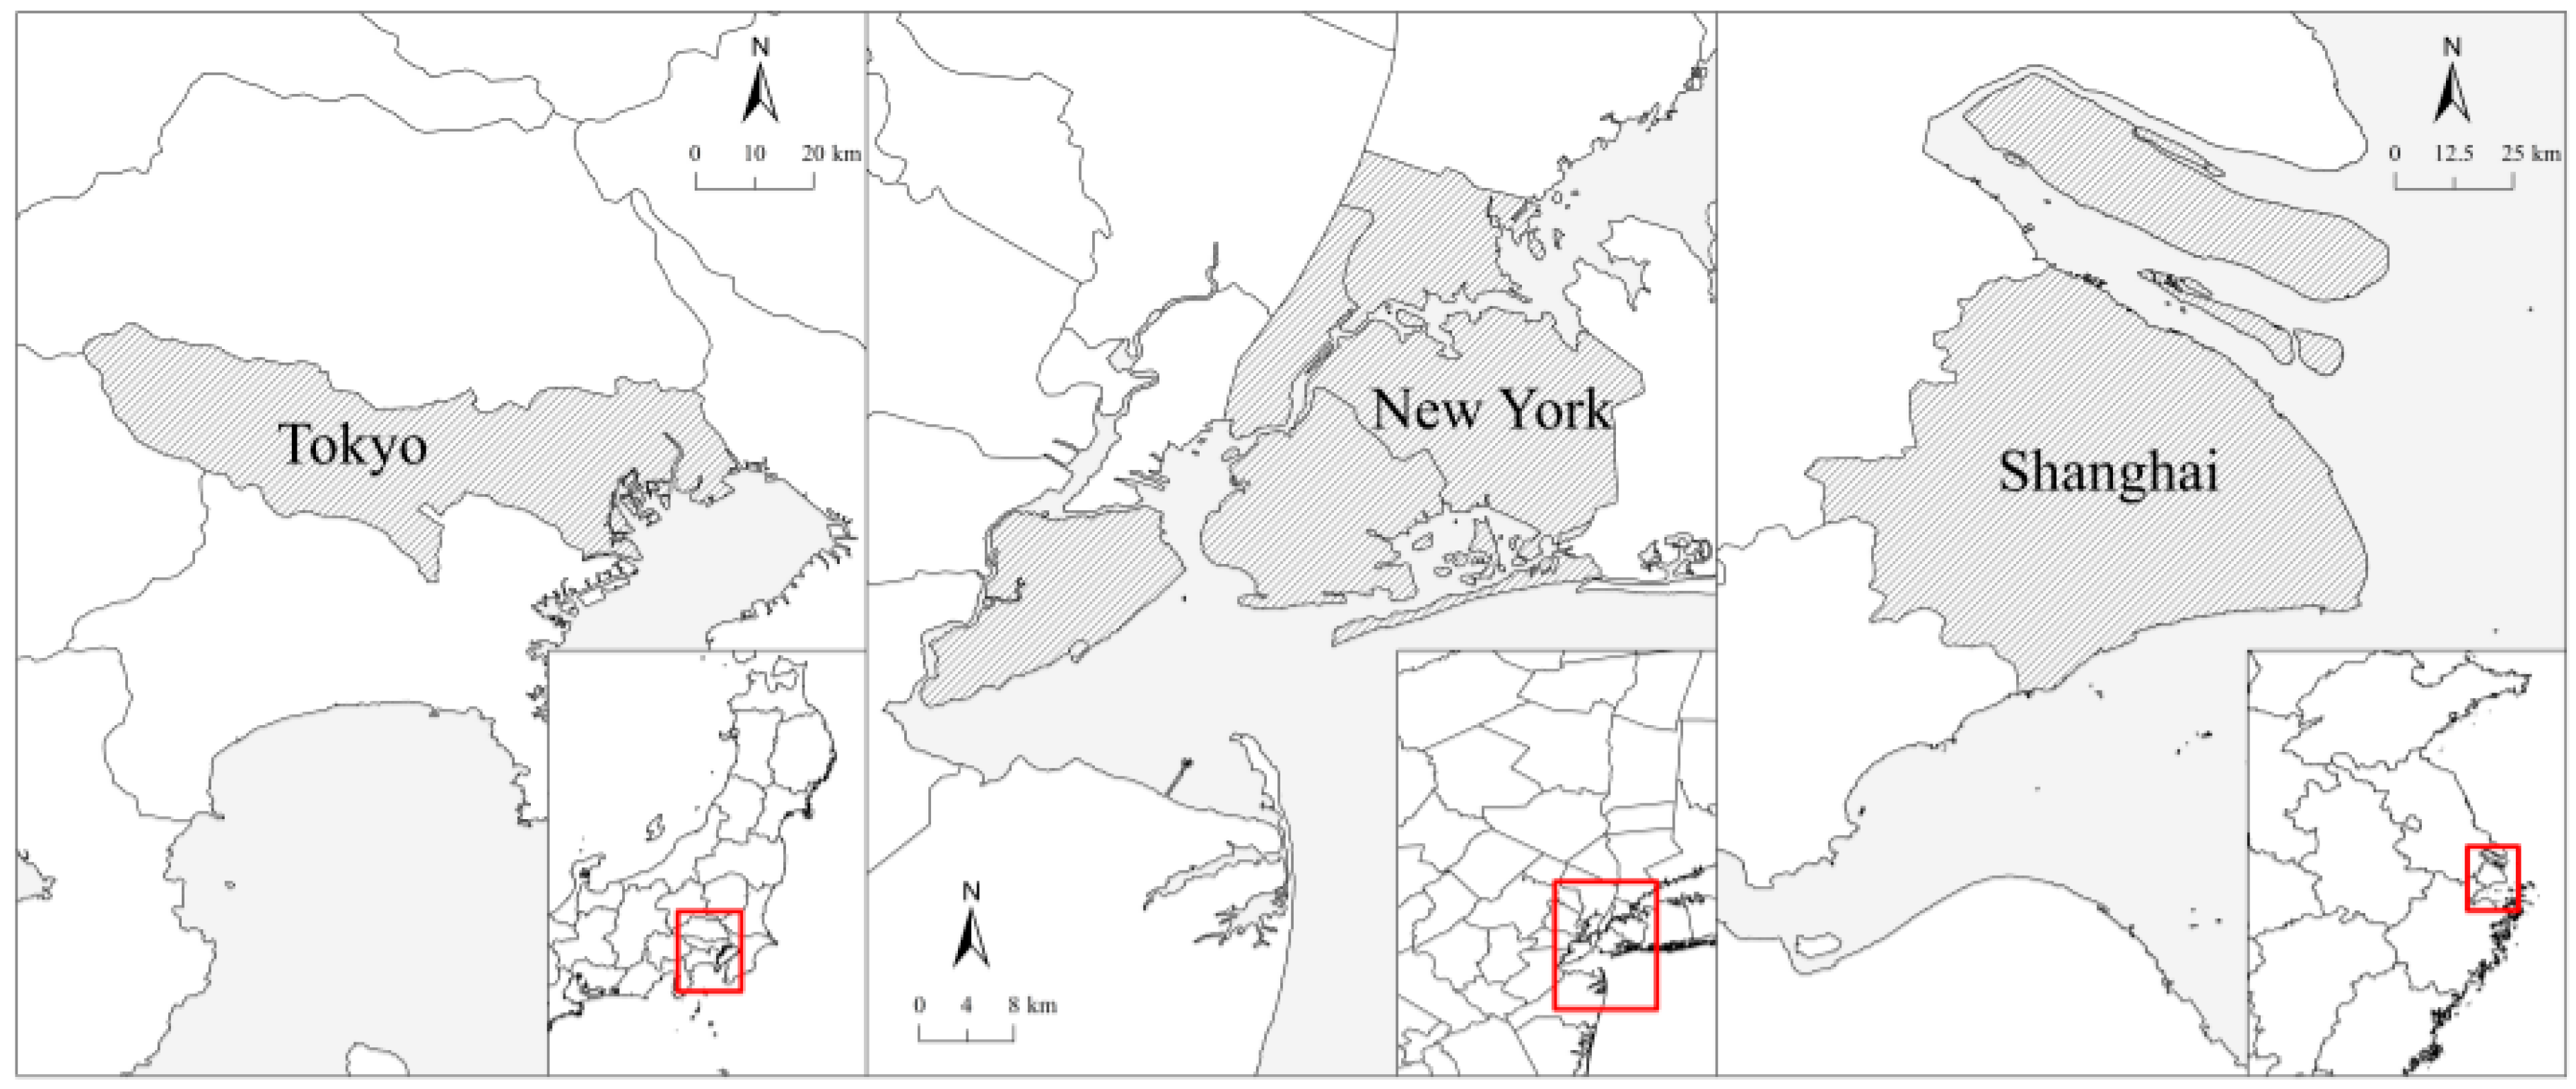
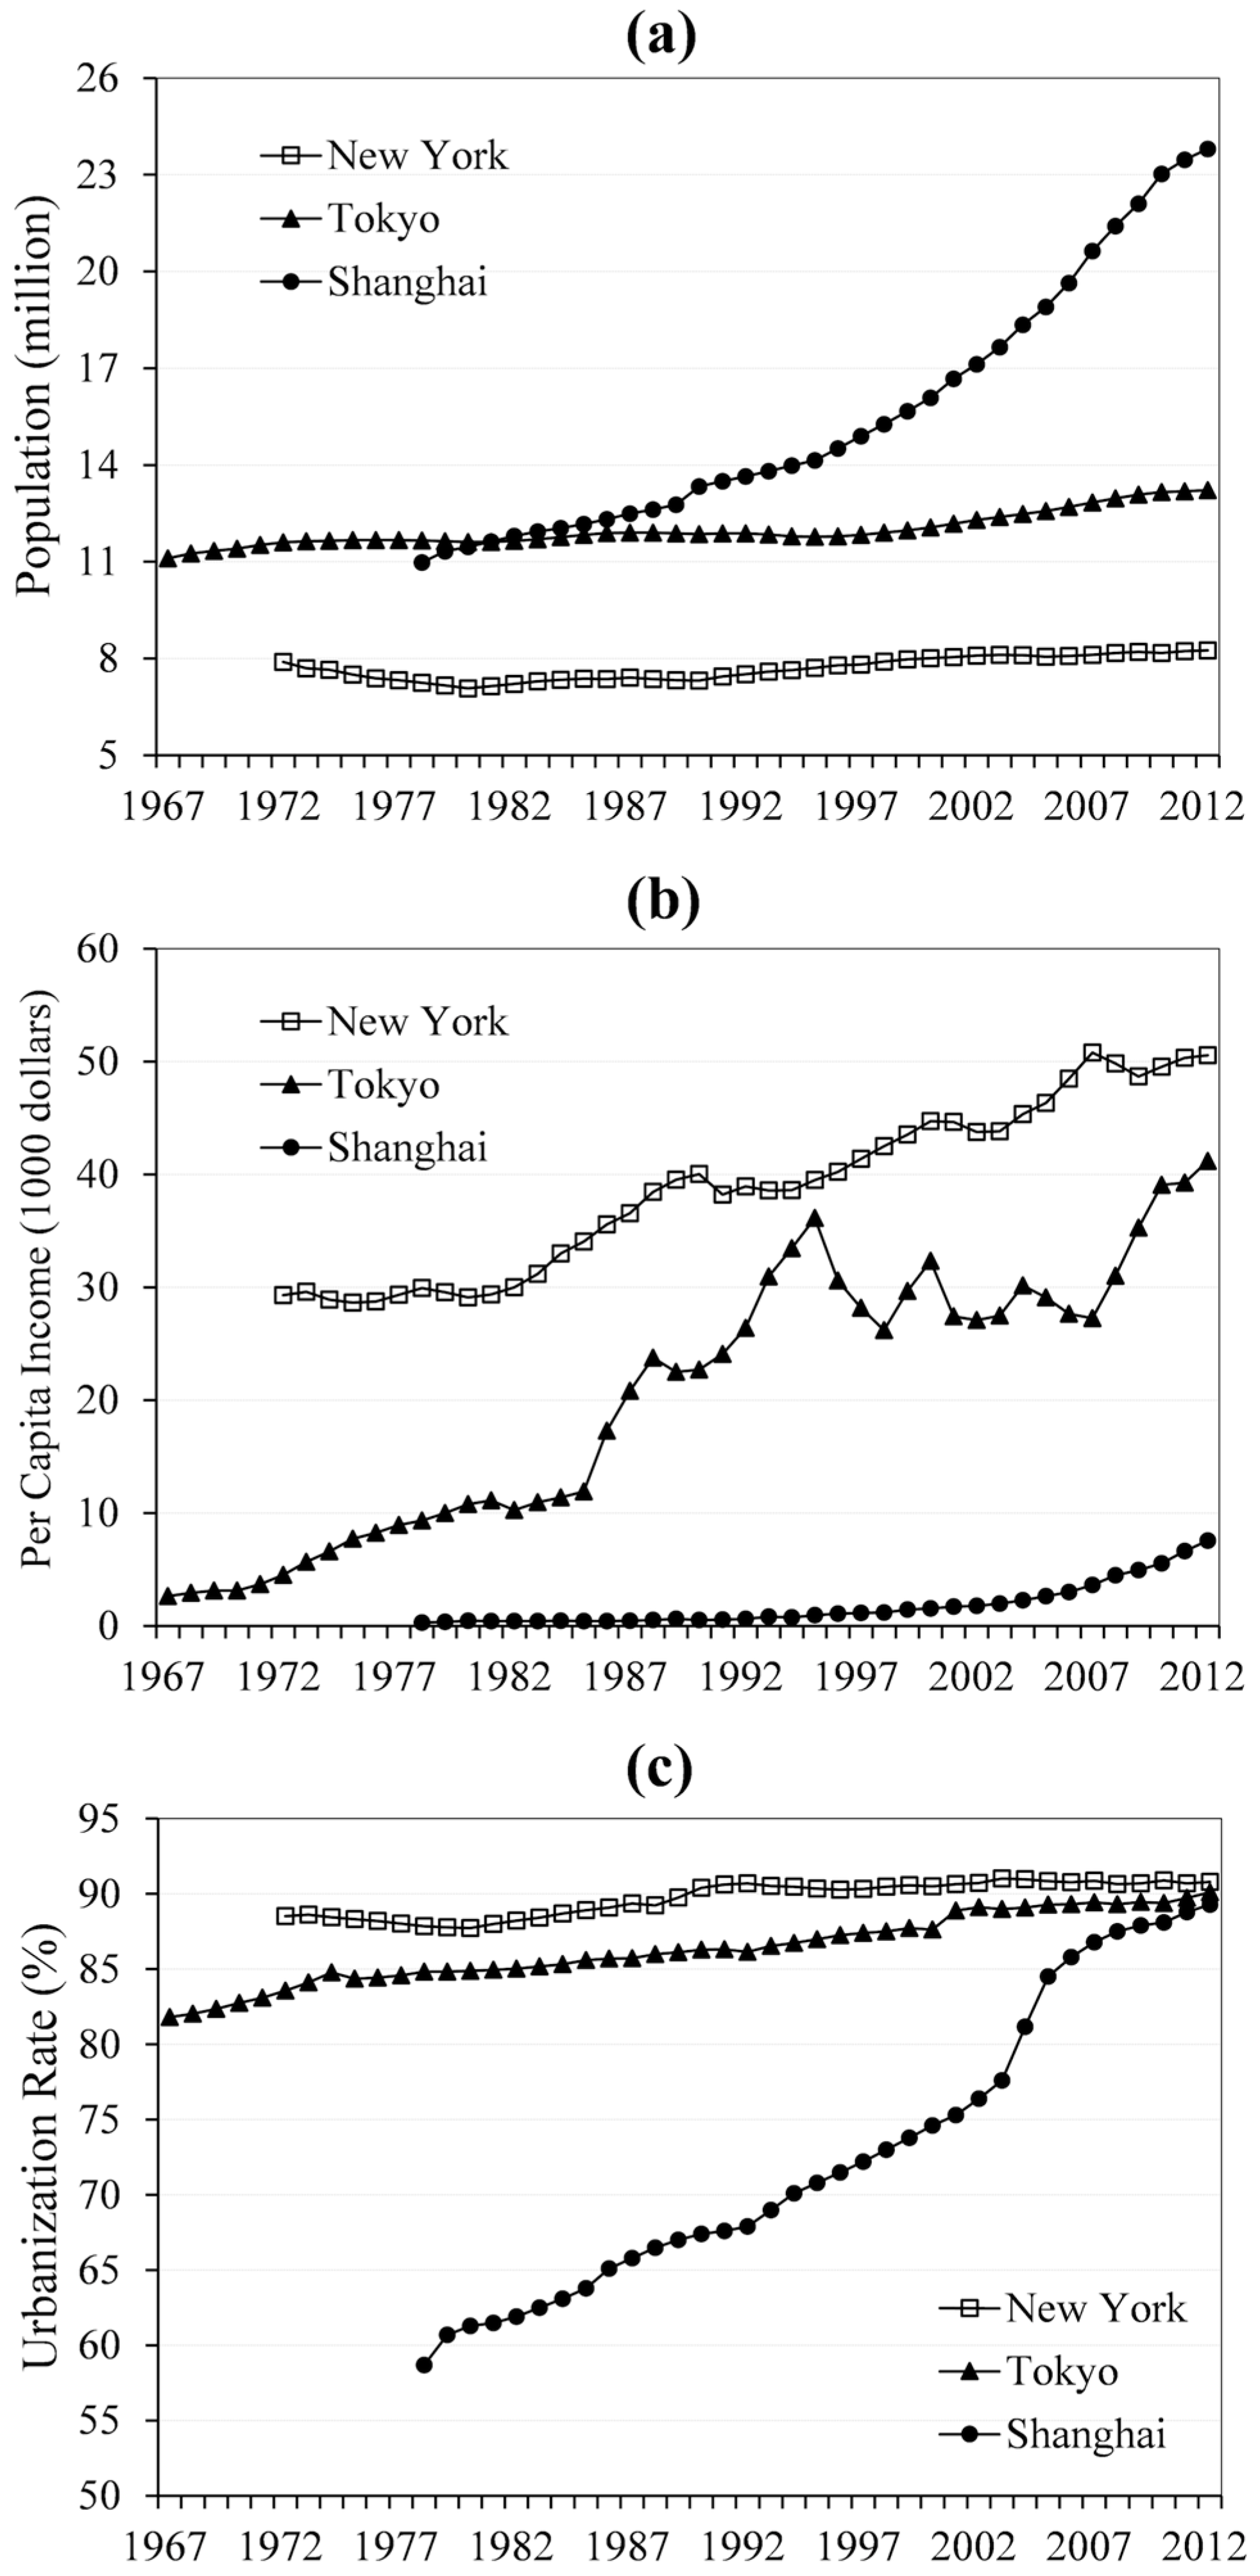
3. Case Study Cities and Data

New York, Tokyo and Shanghai are all important world centers of economy, finance, politics and trade [34]. As shown in Figure 1, Tokyo refers to the whole metropolitan area, including 23 special wards, 26 cities, 5 towns, and 8 villages. New York refers to the 5 boroughs: Manhattan, The Bronx, Brooklyn, Queens, and Staten Island. Shanghai includes 16 districts in their totality.
Figure 2 illustrates the long-term changes of population, per capita income, and urbanization rate, from which an overview of these case cities can be obtained. Generally, Shanghai has a much larger population, but a lower income and urbanization level than the other two cities. During the last decades, the total populations of Tokyo and New York remained stable at about 8 and 11 million, respectively. Accordingly, the urbanization rate, measured by the percentage of population living in cities, was also stable at around 90%. In contrast, Shanghai, as a typical Chinese city, has experienced rapid urbanization, with the urban population share increasing at an unprecedented speed of 1% per annum, especially after China’s economic reform in 1978, and is reaching the same level of New York and Tokyo. The population in Shanghai has also witnessed significant growth, with a large number of people flowing from those less-developed regions, such as the Sichuan and Guizhou provinces in the west and central areas of China. By the end of 2012, Shanghai’s population reached 24 million and has more than doubled since 1978. It is 1.3 times larger than the summation of New York and Tokyo’s total population. In terms of per capita income, New York is the wealthiest city, followed by Tokyo and Shanghai. Though the absolute amount of income level in New York and Tokyo was about 51 and 41 thousand US dollars respectively in 2012, a level much higher than that of Shanghai, the latter city demonstrated an astonishing rise in its income level, at an annual rate around 15%. In sum, New York and Tokyo are two highly developed and mature cities with their population and urbanization rate already stable during the last decades. Shanghai is still a young and rapidly growing city, with its population and urbanization rate increasing at an unprecedented speed over the last three decades.
All the three cities have set the improvement of livability as an important development goal in their long-term planning [35,36,37], and as one of the effective countermeasures to tackle the urban problems during their development. The high population pressure in the three cities not only calls for an increasing demand for various infrastructures but also requires the allocation of social services and resources in order to be more effective and efficient. Such a situation, together with other challenges they are facing such as environmental pollution, traffic jams, and high housing prices, make these three cities representative and suitable for livability analysis. Moreover, unlike already livable cities with less population pressure (such as Melbourne, Vienna, and Vancouver, which showed good performance in the latest livability ranking report by the EIU [20]), the three cities have greater potential to improve their livability, since their current rankings are 13, 56, and 82 for Tokyo, New York, and Shanghai, respectively. What can we learn from them could be set as benchmarks for other cities in the world that also aim to enhance their livability.
Basically, the livability in the last four decades is investigated because of data availability. For each city, the time range differs slightly. The ranges are: 1972–2012 for New York, 1967–2012 for Tokyo, and 1978–2012 for Shanghai. Since our main research objective is to find out whether a certain rule exists in long-term livability change, and not a comparison of livability across the three cities, the different study periods of the three cities will not affect our research objective. Data used for livability assessment is mainly compiled from officially published statistics. In detail, New York’s data is obtained from the United States Census Center (1972–2012), and New York Statistical Yearbook (1972–2012). Tokyo’s data is collected from the Statistical Yearbook of Japan (1967–2012), and Tokyo Metropolitan Statistical Yearbook (1967–2012). Shanghai’s data is taken from the Shanghai Statistical Yearbook (1978–2012), and Shanghai Local Chronicles (1978–2012).

4. Methods

As aforementioned, livability is defined and assessed by different studies, and as yet a consensus has not been reached [9,38]. Before conducting a quantitative analysis, it is necessary to firstly clarify the basic concept of livability, and then to establish an assessment model. Based on the review of previous studies [20,39,40], in this study the notion of livability is defined as how well or poorly a city could provide living conditions to its citizens. Accordingly, we pay more attention to the indicators that may directly reflect the primary impacts on people’s daily life and common challenges faced by cities in the world. Meanwhile, those indicators that may indirectly pose impacts on daily lifestyle, such as economic freedom and openness, are paid less attention. In this sense, the employed indicators may be basic but sufficient enough to reflect the livability.
A hierarchical framework for evaluating the livability is designed (Figure 3). Five major categories, including safety, health, convenience, amenity, and environment, as well as ten secondary indicators, are employed for evaluation. Here, the selected categories are mainly based on those employed by several well-known research institutions, such as the EIU, Monocle, and Mercer, who have conducted livability evaluations on a global scale, and whose results are widely accepted by scholars and policy-makers. The secondary indicators under each category are determined largely due to their representativeness, and the continuity, comparability and availability of data over a long time in the case study cities. Notably, the retained indicators in this study are those that can also be improved by the city authorities, and can reflect the city’s efforts to meet the development goals. Taking the indicator of “internet availability” as an example, since it is widely argued that the development of internet and information technology has been extensively altering our life style and changing the city’s political, economic, and cultural roles in the world development [41,42,43], many cities have given great priority to the research and development of telecommunication technology in their future planning, such as Tokyo, New York, Paris, and London [35,36,44]. Thus it is necessary to incorporate this indicator into the livability evaluation system in addition to those conventional indicators, such as roads and living space that are widely used in literature [25,30]. Moreover, it is noted that due to different statistical scopes and data availability, two indicators in New York (availability of public parks and living space) are replaced by others (availability of public recreational facilities and house ownership). The similar meaning and changing trends of the desired and actually employed indicators, and the relatively small weights of these two indicators in livability evaluation (10% for living space, and 15% for availability of public parks) mean the long-term changing trend of New York’s livability will not be affected.
The weight of each category and corresponding indicators is assigned by using the scores defined by the EIU (2016) [20] as a basis, and is then adjusted through the rating of experts from economic, social and environmental disciplines. A total of 75 experts were consulted, and their rated scores were transformed into weights by using the Analytical Hierarchy Process (AHP) method, which was proposed by Saaty (2012) [45] and acknowledged as a widely employed decision support method. The detailed procedures of the AHP method for measuring the weights are presented below.

4.1. AHP Method

The AHP is a decision support method that considers both qualitative and quantitative information. Generally, it has three basic calculation steps: (1) determining the importance of each criterion and establishing a comparison matrix; and (2) calculating the weight coefficient vector; (3) examining the validity of the weight coefficient vector.
In Step 1, in order to determine the importance of each criterion, a comparison matrix A should be established as that in Equation (1).
A = [ 1 a 12 a 1 n a 21 1 a 2 n a n 1 a n 2 1 ]
where aij denotes the relative importance of criteria i as compared to j, which is decided according to Table 2. For instance, if we assume that criterion i is twice as important as j, then obviously, we can draw a conclusion that criteria j is as half important as i. Therefore, the relative importance of criteria j comparing to i can be calculated by Equation (2).
a j i = 1 a i j ,   a j i > 0 ,   i , j = 1 ,   2 ,   , n
In Step 2, the weight coefficients of each indicator can be acquired by calculating the principal eigenvector of it (as shown in Equation (3)). The detailed explanations of why the principal eigenvector can be regarded as the weight coefficients vector can be found in Saaty (2003) [46].
[ 1 a 12 a 1 n a 21 1 a 2 n a n 1 a n 2 1 ] | w 1 w 2 w n | = λ m a x | w 1 w 2 w n |
where (w1, w2, …, wn)T is the maximal eigenvector of matrix A, and λmax is the maximal eigenvalue of matrix A. The maximal eigenvector and maximal eigenvalue can be calculated in the form as shown in Equation (4) by the tool box of MATLAB when the comparison matrix A have been determined,
[ W m a x , λ m a x ] = e i g ( A )
where Wmax and λmax are the maximal eigenvalue and maximal eigenvector of the comparison matrix, respectively.
Then, the weight coefficient vector can be calculated by normalizing the maximal eigenvector (Equation (5)).
W = ( w 1 i = 1 n w i ,   w 2 i = 1 n w i ,   ,   w n i = 1 n w i ) T
where W is the weight coefficient vector, wi represents the weight of indicator i, and n represents the total number of the indicators.
In Step 3, as proven by Saaty [46], the weight coefficient vector has much less validity for an arbitrary positive reciprocal matrix than for a consistent and a nearly consistent matrix. Therefore, to obtain more precise results, it is necessary to verify the consistency of matrix A. It is defined that if aik = aijajk, i, j, k = 1, 2, …, n, then the comparison matrix A can be recognized as consistent matrix. Theory proves that if an n-dimensional comparison matrix is a consistent matrix, its maximal eigenvalue must be n. However, it is difficult to establish a comparison matrix, which is an absolutely consistent matrix. Usually, if the comparison matrix meets the condition of consistency check, it can be recognized as a consistent matrix. The consistency ratio is a common method used to judge whether a comparison matrix is consistent or not, as shown in Equation (6).
C R = C I R I
where CR is the consistency ratio; CI is the consistency index, which is calculated by Equation (7), and RI is the average random index with the same dimension with A, which can be acquired in Table 3.
C I = λ m a x n n 1
where λmax represents the maximal eigenvalue of the comparison matrix A, and n represents the dimension of the matrix.
If CR < 0.1, the matrix can be accepted as consistent matrix. Contrarily, if CR ≥ 0.1, the matrix should be modified until it is acceptable.

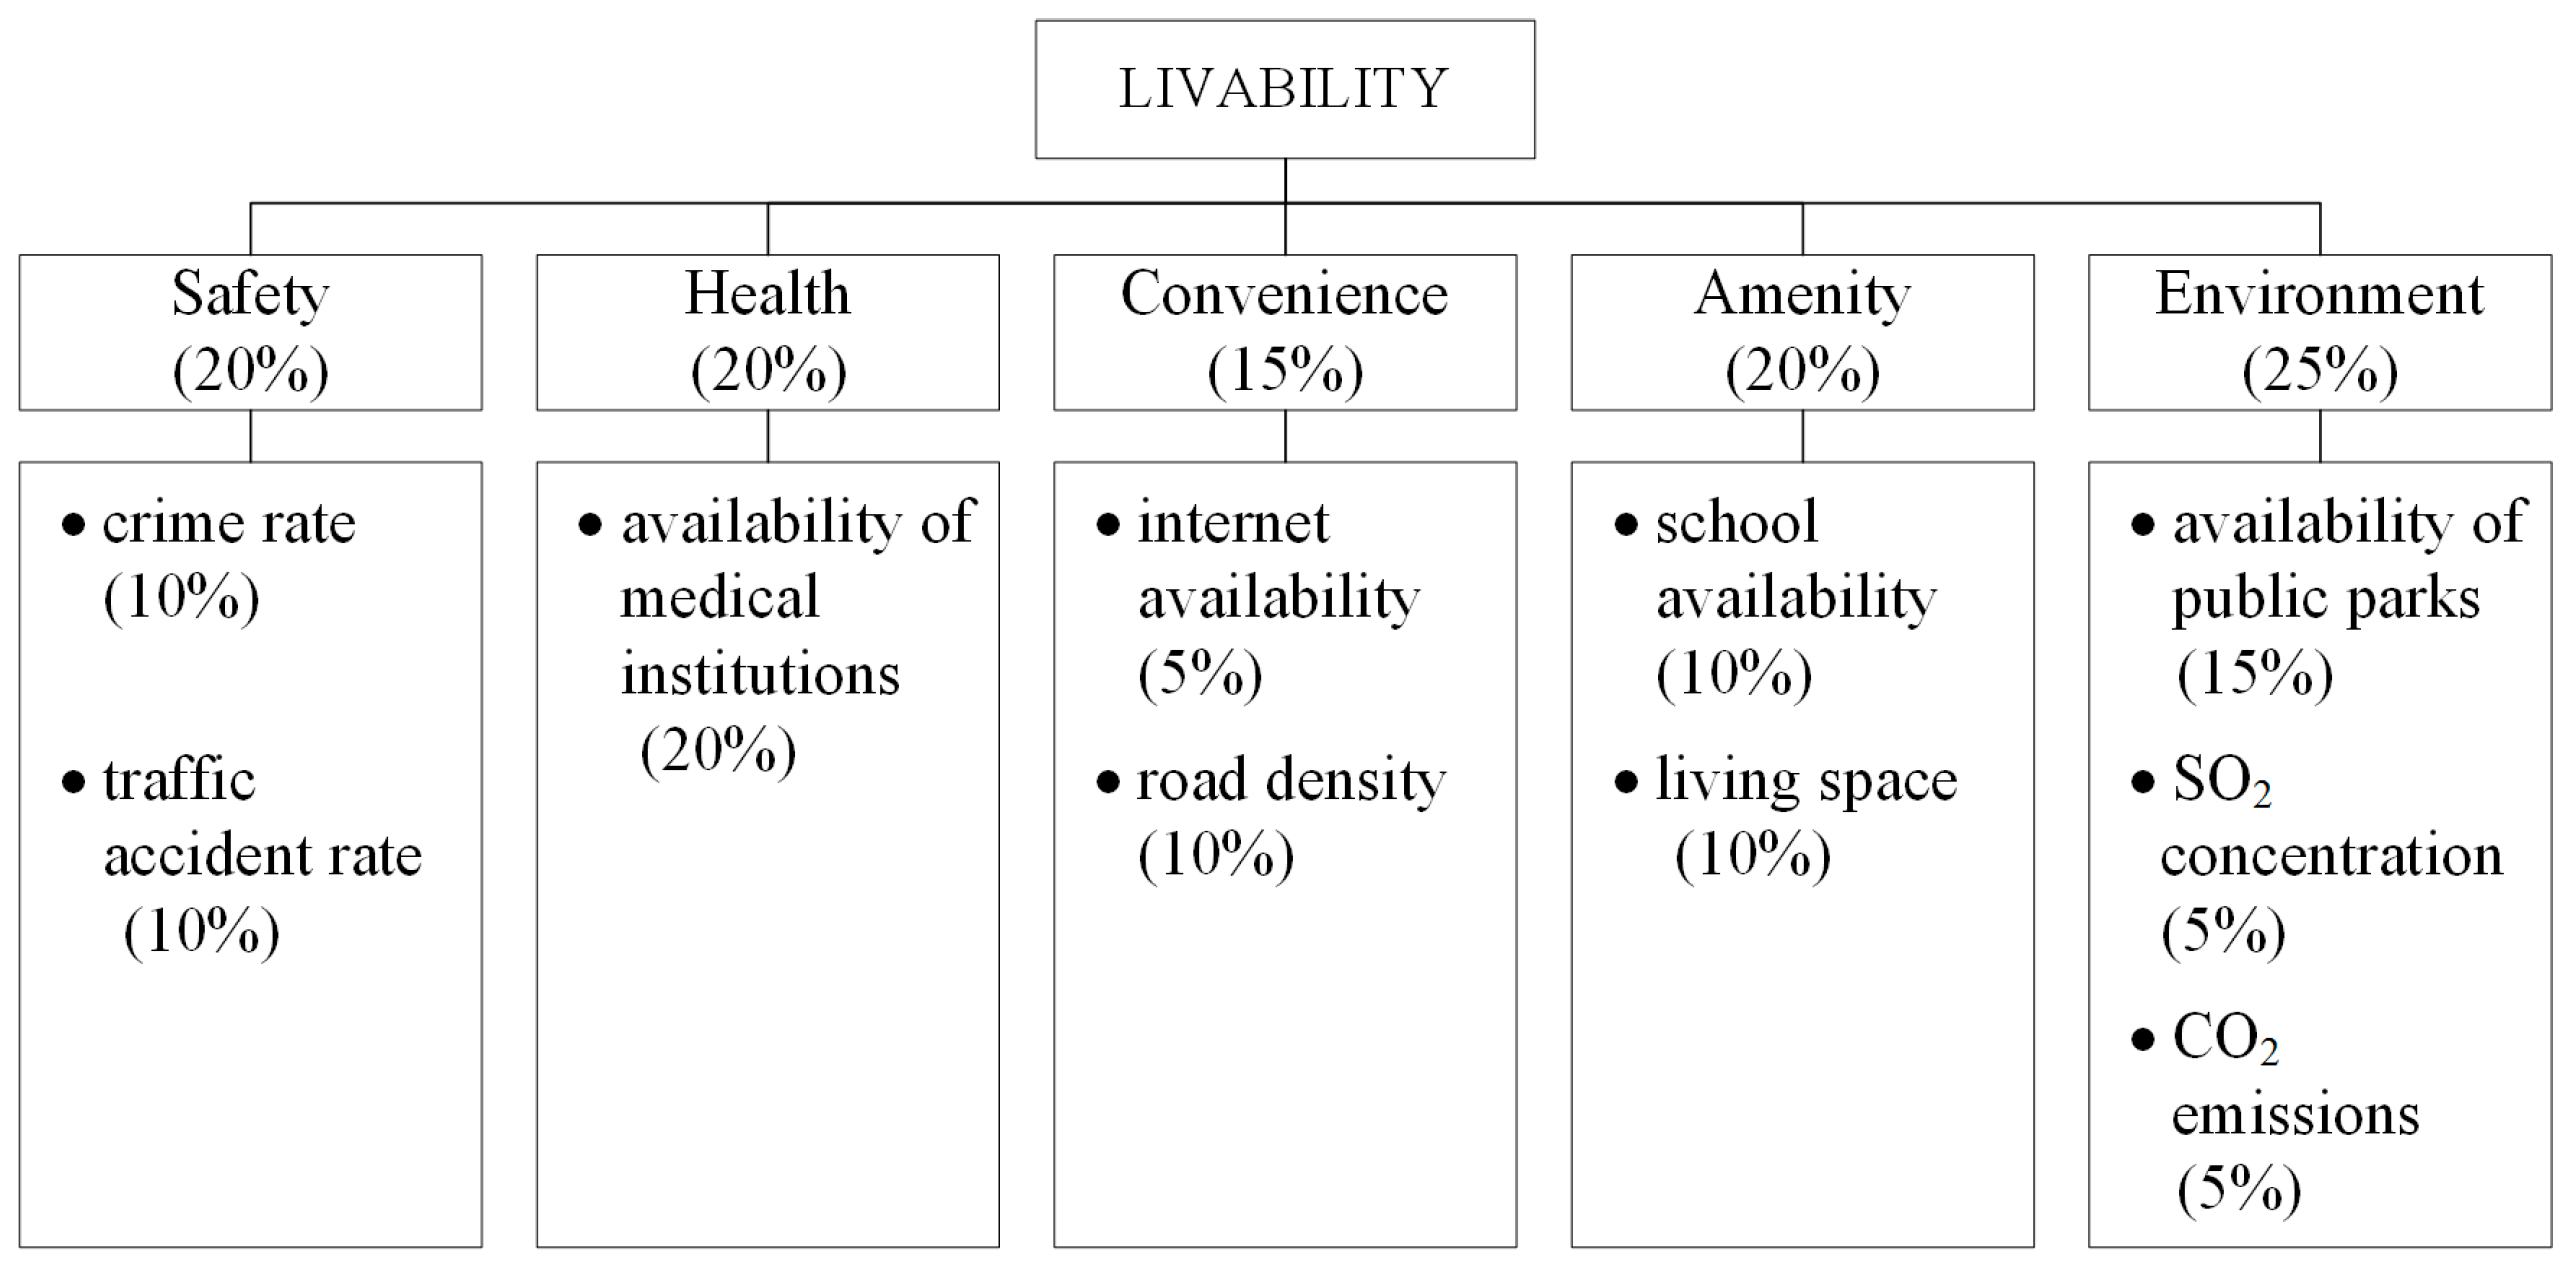
4.2. Measurement of Livability

Due to the great differences in the magnitude and unit of indicators, normalization (as shown in Equations (8) and (9)) needs to be performed firstly in order to eliminate the differences among data sources, and to reveal the relative changes of indicators in each city.
Y i = ( X i X m i n ) / ( X m a x X m i n )
Y i = ( X m a x X i ) / ( X m a x X m i n )
where Yi is the normalized value of indicator i; Xi is the original value of indicator i; and Xmax and Xmin are the maximum and minimum values of indicator i within the study period, respectively. If Xi is an indicator with positive contribution to livability, Equation (8) is used for normalization. On the contrary, Equation (9) should be employed.
All the normalized indicators are aggregated to an overall livability according to their weights in each year as illustrated in Equation (10).
L t = i = 1 n W i Y i
where Lt is the overall livability in year t; Wi is the weight of indicator Yi.

5. Results and Discussion

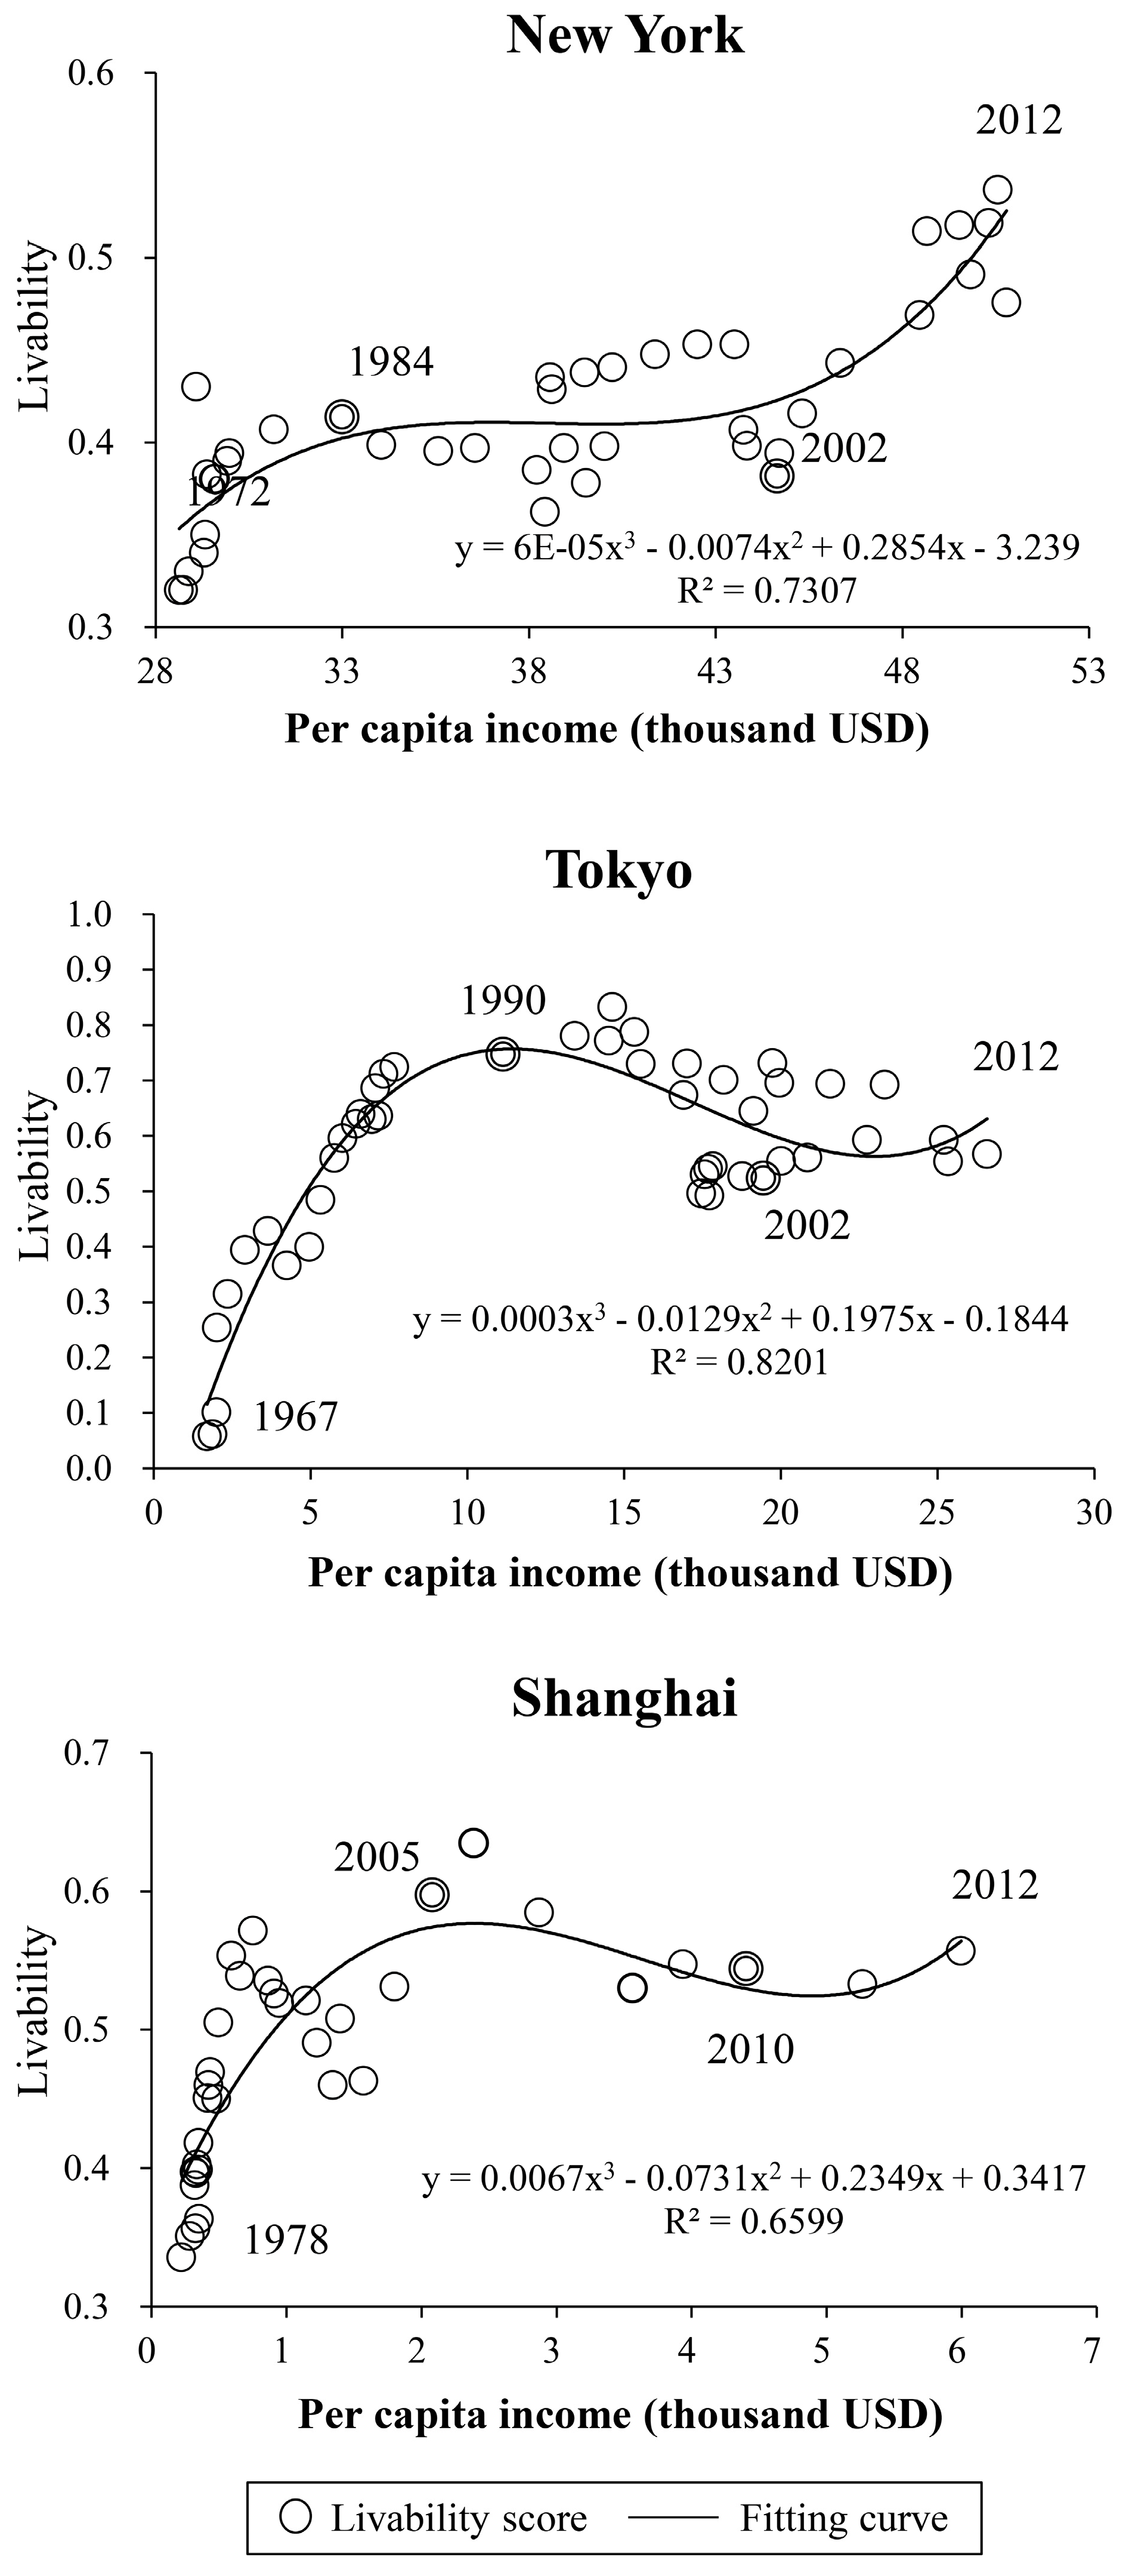
5.1. The Variation Trend of Livability

To answer the first question of whether there is a universal rule in the long-term change of livability, we map the livability change along with the development of per capita income for the three cities respectively. As shown in Figure 4, it is interesting to find that livability of all the three cities has been experiencing an N-curve development with their scores increasing at the beginning, then declining during the middle period, and rebounding afterward. The R2 of the fitting curves are all relatively high, ranging from 0.66 to 0.82, which ascertains a significant correlation between livability and income level.
Though a similar changing pattern was detected in all the case study cities, the level of livability and the characteristics of their three-staged development were quite different. Specifically, the livability of New York and Tokyo went up to the first peak when their per capita income reached USD (United States dollar) 33,000 and USD 10,000, respectively, while Shanghai witnessed its first turning point much earlier when the per capita income grew to USD 2500 Concerning the decline of livability, it lasted for 17 years for New York, 13 years for Tokyo, and 5 years for Shanghai. During this period, the livability of Tokyo dropped most significantly from 0.8 to 0.5, while it just slightly decreased for New York and Shanghai. In the third period, when the per capita income rose beyond a certain level (that is, USD 44,000 for New York, USD 18,000 for Tokyo, and USD 6000 for Shanghai), the livability stopped declining and has recovered since then. The fastest growth of livability was found in New York, whose score recovered from 0.40 to 0.53 at an annual rate of 3%. Both Tokyo and Shanghai witnessed a mild rebound of livability with their scores increased at an annual rate of 1.6% for Tokyo and 1.1% for Shanghai.

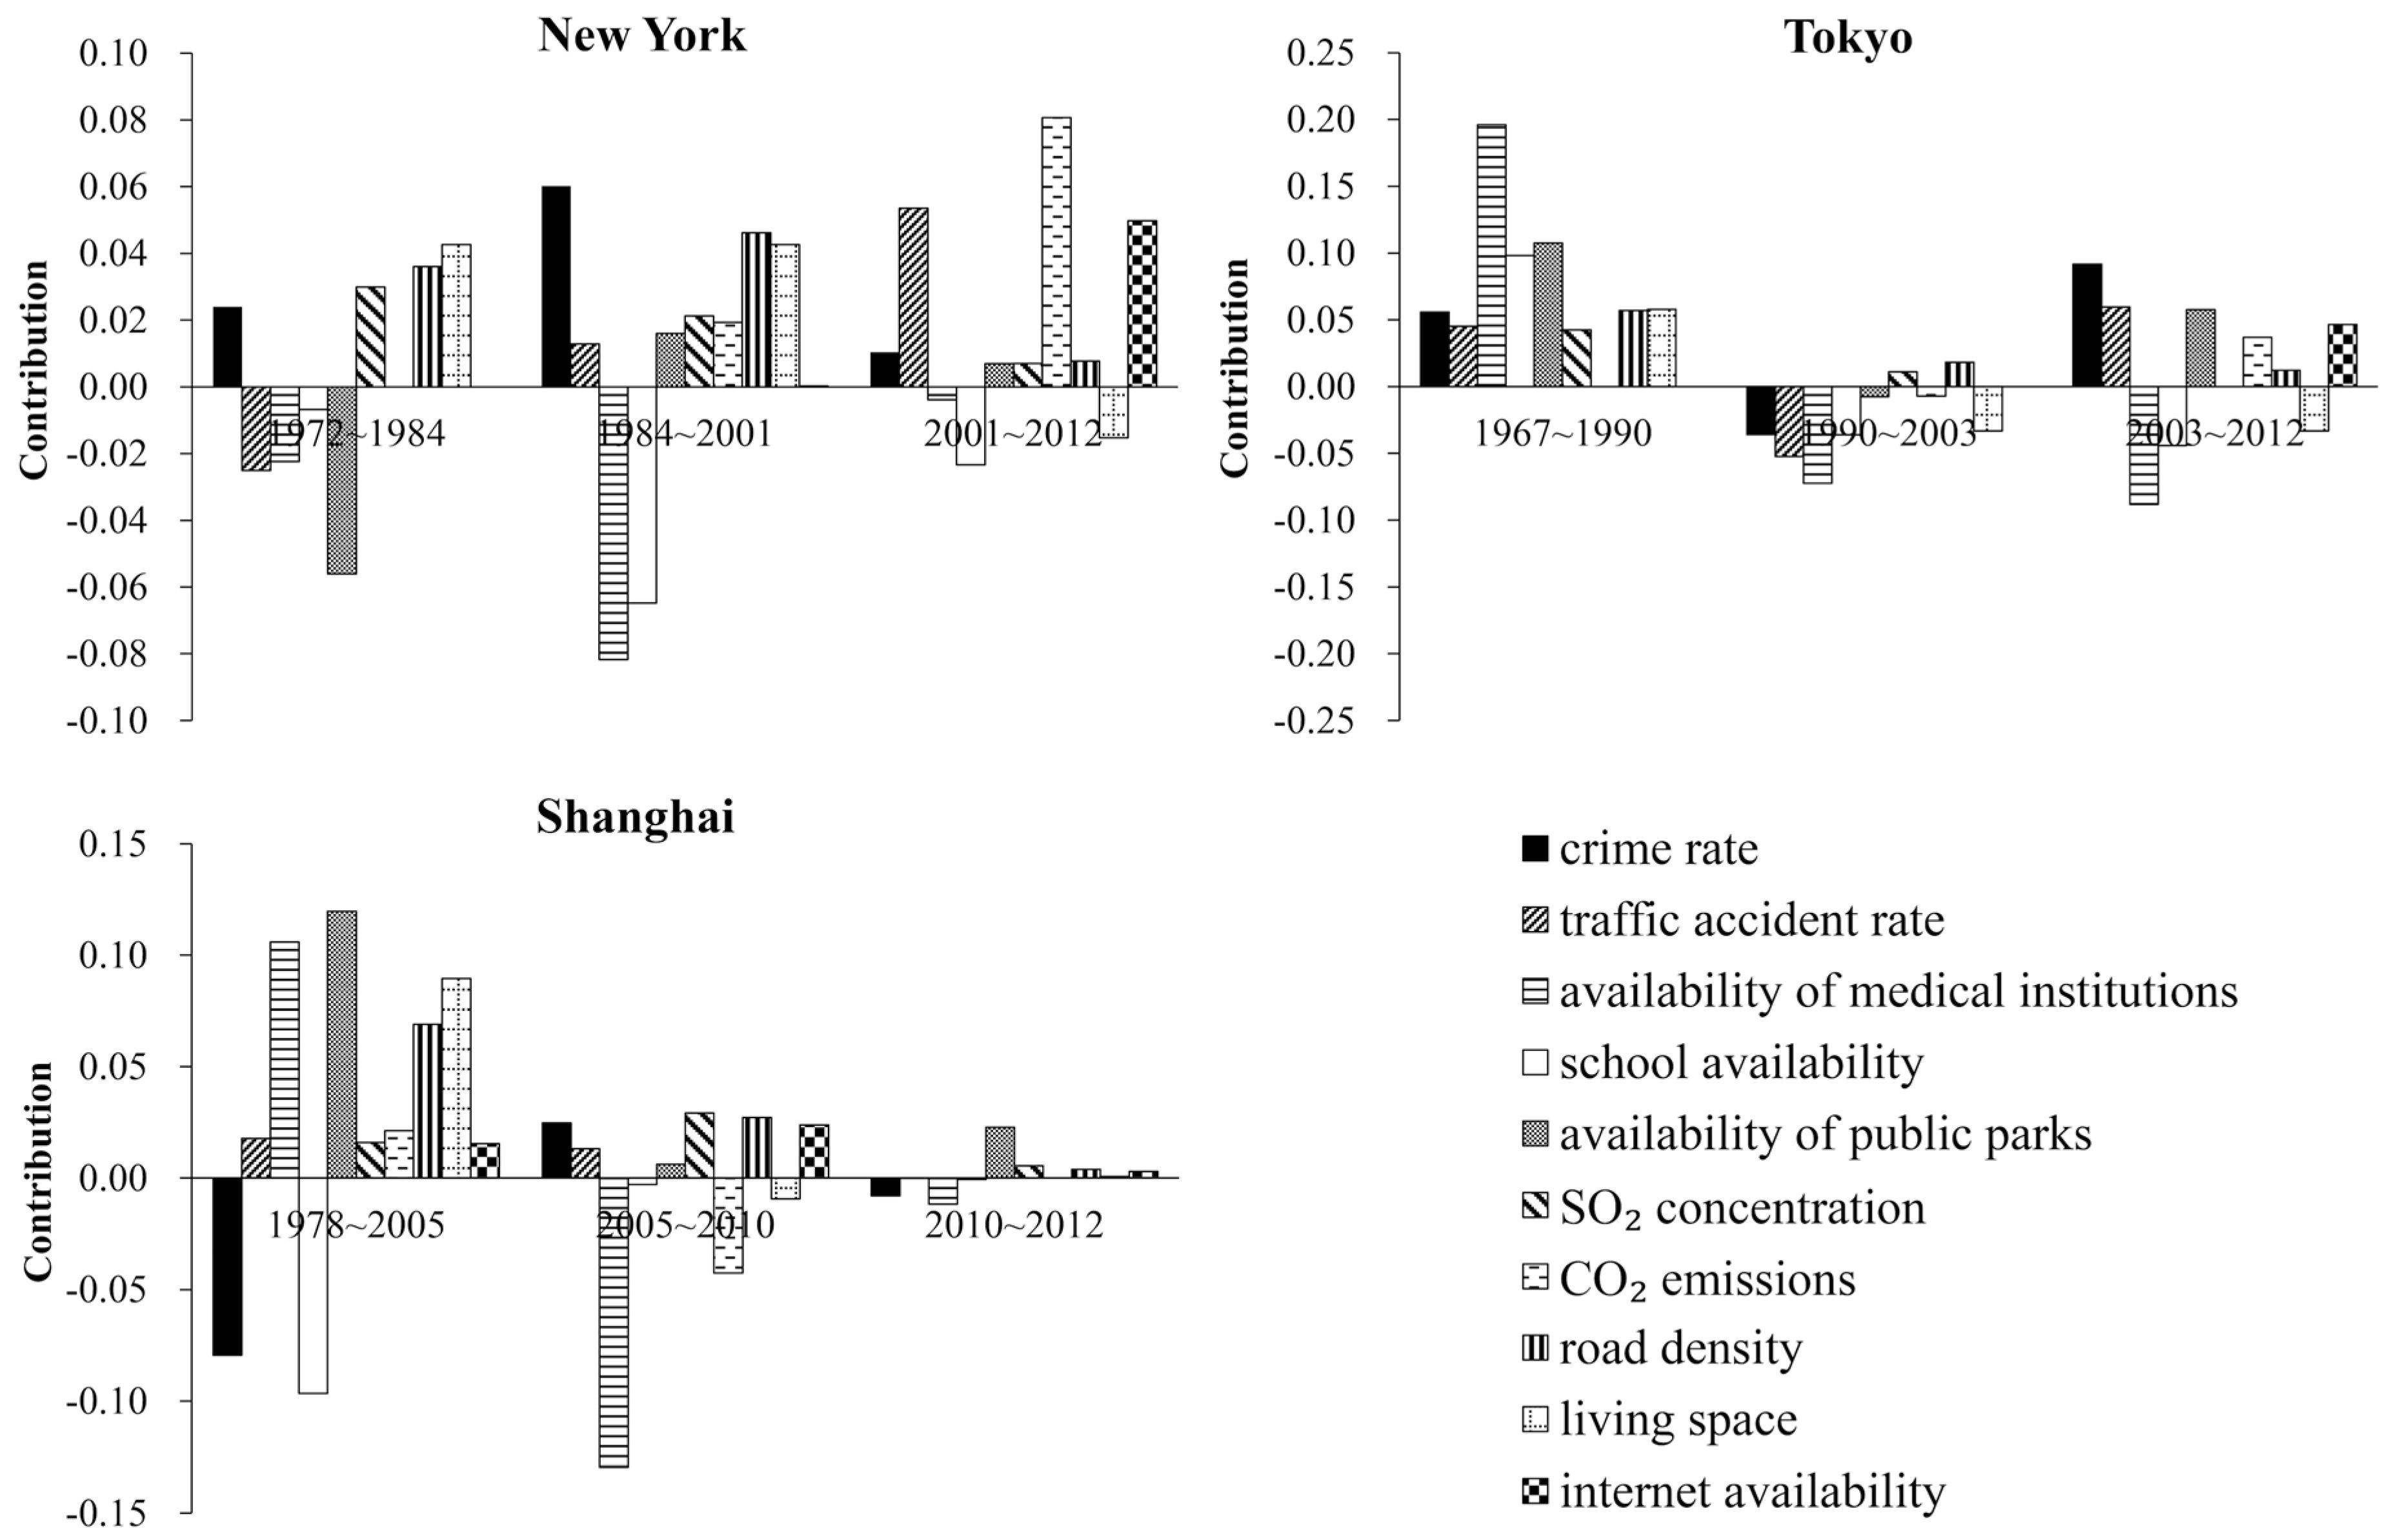
5.2. Factor Decomposition Analysis of Livability Change

To find out the dominant factors that shape the changing pattern of livability in the last four decades so that effective policy implications could be derived, we decomposed the change in each period, and illustrate the results in Figure 5.
In New York’s case, the key factors changed over time. The slow growth period from 1972 to 1984 was known as a period of social and economic turmoil where medical treatment, education and social services were not adequately provided to citizens [47]. Such a situation undoubtedly resulted in a decrease in the number medical institutions and schools, as well as a decrease in public park availability. However, other factors, which may not be largely influenced by the turmoil, such as SO2 concentration, CO2 emission, road density and living spaces, strongly offset the negative effects of those contributors above and turned the situation around. This may be the main reason why the overall livability gradually went up during this period. Then, in the period of slight decline from 1984 to 2001, though the social security and environment (such as the crime and traffic accident rate, SO2 concentration and CO2 emissions) showed some improvement due to the recovery of the socio-economic situation in the last decade, the disadvantages in terms of the total number and availability of medical institutions and schools still slightly drew livability back. Finally, in the steady regrowth period from 2001 to 2012, internet development, together with the decrease in the traffic accident rate and CO2 emissions, resulted in an increase in overall livability. However, in this situation New York still faced problems in terms of a lack of medical institutions and schools. In short, improving healthcare and educational conditions, sustaining the urban safety, and reducing carbon emissions continuously will be essential to further improve New York’s livability.
In Tokyo’s case, the fluctuation of livability was greater than for the other two cities. During the first stage from 1967 to 1990, the fast improvement of healthcare and amenity made the most important contribution to the rapid rise of livability. Then, in the gradual decline period from 1990 to 2003, the housing prices in Tokyo took a nose-dive and caused the collapse of housing market. Economic downturns and social unrest, in the wake of the burst of housing bubble, thus dragged livability down [48]. During this period, high crime and traffic accident rates, poor conditions in terms of medical treatment, education and social services, and poor living standards turned out to be the responsible factors. However, from 2003 to 2012, the substantial improvement of urban safety and rapid development of telecommunication environment started to turn this situation around, which allowed the recovery of the city’s livability. Thus, for Tokyo, improving urban safety, strengthening healthcare and amenity would be the most important factors for constructing a livable city.
As a rapidly urbanizing city, the extensive construction of parks, residential buildings, and medical facilities since China’s economic reform in 1978 to 2005 have played a dominant role in contributing to the rise of livability in Shanghai. However, the decrease of healthcare facility’s availability and park area, together with an increase of CO2 emissions, worsened the livability from 2005 to 2010, though the SO2 pollution and urban crime were well controlled. In the recent years from 2010 to 2012, taking the opportunity of hosting the World Expo 2010, Shanghai government paid strong attention to the urban infrastructure development and environmental improvement. As a result, the increasing investment in parks and telecommunication, combined with further treatment of SO2 pollution strongly led to the growth of livability. Thus for Shanghai, developing healthcare facilities and constructing more parks should be given priority in the future development toward livability.

5.3. Discussion

In addition to revealing the city-specific priorities in livability construction (as described in the factor decomposition analysis), some common implications can be derived from the widely existing challenges in the three cities, which can help policy-makers designing new or adjusting current strategies toward livability.
First, the level of amenities and healthcare should be maintained to a reasonable standard. According to the cask theory, whereby the capacity of a cask is dependent on the shortest wood plate, the availability of medical and educational institutions under the health and amenities categories, respectively, can be regarded as the shortest wood plate in all the three cities, and there is an urgent need for improvement. The decrease in the amenity and health levels was usually caused by the more rapid growth of the urban population than of infrastructures. Thus, at the same time, constructing more infrastructure to control the urban population within a reasonable scale is also important. In the future (until 2050), over 67% of the world population will reside in urbanized areas, and most of the net increase in urban residents is expected to occur in the urbanized regions of emerging economies and developing countries, such as China, India, Mexico, and Brazil [49]. Instead of blocking people out of mega cities, developing urban clusters and encouraging the movement of a certain proportion of population to those adjacent cities would be helpful to improving the livability of the whole region.
Second, the governance of the environment is indispensable, since it is the premise for realizing livability. In addition to the control of local pollutants such as SO2, wastewater, and solid waste, greater attention should be also paid to the reduction of carbon emissions because (1) CO2 emissions have profound impacts on global ecosystem and environmental justice [50]; (2) CO2 emissions in all the case study cities are huge and still increasing rapidly [51,52]; and (3) CO2 mitigation is a common task for all the cities in the world as cities have contributed to over 70% of global carbon emissions [53]. Due to the important role that cities play in global environment, many cities have set explicit targets to reduce carbon emissions in their future planning, for example, New York has planned to reduce carbon emissions by 30% by 2030, as compared to the level in 2005 [34]. Tokyo has set a target of 25% reduction by 2025, relative to 1990 [33]. Moreover, as has been pointed out by many studies, the efforts made to reduce CO2 emissions will simultaneously reduce many other air pollutants such as PM10 (particles on the order of 10 micrometers or less), SO2 and NO2 [54]. Thus, the transition toward a low-carbon city can mitigate the impacts on both the local and the global environment, and should be given priority in the future city planning and development.
The case studies based on three cities could be regarded as a supplement to the knowledge on livability. There are also several potential improvements that can be pursued in the future studies. First, due to the availability of data in the officially published statistical yearbooks, only ten indicators under the five most important categories of livability were considered in this study. Results would be more accurate if more indicators regarding some common urban problems and future trends, such as air and water pollution, traffic congestion, unemployment rates, technological innovations (especially the emerging concept of smart cities), and environmental justice, could be added to the assessment framework. Although these long-term data are not always easily available, it may be possible to obtain such information through other sources, such as specialized research reports, papers, dissertations, and surveys on relevant administrative departments. Second, the N-curve development rule of livability would be more convincing if our livability assessment method could be applied to more case cities covering developed and developing countries. Third, if the policy-makers could include the long-term livability evaluation before and after their decision-making process, they could not only identify the priorities in the livability construction, but also make proper adjustments to their decisions in a timely manner. Nevertheless, though our policy implications might be helpful for strategic planning, especially in identifying the most urgently needed and underlying aspects of livability, how to proceed in practice needs extra efforts. Mere academic research is not enough. Field surveys and interviews of various stakeholders, such as local residents, enterprises, city planners, and government officers, are strongly needed to make the general policy suggestions effective and practical.

6. Conclusions

Probing into the question of whether a certain rule exists in the long-term change of city’s livability can deepen our understanding of the changing patterns and major driving factors of livability. More importantly, proper policies can be designed or adjusted to forward the livable city transformation. We have developed a hierarchical indicator system for the assessment of a city’s livability by considering the most important factors that have substantial influence on livability and taking the continuity, comparability and availability of data into account.
By applying the proposed method to three cities in the world including New York, Tokyo, and Shanghai, the case study reveals that a common N-curve development rule of livability does exist in all the three cities. During the last decades with the income level enhanced, livability experienced a three-staged development processes with its value increasing at the beginning, then declining during the middle stage, and rebounding afterward. However, the characteristics and dominant factors that affect the livability vary among cities, which suggests that city-specific priorities must be established for city planners and policy-makers to allocate resources, so as to maximize the overall livability. This implies improving healthcare and educational conditions, sustaining urban safety, and reducing carbon emissions for New York; improving urban safety and strengthening healthcare and amenities for Tokyo; and developing healthcare facilities and constructing more parks for Shanghai. The common policy implications for not only the case cities but also the other cities in the world lie in two aspects. One is control of the scale of a city’s population through the development of urban clusters, for which the per capita level of healthcare and amenities could be maintained on a reasonable level, and the livability of the whole region would be raised. Another is strengthening environmental governance, with a special focus on the development of a low-carbon city, for which both the local and global environmental impacts could be mitigated.

Acknowledgments

This research was supported by the National Key R&D Program of China [grant number 2017YFC0505703]; the Shanghai Philosophy and Social Sciences Planning Project [grant number 2014BCK001], the National Natural Science Foundation of China [grant number 41401638], and the China Ministry of Education’s Humanities and Social Sciences Project [grant number 14YJAZH028].

Author Contributions

Jiabin Liu: collected the data, performed calculations, analyzed the results, and drafted the paper. Ji Han: designed and improved the research, and drafted and revised the paper.

Conflicts of Interest

The authors declare no conflict of interest.

References

  1. World Bank. Putting People First: Sociological Variables in Rural Development; Oxford University Press: Oxford, UK, 1985. [Google Scholar]
  2. Turner, J. Human Institutions: A Theory of Societal Evolution; Rowman & Littlefield: Lanham, MD, USA, 2003. [Google Scholar]
  3. The World Bank. Social Development: Putting People First. Available online: http://siteresources.worldbank.org/INTRANETSOCIALDEVELOPMENT/Resources/SDN_Results_Social_Development.pdf (accessed on 29 July 2017).
  4. Jones, L.L. Benchmarking the Future World of Cities. Available online: http://www.jll.com/Research/jll-business-of-cities-report-april-2016.pdf (accessed on 4 September 2017).
  5. Marsal-Llacuna, M.L.; Colomer-Llinàs, J.; Meléndez-Frigola, J. Lessons in urban monitoring taken from sustainable and livable cities to better address the smart cities initiative. Technol. Forecast. Soc. 2015, 90, 611–622. [Google Scholar] [CrossRef]
  6. Bibri, S.E.; Krogstie, J. Smart sustainable cities of the future: An extensive interdisciplinary literature review. Sustain. Cities Soc. 2017, 31, 183–212. [Google Scholar] [CrossRef]
  7. Wheeler, S.M. Planning for Sustainability: Creating Livable, Equitable and Ecological Communities; Routledge: London, UK, 2013. [Google Scholar]
  8. Lee, J.H.; Hancock, M.G.; Hu, M.C. Towards an effective framework for building smart cities: Lessons from Seoul and San Francisco. Technol. Forecast. Soc. 2014, 89, 80–99. [Google Scholar] [CrossRef]
  9. Wei, Y.G.; Huang, C.; Lam, P.T.I.; Yuan, Z. Sustainable urban development: A review on urban carrying capacity assessment. Habitat Int. 2015, 46, 64–71. [Google Scholar] [CrossRef]
  10. Chourabi, H.; Nam, T.; Walker, S.; Gilgarcia, J.R.; Mellouli, S.; Nahon, K.; Pardo, T.A.; Scholl, H.J. Understanding Smart Cities: An Integrative Framework. In Proceedings of the 45th Hawaii International Conference on System Science, Maui, HI, USA, 4–7 January 2012. [Google Scholar]
  11. UN-Habitat. State of the World’s Cities 2010/11: Cities for All: Bridging the Urban Divide; Routledge: London, UK, 2010. [Google Scholar]
  12. Rengasamy, S. Understanding Urbanization and Urban Community Development. Available online: http://zh.scribd.com/doc/21976896/Understanding-UrbanizationUrban-Community-Development (accessed on 1 June 2015).
  13. Manning, W. Urban environment: Recognizing that pollution and social factors can create barriers to development of more healthy and livable cities. Environ. Pollut. 2013, 183, 1. [Google Scholar] [CrossRef] [PubMed]
  14. Lerner, J. Essay: New York 2013: Towards a more livable city. Archit. Urban. 2013, 5, 48–50. [Google Scholar]
  15. Florida, R. Who’s your city? How the creative economy is making where to live the most important decision of your life. Contemp. Sociol. 2010, 39, 701–703. [Google Scholar]
  16. Okulicz-Kozaryn, A. City life: Rankings (livability) versus perceptions (satisfaction). Soc. Indic. Res. 2013, 110, 433–451. [Google Scholar] [CrossRef]
  17. McDonnell, M.; McGregor-Fors, M. The ecological future of cities. Science 2016, 352, 936–937. [Google Scholar] [CrossRef] [PubMed]
  18. Bibri, S.E.; Krogstie, J. On the social shaping dimensions of smart sustainable cities: A study in science, technology, and society. Sustain. Cities Soc. 2017, 29, 219–246. [Google Scholar] [CrossRef]
  19. Yang, F.; Zhang, X. Planning for sustainable cities? A comparative content analysis of the master plans of eco, low-carbon and conventional new towns in China. Habitat Int. 2017, 63, 55–66. [Google Scholar]
  20. The Economist Intelligence Unit (EIU). A Summary of the Livability Ranking and Overview. 2016. Available online: http://www.eiu.com (accessed on 14 September 2016).
  21. Monocle. The Liveable Cities Index 2011—Global. Available online: https://monocle.com/magazine/issues/45/the-liveable-cities-index-2011 (accessed on 20 September 2017).
  22. Tan, K.G.; Thye, W.W. A new approach to measuring the liveability of cities: The global liveable cities index. World Rev. Sci. Technol. Sustain. Dev. 2014, 11, 176–196. [Google Scholar]
  23. Andersen, M.; Reilly, S.; Siscovick, M. Mercer’s 19th Quality of Living Ranking. Available online: https://www.mercer.com/newsroom/2017-quality-of-living-survey.html (accessed on 4 September 2017).
  24. Numbeo. Quality of Life Index 2017 Mid-Year. 2017. Available online: https://www.numbeo.com/quality-of-life/rankings.jsp (accessed on 4 September 2017).
  25. Li, W.Y.; Yao, C.C. Trends of livability in the capital region of Taiwan. J. Asian Archit. Build. Eng. 2013, 12, 293–300. [Google Scholar] [CrossRef]
  26. World Commission on Environment and Development (WCED). Our Common Future; Oxford University Press: New York, NY, USA, 2001. [Google Scholar]
  27. United Nations Environment Programme (UNEP). Climate Change 2001: Synthesis Report. 2001. Available online: http://www.ipcc.ch/ipccreports/tar/vol4/pdf/front.pdf (accessed on 22 March 2016).
  28. United Nations Human Settlements Programme (UN-Habitat). Planning Sustainable Cities: Global Report on Human Settlements; Earthscan: London, UK, 2009. [Google Scholar]
  29. Vuchic, V. Transportation for Livable Cities; Routledge: London, UK, 1999. [Google Scholar]
  30. Zanella, A.; Camanho, A.S.; Dias, T.G. The assessment of cities’ livability integrating human wellbeing and environmental impact. Ann. Oper. Res. 2014, 226, 695–726. [Google Scholar] [CrossRef]
  31. America Association of Retired Persons (ARRP). ARRP Livability Index. Available online: https://livabilityindex.aarp.org (accessed on 4 September 2017).
  32. CNN Money. An Assessment of the Best Places to Live in America. 2005. Available online: http://money.cnn.com (accessed on 14 September 2014).
  33. Zhang, W.Z. Index system and method of residential environmental evaluation in inner cities. Sci. Geogr. Sin. 2007, 27, 17–23. (In Chinese) [Google Scholar]
  34. Sassen, S. The Global City: New York, London, Tokyo; Princeton University Press: Princeton, NJ, USA, 2001. [Google Scholar]
  35. The Tokyo Metropolitan Government. Creating the Future: The Long-Term Vision for Tokyo. Available online: http://www.metro.tokyo.jp (accessed on 22 March 2015).
  36. The New York City Government. One New York: The Plan for a Strong and Just City. Available online: http://www1.nyc.gov (accessed on 22 March 2015).
  37. Shanghai Municipal Government. The 13th Five-Year Plan for Economic and Social Development of Shanghai. Available online: http://www.shanghai.gov.cn (accessed on 22 March 2015).
  38. Yigitcanlar, T.; Dur, F.; Dizdaroglu, D. Towards prosperous sustainable cities: A multiscalar urban sustainability assessment approach. Habitat Int. 2015, 45, 36–46. [Google Scholar] [CrossRef]
  39. Gu, W.X.; Luo, Y.M. Livable city scientific evaluation criteria. Beijing City Plan. Constr. Rev. 2007, 1, 7–10. [Google Scholar]
  40. Wang, S.Y.; Zhu, D.; Zang, M.D. Getting out of the paradox of livable city researches: Conceptual model and choice of path. Urban Plan. Forum 2010, 23, 42–48. [Google Scholar]
  41. Malecki, E. The economic geography of the internet’s infrastructure. Econ. Geogr. 2002, 78, 399–424. [Google Scholar] [CrossRef]
  42. Jorgenson, D.W.; Khuon, V. Information technology and the world economy. Scand. J. Econ. 2005, 107, 631–650. [Google Scholar] [CrossRef]
  43. Rainie, L. How the internet will change the world—Even more. Sci. News 2010, 177, 53–64. [Google Scholar] [CrossRef]
  44. City of London. The London Plan: The Spatial Development Strategy for London Consolidated with Alterations Since 2011. Available online: http://www.cityoflondon.gov.uk (accessed on 22 March 2015).
  45. Saaty, T.L. Models, Methods, Concepts Applications of the Analytic Hierarchy Process; Springer: New York, NY, USA, 2012. [Google Scholar]
  46. Saaty, T.L. Decision-making with the AHP: Why is the principal eigenvector necessary. Eur. J. Oper. Res. 2003, 145, 85–91. [Google Scholar] [CrossRef]
  47. Lankevich, G.J. New York City: A Short History; New York University Press: New York, NY, USA, 2002. [Google Scholar]
  48. Shimizu, C.; Nishimura, K.G. Pricing structure in Tokyo metropolitan land markets and its structural changes: Pre-bubble, bubble, and post-bubble periods. J. Real Estate Financ. Econ. 2007, 35, 475–496. [Google Scholar] [CrossRef]
  49. United Nations (UN). Department of Economic and Social Affairs: Population Division. Available online: http://www.un.org/en/development/desa/population (accessed on 2 June 2015).
  50. Kennedy, C.; Steinberger, J.; Gasson, B.; Hansen, Y.; Hillman, T.; Havránek, M.; Pataki, D.; Phdungsilp, A.; Ramaswami, A.; Mendez, G.V. Greenhouse gas emissions from global cities. Environ. Sci. Technol. 2009, 43, 7297–7302. [Google Scholar] [CrossRef] [PubMed]
  51. Li, L.; Chen, C.; Xie, S.; Huang, C.; Cheng, Z.; Wang, H.; Wang, Y.; Huang, H.; Lu, J.; Dhakal, S. Energy demand and carbon emissions under different development scenarios for Shanghai, China. Energ. Policy 2010, 38, 4797–4807. [Google Scholar] [CrossRef]
  52. Dhakal, S. GHG emissions from urbanization and opportunities for urban carbon mitigation. Curr. Opin. Environ. Sustain. 2010, 2, 277–283. [Google Scholar] [CrossRef]
  53. International Energy Agency (IEA). World Energy Outlook. 2008. Available online: http://www.worldenergyoutlook.org (accessed on 22 March 2015).
  54. Shiva Nagendra, S.M.; Diya, M.; Chithra, V.S.; Menon, J.S.; Peter, A.E. Characteristics of air pollutants at near and far field regions of a national highway located at an industrial complex. Transp. Res. Part D Trans. Env. 2016, 48, 1–13. [Google Scholar] [CrossRef]
Figure 1. Boundary of three case study cities.
Sustainability 09 01681 g001
Figure 2. An overview of the socio-economic characteristics of three cities. (a) population; (b) per capita income in US dollars using the constant price from 2010; (c) urbanization rate measured by the proportion of urban population in the total. Data sources: New York Statistical Yearbook (1972–2012), Tokyo Metropolitan Statistical Yearbook (1967–2012), Shanghai Statistical Yearbook (1978–2012).
Sustainability 09 01681 g002
Figure 3. A hierarchical framework for livability assessment. Note: number in the parentheses is the weight of each category and indicator.
Sustainability 09 01681 g003
Figure 4. Long-term change of livability in New York, Tokyo and Shanghai.
Sustainability 09 01681 g004
Figure 5. Decomposition analysis of the main driving factors of livability.
Sustainability 09 01681 g005
Table 1. Summary of some contemporary livability studies.
Researcher or InstituteStudy AreaIndicators Employed
UNEP (1989)Cities in the worldHousing, infrastructure, transformation of the old city, sustainable human settlements development, reconstruction, housing difficulties.
CNN (Cable News Network) Money (2005) [32]USAFinancial position, housing, educational level, quality of life, cultural and recreational facilities, climate condition.
Ministry of Construction (2007)ChinaDegree of social civilization, economic prosperity, environmental beauty, resources carrying capacity, convenience and comfort of living, the degree of public safety.
Zhang et al. (2007) [33]30 cities in ChinaLiving conditions, life improvement, cost of living, convenience, human capital, environment.
Monocle (2011) [21]Cities around the worldOpenness, security, convenience of service facilities, comfort, tolerance of environment.
Li et al. (2013) [25]23 cities and counties in TaiwanConvenience, comfort, housing, safety, construction and development, expenditures and housing, food and plumbing.
Zanella et al. (2014) [30]34 cities in EuropeHousing quality, accessibility and transportation, human health, economic and social development, education, culture and leisure, solid waste, air pollutants.
Tan and Thye (2014) [22]64 global citiesEconomic vibrancy and competitiveness, environmental friendliness and sustainability, domestic security and stability, socio-cultural conditions and political governance
EIU (2016) [20]Cities in the worldStability, healthcare, culture, environment, education, infrastructure.
Mercer (2017) [23]231 cities around the worldPolitical and social environment, economic environment, socio-cultural environment, medical and health considerations, schools and education, public services and transportation, recreation, consumer goods, housing and natural environment.
ARRP (2017) [31]Communities in the USAHousing, neighborhood, transportation, environment, health, engagement and opportunity.
Numbeo (2017) [24]Cities around the worldCost of living and purchasing power, affordability of housing, pollution, crime rates, health system quality, traffic.
Table 2. Comparison scale in the Saaty method.
ScaleDefinitionNote
1Not at all importanti is equally important to j
3Slightly importanti is moderately important to j
5Fairly importanti is essentially important to j
7Essentially importanti is very strongly important to j
9Absolute importanti is very absolutely important to j
2, 4, 6, 8Intermediate valueThe relative importance of i to j is between two adjacent judgment
Table 3. The value of the average random consistency index (RI).
n123456789
RI000.580.901.121.241.321.411.45

