


Abstract
Ecotourism spatial planning requires the balance of both development and conservation. Through environmental data analysis, many researchers have suggested spatial planning that falls between these two polarizing concepts. Nonetheless, ecotourism development has been criticized as inconsiderate of places that are precious to local residents. The purpose of this study is to map local stakeholders’ perspectives for collaborative planning based on interests regarding ecotourism. Q methodology was used to analyse interest in space and conduct mapping. Upon analysis of a Seocheon ecotourism site, four preference factors that focus on (i) large-scale ecotourism resources and facilities; (ii) mud-flat ecotour villages; (iii) inland agricultural ecotour villages; and (iv) traditional ecotour villages were identified. Additionally, there was a consensus to conserve the harbours and reservoirs actually used by residents. However, there were differing opinions about coastal region development, and thus design alternatives are required. These results are significant because they enable spatial planning by theme and consider the lives of local residents beyond spatial planning based on physical data.
1. Introduction
In the spatial planning of an ecotour site, it is always difficult to balance the conservation of resources and development for tourists [1,2]. Hence, through various environment analyses, many professionals strive to devise plans that minimise environmental damage and are convenient to tourists [3,4]. However, some plans have been criticized as inconsiderate to the environment because residents’ opinions were not considered [5]. To overcome this limitation, several studies have tried to suggest plans that reflect values important to local residents or stakeholders by using the analytic hierarchy process technique [6,7]. However, a limitation of this approach is that it cannot analyse micro spaces precious to local stakeholders, which cannot be indicated by physical data. Thus, some studies have tried to reflect local stakeholders’ opinions and experiences in such planning. Traditional and ecological experiences are frequently used for this approach. The sophistication of local residents’ traditional ecological knowledge [8], importance of the plan based on traditional culture through an analysis of local residents’ sense of place [9] and processes to include local non-professionals’ experiences [10] have been discussed. However, this approach was used only to provide reference data for professionals and architects to combine with spatial planning, because it could not present specific mapping. To overcome this limitation, some studies have attempted mapping [11,12]; however, they have mapped based only on indicators determined by the researchers, so there is no way of learning about local people’s complex interests through mapping results.
In recent years, mapping local stakeholders’ overall preferences of spaces by using Q methodology has emerged as a new approach. Q methodology is a technique to analyse a group of stakeholders by conducting an interview based on qualitatively investigated issues in an area [13]. This technique also facilitates a survey analysis of the interest relationship at the micro level in the area [14,15,16]. Because the sample of Q methodology is composed of statements and not people, significant statistical results may be obtained with a small number of people [17]. Thus, the technique is effective in performing quantitative analysis on ecotour sites where the population is small. Drawing upon such advantages of Q methodology, a few studies have attempted to map the interest relationship with respect to spaces. Bicycle lanes [18] and danger points in floods [19] were argued using Q methodology mapping. These studies, however, only mapped the presence or absence of preference, and they did not compare differences in perspectives in the mapping to investigate interests or suggest spatial planning that would reduce conflict and induce cooperation.
Accordingly, the purpose of this study is to map local stakeholders’ perspectives for collaborative planning based on interests regarding ecotourism. In detail, this study will investigate spaces that local stakeholders, who are most intimate with the ecotour site, strongly wish to develop for ecotourism, consider precious and want to conserve. Subsequently, based on the mapping analysis of the differences and similarities in perspectives, this study will analyse interests and suggest an ecotourism spatial plan that can be supported by all to harmonise ecological resources, tourists’ ecological learning and residents’ individual lives.
2. Materials and Methods
2.1. Study Area
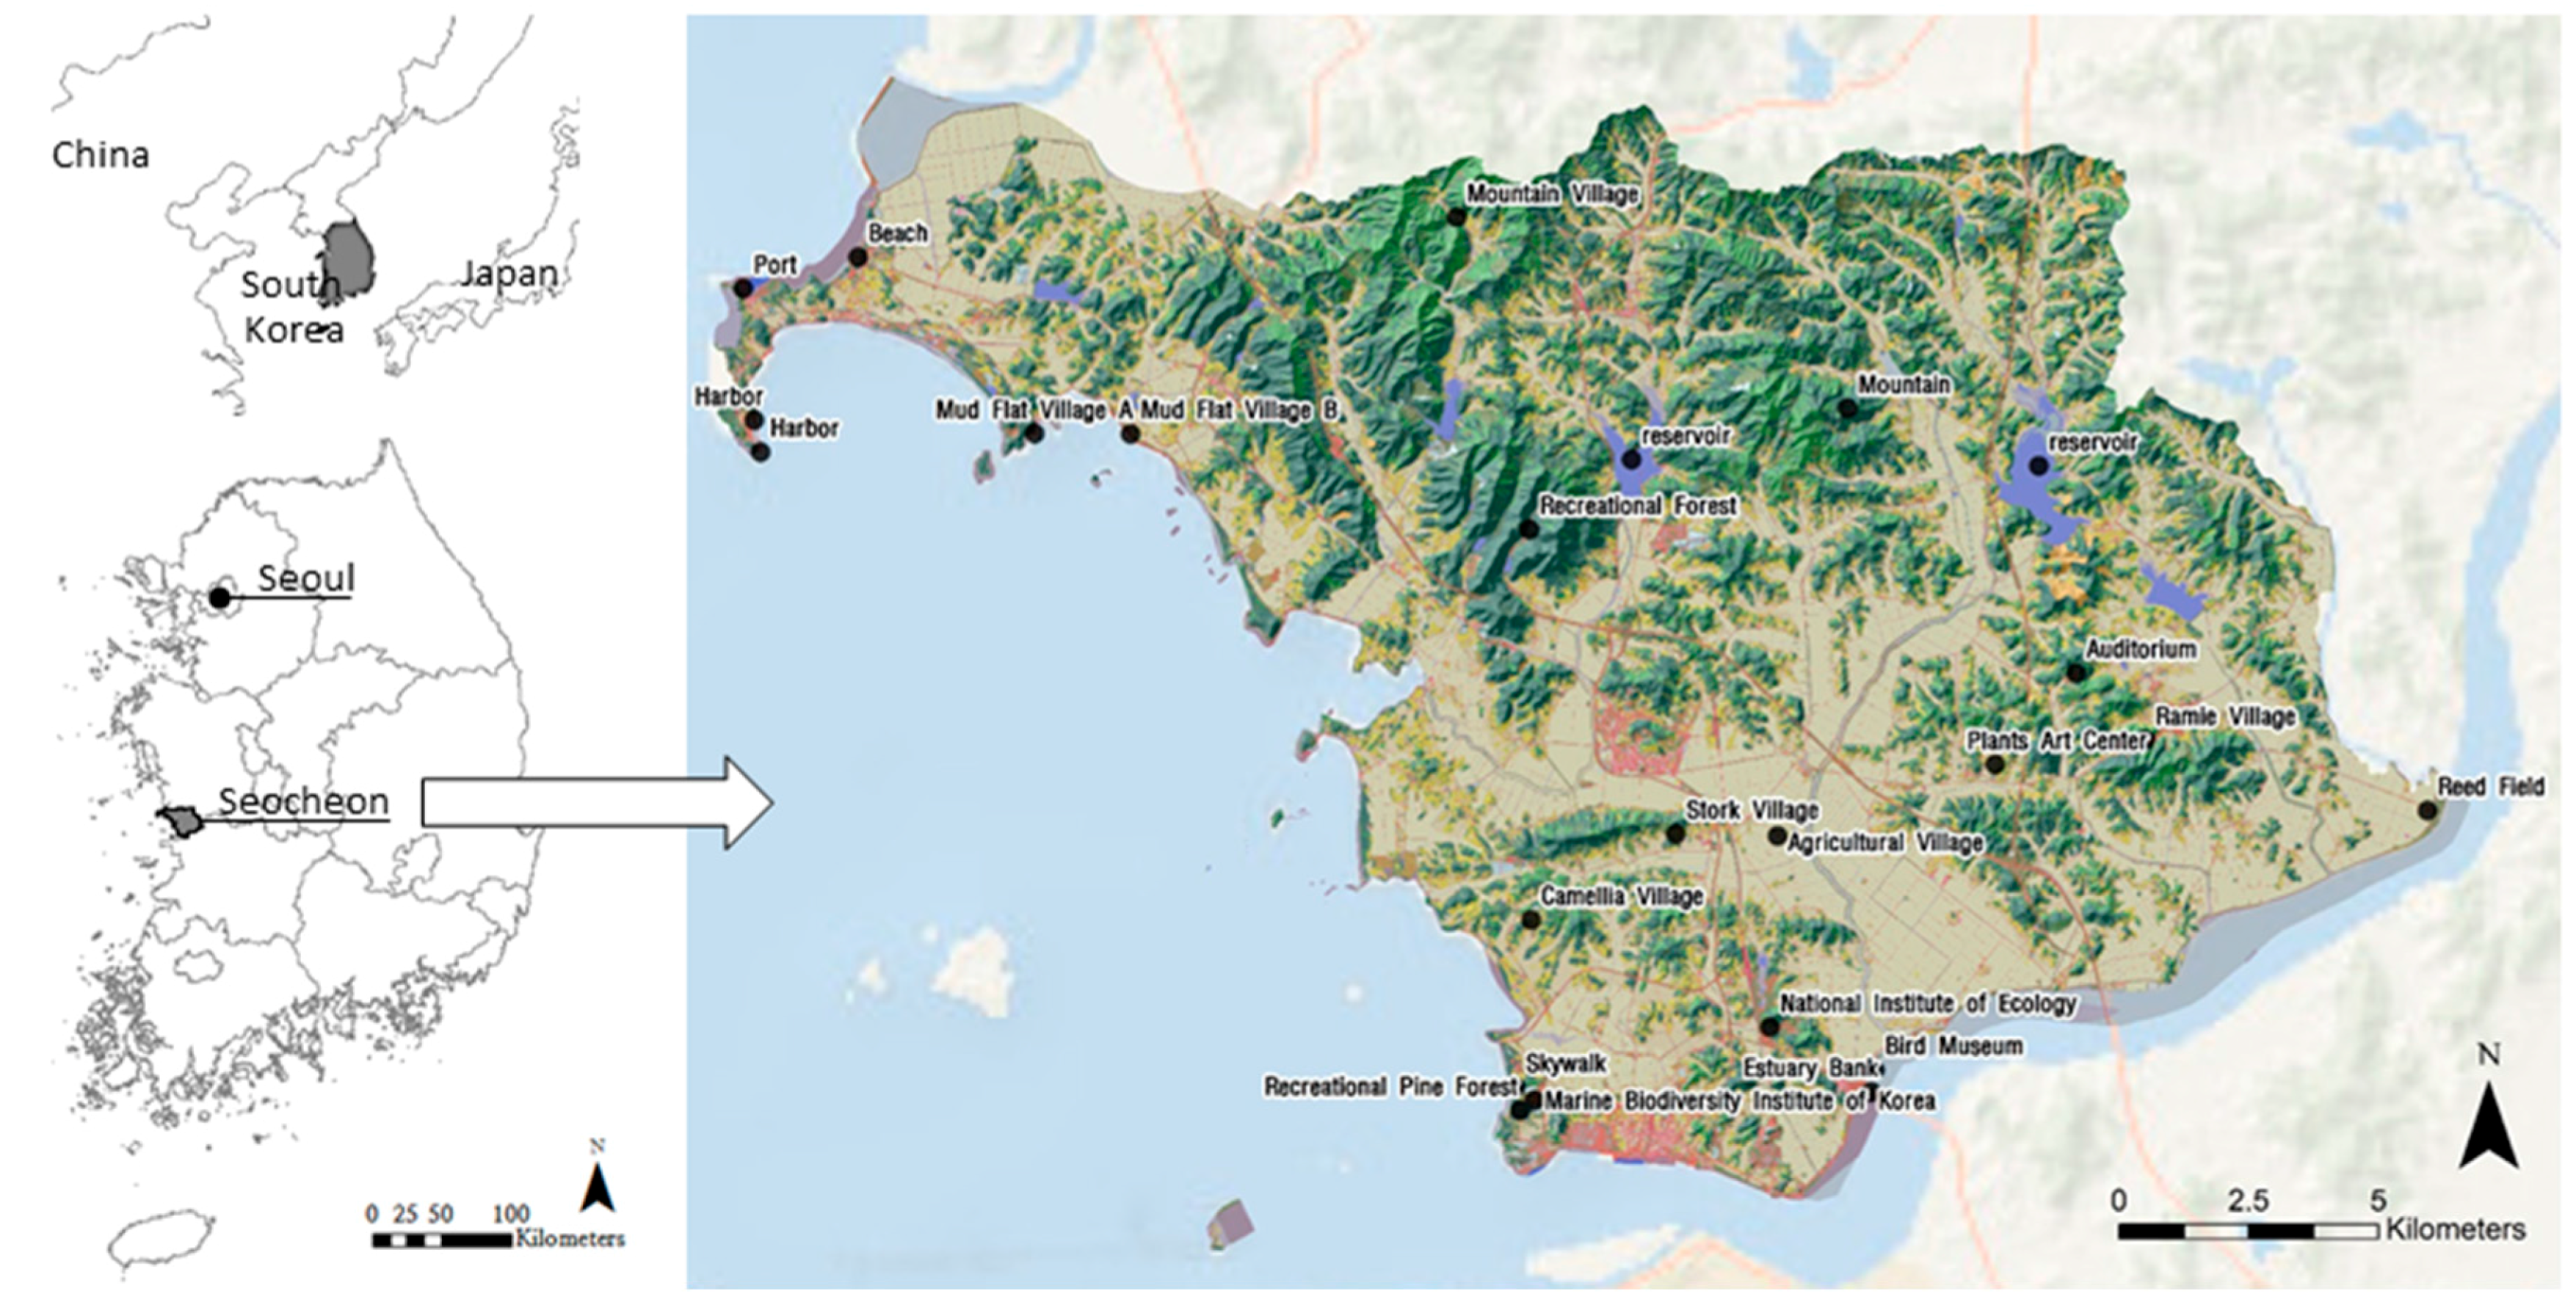
Seocheon has sites where numerous migratory birds visit the long stretch of mud flats along the coastline. Registered as Ramsar wetlands, this area has become an ecotourism locale where an ecotour village managed by local residents has been developed. The Korean government planned to provide focused support for Seocheon as an ecotourism region and concentrated its support by building the Bird Museum, National Institute of Ecology, Marine Biodiversity Institute of Korea and so forth. However, the perception arose that these facilities steal tourists from local ecotour villages (i.e., these facilities do not help local residents earn profits). Therefore, a plan was created to link the large-scale ecological experience facilities and small-scale villages through ecotourism route development, but its direction has not yet been determined. Moreover, an additional attempt is being made to develop ecotourism by utilizing other ecological resources such as an inland reservoir, a recreational forest and other forests in addition to the mud flats (see Figure 1).
Figure 1.
Study area.
2.2. Q methodology and a Geographic Information System (GIS)
This study used Q methodology and ArcGIS in combination with mapping stakeholders’ preferences in ecotourism. Q methodology is a technique to cluster stakeholders by surveying various opinions, and it is effective in summarising the perspectives of diverse stakeholders and identifying their interests. A previous use of Q methodology was to show various perspectives in writing or through pictures. This study analysed spaces using Q methodology to reveal interests in those spaces.
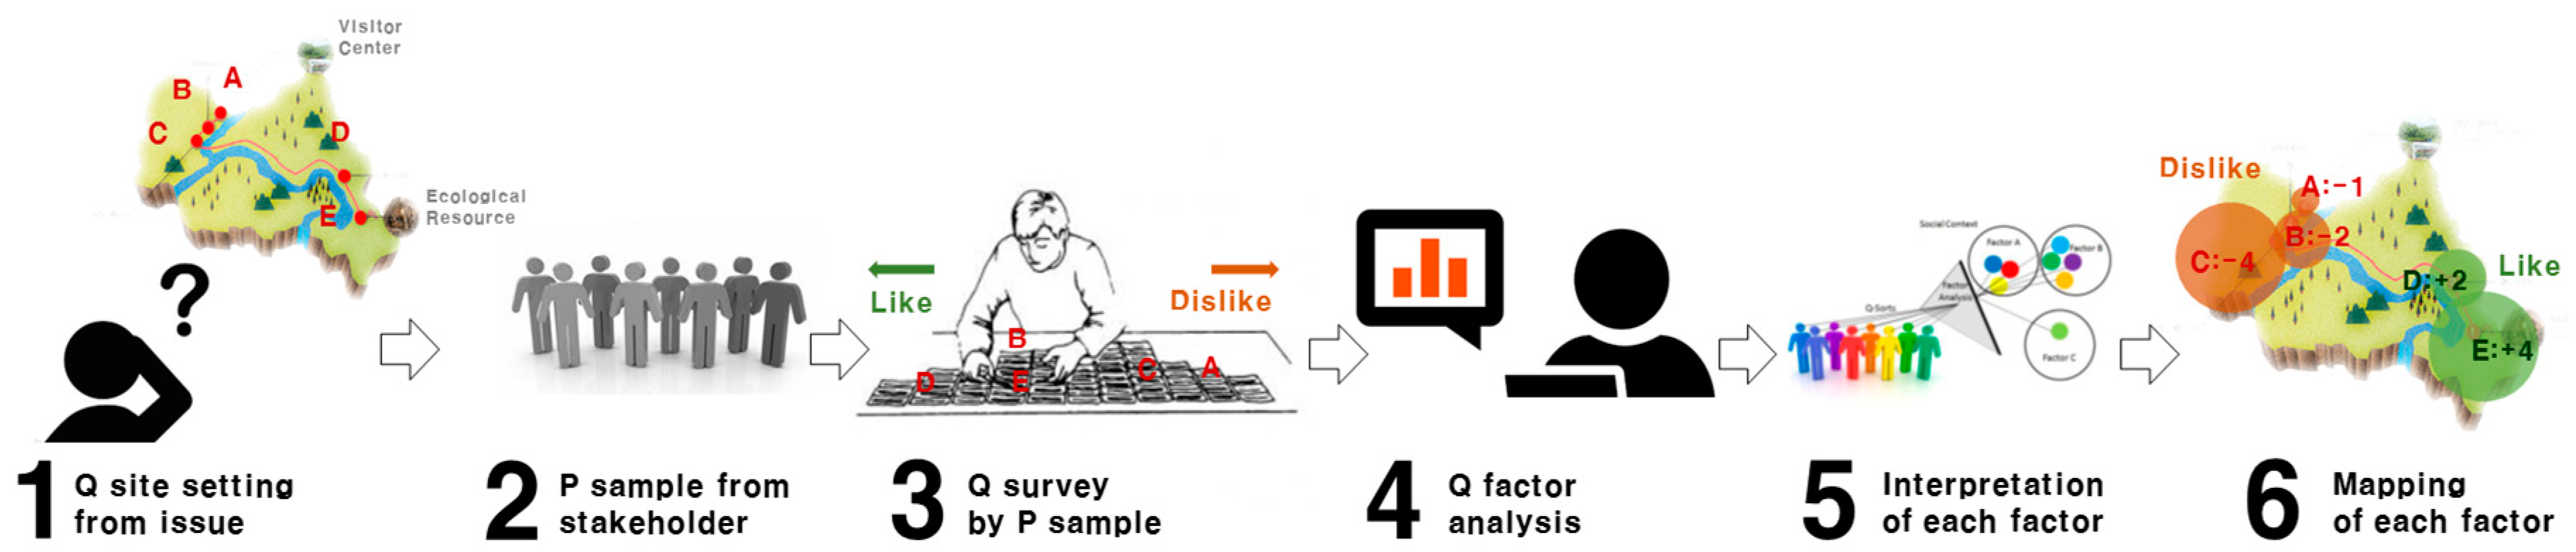
The specific methodology used in this study was as follows (see Figure 2):
- (1)
- Select spaces that were the main issues at an ecotour site.
- (2)
- Select the main stakeholders involved in the spaces.
- (3)
- Survey preferences regarding whether the spaces are relevant to ecotourism development.
- (4)
- Perform Q factor analysis based on the survey.
- (5)
- Interpret the characteristics of each factor (stakeholder cluster).
- (6)
- Map the cluster-specific preferences for ecotourism.
Figure 2.
Analysis process (Reconstruction of [20], p. 1945).
3. Q Analysis
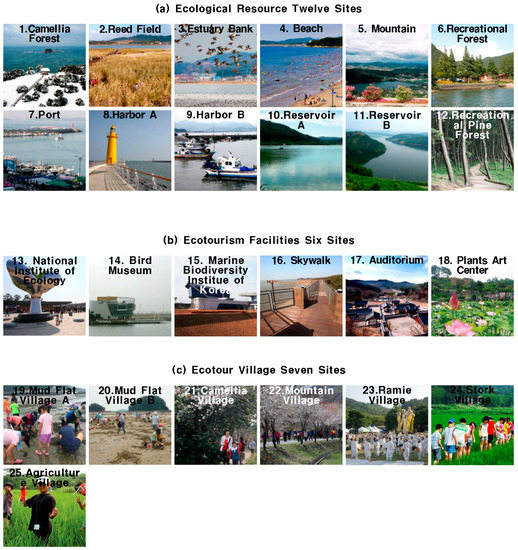
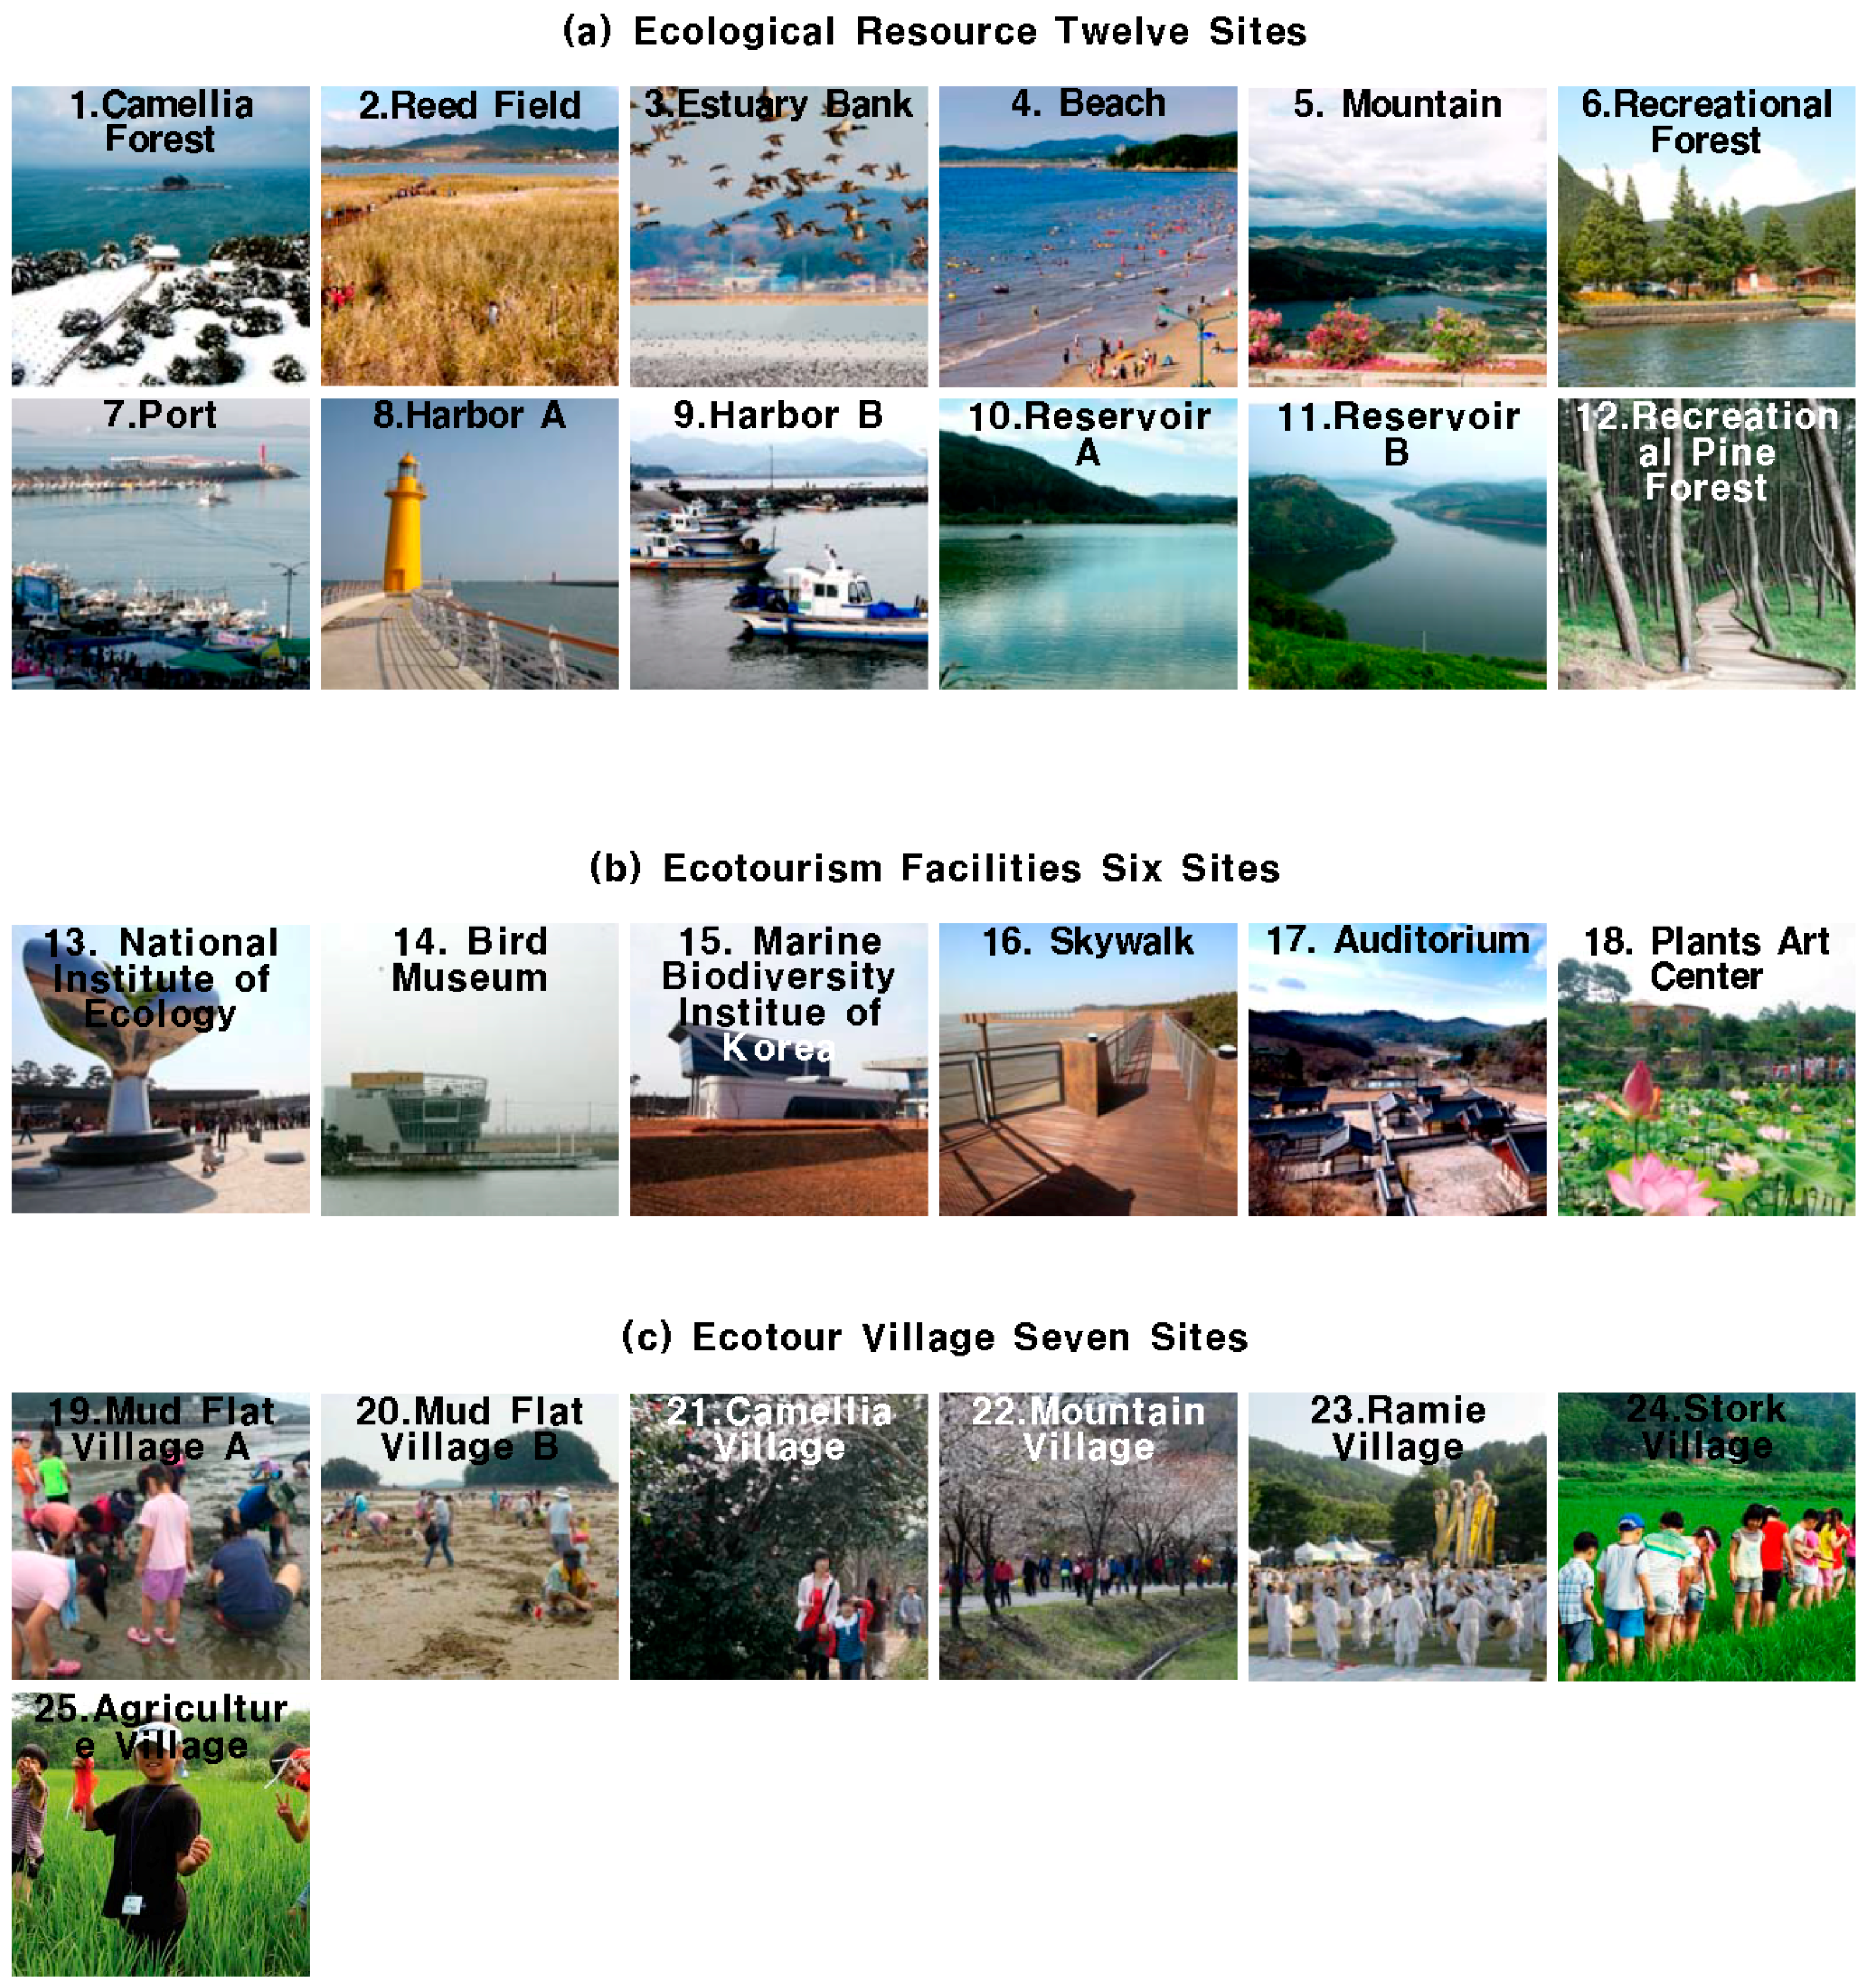
First, sites that were considered as issues at the ecotour site were selected in April 2016. As such, 25 sites were selected, including twelve sites with ecotourism resources suggested by the Culture and Tourism Division in the Seocheon county office; six sites involving large-scale ecotourism facilities; and seven sites involving ecotour villages (see Figure 3). The twelve ecotourism resources included coastline, harbour, inland reservoir and mountain. The six ecotourism facilities included large-scale ecotourism facilities. The seven ecotour villages included two sites involving mud-flat ecotour villages along the coast and five sites involving inland farming and mountain-area ecotour villages. The positions of the study areas are shown in Figure 1 (Source: http://tour.seocheon.go.kr).
Figure 3.
Ecotour sites. (a) ecological resources; (b) ecotourism facilities; (c) ecotour villages.
Second, the main stakeholders were selected in May 2016. The group consisted of 33 people involved in ecotourism, including officials from the Culture and Tourism department of the Seocheon county office, an environmental NGO, ecotour village local resident representatives, managers and researchers in charge of the large-scale ecotourism facilities, ecotourism interpreters and merchants (see Table 1).
Table 1.
Stakeholder set.
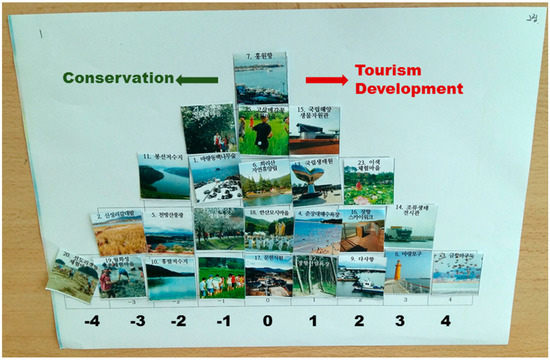
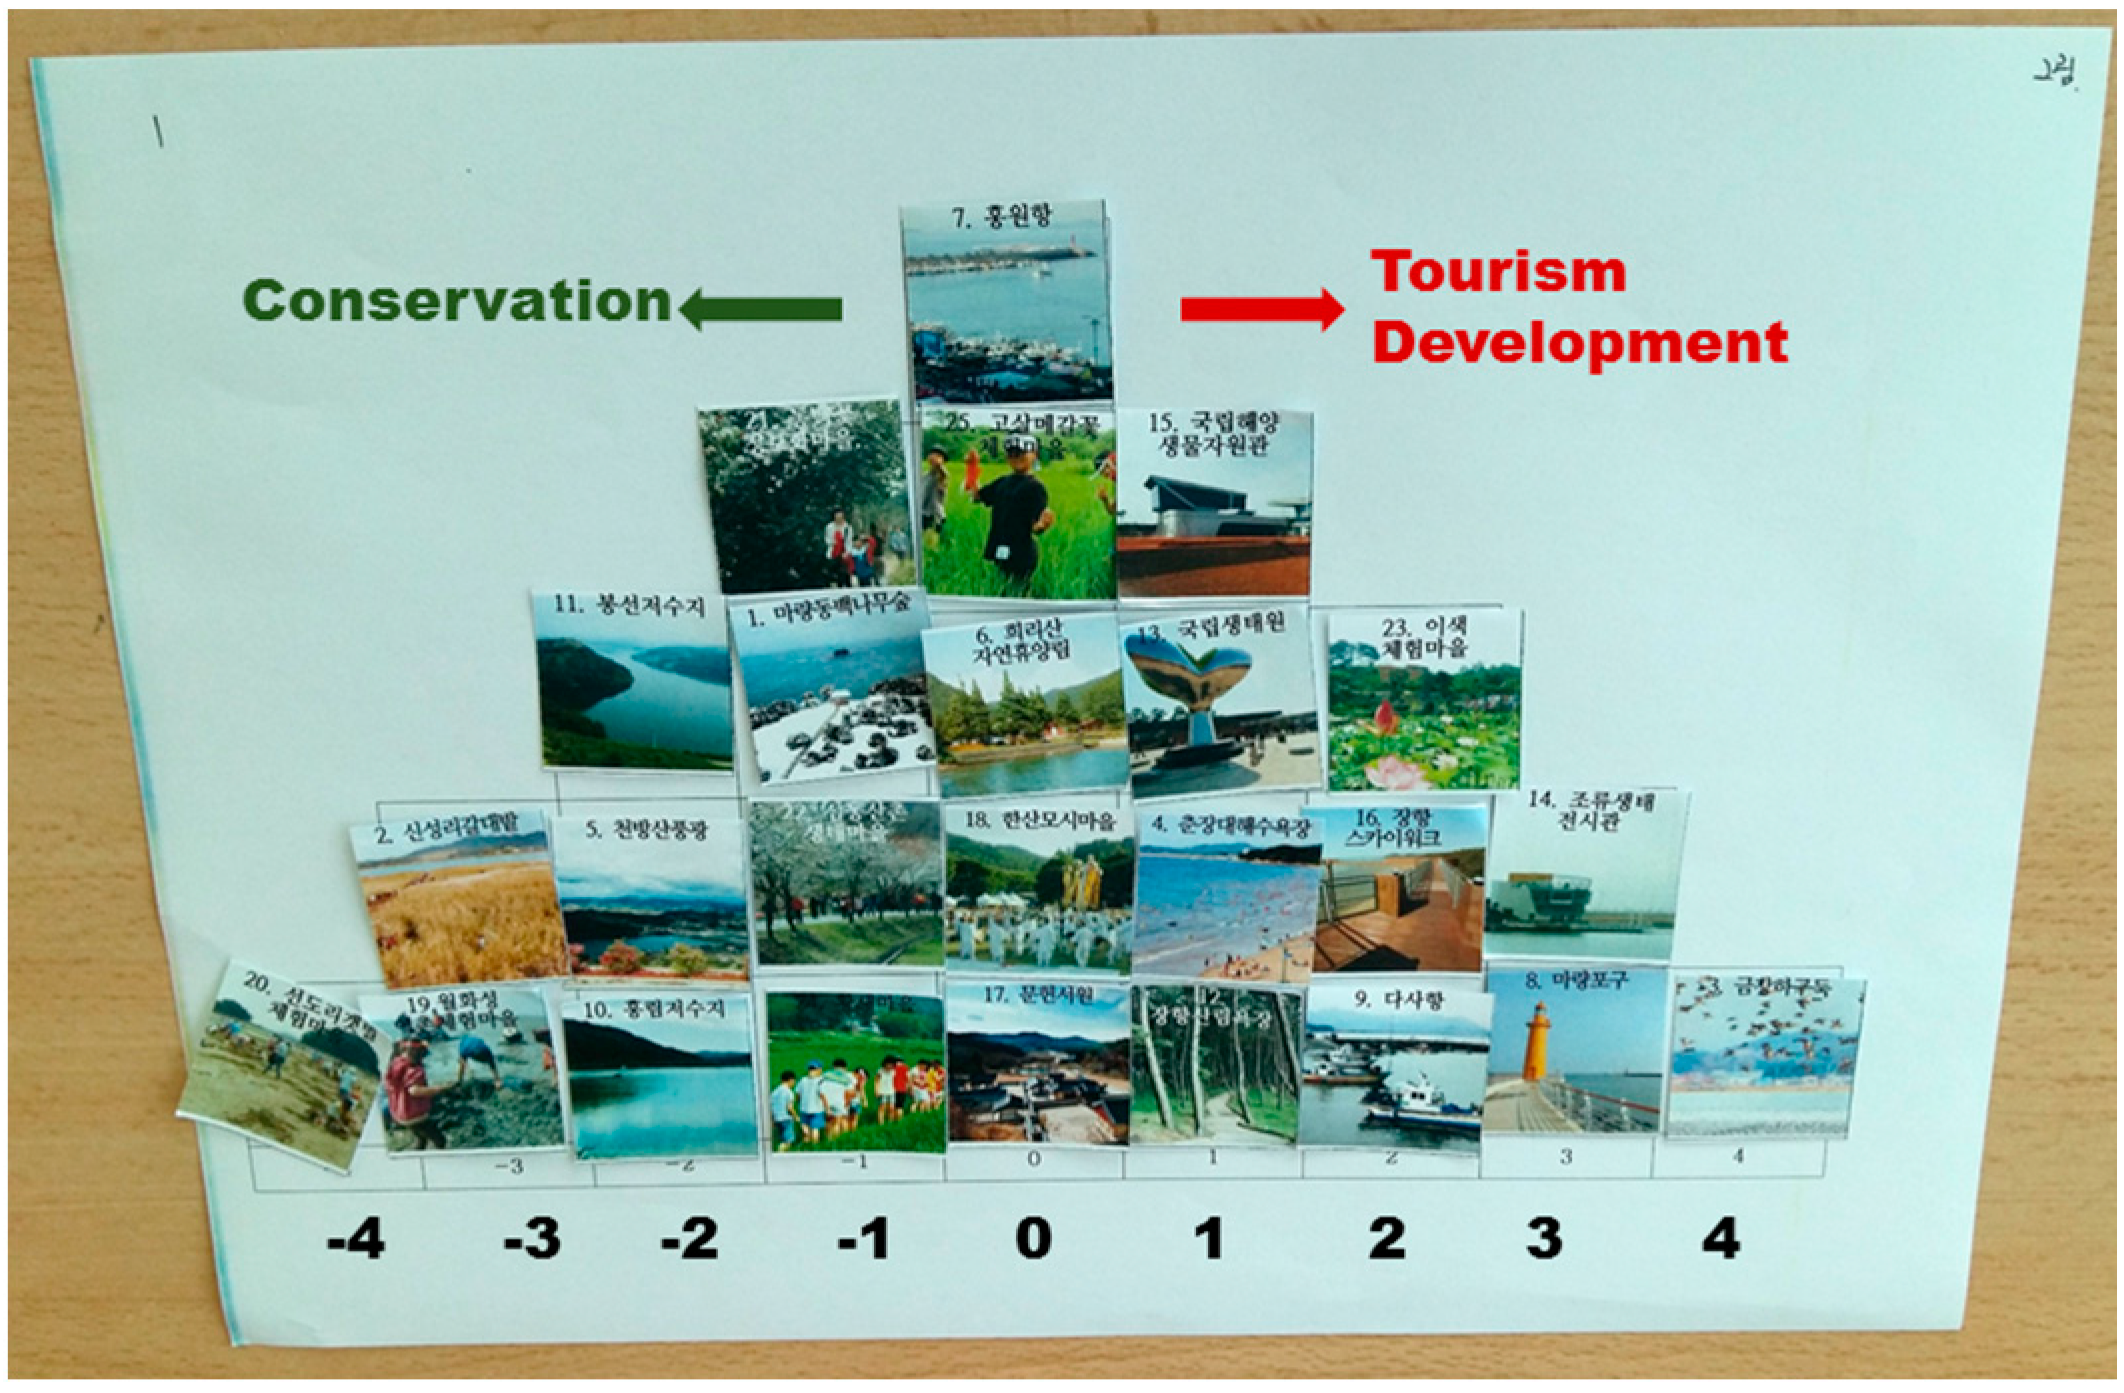
Third, a Q survey was administered from 24 May to 27 May 2016. The Q survey was forced to be normalised in the shape of a pyramid. Stakeholders were requested to position 25 ecotour sites in the pyramid, with those to be developed on the right (+4) and those to be conserved on the left (−4; see Figure 4).
Figure 4.
Q survey.
Fourth, a Q factor analysis was performed. Q factor analysis is a technique to factorise people as variables. Thus, each factor represents a stakeholder group, and the z values can be interpreted as the characteristics of stakeholder groups. Based on the results of principal component factor analysis with the varimax rotation, a total of nine factors with factor loadings of over one were extracted. Factor loadings indicate the explanatory power of variables (stakeholders in this study). The advantages of extracting many factors are that the overall explanatory power increases and various stakeholder clusters can be interpreted, and the drawback includes difficulty in interpreting the results with simplicity and clarity [21]. For each person’s factor value produced as an outcome of Q factor analysis to be significant at the 0.01 level, the value should be 0.4644 or higher. Based on the results of the calculation with nine factors plus one more for stakeholders, the people were included (see Table 2). In this study, for the inclusion of the maximum number of stakeholders and a short, clear interpretation of the results, this study used factor selection criteria that the factor characteristic value should be 3.00 or higher and that a maximum number of stakeholders should be included. Consequently, four factors were selected (see Table 3).
Table 2.
Relation between the eigen values from Q factor analysis and the stakeholders included.
Table 3.
Stakeholder group from Q factor analysis.
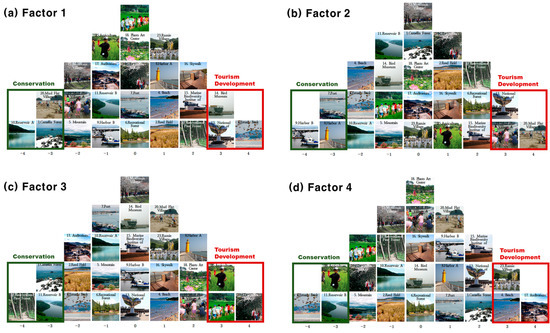
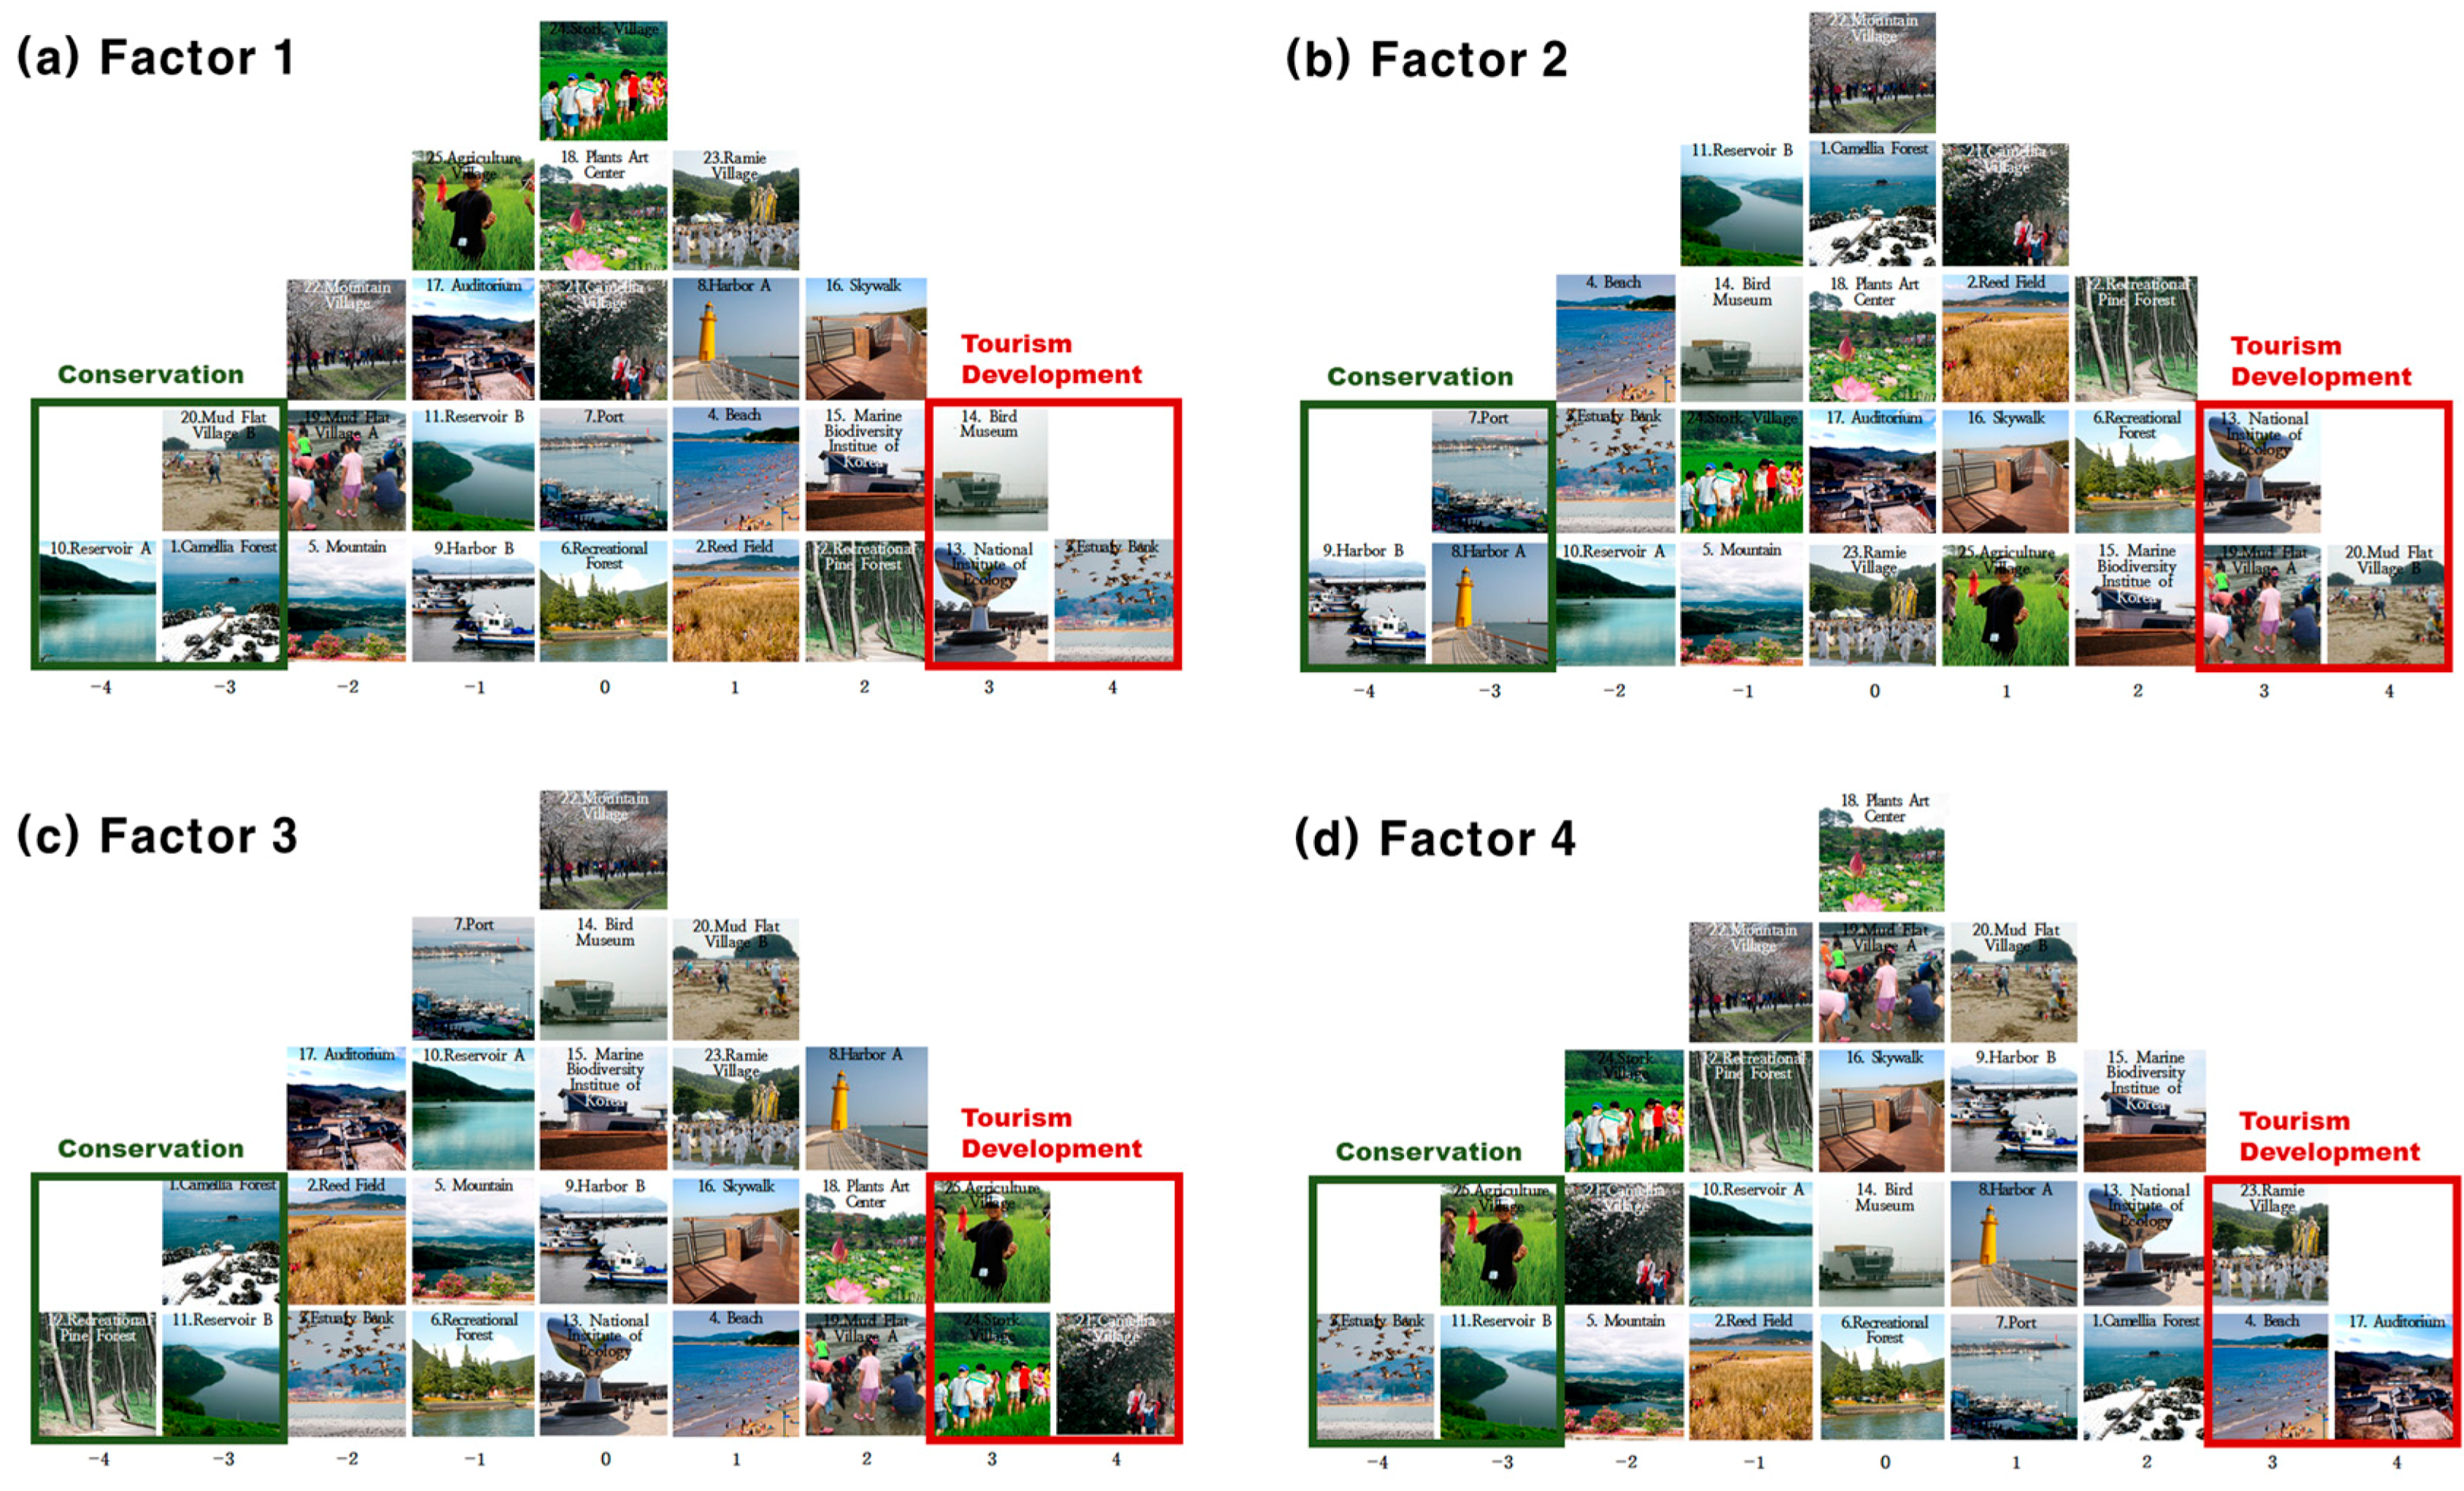
Fifth, to investigate the nature of the four factors, the z value of each factor was examined. The range of a z value was between −4 and +4; a negative value indicated a preference for conservation, while a positive value indicated a preference for ecotourism development. Most Q methodology studies focus on extreme values to interpret factors, and in this study, too, we interpreted the results with a focus on absolute values of 3 or higher (i.e., −4~−3 for conservation and +3~+4 for ecotourism development; see Figure 5).
Figure 5.
Preference of each factor. (a) Factor 1; (b) Factor 2; (c) Factor 3; (d) Factor 4.
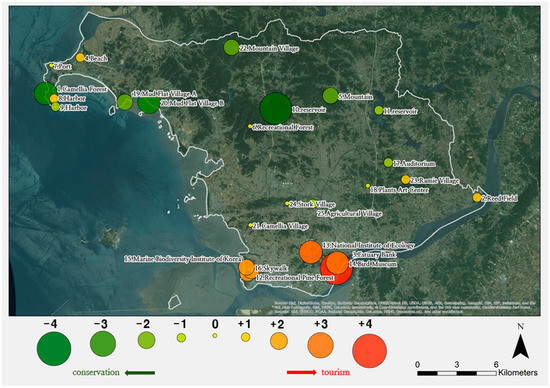
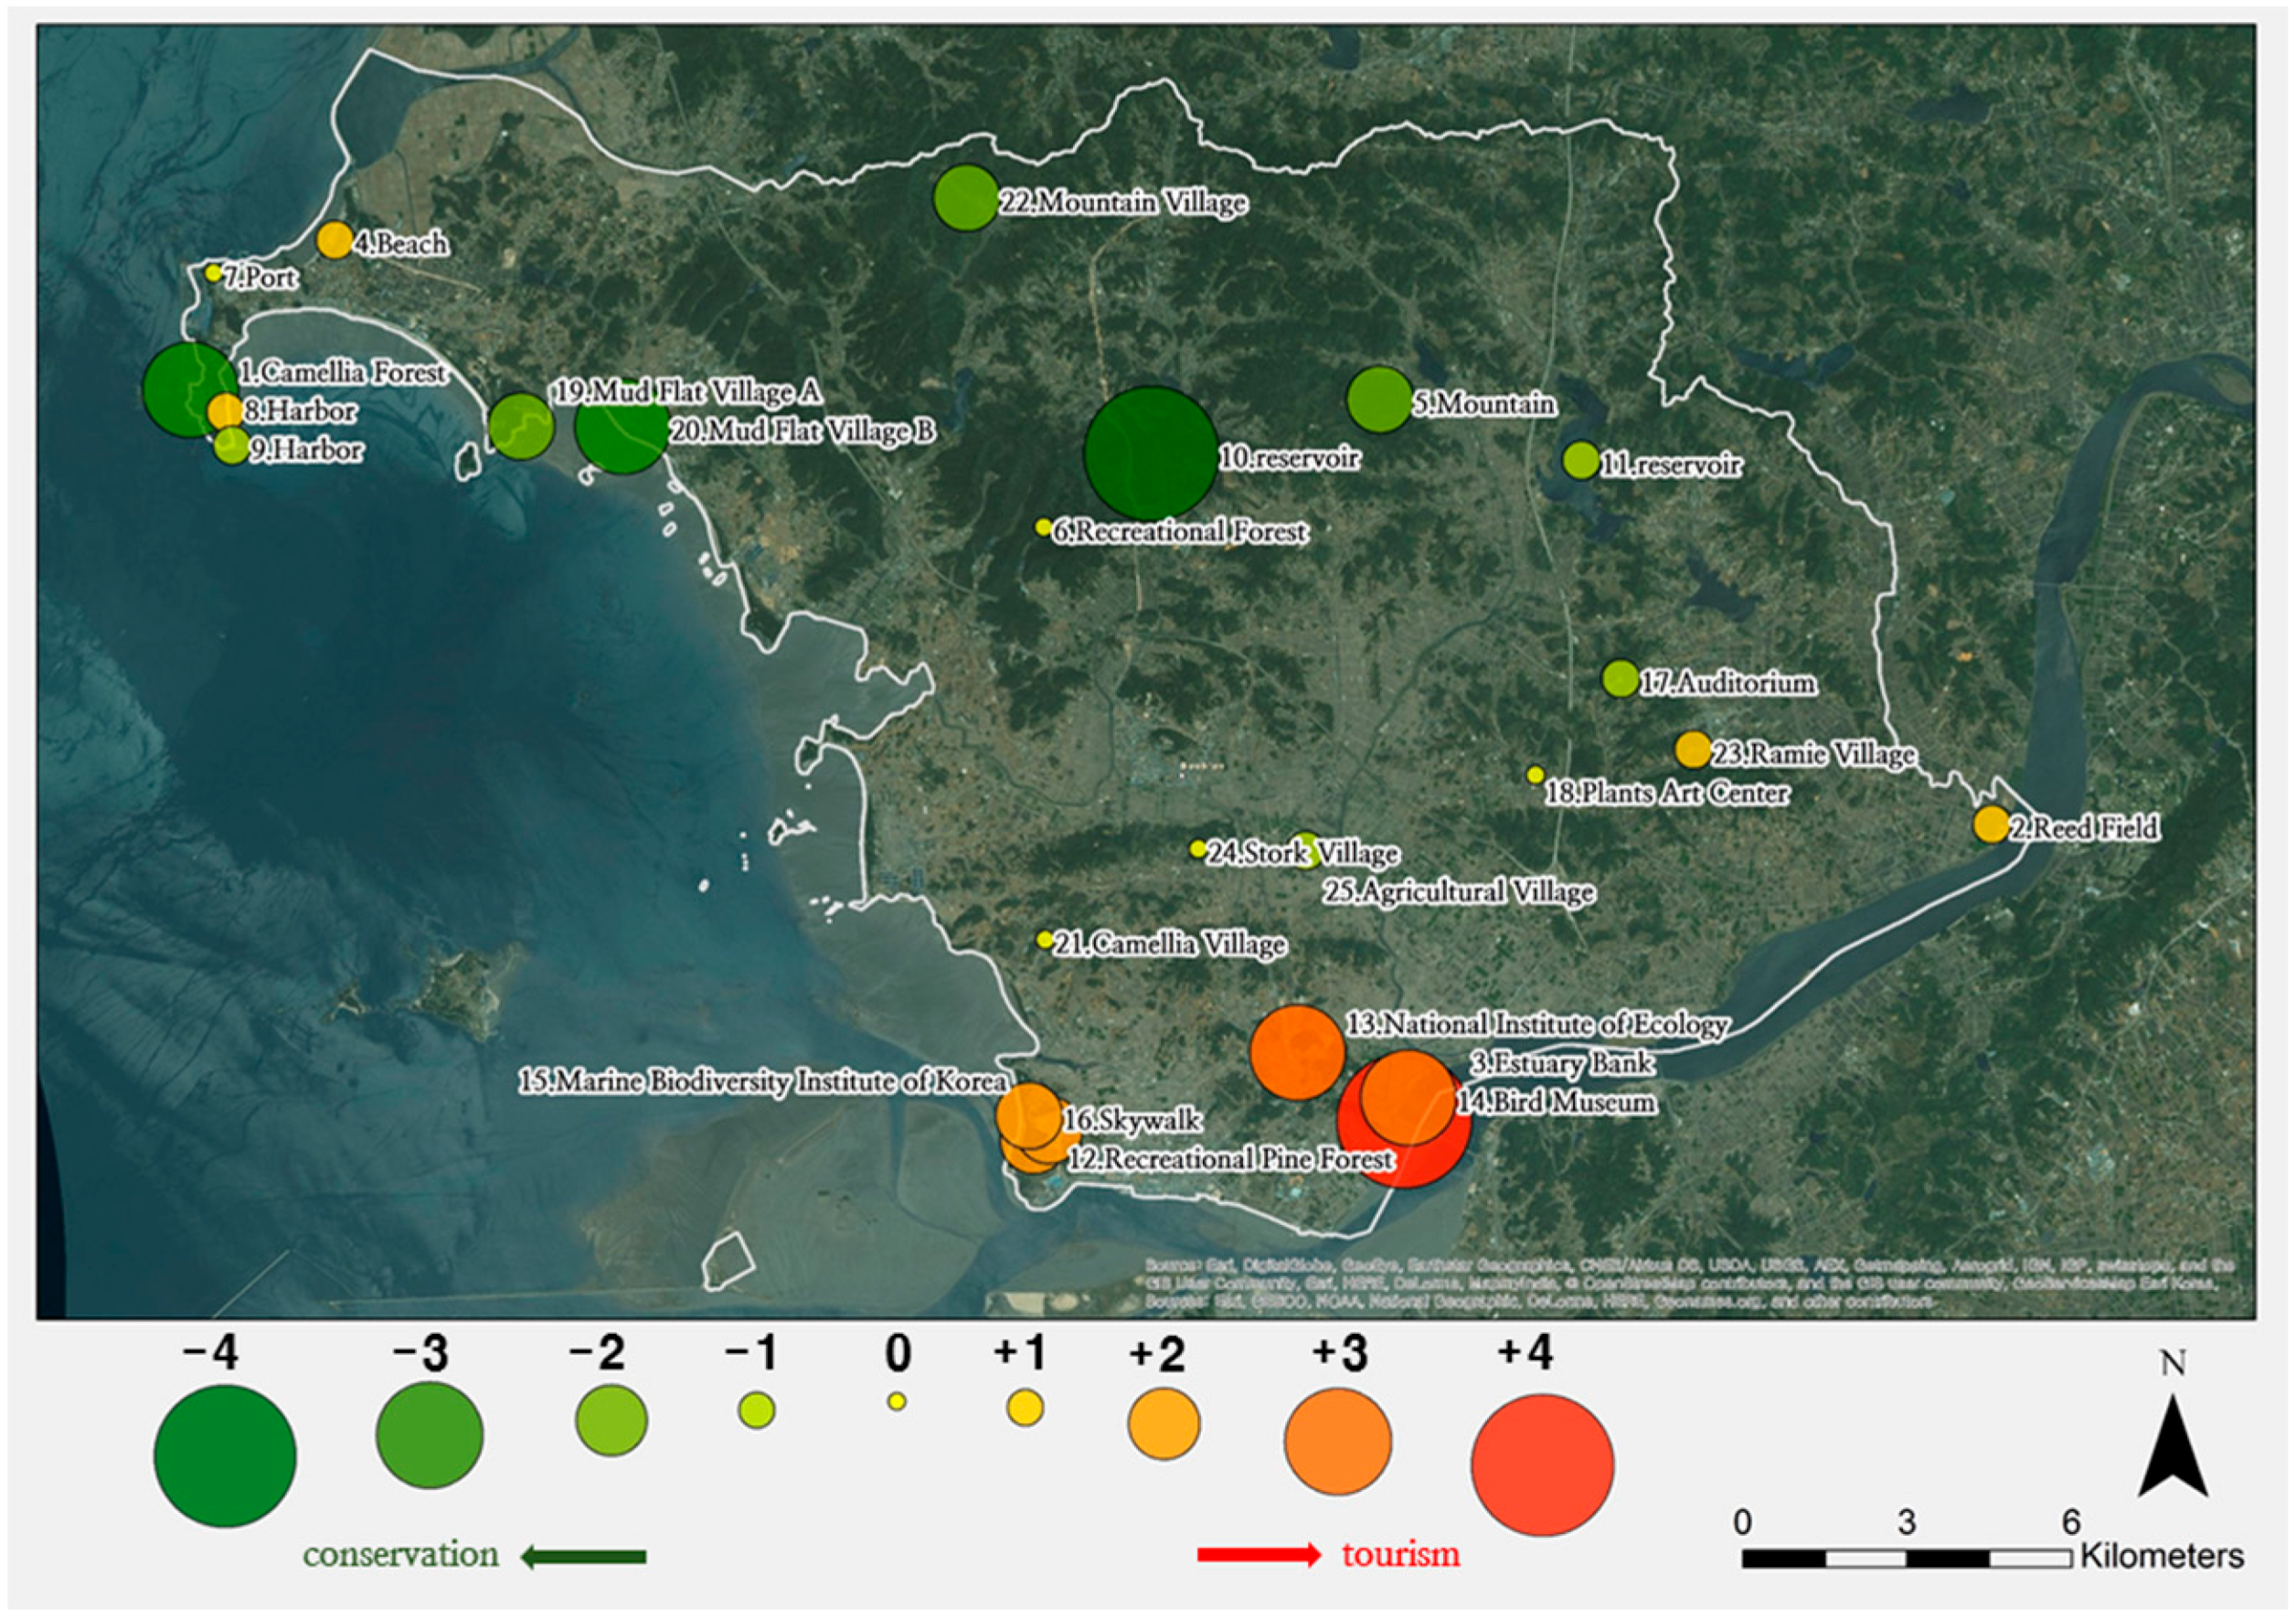
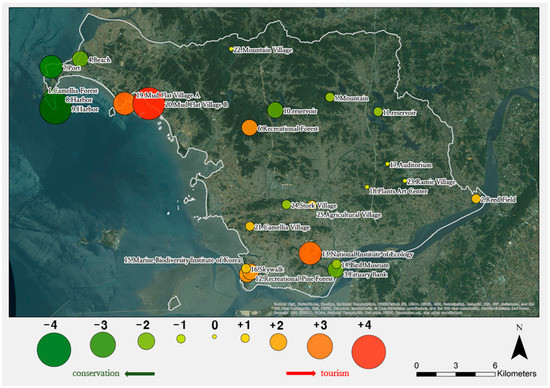
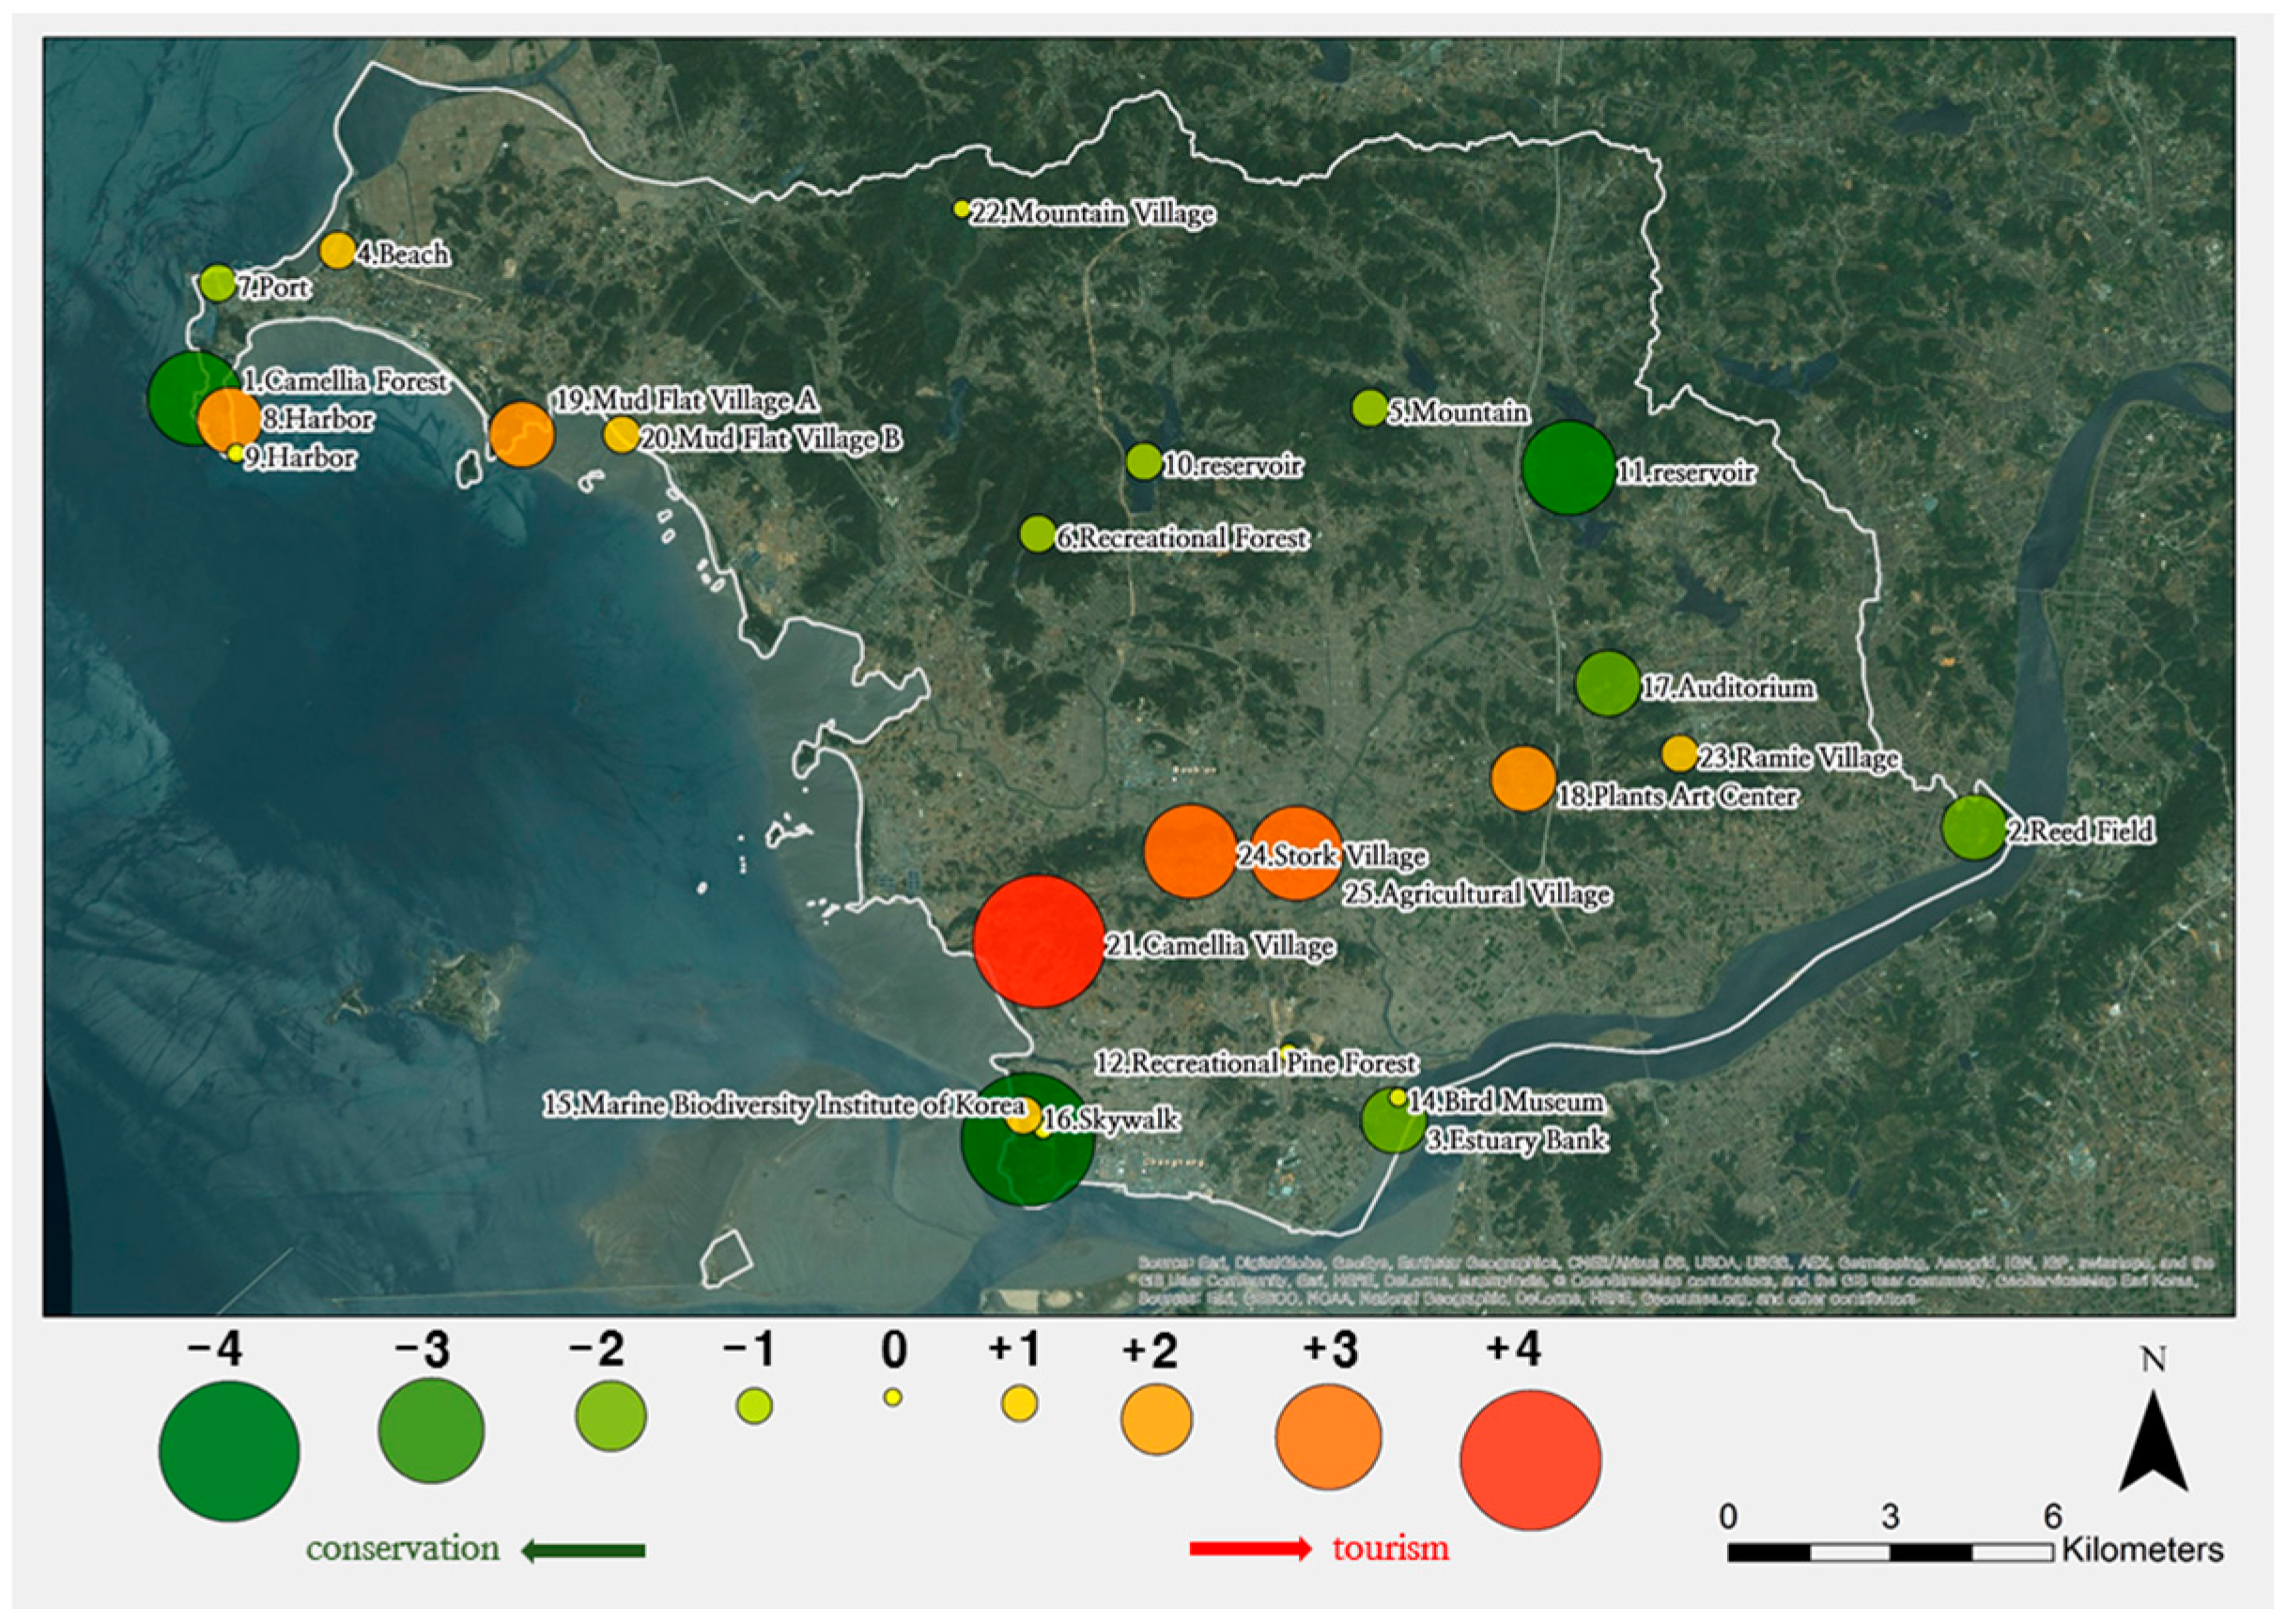
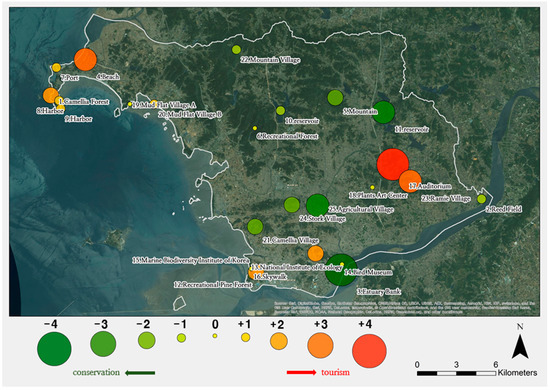
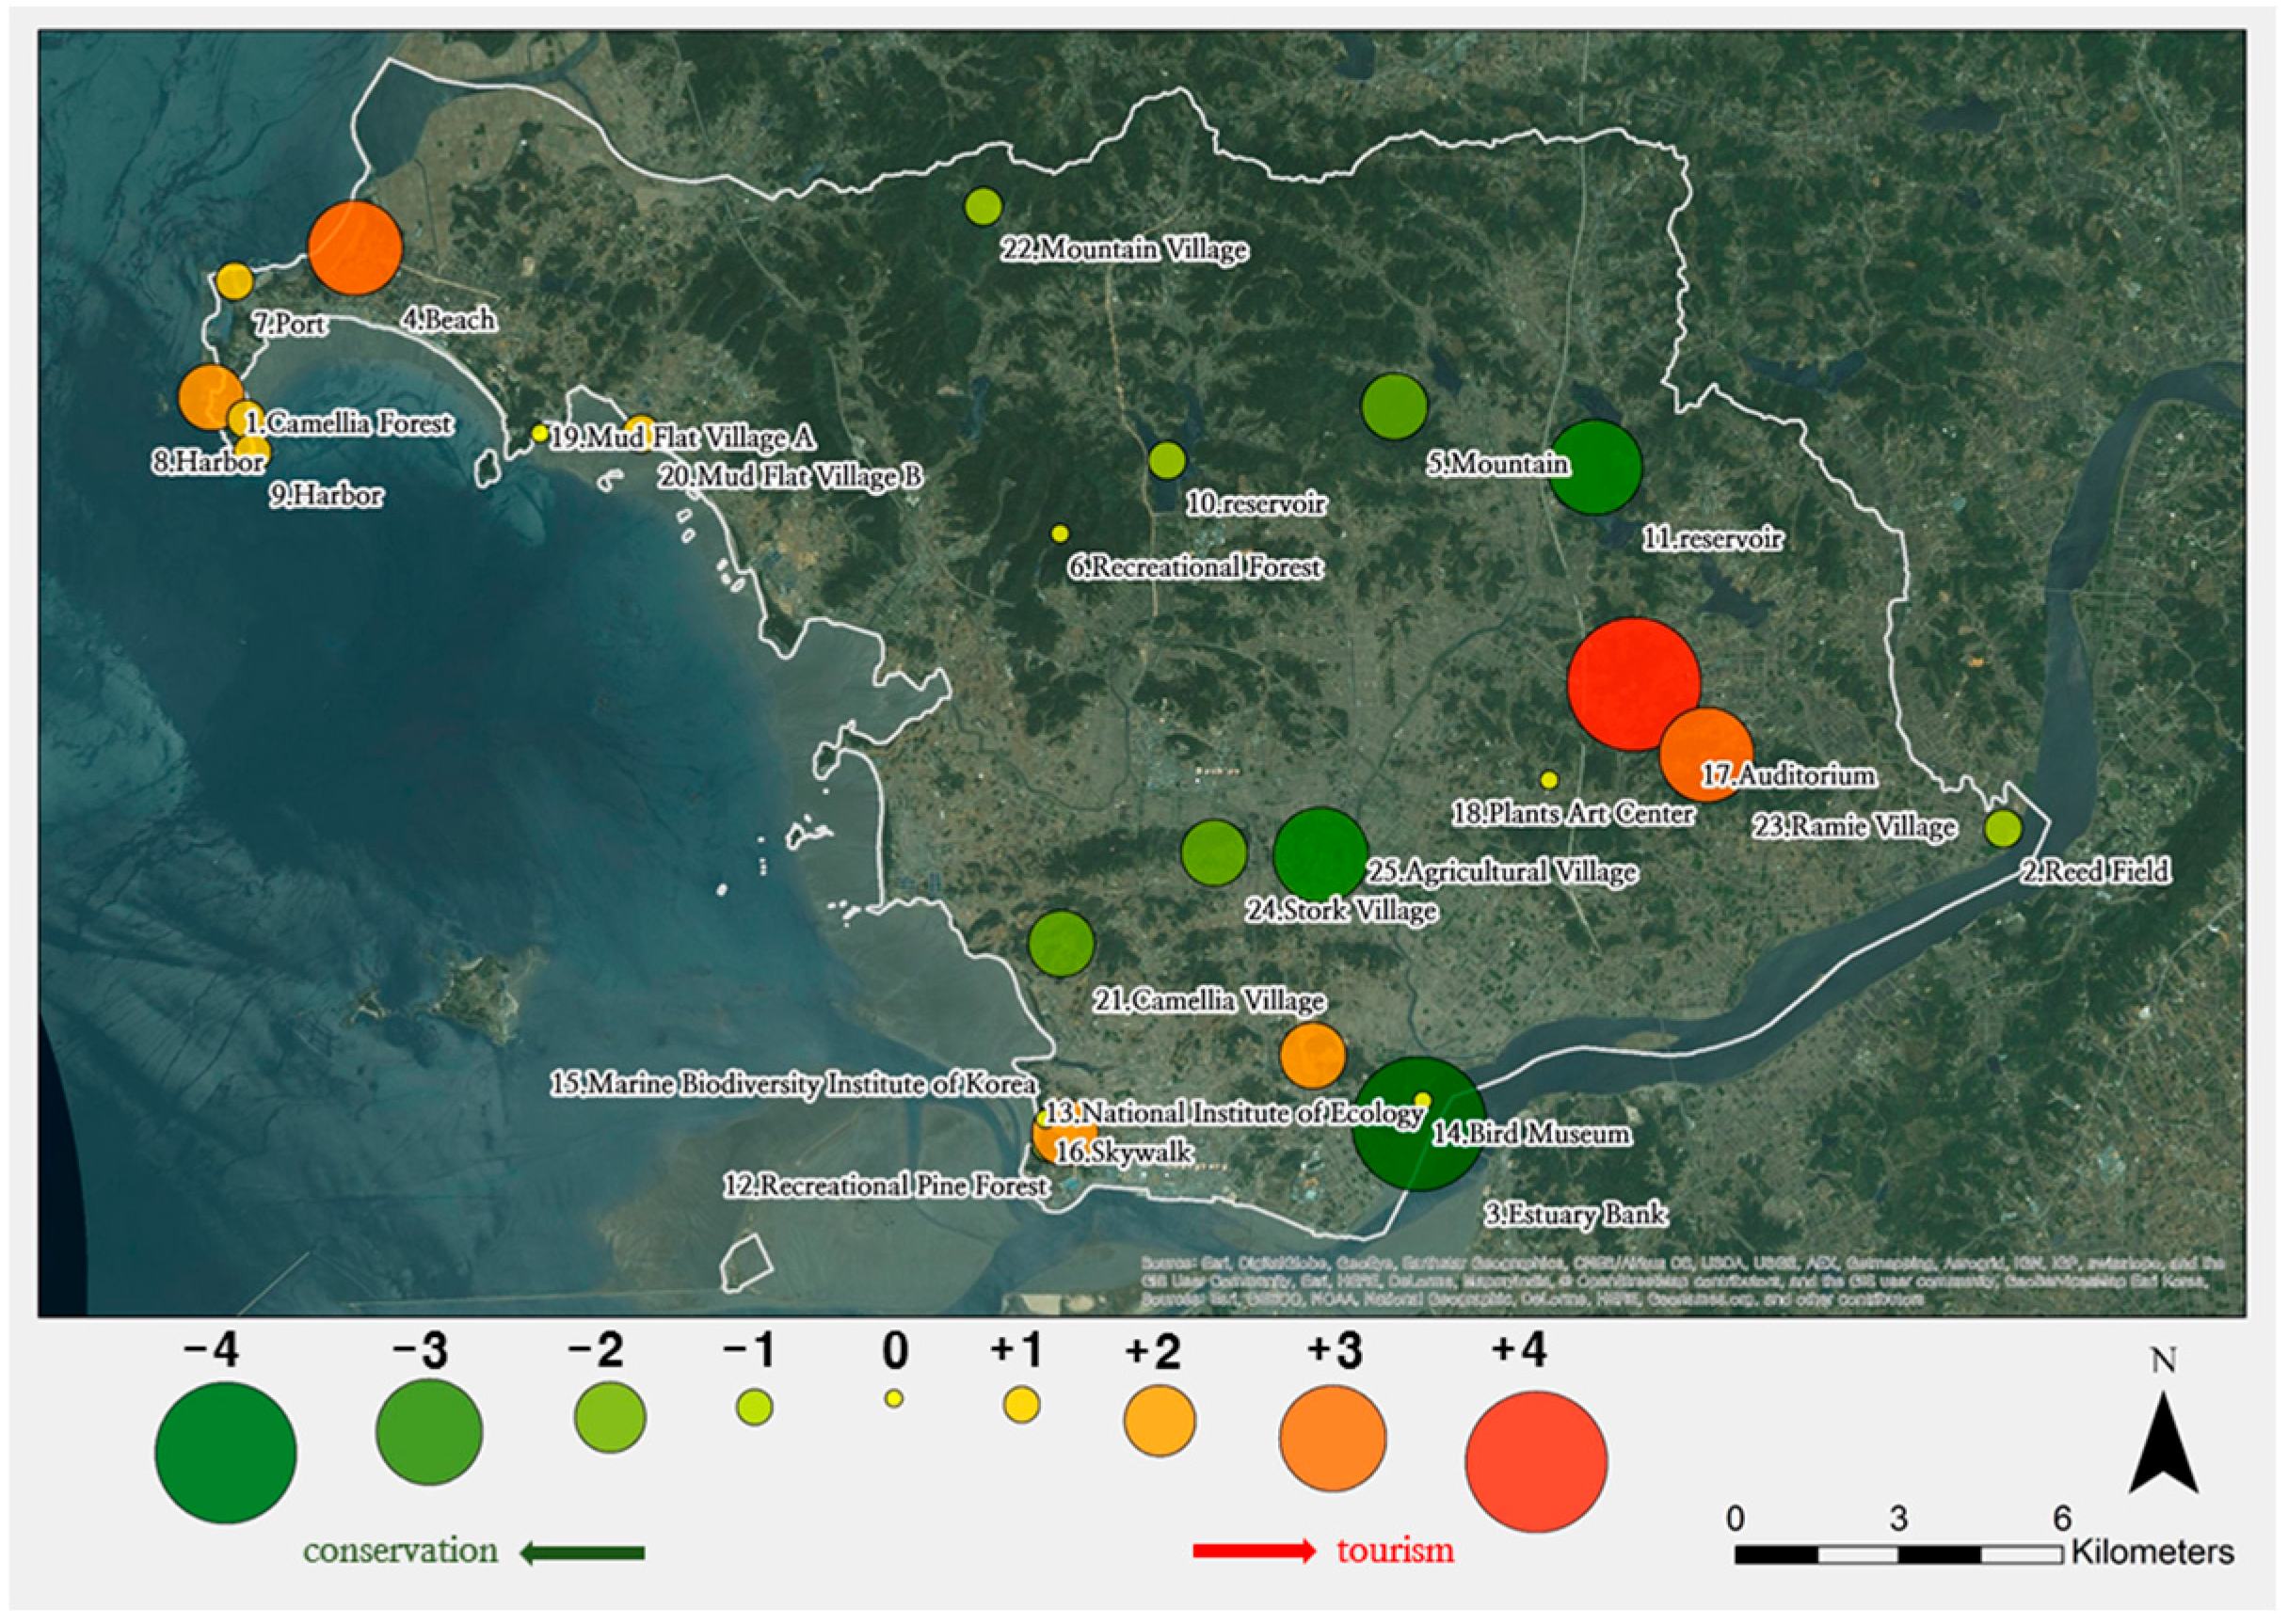
Sixth, each factor value was mapped. The preference for conservation was in green, while the preference for ecotourism development was in red. The size of a circle became larger if the preference was stronger (see Figure 6).
Figure 6.
Index of mapping.
4. Results
4.1. Factor 1: Focus on Large-Scale Ecotourism Resources and Facilities
Factor 1 indicates the perspective in which ecotourism development was desired, focusing on large-scale ecotourism resources and facilities. With the Estuary Bank and Bird Museum as references, the preference was to conduct ecotourism development of the National Institute of Ecology, Marine Biodiversity Institute of Korea and so forth and conservation of the northern reservoir spaces. An institute manager in charge of the Marine Biodiversity Institute of Korea who was clustered in this factor said, “I would like to suggest that education should be provided for students and visitors by combining the Marine Biodiversity Institute of Korea, National Institute of Ecology and Bird Museum with the themes of sea, land and sky, respectively” (see Figure 7).
Figure 7.
Mapping of factor 1.
4.2. Factor 2: Focus on Mud-Flat Ecotour Villages
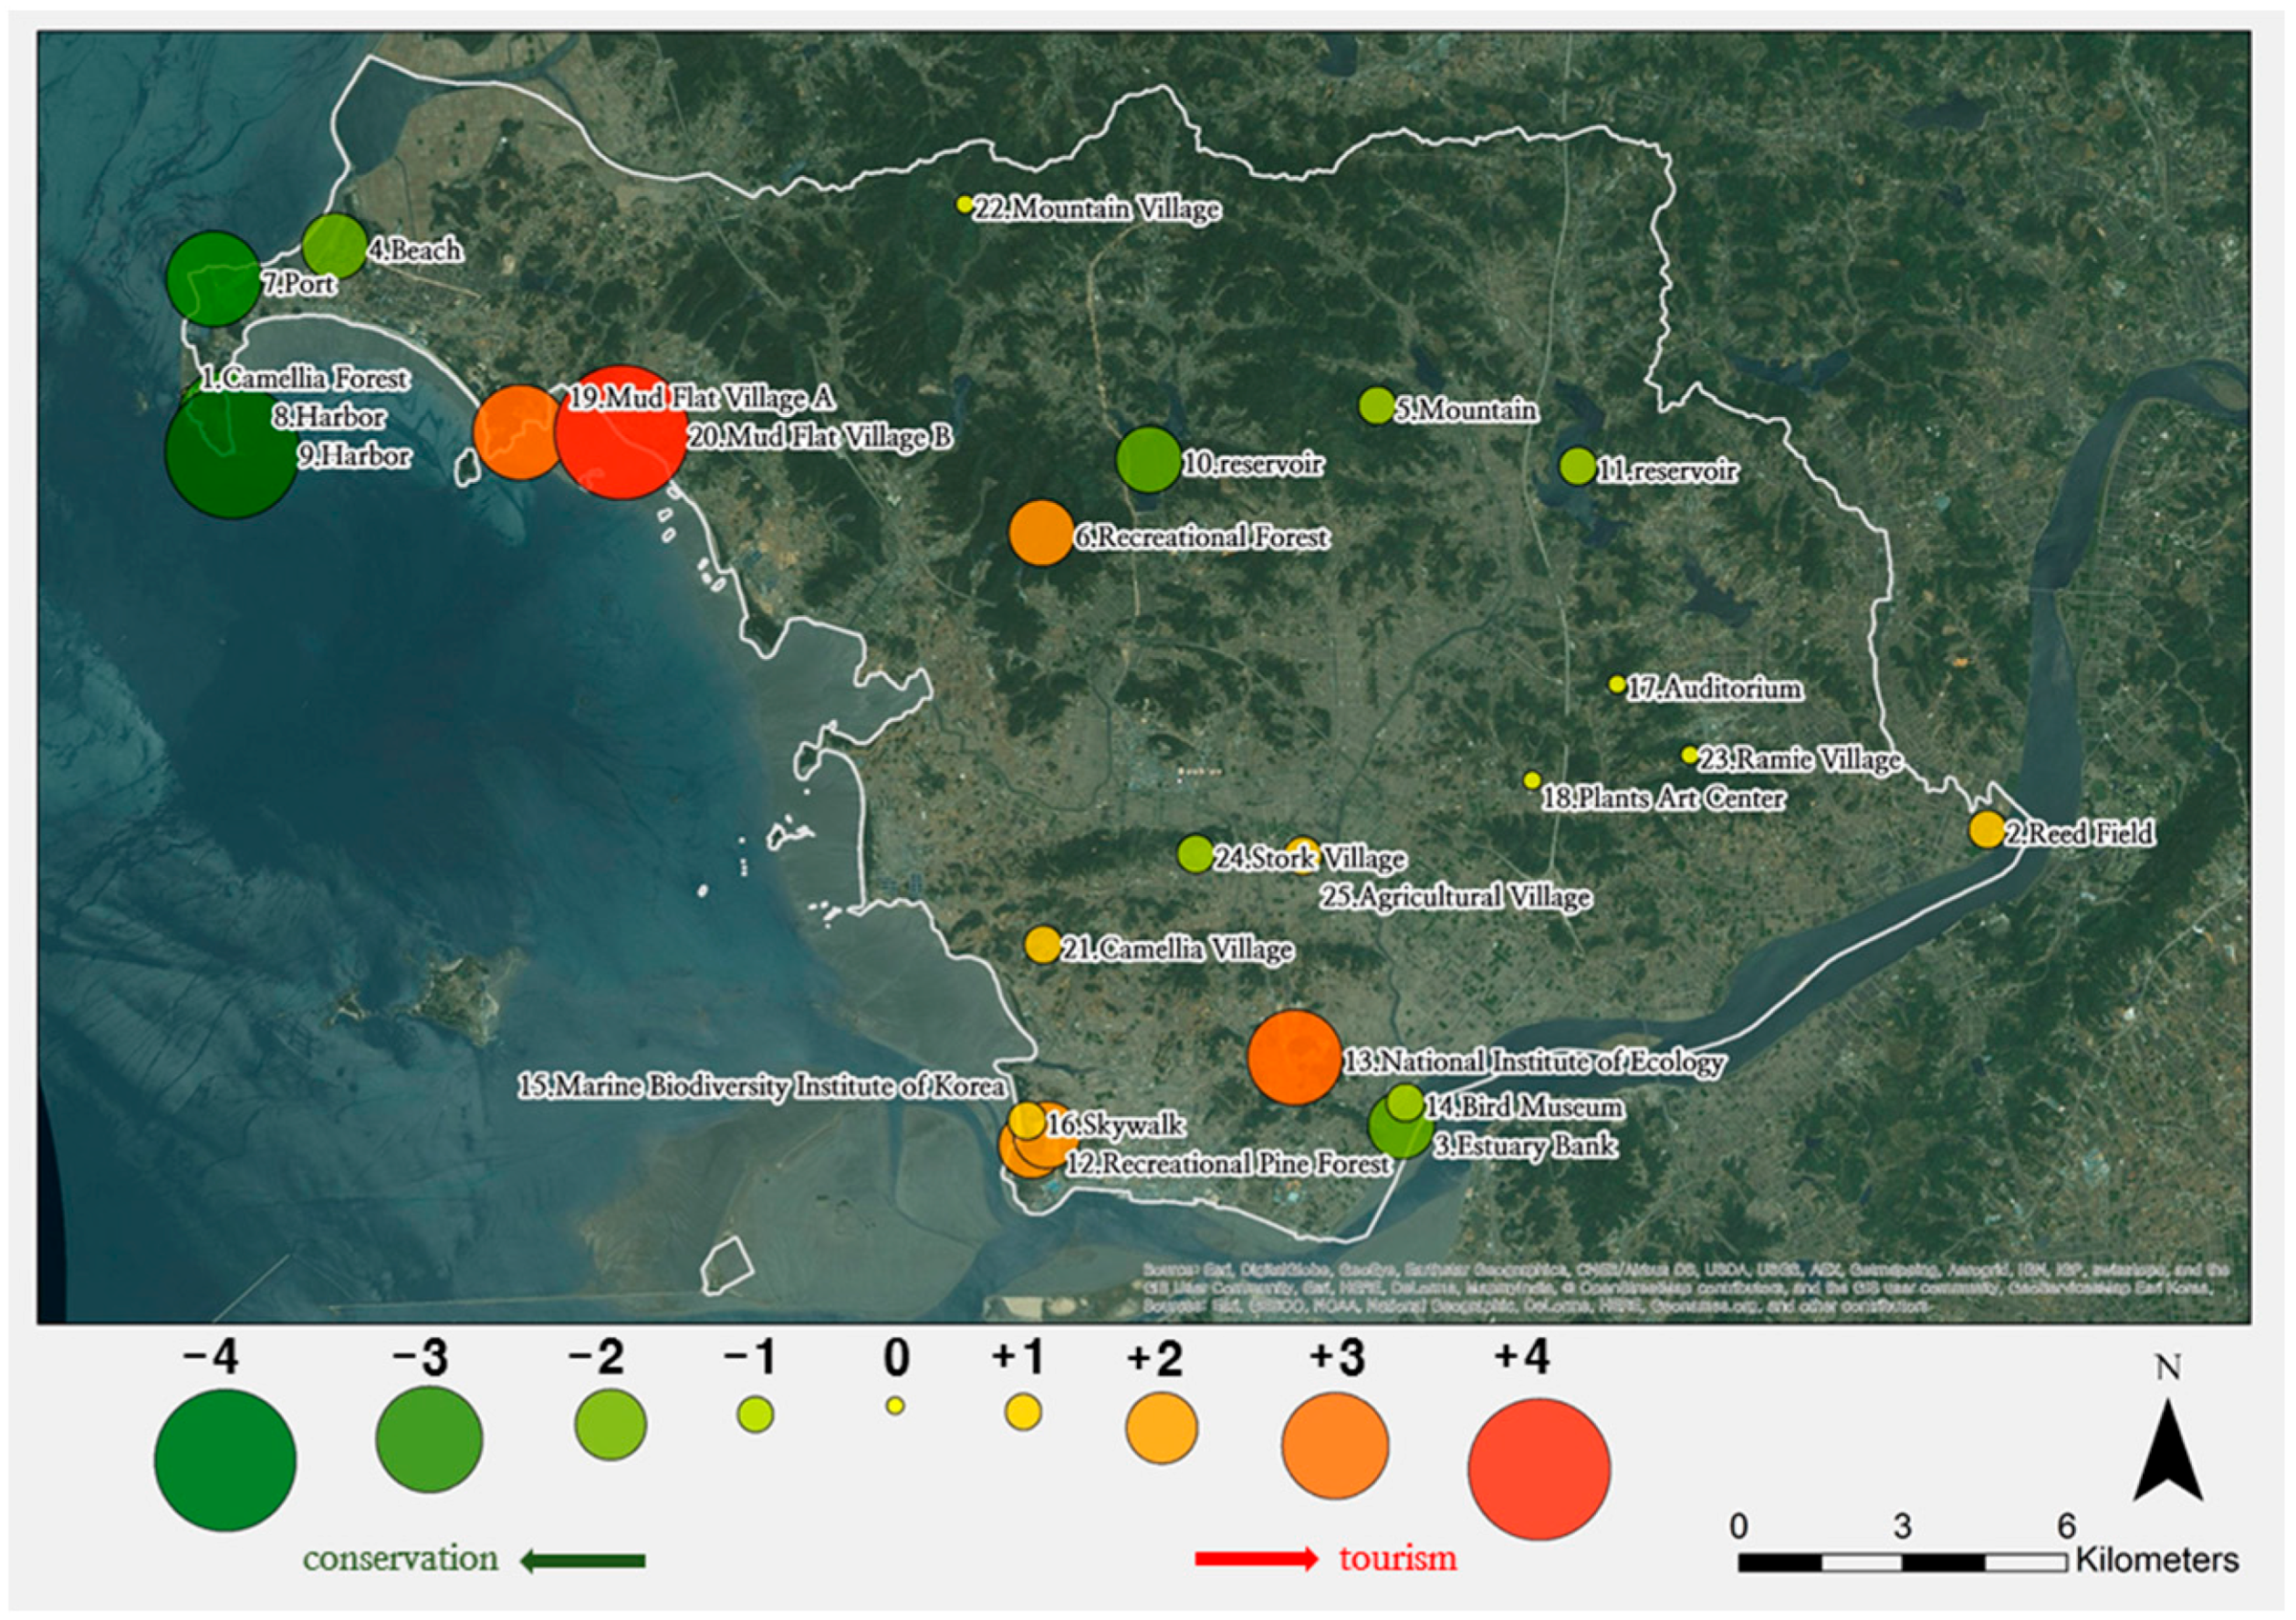
Factor 2 indicates the perspective in which mud-flat ecotour villages were preferred. The reactions to mud-flat ecotour villages, recreational pine forests around the beach and so forth were positive, while the space that functions as a harbour was not considered as a potential ecotourism region. Additionally, the stakeholders wanted ecotourism development of the National Institute of Ecology, which emerged as a hub of ecotourism. An official who was clustered into this factor said, “Registering Seocheon mud flats at UNESCO is a way to develop our Seocheon ecotourism”, thus stressing the importance of mud flats (see Figure 8).
Figure 8.
Mapping of factor 2.
4.3. Factor 3: Focus on Inland Local Ecotour Villages
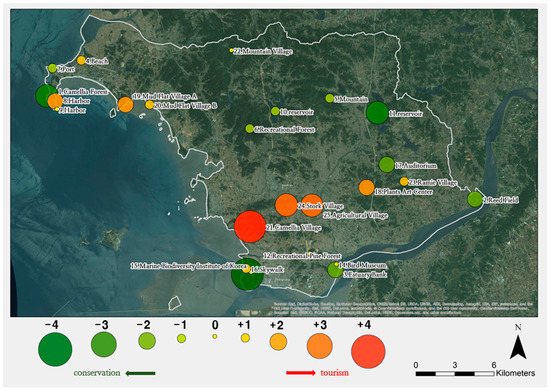
Factor 3 indicates the plan to develop inland local ecotour villages as ecotourism sites. This factor shows a high level of interest in ecological resources such as local inland wild flowers and hills. In contrast, the ecotourism development of coastal sites, such as recreational pine forest around the nearby beach and the Bird Museum, was disliked, while the development of mud-flat ecotour villages was viewed somewhat positively. A director of environment at an NGO who was clustered into this factor said, “I would really like it if many cultural experience programs in which local residents provide education are vitalised so that local residents gain economic benefits and tourists learn about nature and the local culture” (see Figure 9).
Figure 9.
Mapping of factor 3.
4.4. Factor 4: Focus on Local Traditional Villages
Factor 4 indicated the plan to vitalise the local traditional spaces. The stakeholder strongly wanted to develop ecotourism in the auditorium and Ramie Village. Additionally, there was a strong opinion in favour of conserving the Bird Museum. They believed that natural resources should be conserved and ecotourism should be vitalised by using traditional resources. A local resident who was clustered into this factor said, “Ecotourism should be developed with the themes known only in Seocheon but not in other coastal areas” (see Figure 10).
Figure 10.
Mapping of factor 4.
5. Discussion
5.1. Stakeholder Position: Comparison of Factors
In factor 1, all the interpreters and at least one of each stakeholder were included. This indicates that the perspective of factor 1 (large-scale ecotourism resources and facilities) is popular. Officials were scattered among three factors; this indicates variety in their ideas, which need adjustment for cooperation. Moreover, factor 4 has only one resident, which indicates that the perspective of factor 4 is unique (see Table 4).
Table 4.
Stakeholders in each factor.
5.2. Collaboration Way: Means and Variances of Space Preferences
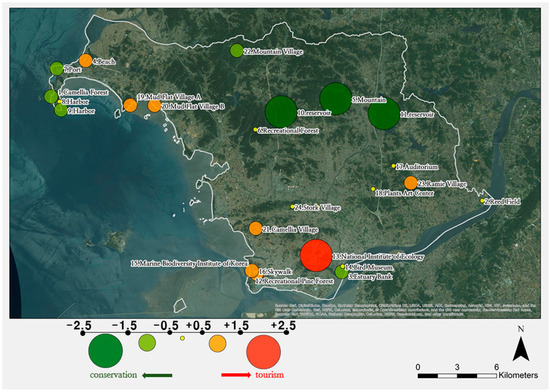
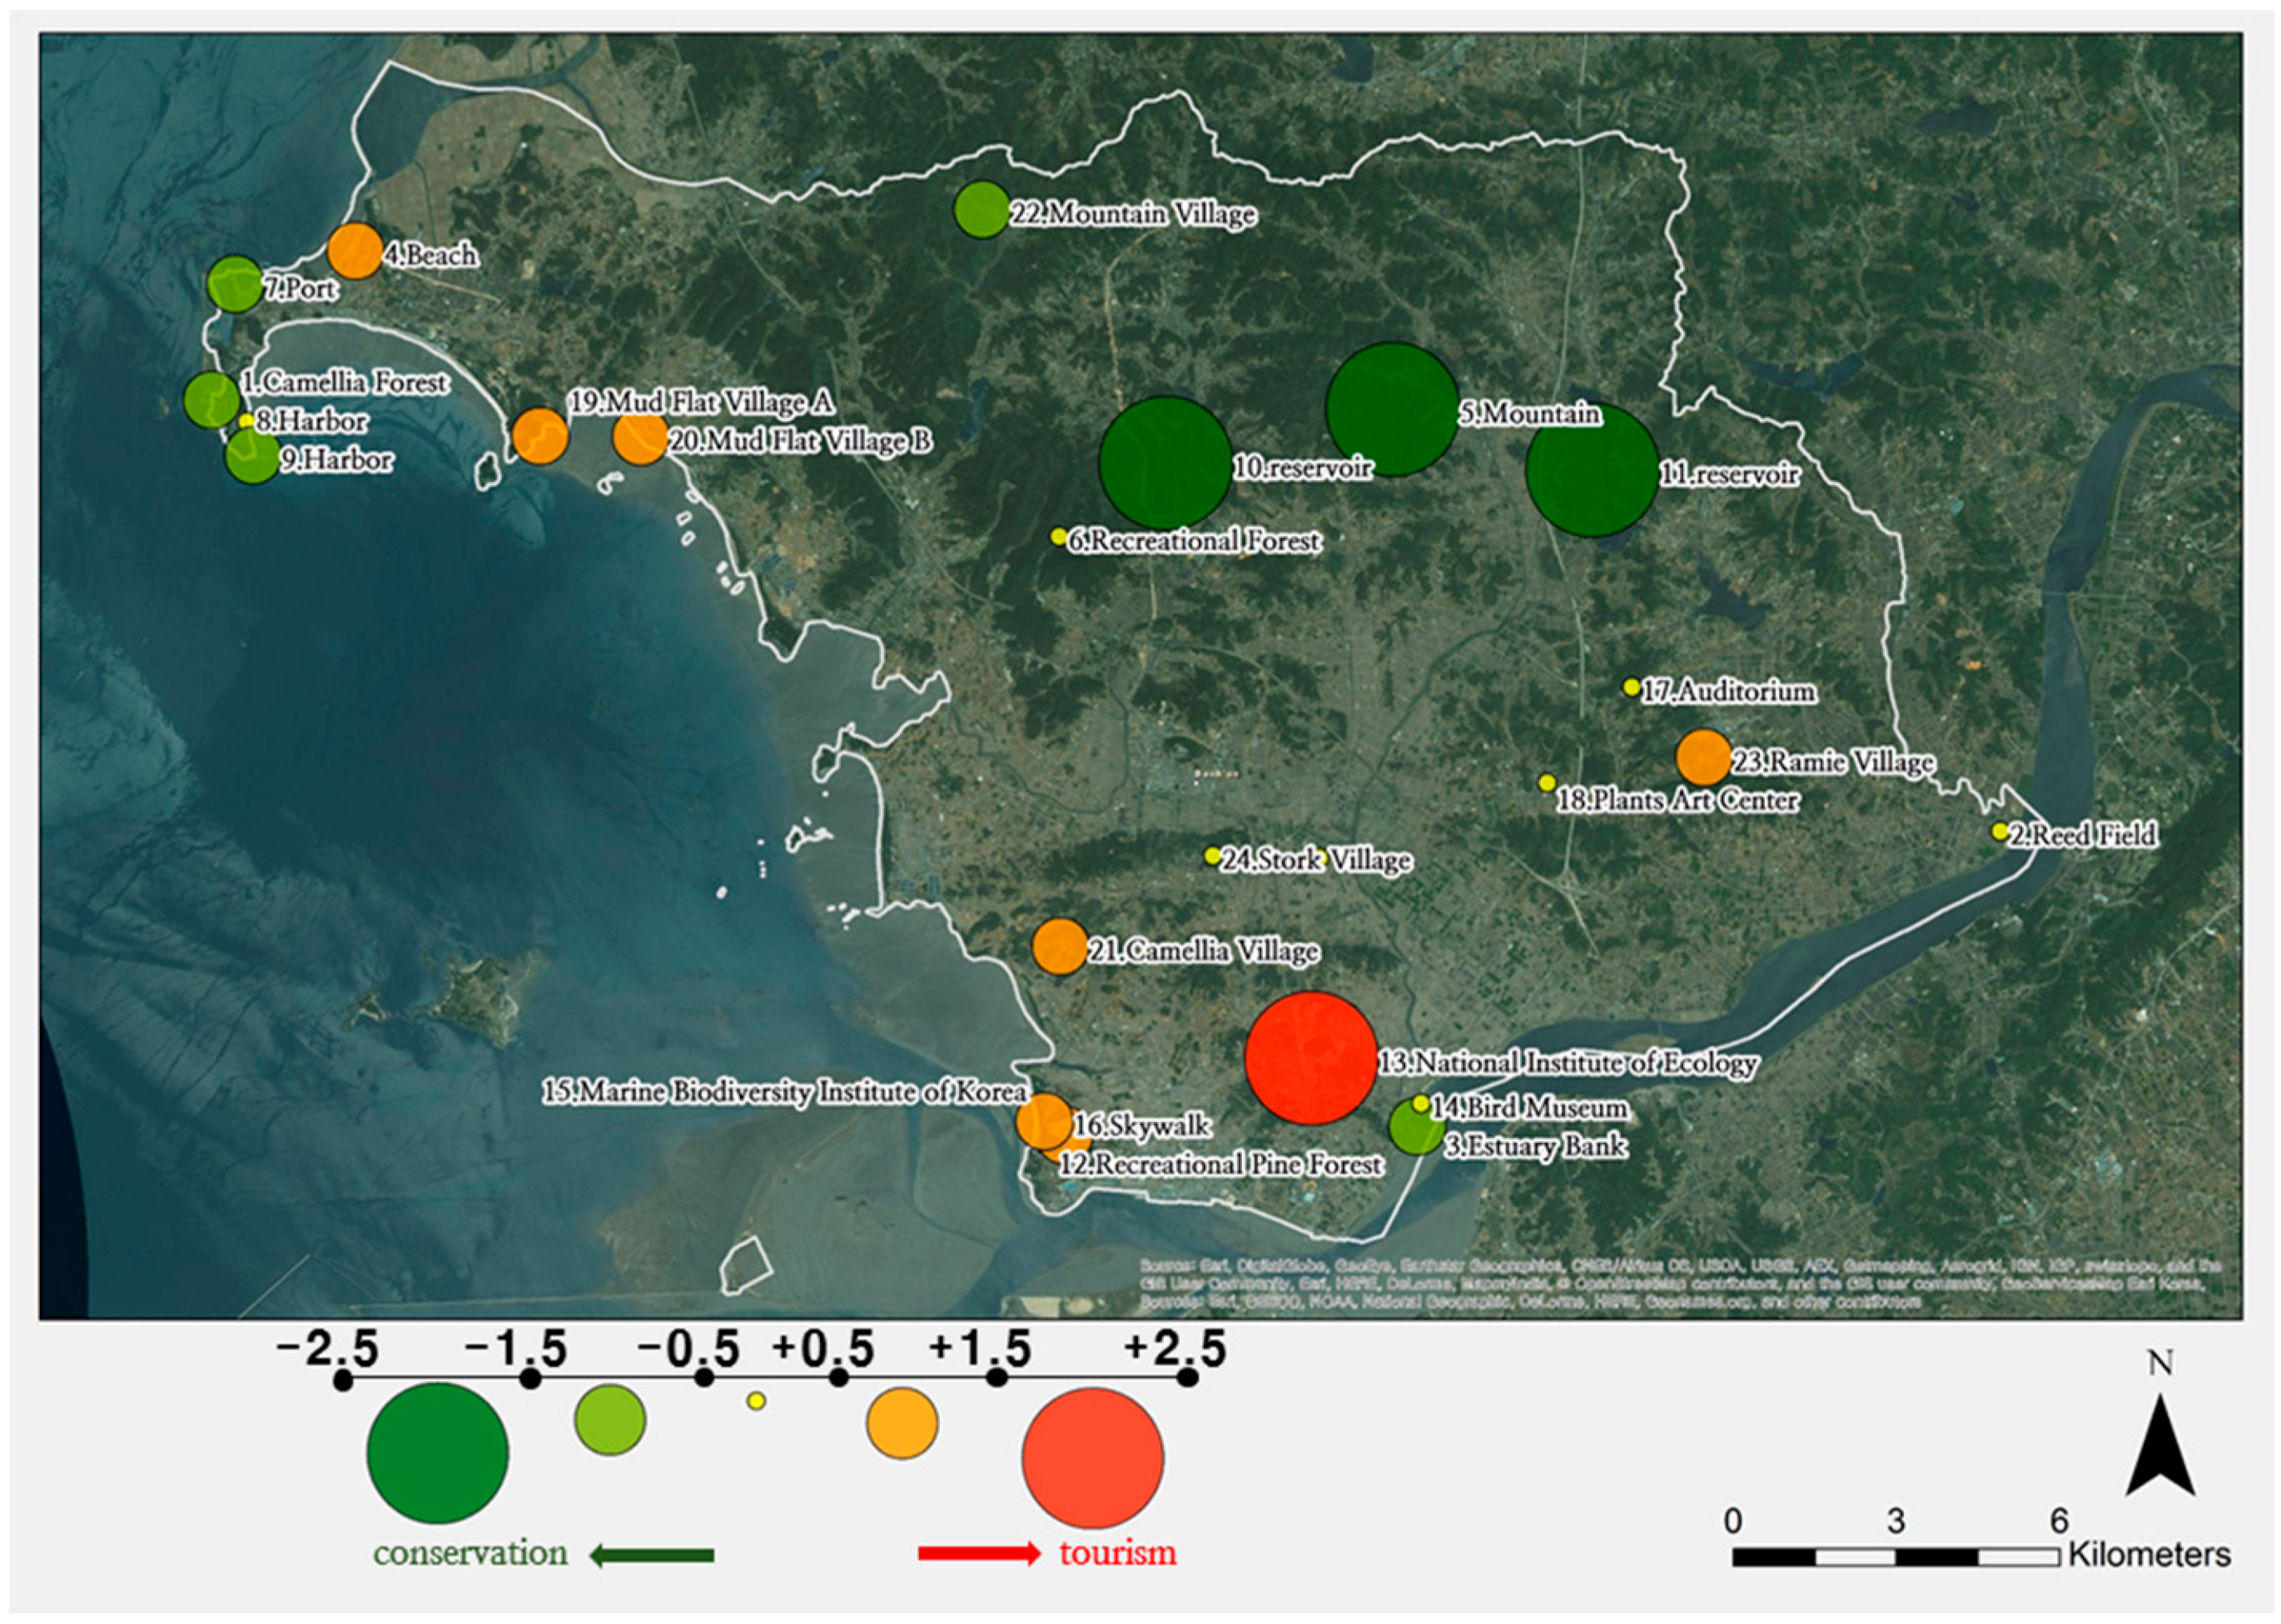
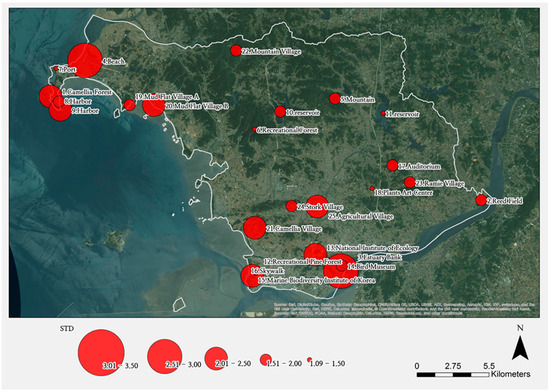
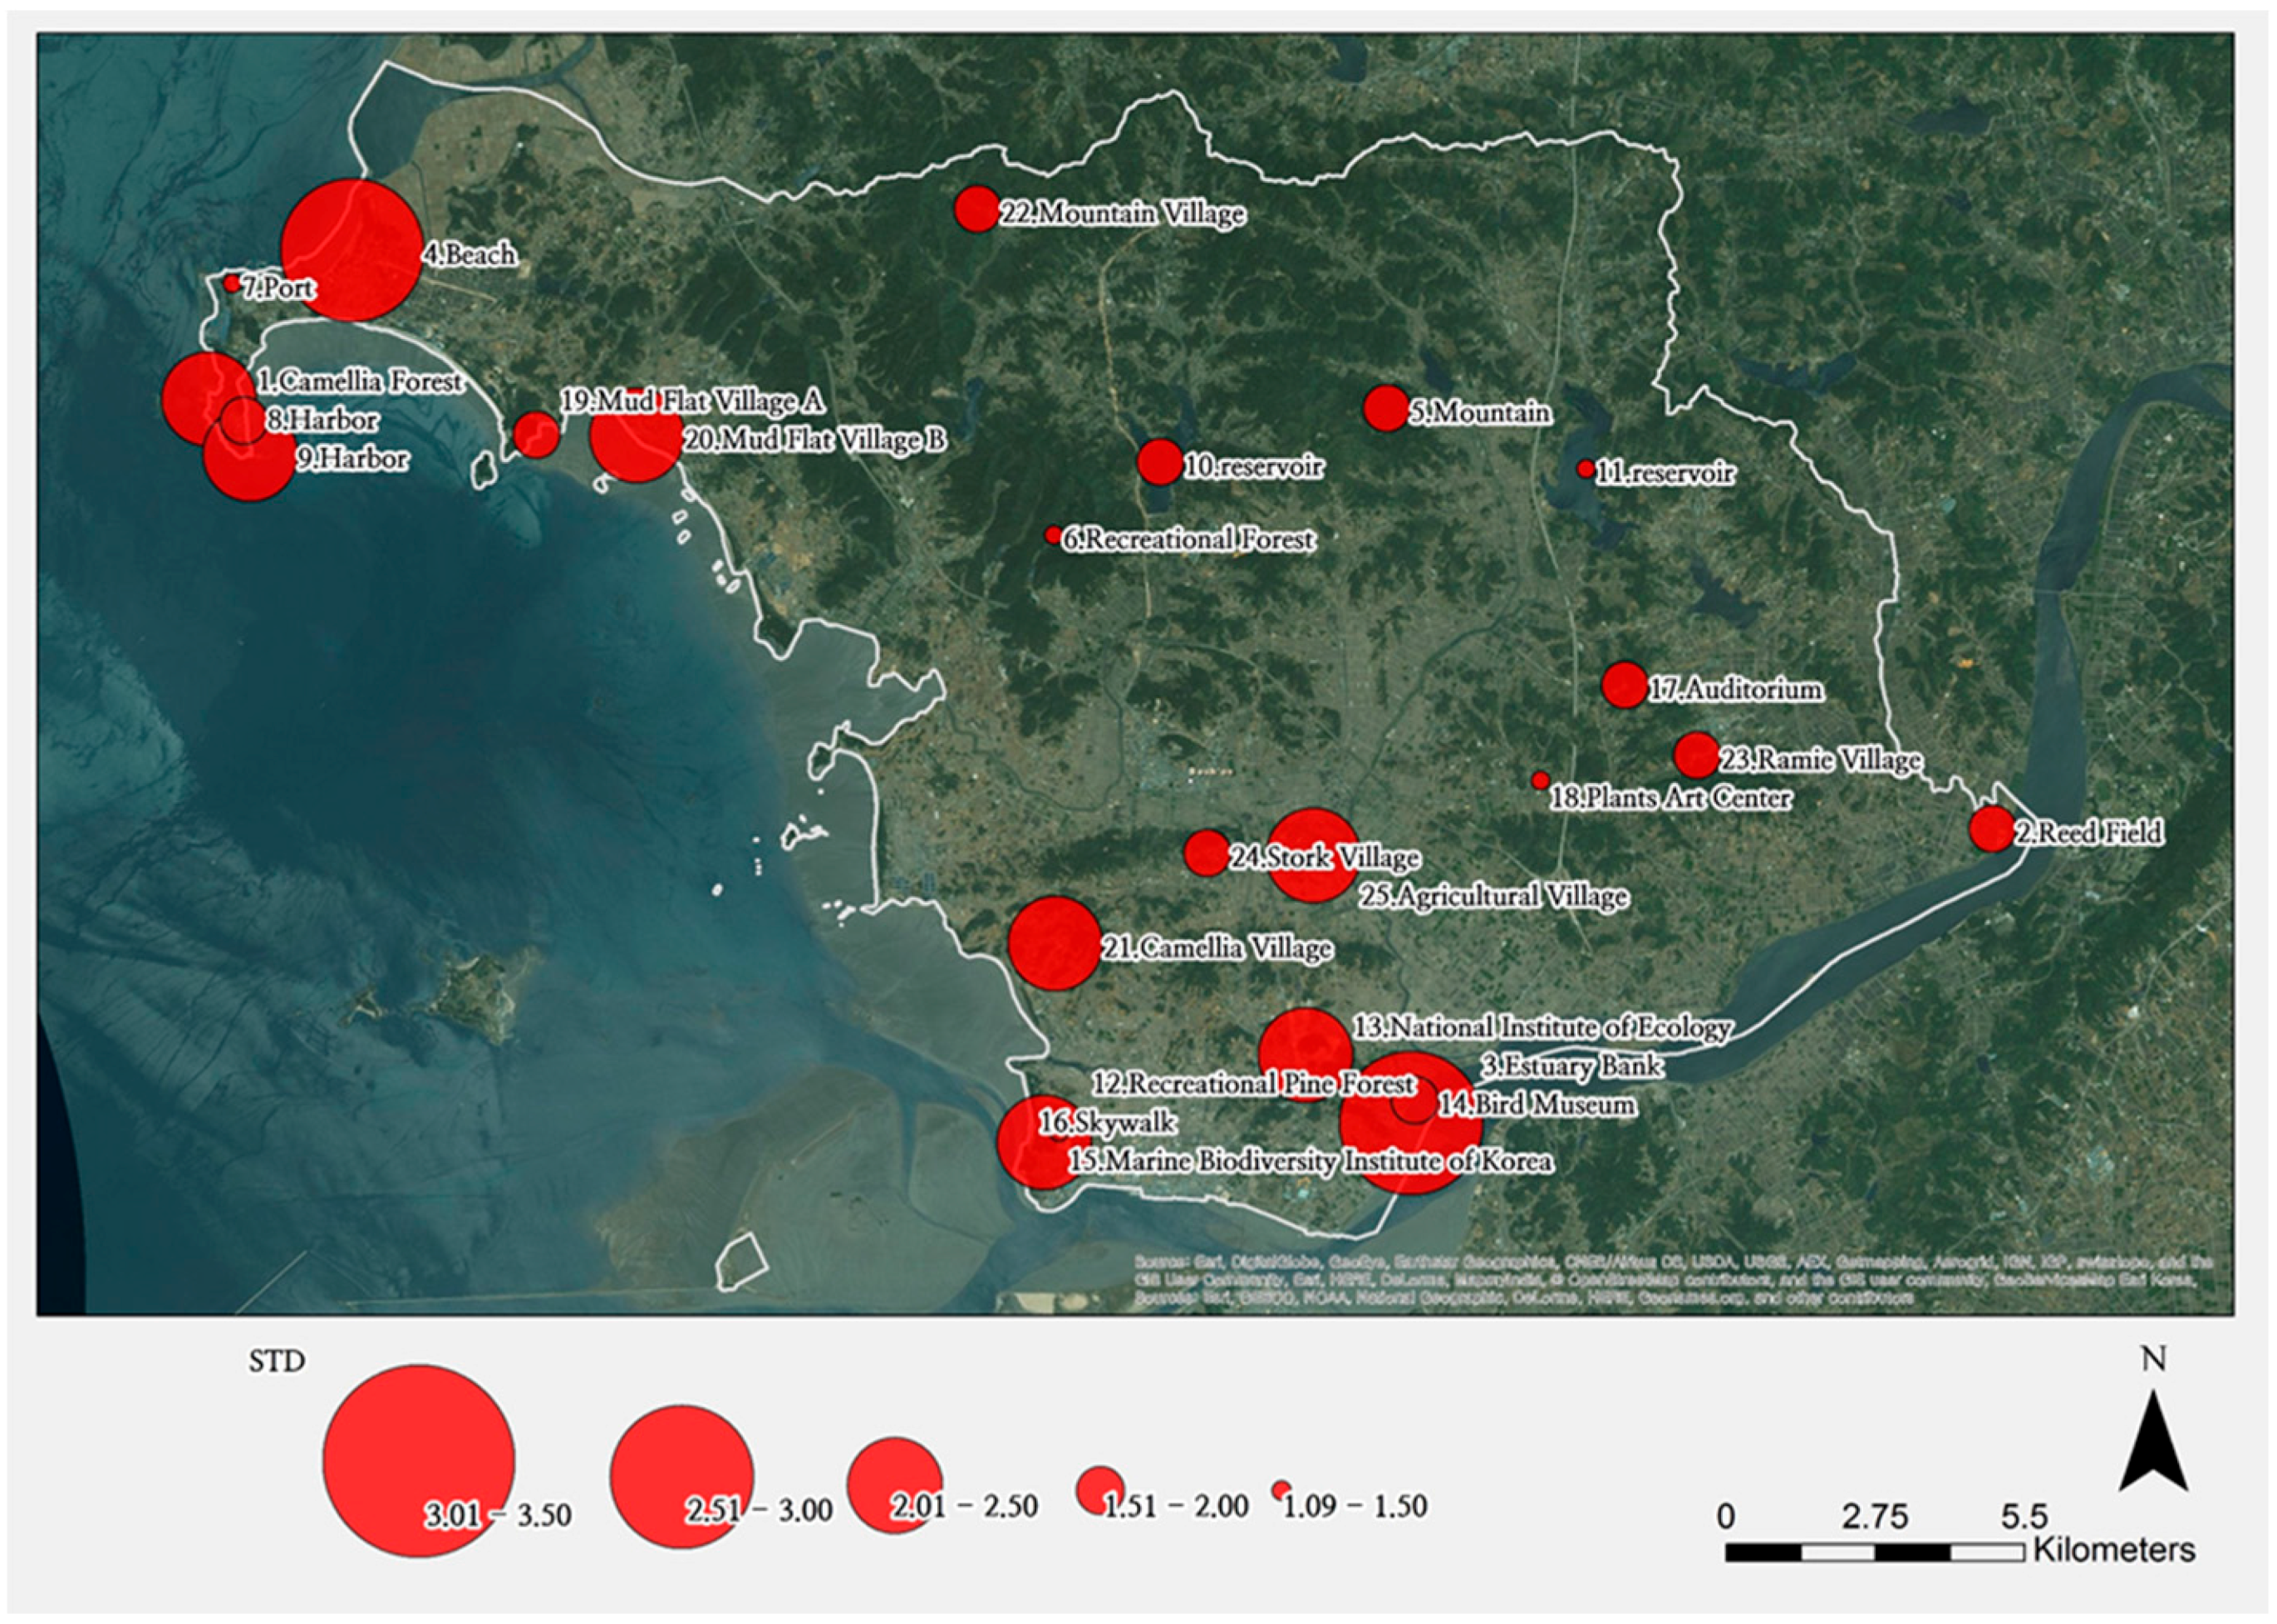
To investigate the overall trend, the means and variances of space preferences of the four factors were calculated (see Table 5). The mean helps examine the overall preference of a space, and the variance helps determine where a preference gap is large. The results were also mapped (see Figure 11 and Figure 12).
Table 5.
Mean and variation of each factor.
Figure 11.
Mean of each factor.
Figure 12.
Standard deviation of each factor.
The opinion regarding inland local reservoirs was generally to conserve them, while the opinion regarding ecotourism development of the National Institute of Ecology and the main ecotour villages was positive. In other words, stakeholders were against ecotourism development in inland regions, which suggests a need to conserve the inland local reservoirs around which many local residents live.
Additionally, a main perception gap was observed in the coastal area, indicating diverse interests in the coastal region. This finding suggests a need for a design solution that maximally reflects the opinions of various stakeholders regarding the coastal area.
6. Conclusions
This study examined the perspectives regarding ecotourism development and found that there was preference towards focusing on large-scale ecotourism resources and facilities, mud-flat ecotour villages, inland ecotour villages and local traditional ecotour villages. These results are of significance because they spatially classify ecotourism sites, which are better subjects for cooperation than grouping close ecotourism sites [22,23]. In addition, this study identified spaces for conservation in which local residents actually live, such as reservoirs and harbours [1], and formed a consensus regarding an ecotourism plan for the coastal area [24].
This result goes beyond creating an ecotourism plan that simply groups close sites together: it also links ecotourism themes, asserts that the spaces around which local residents live should be considered and reflects local residents’ interests, a result that cannot be obtained using only physical environmental data. Because ecotour sites are public goods, benefits should be given to everyone in a tradeoff between development and conservation [16]. Numerous studies have analysed the opinions of local residents and stakeholders of ecotour sites, but this study has particular significance because alternatives for collaboration planning are suggested based on mapping. Nonetheless, this study focused only on stakeholders’ interests, and is thus limited because these interests were not linked with existing physical environmental data. Because physical environmental data is also an important element in gaining a perspective on ecotour sites, we anticipate that for future ecotour site spatial planning, a fusion map study will be conducted in which physical environmental data and interest data are combined.
Acknowledgments
This work was supported by the National Institute of Ecology in Korea (Project number: NIE-Strategy research—2016-04).
Author Contributions
Jae-hyuck Lee designed and structured the article and mapping was performed by Sung-hoon Kim. Hyuk-soo Kwon provided expertise in discussing the design proposals and conclusions. This article was improved by co-authors at various stages of the writing process.
Conflicts of Interest
The authors declare no conflict of interest.
References
- Tsaur, S.-H.; Lin, Y.-C.; Lin, J.-H. Evaluating ecotourism sustainability from the integrated perspective of resource, community and tourism. Tour. Manag. 2006, 27, 640–653. [Google Scholar] [CrossRef]
- Wall, G. FORUM: Is ecotourism sustainable? Environ. Manag. 1997, 21, 483–491. [Google Scholar] [CrossRef]
- Albritton, R.; Stein, T.V. Integrating social and natural resource information to improve planning for motorized recreation. Appl. Geogr. 2011, 31, 85–97. [Google Scholar] [CrossRef]
- Tomczyk, A.M.; Ewertowski, M. Planning of recreational trails in protected areas: Application of regression tree analysis and geographic information systems. Appl. Geogr. 2013, 40, 129–139. [Google Scholar] [CrossRef]
- Lee, J.-H.; Son, Y.-H. Stakeholder subjectives toward ecotourism development using Q methodology: The case of Maha ecotourism site in Pyeongchang, Korea. Asia Pac. J. Tour. Res. 2016, 21, 931–951. [Google Scholar] [CrossRef]
- Bunruamkaew, K.; Murayam, Y. Site suitability evaluation for ecotourism using GIS & AHP: A case study of Surat Thani province, Thailand. Procedia Soc. Behav. Sci. 2011, 21, 269–278. [Google Scholar]
- Nahuelhual, L.; Carmona, A.; Lozada, P.; Jaramillo, A.; Aguayo, M. Mapping recreation and ecotourism as a cultural ecosystem service: An application at the local level in Southern Chile. Appl. Geogr. 2013, 40, 71–82. [Google Scholar] [CrossRef]
- Berkes, F. Sacred Ecology, 3rd ed.; Routledge: New York, NY, USA, 2012; pp. 139–159. [Google Scholar]
- Kerstetter, D.; Bricker, K. Exploring Fijian’s sense of place after exposure to tourism development. J. Sustain. Tour. 2009, 17, 691–708. [Google Scholar] [CrossRef]
- Maynard, C.M. Accessing the environment: Delivering ecological and societal benefits through knowledge integration—The case of water management. Appl. Geogr. 2015, 58, 94–104. [Google Scholar] [CrossRef]
- Fagerholm, N.; Käyhkö, N.; Ndumbaro, F.; Khamis, M. Community stakeholders’ knowledge in landscape assessments—Mapping indicators for landscape services. Ecol. Indic. 2012, 18, 421–433. [Google Scholar] [CrossRef]
- Sherrouse, B.C.; Clement, J.M.; Semmens, D.J. A GIS application for assessing, mapping, and quantifying the social values of ecosystem services. Appl. Geogr. 2011, 31, 748–760. [Google Scholar] [CrossRef]
- Watts, S.; Stenner, P. Doing Q methodology: Theory, method and interpretation. Qual. Res. Psychol. 2005, 2, 67–91. [Google Scholar] [CrossRef]
- Hunter, W.C. Understanding resident subjectivities toward tourism using Q method: Orchid Island, Taiwan. J. Sustain. Tour. 2013, 21, 331–354. [Google Scholar] [CrossRef]
- Rodriguez-Piñeros, S.; Focht, W.; Lewis, D.K.; Montgomery, D. Incorporating values into community-scale sustainable forest management plans: An application of Q methodology. Small Scale For. 2012, 11, 167–183. [Google Scholar] [CrossRef]
- Rodríguez-Piñeros, S.; Mayett-Moreno, Y. Forest owners’ perceptions of ecotourism: Integrating community values and forest conservation. Ambio 2015, 44, 99–109. [Google Scholar] [CrossRef] [PubMed]
- Brown, S.R. Q methodology and qualitative research. Qual. Health Res. 1996, 6, 561–567. [Google Scholar] [CrossRef]
- Hawthorne, T.; Krygier, J.; Kwan, M.-P. Mapping ambivalence: Exploring the geographies of community change and rails-to-trails development using photo-based Q method and PPGIS. Geoforum 2008, 39, 1058–1078. [Google Scholar] [CrossRef]
- Forrester, J.; Cook, B.; Bracken, L.; Cinderby, S.; Donaldson, A. Combining participatory mapping with Q-methodology to map stakeholder perceptions of complex environmental problems. Appl. Geogr. 2015, 56, 199–208. [Google Scholar] [CrossRef]
- O’Leary, K.; Wobbrock, J.O.; Riskin, E.A. Q-Methodology as a Research and Design Tool for HCI. In Proceedings of the SIGCHI Conference on Human Factors in Computing Systems, Paris, France, 27 April–2 May 2013; pp. 1941–1950.
- Pike, K.; Wright, P.; Wink, B.; Fletcher, S. The assessment of cultural ecosystem services in the marine environment using Q methodology. J. Coast. Conserv. 2015, 19, 667–675. [Google Scholar] [CrossRef]
- Navrátil, J.; Pícha, K.; Knotek, J.; Kučera, T.; Navrátilová, J.; Rajchard, J. Comparison of attractiveness of tourist sites for ecotourism and mass tourism: The case of waters in mountainous protected areas. Tourismos 2013, 8, 35–51. [Google Scholar]
- Arnegger, J.; Woltering, M.; Job, H. Toward a product-based typology for nature-based tourism: A conceptual framework. J. Sustain. Tour. 2010, 18, 915–928. [Google Scholar] [CrossRef]
- Simpson, S.; Brown, G.; Peterson, A.; Johnstone, R. Stakeholder perspectives for coastal ecosystem services and influences on value integration in policy. Ocean. Coast. Manag. 2016, 126, 9–21. [Google Scholar] [CrossRef]



© 2017 by the authors; licensee MDPI, Basel, Switzerland. This article is an open access article distributed under the terms and conditions of the Creative Commons Attribution (CC-BY) license (http://creativecommons.org/licenses/by/4.0/).