Article

Sprawl Dynamics in Rural–Urban Territories Highly Suited for Wine Production. Mapping Urban Growth and Changing Territorial Shapes in North-East Italy

by
Luca Simone Rizzo
1,*,
Filippo Smerghetto
2,
Maria Giuseppina Lucia
3 and
Raffaela Gabriella Rizzo
4
1
Dipartimento di Scienze Politiche, Giuridiche e Studi Internazionali, Università di Padova, Via del Santo, 28-35123 Padova, Italy
2
Senvion Chile, Av. Apoquindo 4800 piso 20, Las Condes, 7560969 Santiago, Chile
3
Dipartimento Interateneo di Scienze, Progetto e Politiche del Territorio, Università di Torino, Viale Pier Andrea Mattioli, 39-10125 Torino, Italy
4
Facoltà di Lettere e Filosofia, Università Cattolica del Sacro Cuore, Via Trieste, 17-25121 Brescia, Italy
*
Author to whom correspondence should be addressed.
Sustainability 2017, 9(1), 116; https://doi.org/10.3390/su9010116
Submission received: 25 October 2016 / Revised: 31 December 2016 / Accepted: 5 January 2017 / Published: 14 January 2017

Abstract

:
In Italy, large-scale changes in the structure of land use can be observed. These are caused primarily by socio-economic pressures, generally determining the conversion of agricultural land into artificial surfaces. Our aim was to investigate if and how sprawl dynamics influence viticultural landscapes (that is, if they result in scattered, intermediate, or compact urban developments). We focused on selected territories in North-East Italy, where vine-growing provides almost uninterrupted land cover, as case study areas. Using GIS-based techniques, we documented the processes of land use, analyzing the resulting changes of urban-rural forms and in territorial shapes. Results at the Provincial level showed decreasing dispersed artificial surfaces and increasing clustered urban developments. This trend is also detected in areas under vine, but in general is more modest. Our research indicates that typical agricultural productions can determine resistance to the alienation of land, maintaining a sufficient consistency for areas to develop in a more varied and articulated (for example touristic) manner.

1. Introduction

In the EU and worldwide, excessive urban sprawl [1] (p. 6), [2,3,4,5,6] has led to an increase in land-take. The process involves in particular the transformation of agricultural and natural areas through the construction of buildings and infrastructures, and for decades has been generally associated with low building density and high fragmentation/dispersion of artificial surfaces. Such land use and cover change (LUCC) is in turn strongly linked to soil sealing and landscape degradation [7,8], as well as to altering rural–urban relationships. To limit such phenomena, the European Commission produced specific guidelines [9]. Researchers have focused on understanding the drivers of such developments [10,11,12,13,14,15,16,17,18,19]. Most studies identify the following as the main causes: (a) residential decentralization processes; (b) depolarization and relocation of industries and services; (c) administrative fragmentation (resulting at municipal level in the lack of appropriate skills to design policies oriented towards local and regional sustainability, as well as in poor bargaining power with regard to private investors); and (d) land rent-related issues (see Bencardino for a review of the literature [20]).
Recently, land-take in Italy has been documented at an average of 8 m2 per second, rising from 2.8% in 1956 to 6.9% in 2010; thus more than 20,500 km2 have already been lost [21] (p. 20), [22] (pp. 19–20). Consistently with what we have said above, this change is linked to drivers that are mostly socio-economic in nature, and is clearly reflected in: (a) the “reckless” expansion of artificial surfaces (a chronic disease, due to opportunistic resource exploitation and extraction of value rather than long-term management and care of the land); (b) more unraveled urban and rural forms; and (c) the gradual transformation of spontaneous as well as cultivated land [23,24,25]. Our case study area is the Veneto Region in North-East Italy; it is particularly interesting for research purposes as population pressure and economic development have acted, and still act, as major drivers of change in land use and in settlement forms. Past territorial transformation processes have, in fact, caused an expansion of urban systems and created dispersed settlements, somewhere between urban and rural in type. The character of major infrastructural, residential, commercial and manufacturing developments poses a great challenge to the possibility of maintaining or restoring the organicity of the landscape as well as of urban and rural forms, and in the dialectic behind related processes.
Understanding innovative approaches to local sustainable development is at the core of studies focusing on rural communities and on the role of natural and cultural assets. Here, we refer to approaches grounded in the so-called resource-based theory, originally offering an alternative view of economic development in which a foundation of resources within a region gestates entrepreneurial activity. This view has initially been applied at the business unit level of analysis [26] and, subsequently, to new venture organizations [27] (p. 5). In addition, tourism studies have borrowed from this, arguing the need to foster a resource-based model of (local) development, which draws from deeply-rooted territorialized natural and cultural resources and values [28]. Cultural landscapes, for example viticultural sceneries, are seen as possibly acting as an avant-garde of this “revolution”: a vehicle via which territorial valorization strategies convey uniqueness and typicalities connecting terroir [29] and territorialities [30]. As Pitte [31] would say, referring explicitly to this “terroir physique et humain”, one could promote a wide range of (network) products that are unique and different and in healthy competition with each other. A key component of this model would be to make the consumer experience a closer relationship with places of which such products are an expression, as well as with associated historical memories, cultures, environments, know-hows, etc. Cultural landscapes, indeed, are central to this discourse as they can deliver or support important socio-cultural services such as aesthetic values or recreation and tourism [32]. As Antrop [3] reminds us, they are thought to be the result of consecutive reorganization of the land in order to better adapt its use and spatial structure to changing societal demands. Particularly in Europe, such alterations are seen as a menace because they cause a loss of diversity, coherence and identity, which should be characteristics of traditional cultural landscapes [32].

1.1. Objectives

Based on the theoretical premises illustrated, this work is intended to characterize the relationship between sprawl and landscape dynamics in the rural–urban areas investigated (Section 1.2). The development strategies and economy of these areas are heavily based on typical products that are mainly of great qualitative value, such as wine. Studying if and how suitability for growing wine grapes interacts with land use dynamics—having conflicting outcomes regarding the landscape or, conversely, preventing them—has become imperative, given the significance of the sector. Wine landscapes are often rich and unique, reflecting and shaping (strong) local identities. They represent tangible and visible displays of multi-faceted territorial identities evoking genius loci as well as terroirs. They are closely linked to both soils and the grape varieties being grown, and are therefore not reproducible in different geographical contexts from those in which they are found. These landscapes represent the basis on which an alternative to modern tourism is developing: a way to experience traditional characters [33,34]. These environments—an asset of particular relevance for the creation of rural images to be conveyed to tourists—can, however, be easily destabilized and despoiled. It is, therefore, clearly relevant to explore if wine landscapes are or have been overshadowed or diminished by contemporary modern methods of land use, examining settlement patterns and territorial shapes [32]. To what extent is the landscape undisturbed overall and kept harmonious? To what extent do changing built-up forms hinder it and its exploitation (for example, tourism-wise)? Does vine-growing help to contain sprawl-related dynamics?
The questions above have been operationalized with the particular aim of:
  • providing a descriptive understanding of the evolution of land use sprawl dynamics and regional scale urbanization in selected territories; and
  • determining the characteristics of urban development processes, i.e., investigating how scattered and geographically interconnected the (new) artificialization is and if/how it impacts on viticultural landscapes.

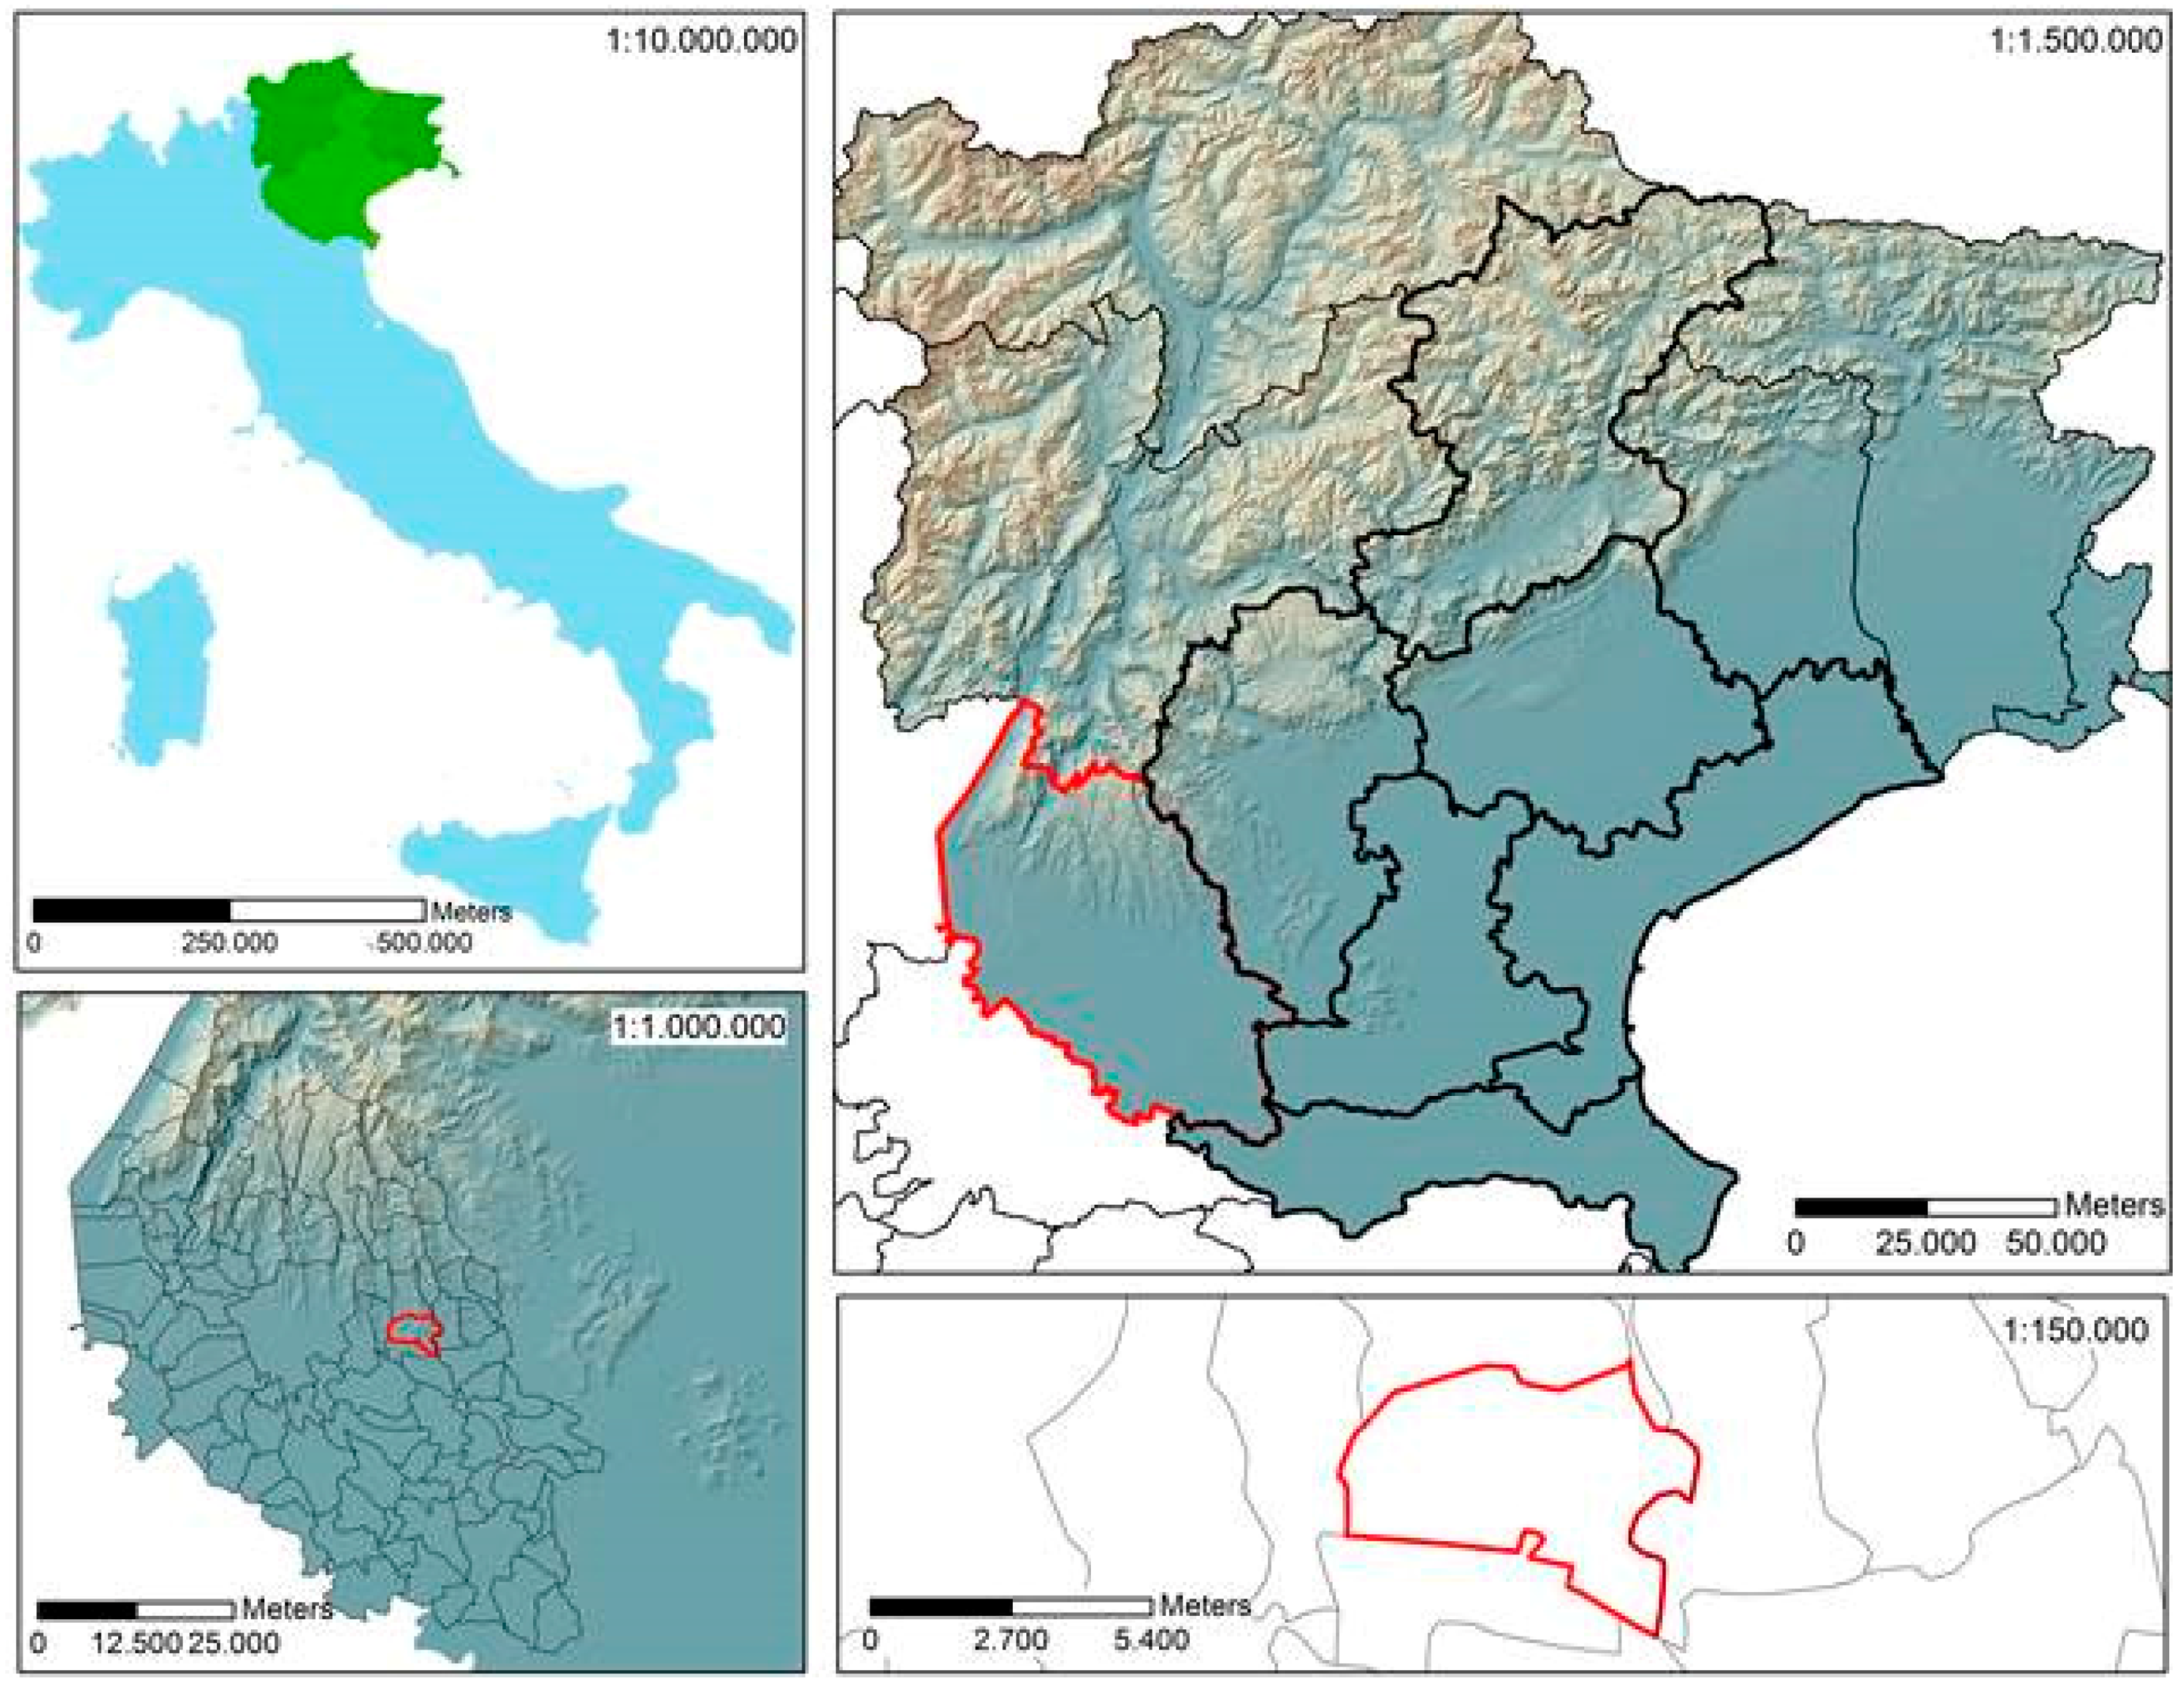
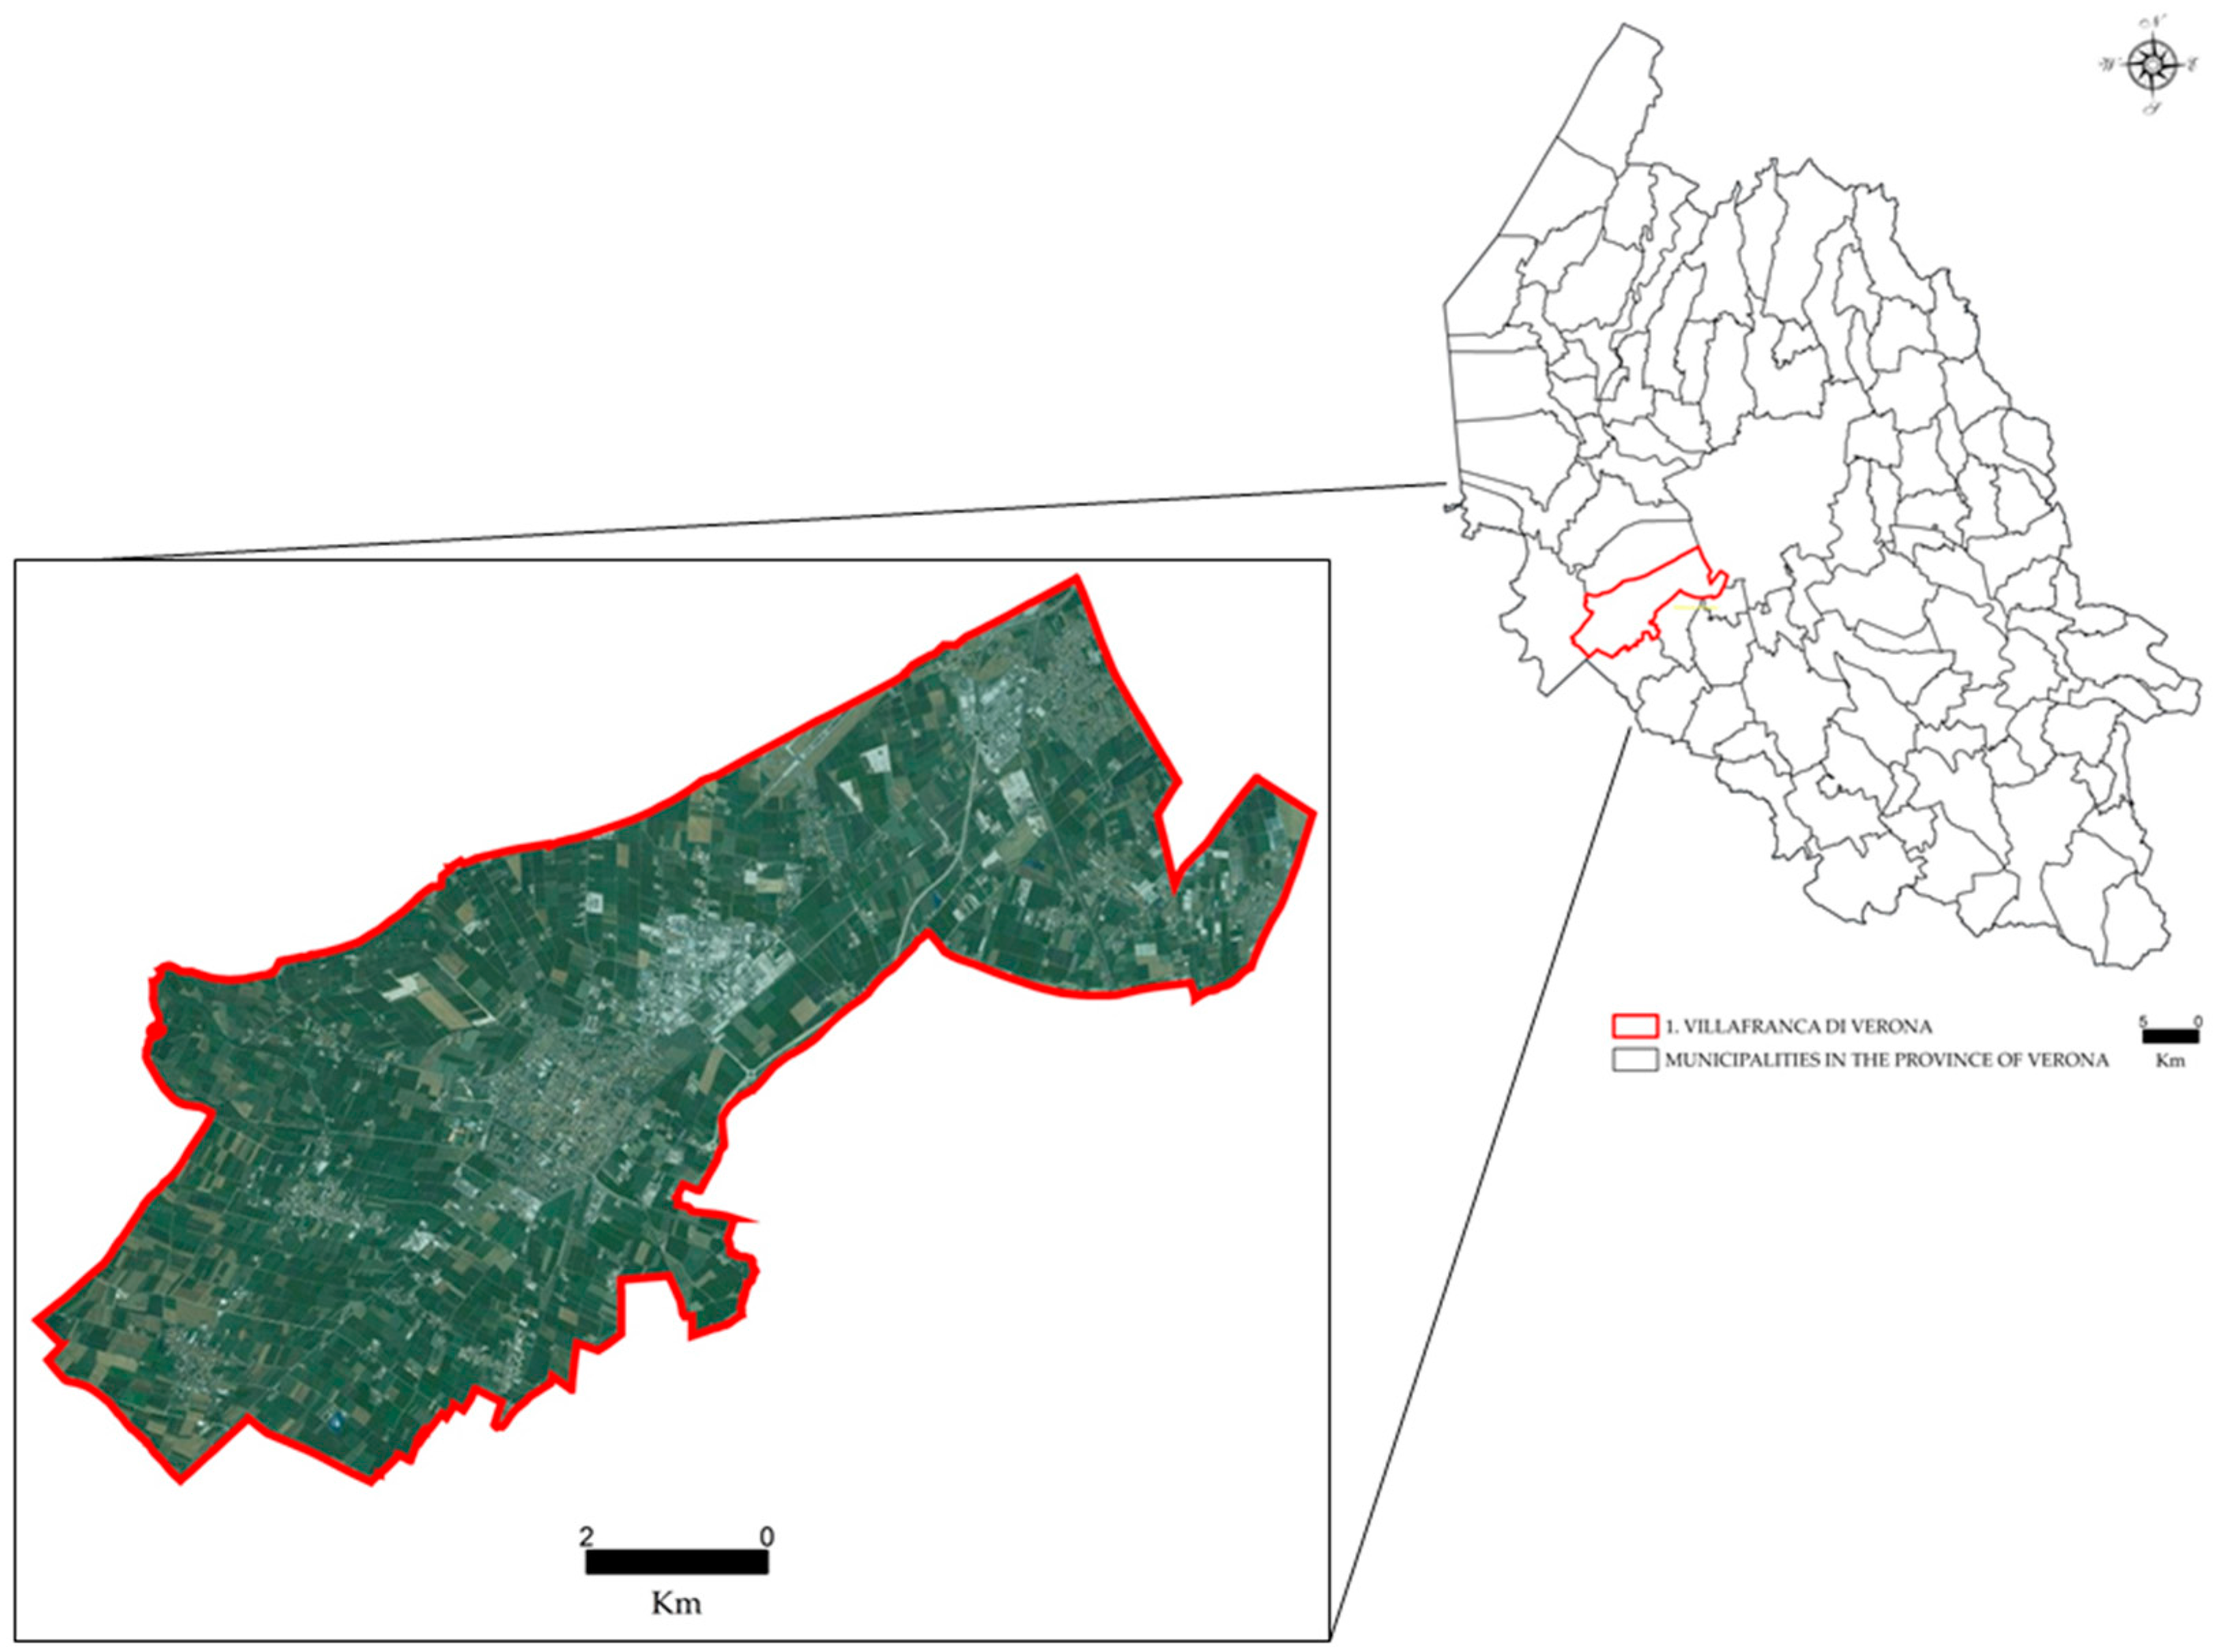
1.2. The Area under Study

The Province of Verona—our study area—is located in the North-East, Italy, which comprises the Veneto, Trentino-Alto Adige and Friuli-Venezia Giulia Regions: the so called Triveneto. This is characterized, from north to south, by a wide mountainous area—alpine, prealpine and hilly—ending in an extensive alluvial plain, once marshy and insalubrious but now completely drained and reclaimed for agricultural use [35]. In this area, a city-region expands seamlessly from West to East (Figure 1).
The Triveneto is largely covered by vineyards [36]. In the study area alone, there are at least ten different Protected Designations of Origin (DOC and DOCG), some of them famous worldwide. From East to West we find the following: Soave, Arcole, Lessini Durello, Valpolicella, Bardolino, Custoza, Lugana, Terra dei Forti, Valdadige and Garda. In this territory, the wine industry has a complete, well-integrated and efficient supply chain. Small-scale, innovative grape-growers coexist with globalized firms.
A good part of the vineyards in these areas are new plantings, as there has been a change in vine training methods from the pergola system to the espalier; the latter allows a greater application of technology in the management of the vineyard, as well as more use of mechanization [37]. The landscape, accordingly, in general shows regular geometric patterns. The vine-growing monoculture is dotted with historical landscape elements—rural courtyards, historic villas, wine cellars, inns, restaurants, and recently renovated buildings—and is densely interspersed with narrow minor roads.

2. Materials and Methods

To respond to the questions posed above and accomplish the stated aims, we opted for a mixed research method. A diachronic analysis was carried out using spatial and geostatistical techniques to produce additional information that could supplement the data derived from the implementation of descriptive bivariate statistics.

2.1. Data Sources Used

We used different types of inventories and datasets, namely:
  • The administrative boundaries of the reference spatial units examined: NUTS 3 (Province of Verona); LAU 2 (municipalities in the Province of Verona) (downloaded in shape format from the geoportal of the Veneto Region).
  • Data at the municipal level released by the Statistics Department of the Veneto Region, drawn from the Italian General Census of Agriculture for the years 1982, 1990, 2000 and 2010. The Italian agricultural census provides harmonized data on agricultural holdings. It also includes information on the number of firms, the use of farming land and the associated areas, the economic size of the holding (the standard output, which represents the value in Euro of the gross output) [38]. Farm structure statistics, therefore, also provide useful insights on viticulture.
  • Land use and land cover data for the years 1983, 1996 and 2006, made available by the Veneto Region in shape format and in 1:10,000 scale. The regional data used for the purpose of this project conform, at the macro class level, to the classification used by the Corine Land Cover (CLC) [39]. The first CLC nomenclature level indicates the major categories of land use and cover: (1) artificial surfaces; (2) agricultural areas; (3) forest and semi-natural areas; (4) wetlands; and (5) water bodies.
  • Data made available by the Veneto Region, in shape format and in 1:10,000 scale, drawn from spatial planning schemes [Piano di Assetto del Territorio (PAT)] at the municipal level for selected and available municipalities only. The databases [40] were of interest to us as they contain land use data in shape format. The PAT, in fact: (a) identifies the maximum amount of agricultural land to be converted into artificial surfaces; (b) defines, for homogeneous territorial areas, the sizing parameters as well as the quantitative and physical limits of settlement developments for residential, industrial, commercial, administrative and tourist purposes, together with the parameters for re-zoning; and (c) defines the preferential lines of urban development, redevelopment and reconversion.

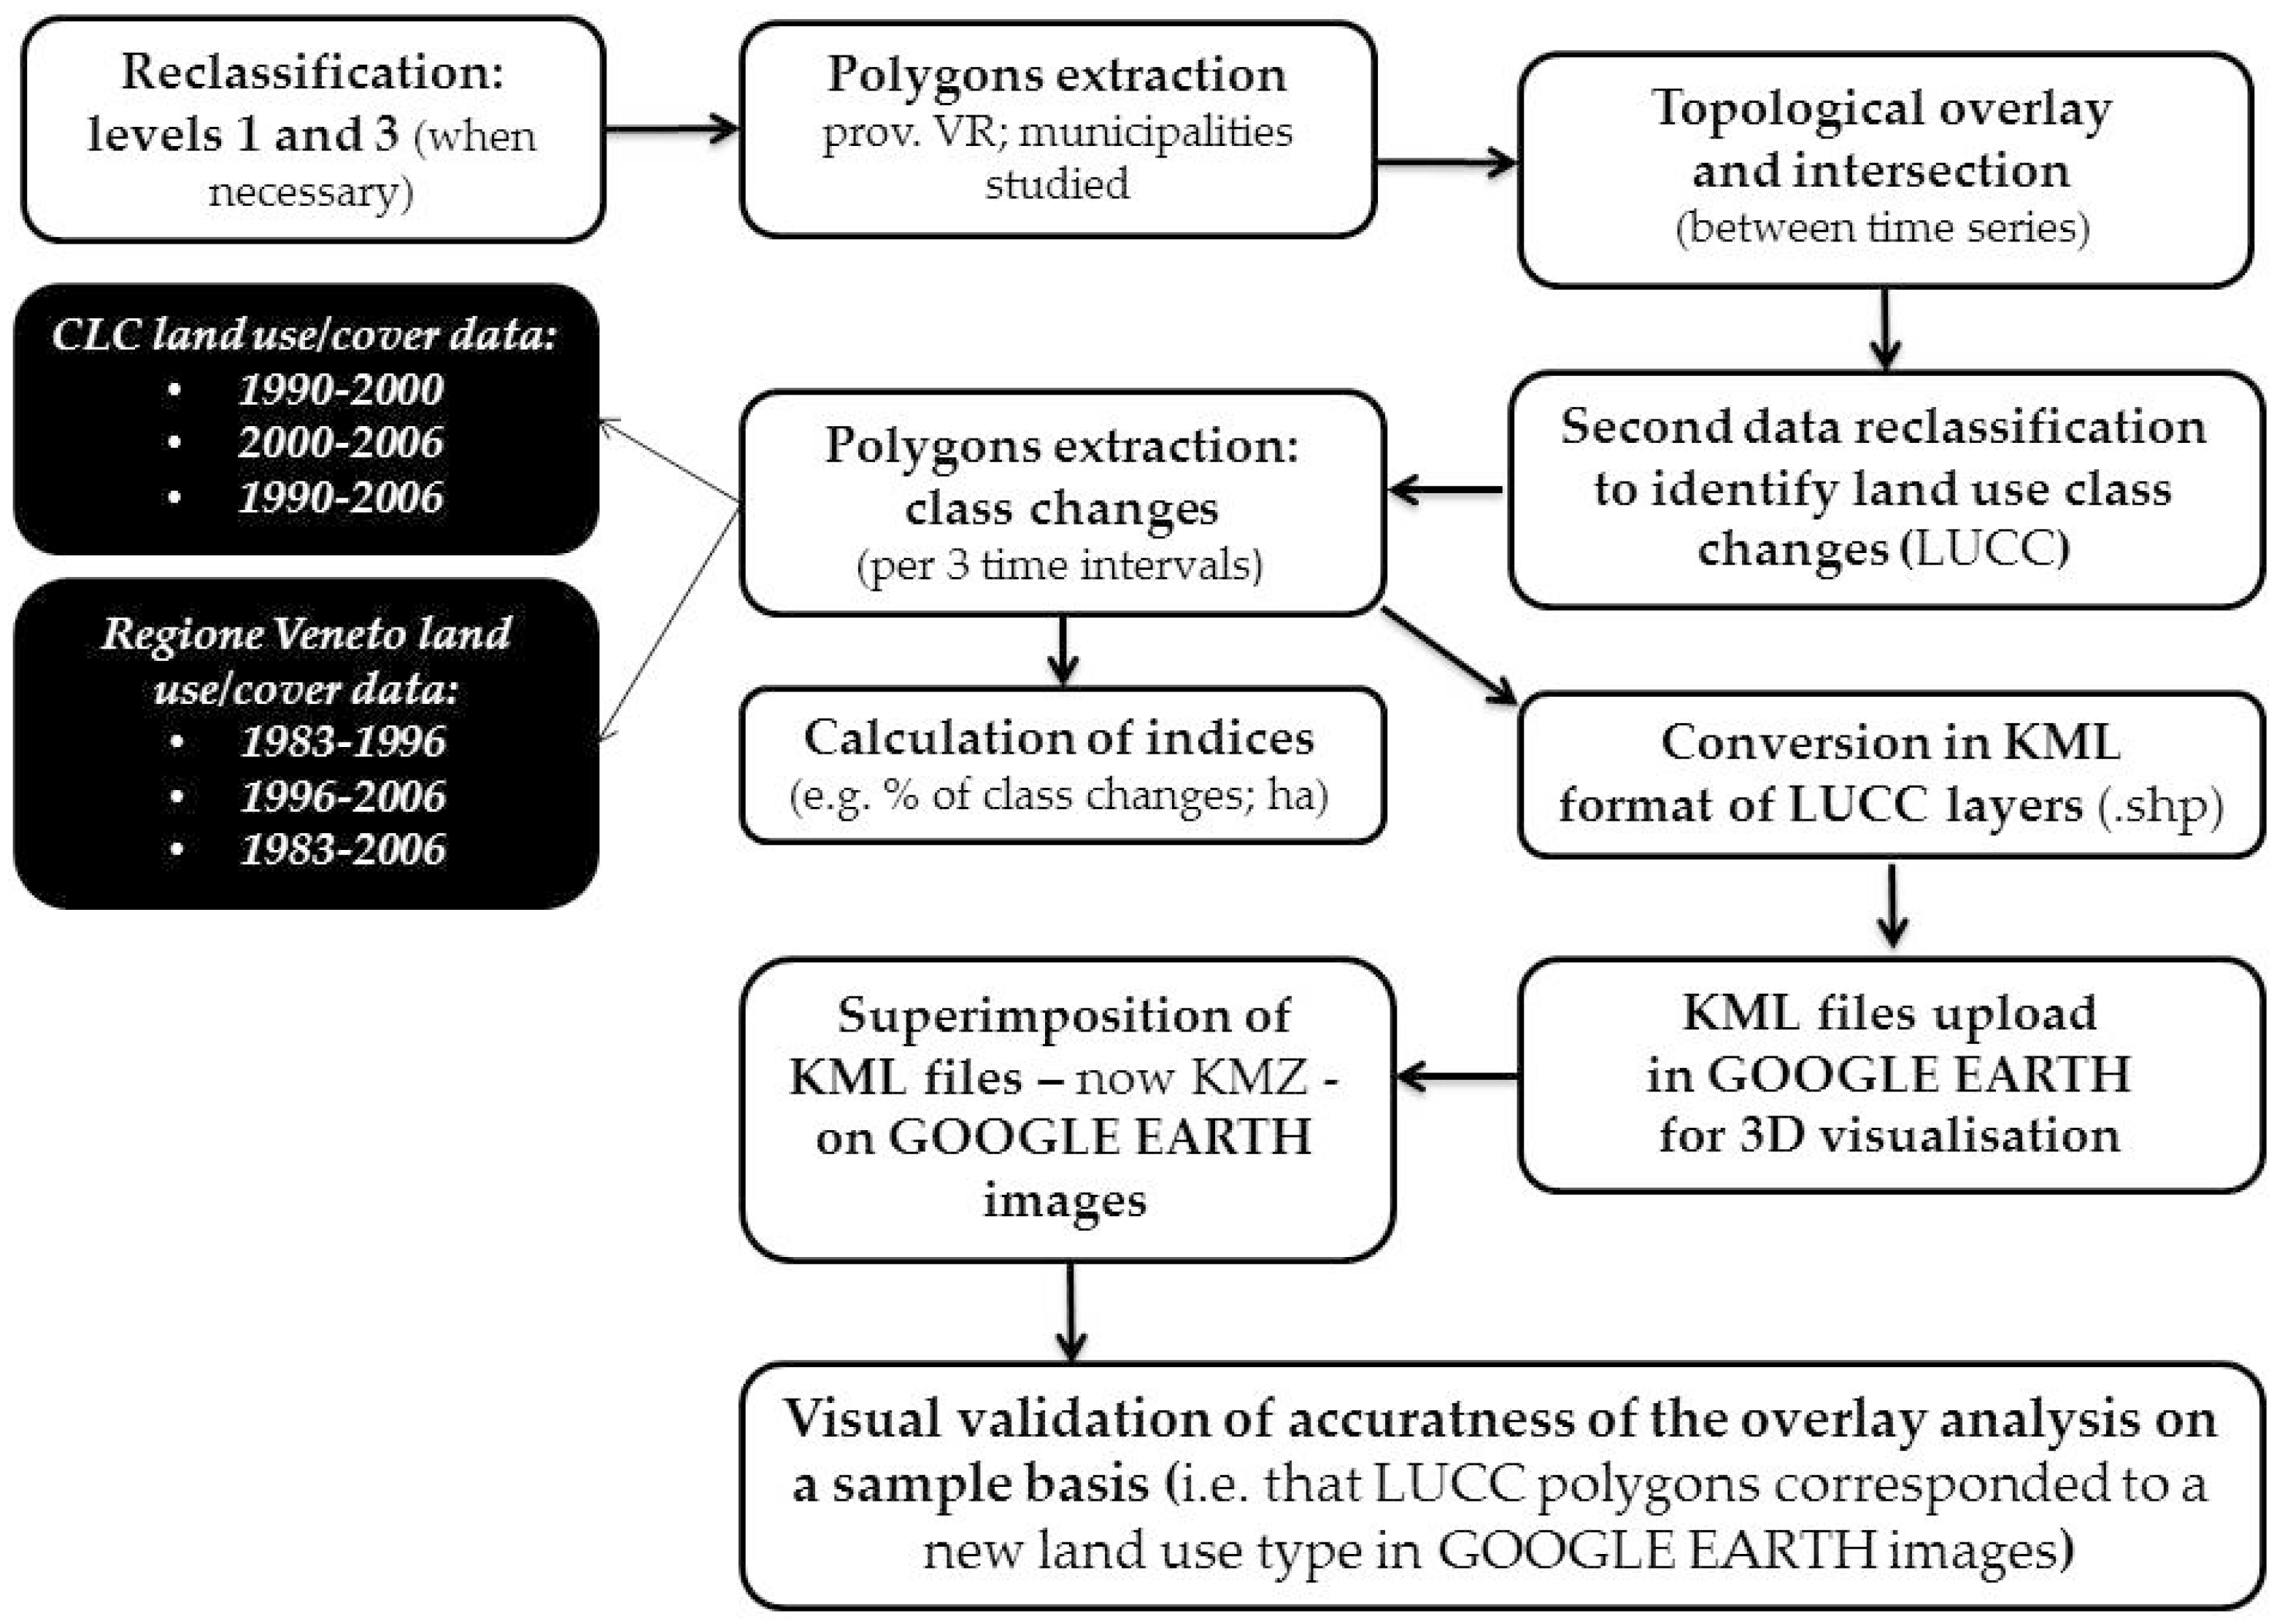
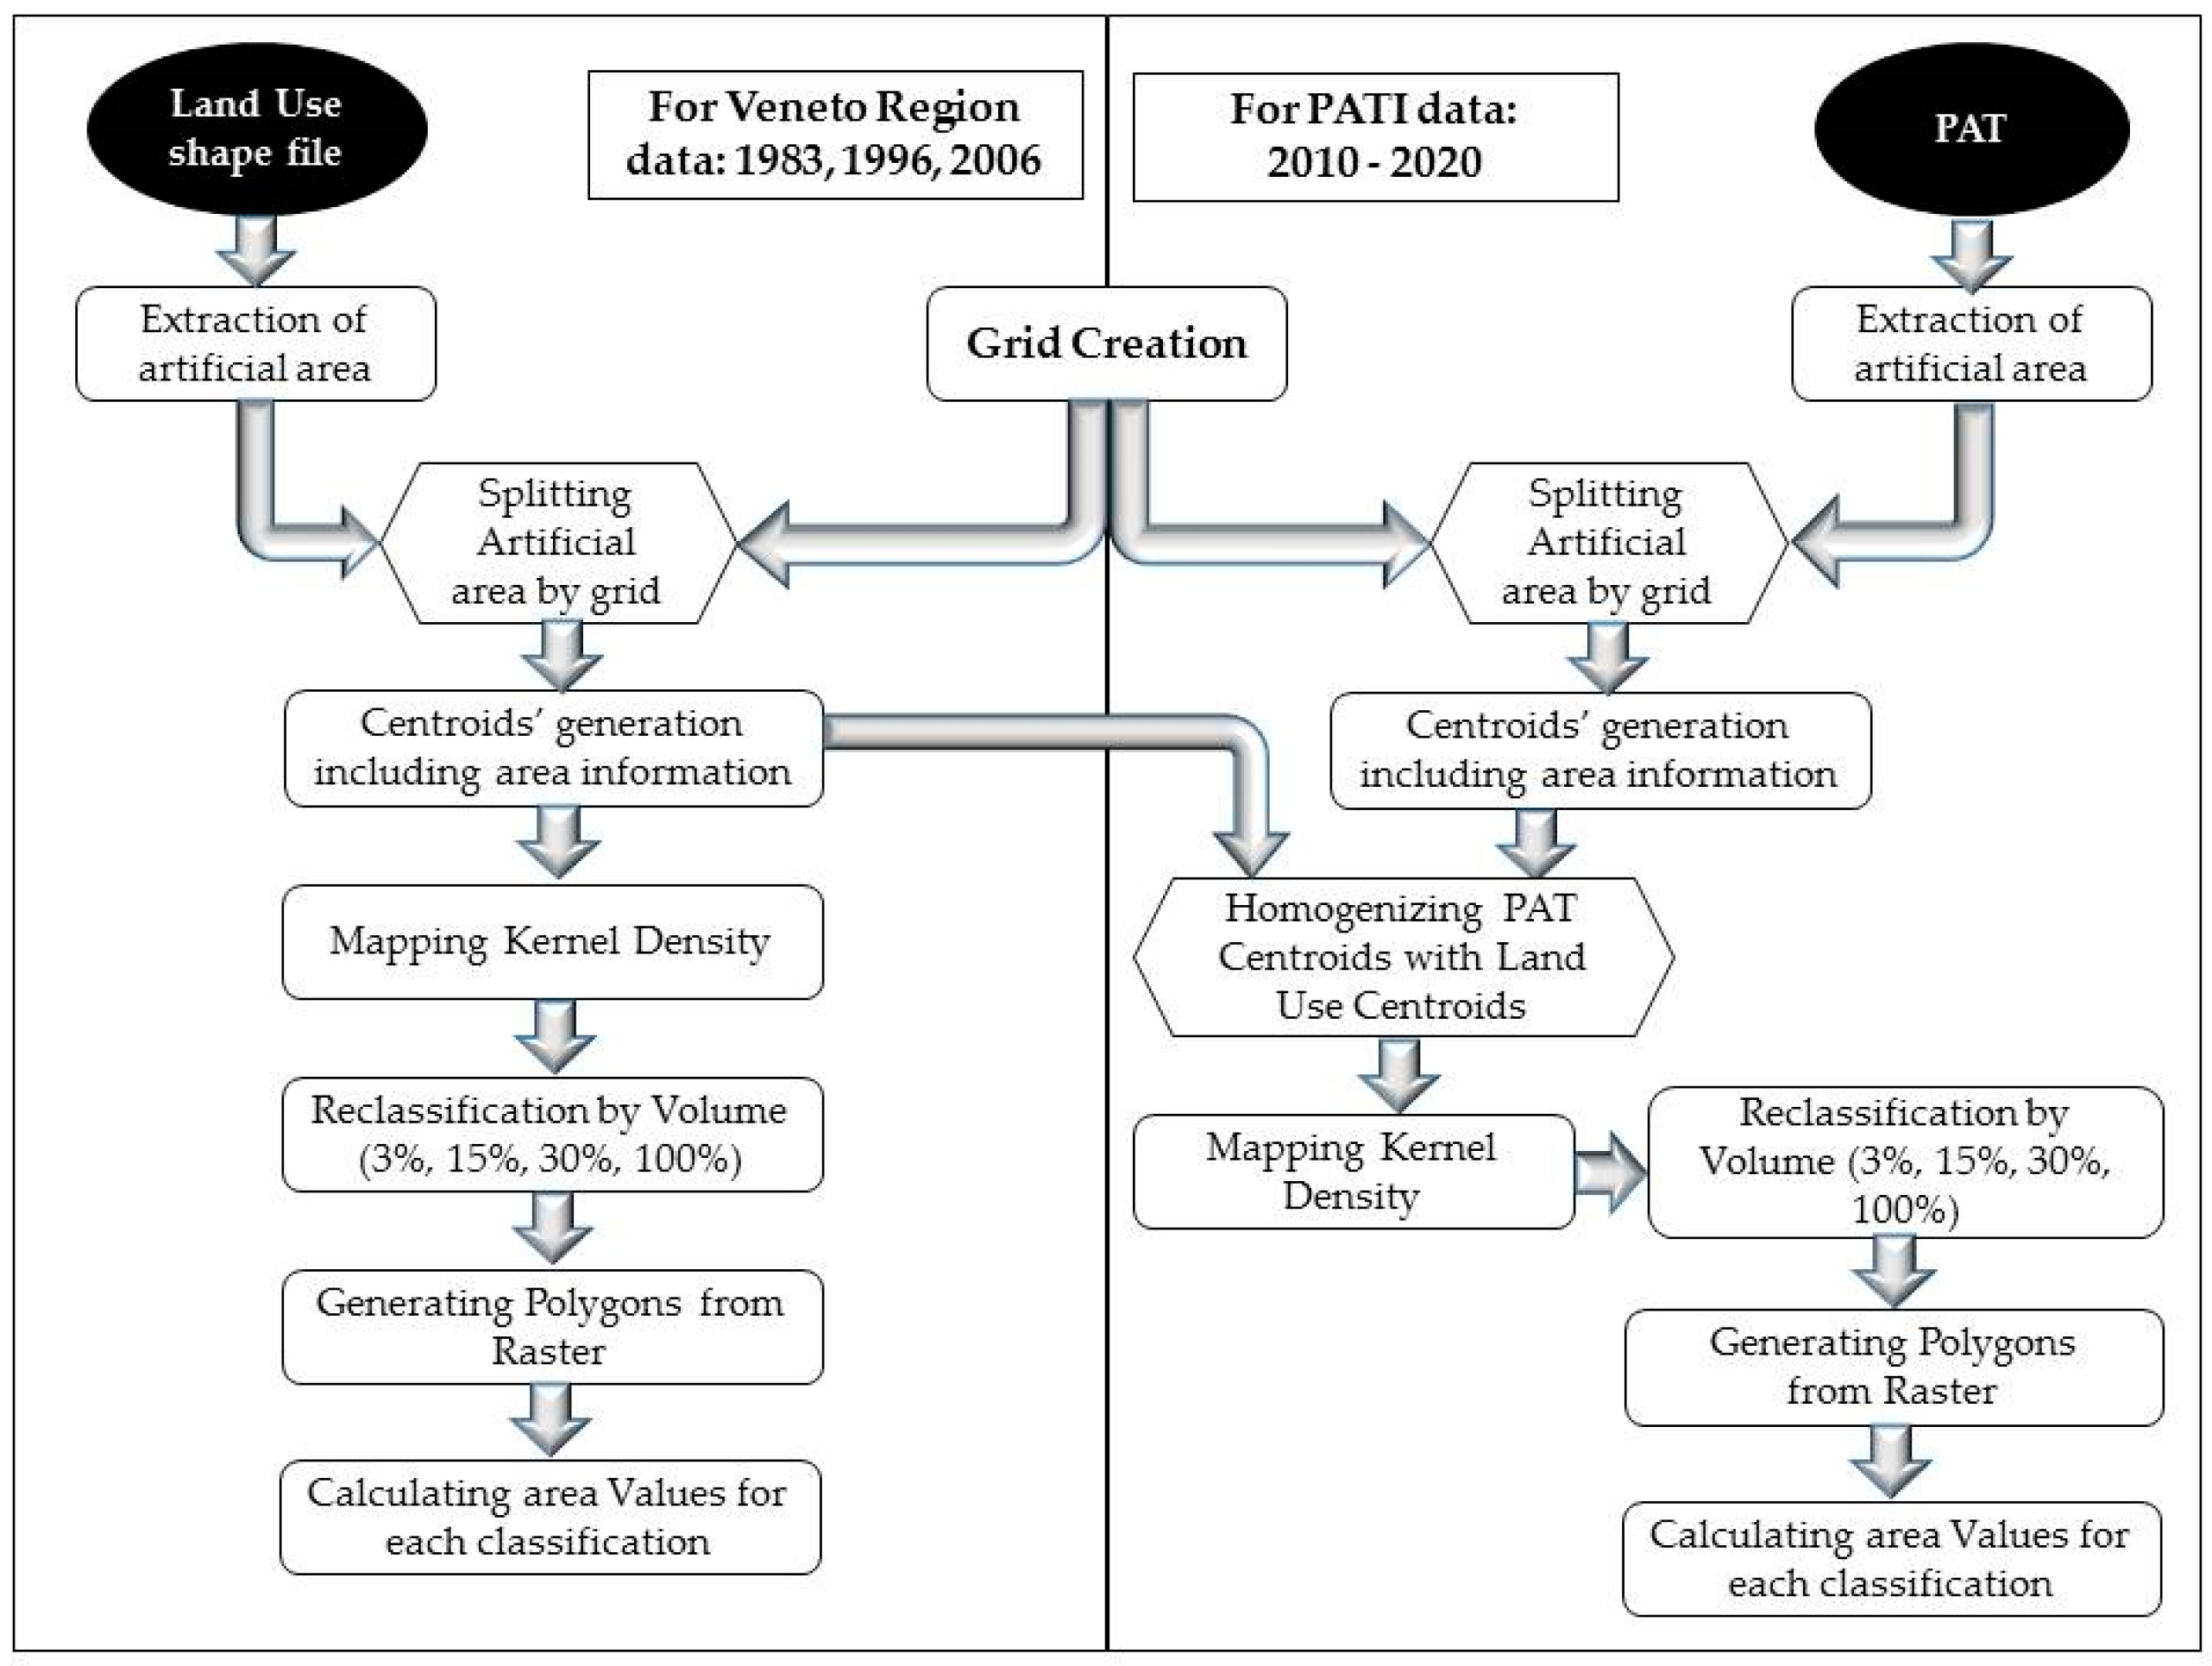
2.2. Procedure Implemented

2.2.1. Descriptive Bivariate Statistical Analysis

We initially used the Italian Agricultural Census dataset to characterize the evolution of the vine-growing sector, and isolate samples on which to subsequently carry out spatial analysis.
Firstly, the 2010 data on the actual municipal area covered by vines were analyzed by implementing descriptive statistical techniques. This information is not linked to the location of the farm’s registered office. It shows, therefore, the true proportion of each municipal territory actively devoted to vineyards. The ratio (expressed in percentage terms) between the total agricultural area used for the cultivation of grapes and the total Utilized Agricultural Area (UAA) [41] allowed us to identify the municipalities with a great vine-growing vocation. A total of 32 municipalities out of 98 of the Province of Verona exceeded the minimum threshold value of 25%. Analyses of this statistical universe were completed using spatial analysis and area-based measures. The last available municipal agricultural census data (2010) also contain information on: the total standard output (SO in Euro) of the farms, of both grape-growing farms in general and of those specializing in high-quality vine-growing. Examining these statistics allowed us to appreciate the areas in which the economic contribution of grape-growing is high or relatively high.
We subsequently analyzed additional homogeneous data for the years 1982, 1990, 2000 and 2010. Unlike the 2010 dataset mentioned above, the ISTAT questionnaire for the 1982, 1990 and 2000 Agricultural Censuses included only a generic field (“tree crops”), which did not allow us to identify the actual area under vines per district, but only by agricultural holding. The 10-year period percentage changes in the number of farms and surface areas were then recalculated on data relating to the statutory location of the agricultural enterprise. The different reference samples do not allow an inter-census analysis between the registered office-centric time series and the more surface-centric 2010 dataset. The analysis was, however, useful, as it provided valuable information to characterize the evolution of the sector in the study area (Section 3.1).

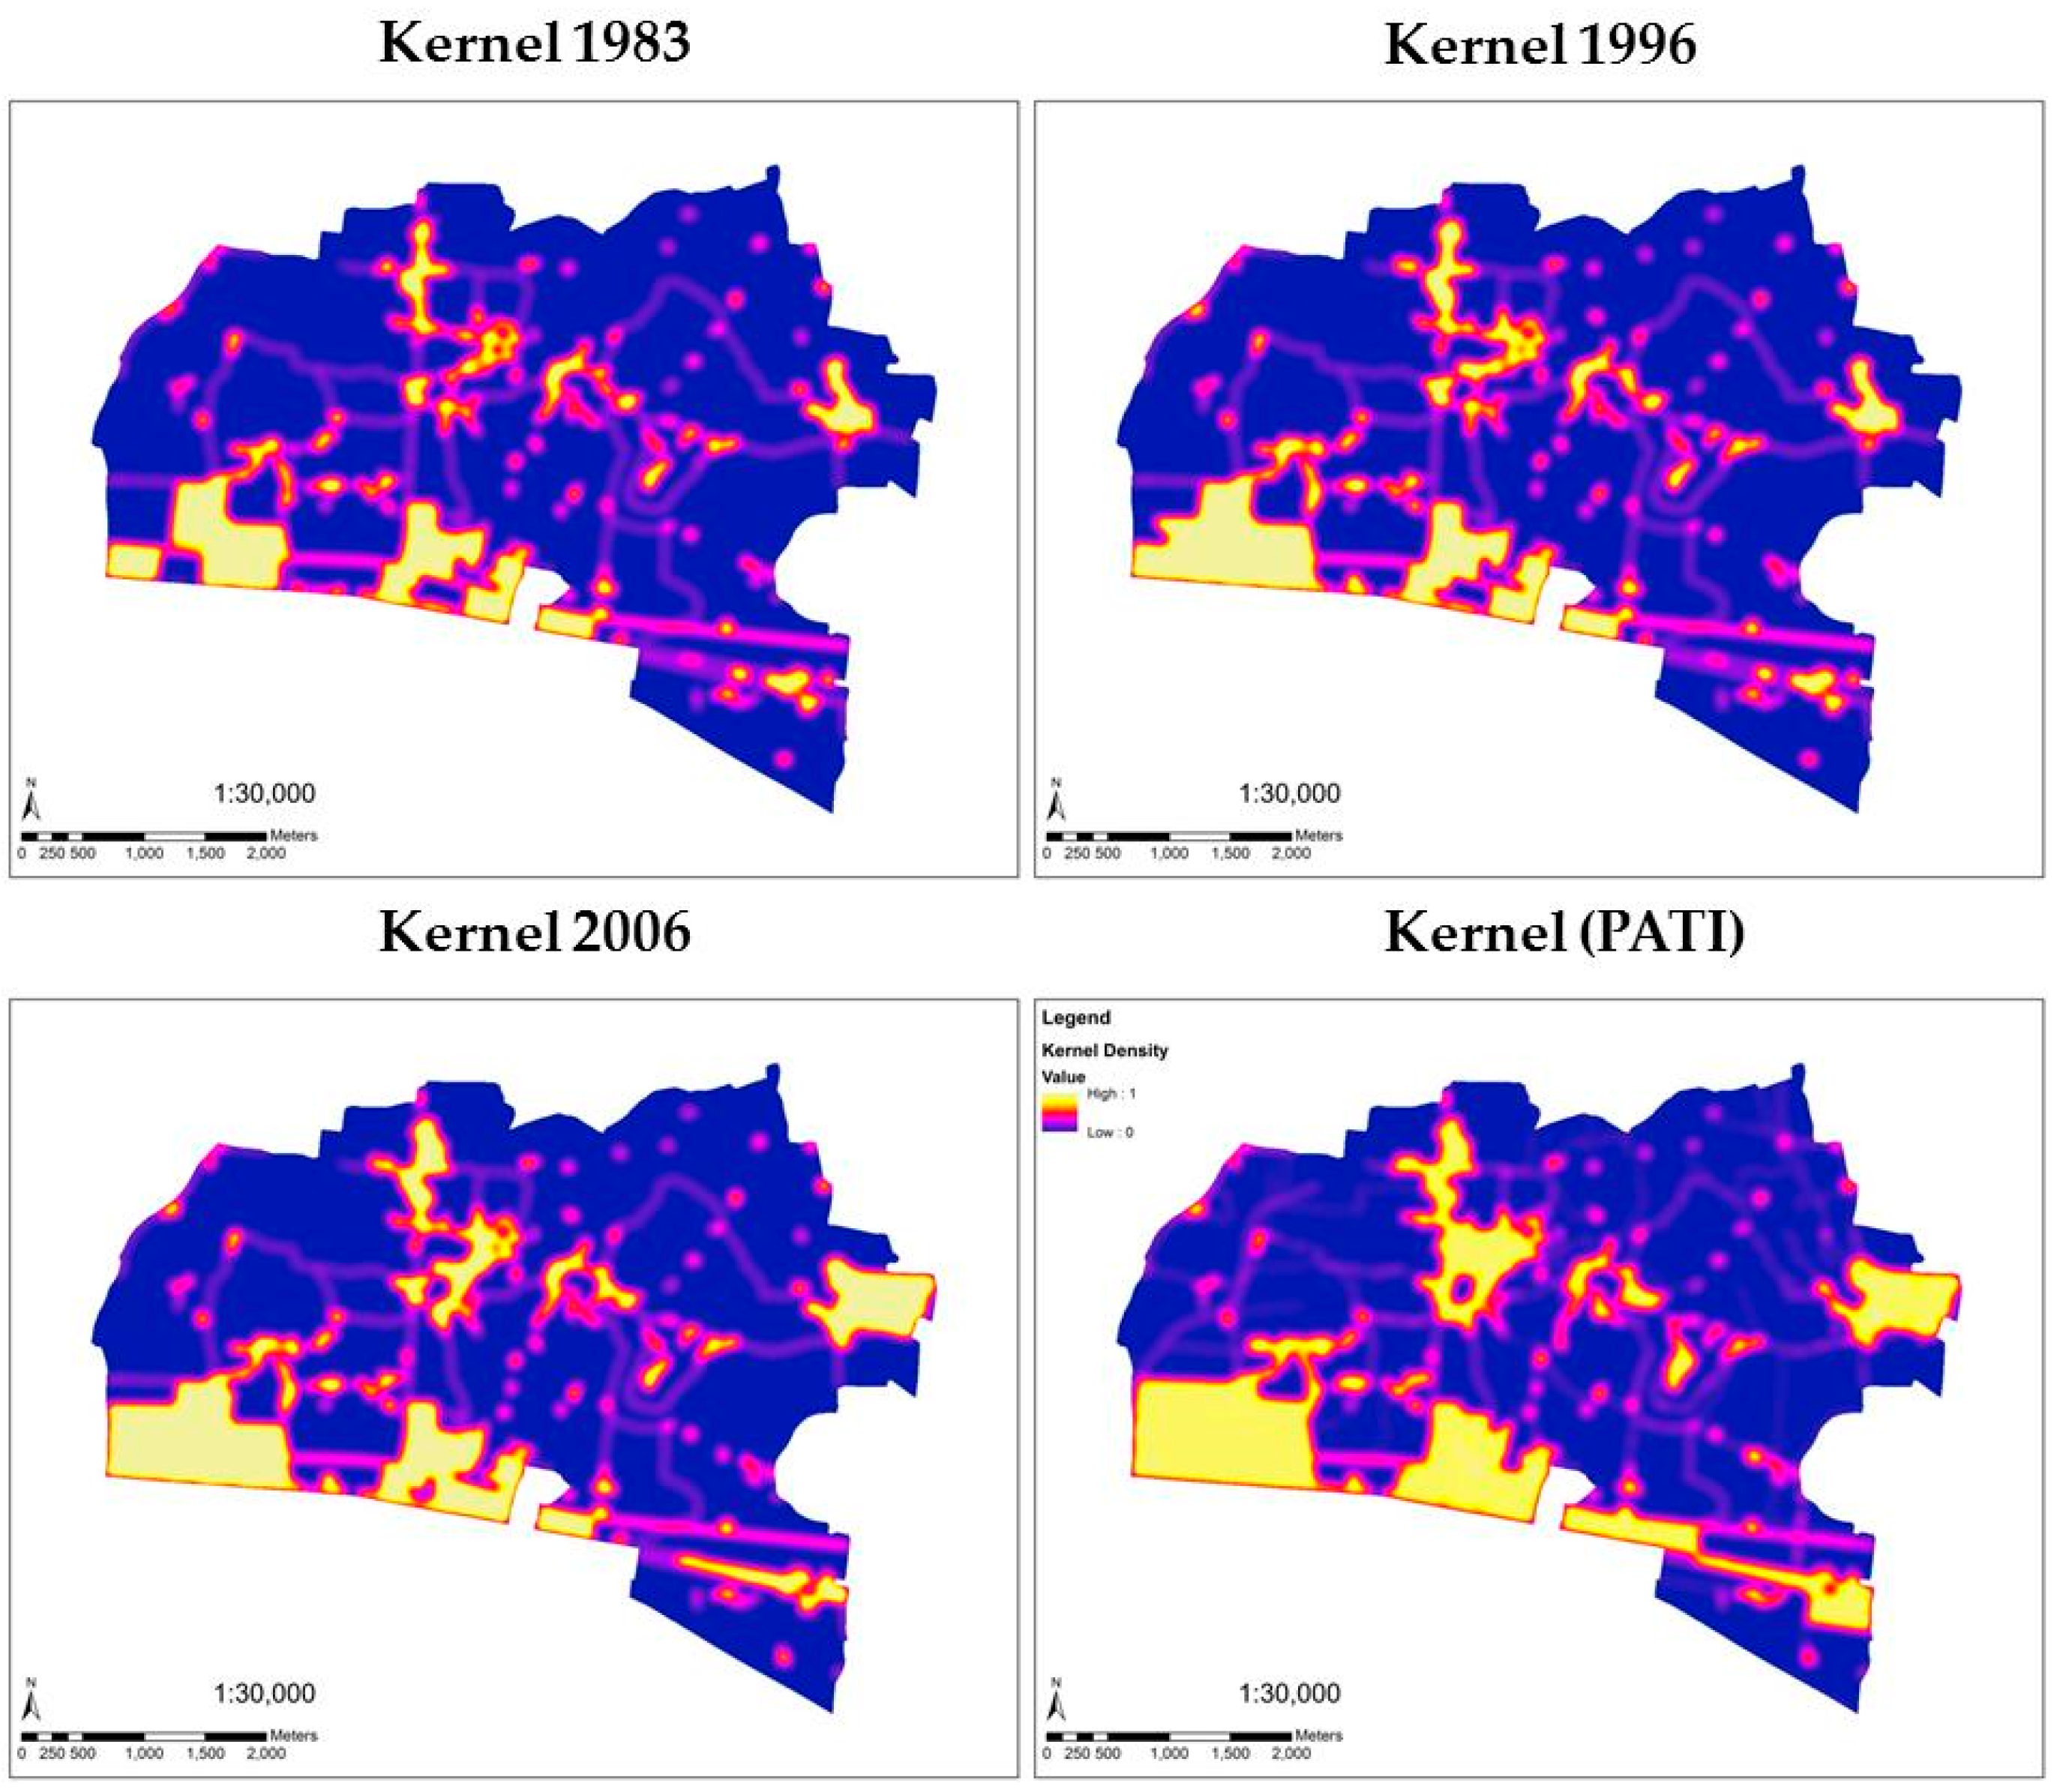
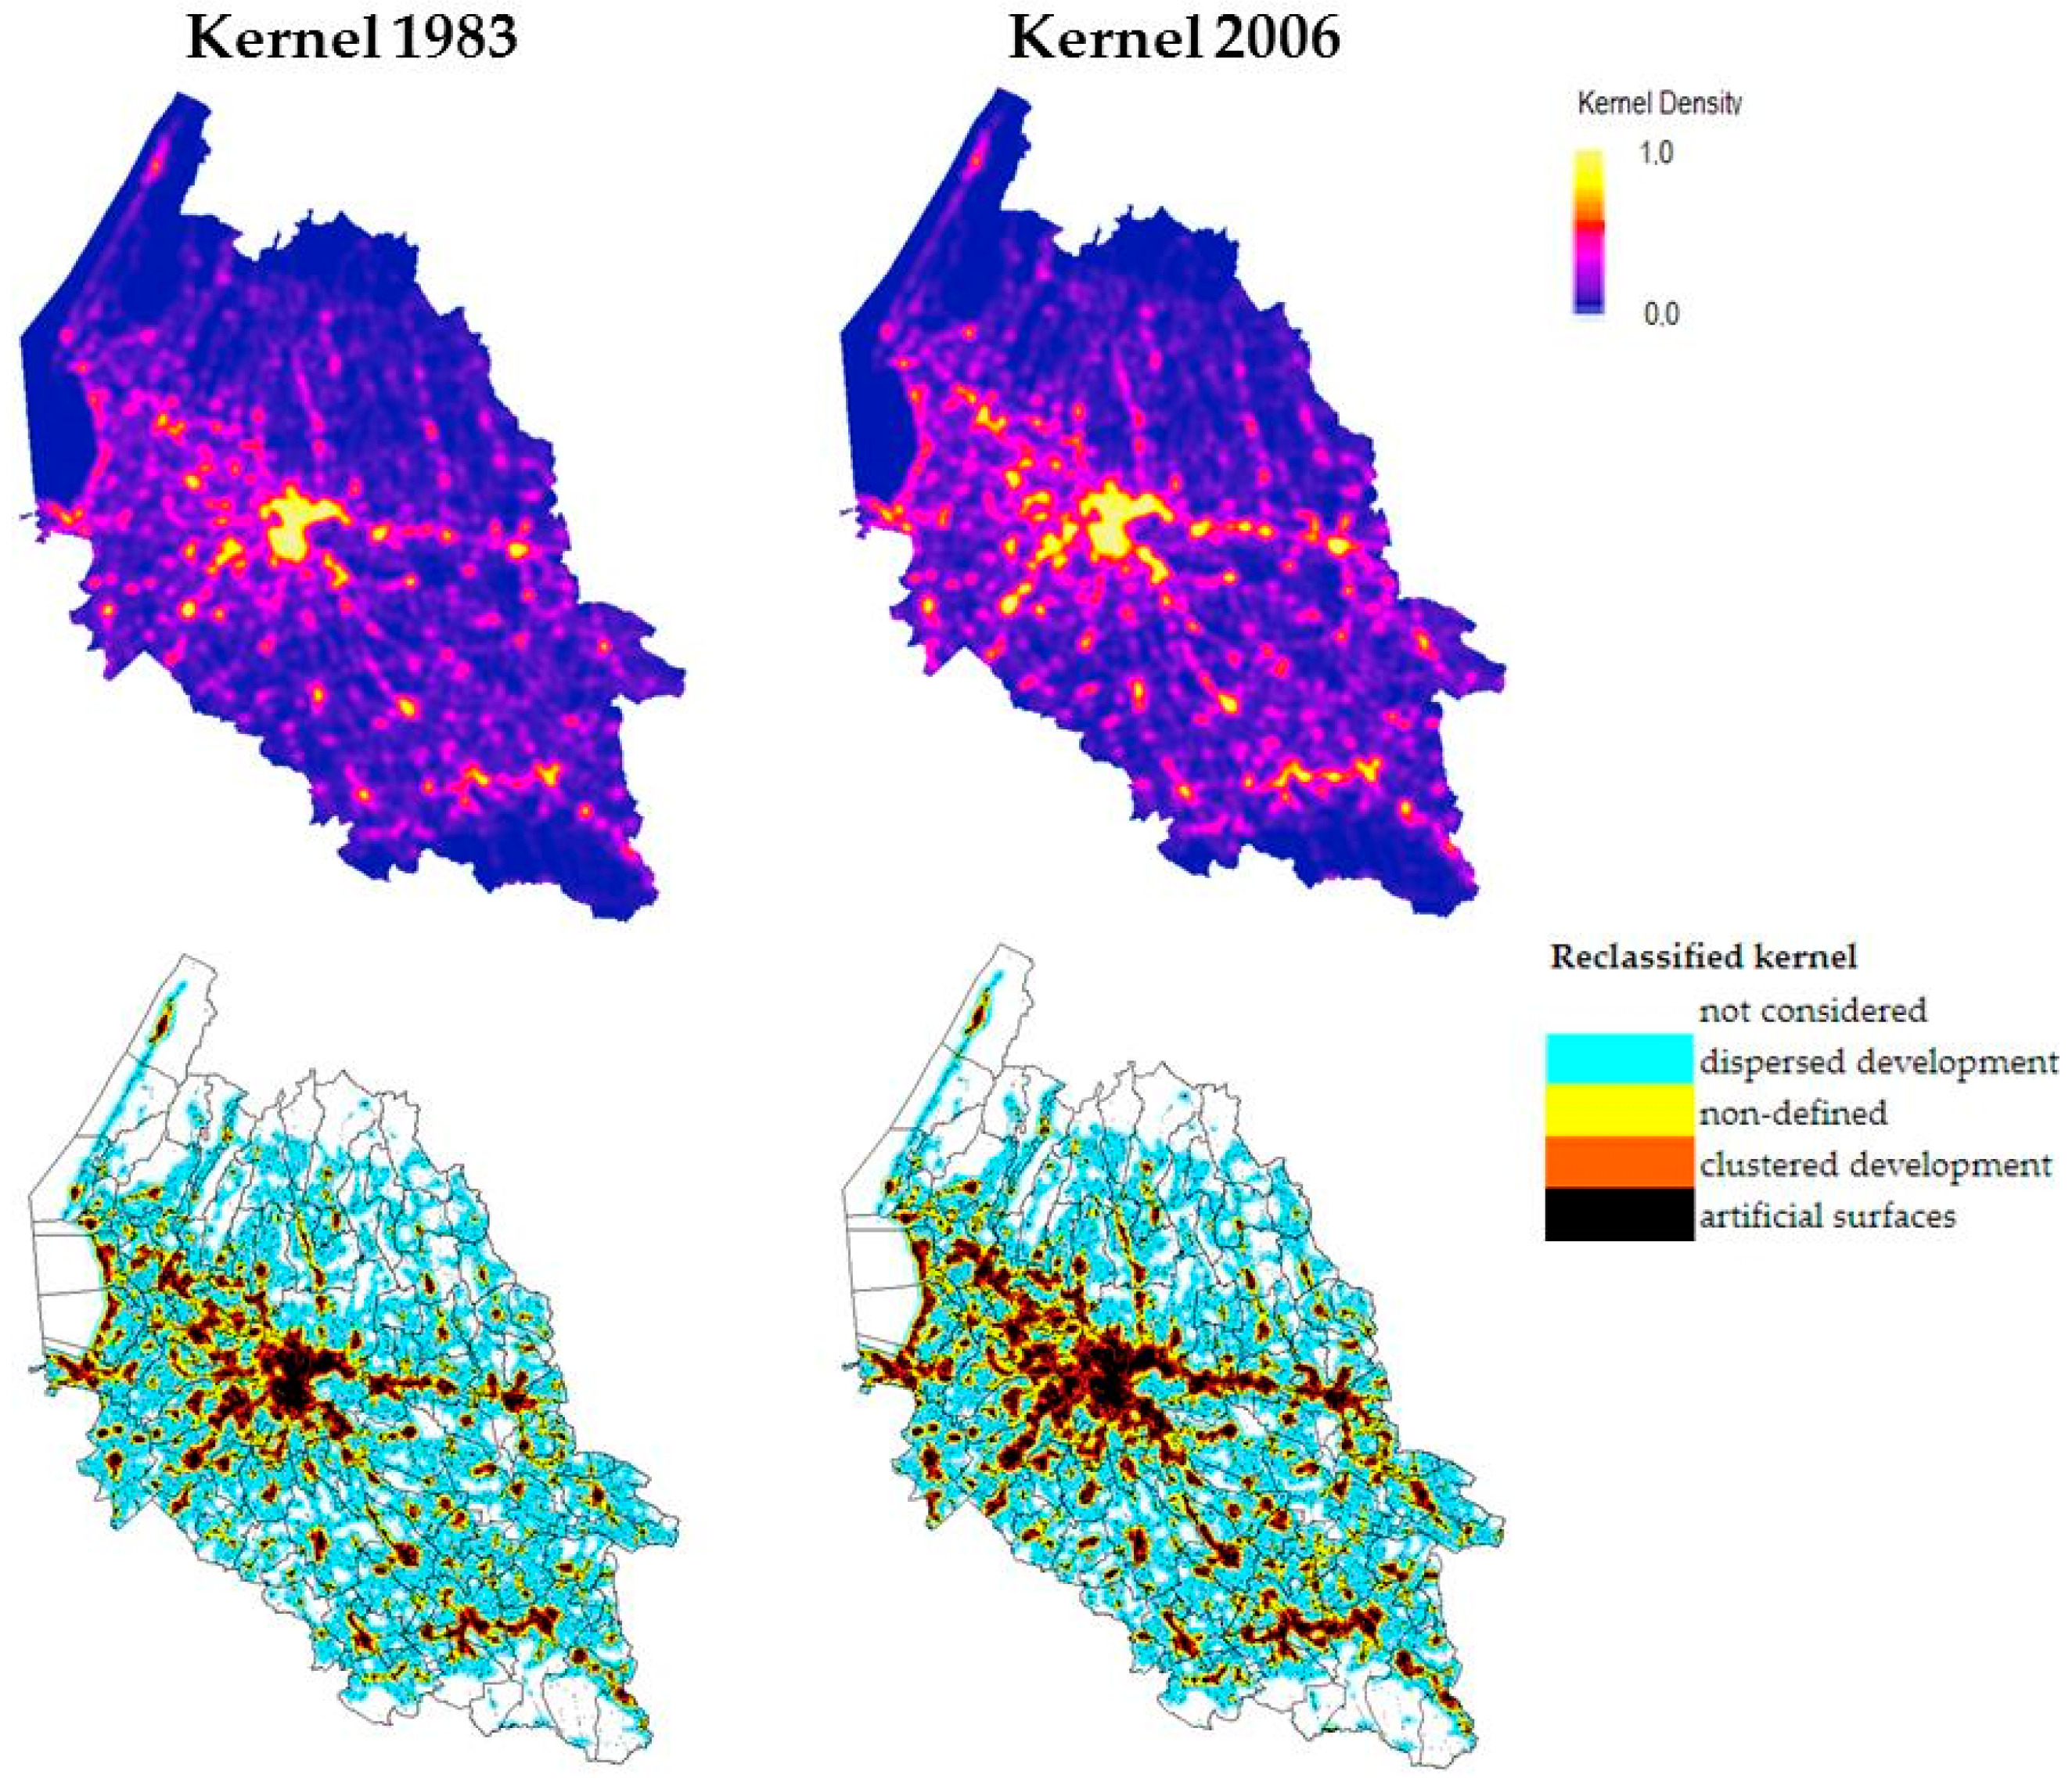
2.2.2. Spatial Analysis

The statistical-descriptive analysis set out above was accompanied by a GIS-based one (using ArcGIS 10.2). We started by analyzing the database on land use of the Veneto Region, which covers a fairly long period of time. Initially we extracted just the polygons relative to the Province of Verona and the municipalities with vine-growing vocation higher than 25% [(utilized agricultural area with vines/total utilized agricultural area) × 100]. Having deemed it sufficient to focus on the macro-classes of land use, we reclassified the data provided at level 3 to the (macro) level 1 and recalculated the areas. To characterize land use and cover patterns, simple indicators were obtained, starting directly from the series (Table 1).
At a later stage, through topological overlay [43] (p. 5) we extracted the polygons that, over time, have seen their intended use change into “artificial surfaces”. The period covered by the dataset extends over 20 years (from 1983 to 2006). The analysis covered this interval as well as two others: 1983–1996 and 1996–2006. This work allowed us to highlight the intensification of the artificial modeling of the land. After having detected class changes, indices were calculated (in particular, the percent rate of change by interval and its actual effects in terms of hectares). In areas previously used for agriculture, overbuilding and urbanization are especially likely to affect and erode the territorial capital useful for other purposes (for example, tourism). For this reason, a more in-depth investigation at level 2 was conducted, aimed at testing how many hectares classified as “permanent crops” (class 2.2) were converted into the macro-class 1: this land use category, in fact, comprises vineyards. Regarding the latter, it is worth recalling the reason why we did not carry out a specific analysis at level 3: the time series provided by the Veneto Region do not include information on land covered by vines.
Using the same approach, we analyzed the changes to the third degree of detail and explored the role played by the development of infrastructural and industrial areas, which are cited in: [22]. To validate the work carried out, we converted the LUCC layers in shape format into KML format. Once uploaded to Google Earth and superimposed on its images, we visualized them in 3D to verify that the polygon did indeed correspond with the new registered land use. This allowed us to confirm the merit and accurateness of the analysis (Figure 2).
We then carried out geostatistical analysis to assess the degree of compactness of artificial surfaces (thus evaluating if we had clustered or dispersed developments, and the impact on the territorial fabric). We used kernel analysis, a methodology for estimating a density function [44]. In ArcGIS, the latter calculates the density of points within an investigated geospatial radius, weighing the values according to the attributes of the point and allocating them to each output raster cell [45]. This method is useful primarily as a visualization technique [46] (p. 53). The choice was made paying particular attention to the extension of the artificial surfaces, as polygons had distinct areas within the established radius. To obtain a density map, the punctual functions are cumulated. This can be described by the following equation:
g ( x ) = 1 n i = 1 n 1 h k ( x x i h )
where n is the number of points analyzed in the radius determined by the bandwidth h; x represents the point coordinates where density is estimated; xi those of the midpoint; and k is the kernel estimator (or probabilistic function). Using different bandwidths to accentuate or mitigate the mapping results is of course possible.
For each time threshold (1983, 1996 and 2006), we extracted the polygons associated with class 1. We then homogenized them in shape and size, using the fishnet tool to dissect them creating a 25 × 25 m grid. Subsequently, centroids were extracted together with information on the surface extension (necessary to generate the weighted kernel density). Using the kernel density tool we produced density maps. Given that the practical implementation of the estimator depends crucially on the choice of the h parameter, we carried out iterations to establish which bandwidth would perform better. In our case, h was strictly associated with the geometric analysis of the surface and was eventually expressed by the following function:
h = i = 1 N A i P i N
(where Ai and Pi are, respectively, the surface area and the perimeter of the analyzed municipalities, and N their number). In our case, h equals 1107.8 m. Through visual overlay, we determined the spatial coincidence between the density map and the class 1 polygons and assessed the accuracy of the performance. Later, to check if the artificial modeling of the land resulted in compact or else dispersed developments, we reclassified the map by density volume percentage as follows: x > 97% = not considered; 97% < x < 85% = dispersed urban development; 85% < x < 70% = non-defined; x < 70% = clustered urban development (where x is the volume of the density map). We then calculated the total areas for each class, after having converted the raster areas into polygon areas.
To begin with, we carried out a comprehensive analysis of the whole Province. We subsequently implemented the procedure considering only the areas tending towards grape-growing monoculture [(utilized agricultural area with vines/total utilized agricultural area) × 100 > 60] and, finally, those presenting index values between 25% and 60% (highly suited for this agricultural specialization). To generate the masks, we accurately chose municipal shapefiles excluding areas whose value did not fall in the specified index ranges and calculated (relative to the years 1983, 1996, and 2006 as well as the intervals 1983–2006, 1983–1996 and 1996–2006) the relationship between clustered, dispersed and undefined urban developments.
In conclusion, we carried out a detailed analysis focusing by way of example on the municipality of Colognola ai Colli, referring to integrated land use plans (PATI) Piano di Assetto del Territorio Intercomunale) approved on 18 December 2007 and in force until they are replaced (Article 16, Paragraph 6, of Regional Law no. 11/2004). This gave us the opportunity to expand the diachronic comparison to other—always land use-related—data sources from later time periods. This allowed a more complete diagnosis on the potential evolution of artificial modeling of the land over a longer period. Given the smaller surface extension, k gave (visually) better results using the formula used by ArcGIS to calculate h:
h = 0.9 × min ( S D , 1 ln 2 × D m ) × n 0.2
where SD is the standard deviation of the distance of the various points from the set point, Dm is the median of the distance and n is the number of points (or the sum of the parameter chosen as weight). In this case, h equals 174.3 m.
Even though the databases contained in the PATI have been built differently, we implemented the same adjustment techniques to homogenize the polygons and extract the centroids. In addition, though, to correct differences we carried out a topological overlay between the centroids just generated and those relative to the 2006 data. If missing, they were added to the latter time series. After the adjustment process of the land use plan data, we carried out kernel analysis using the set of points created, as previously explained (Figure 3).

3. Results

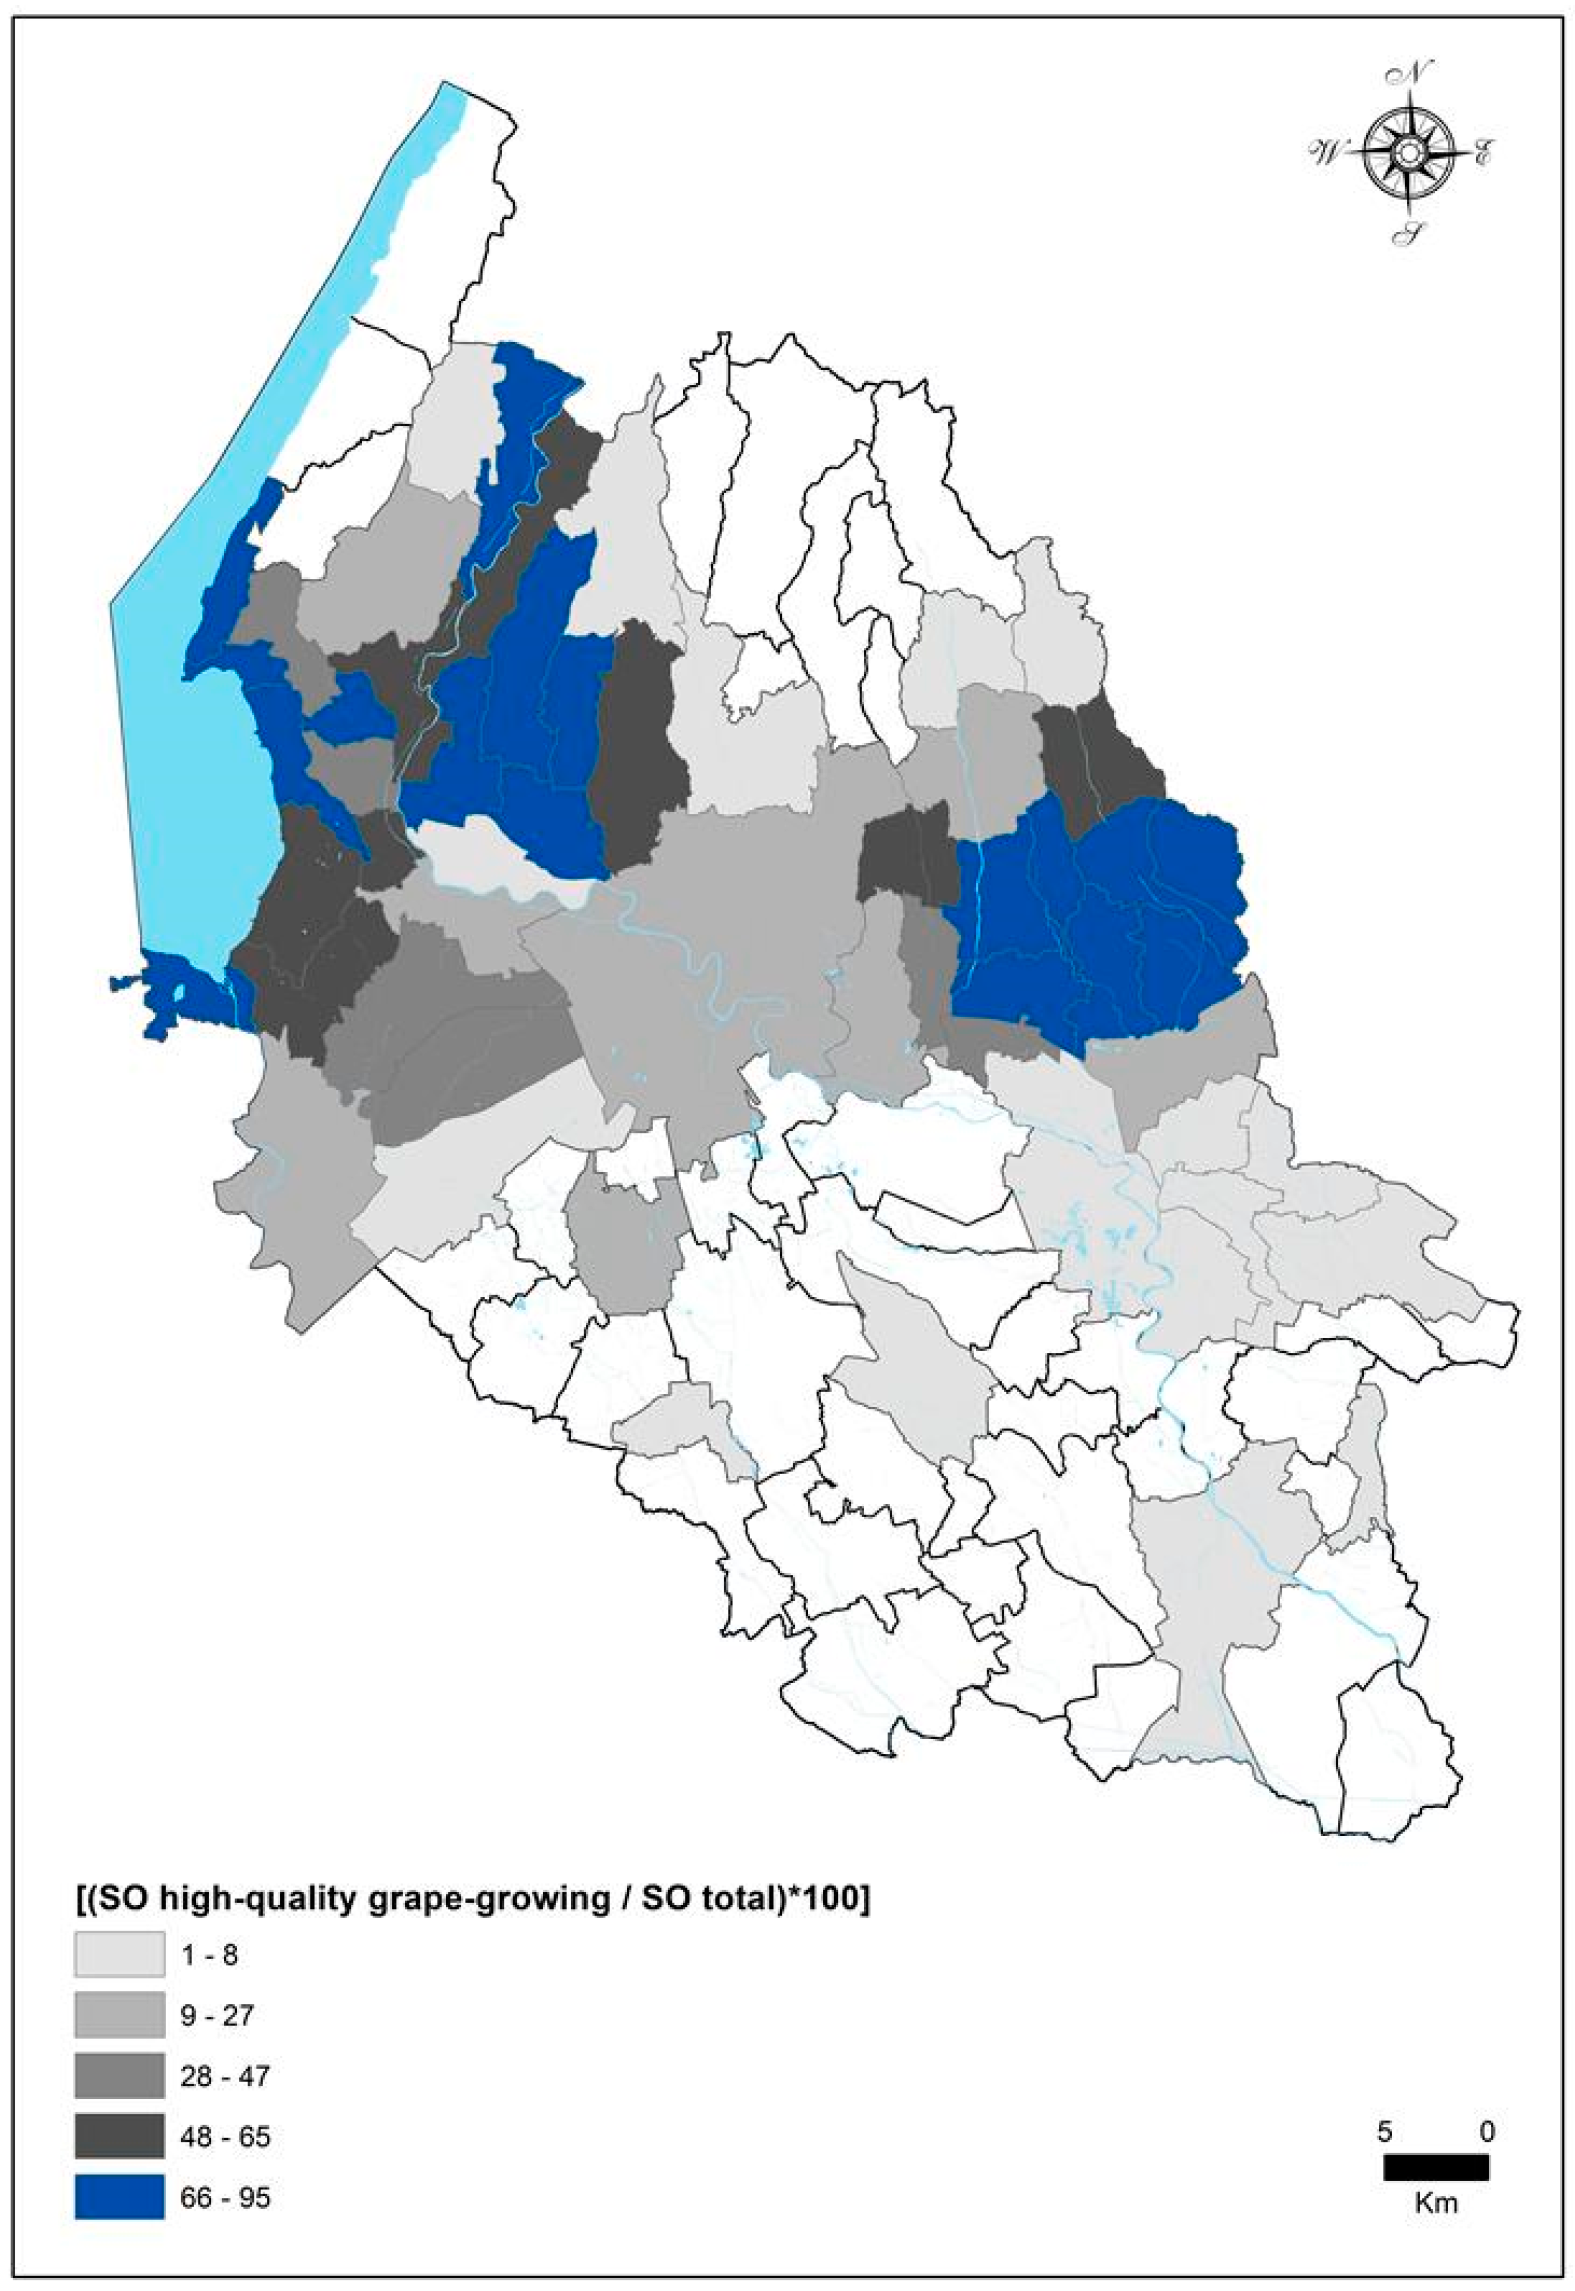
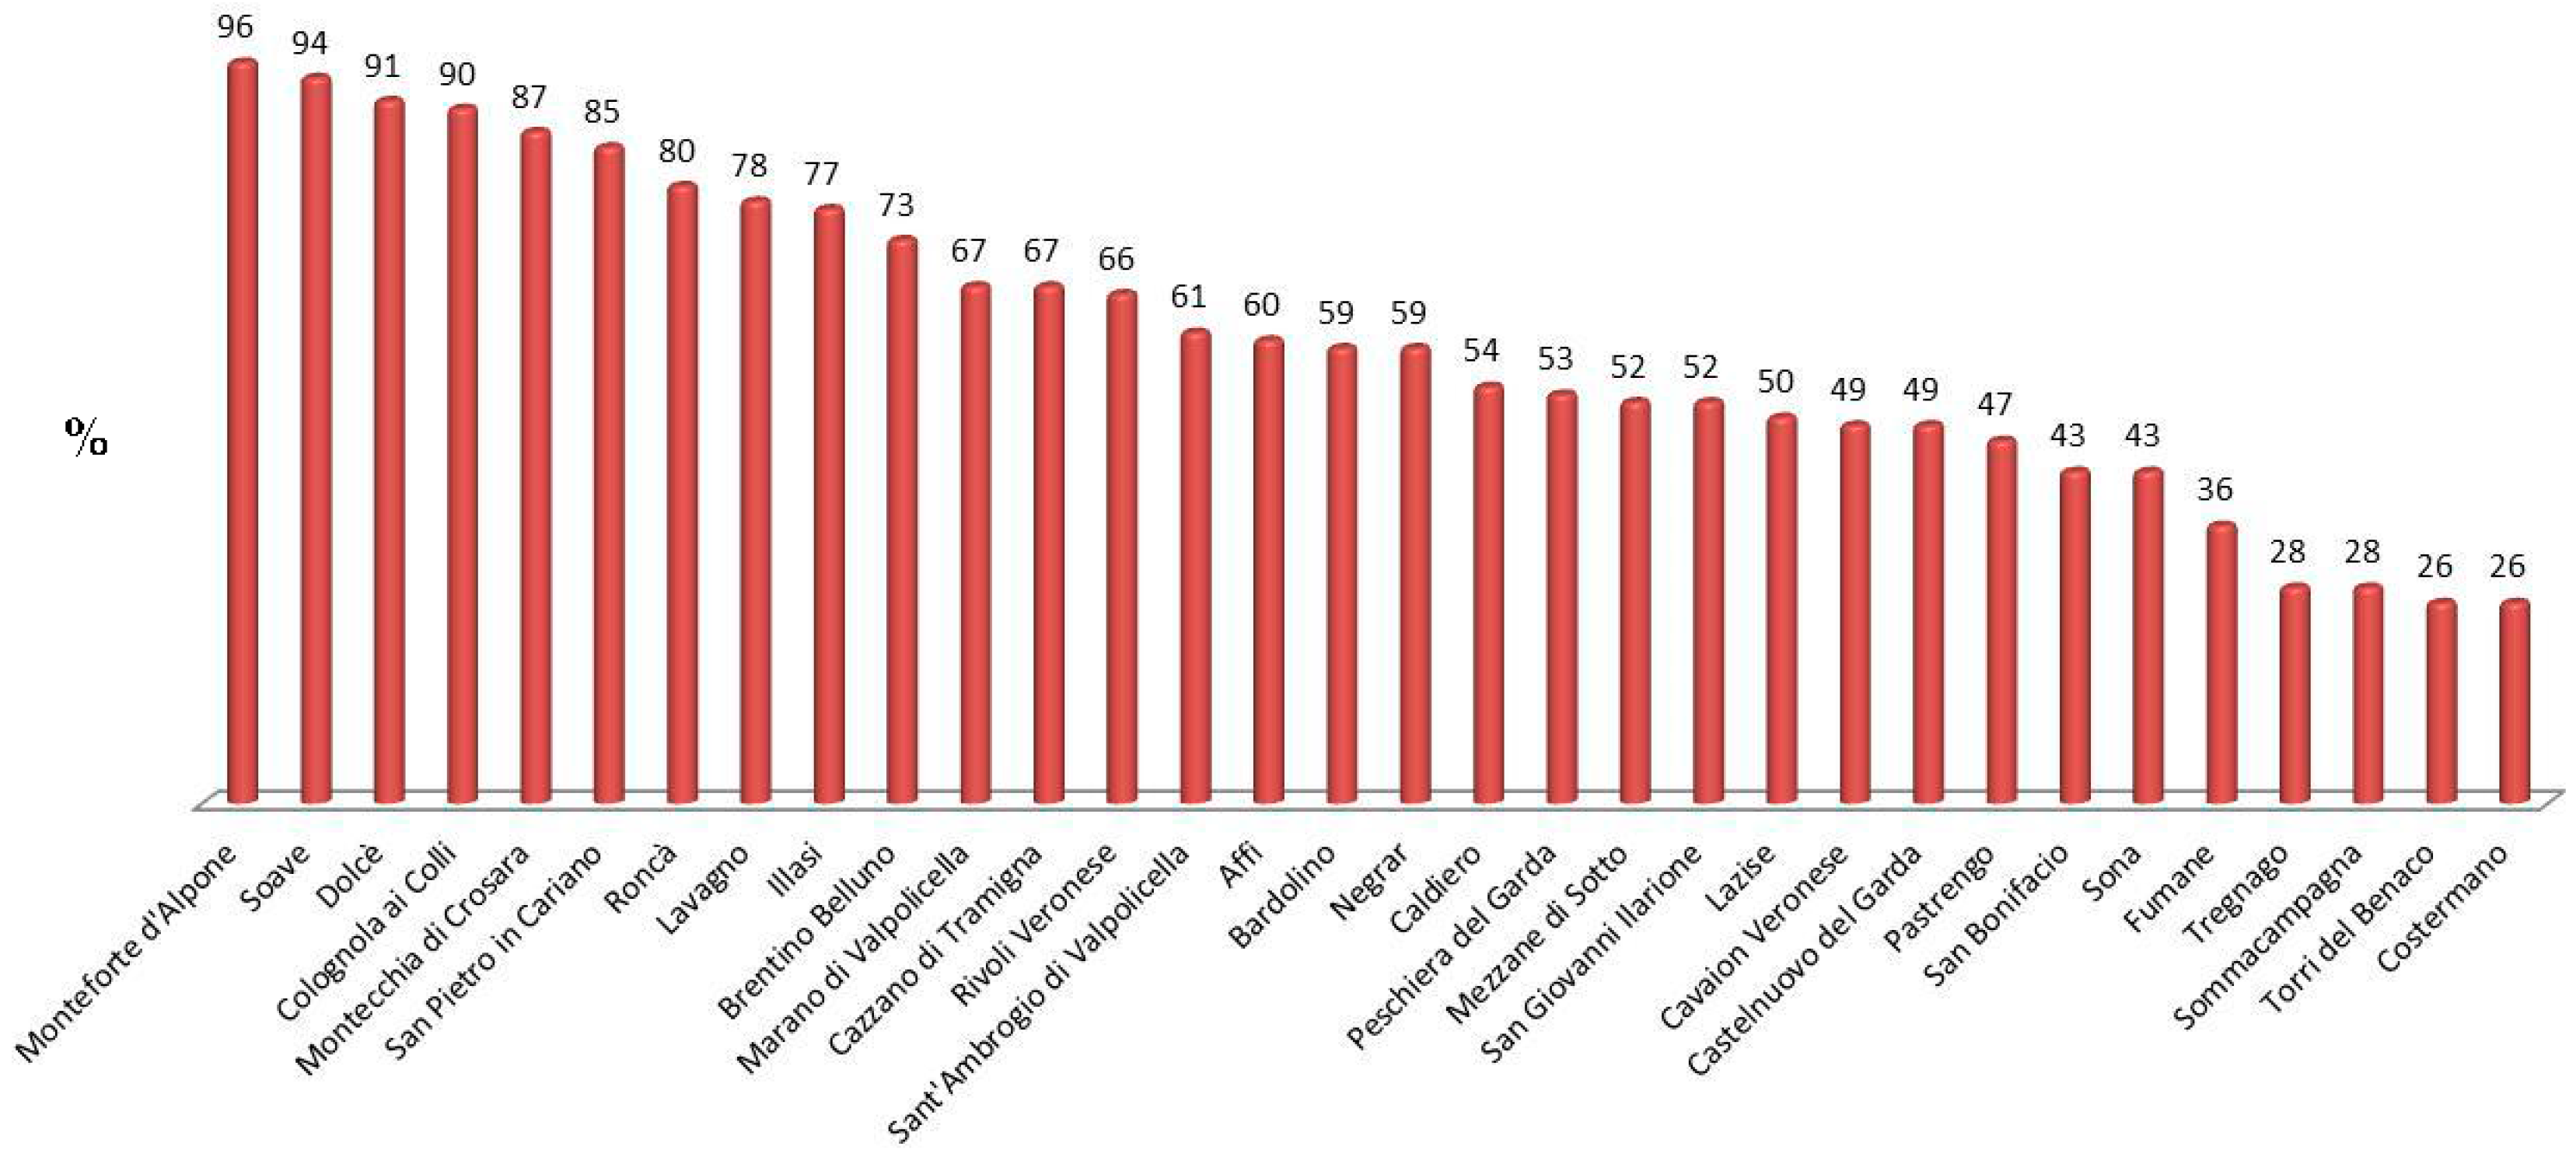
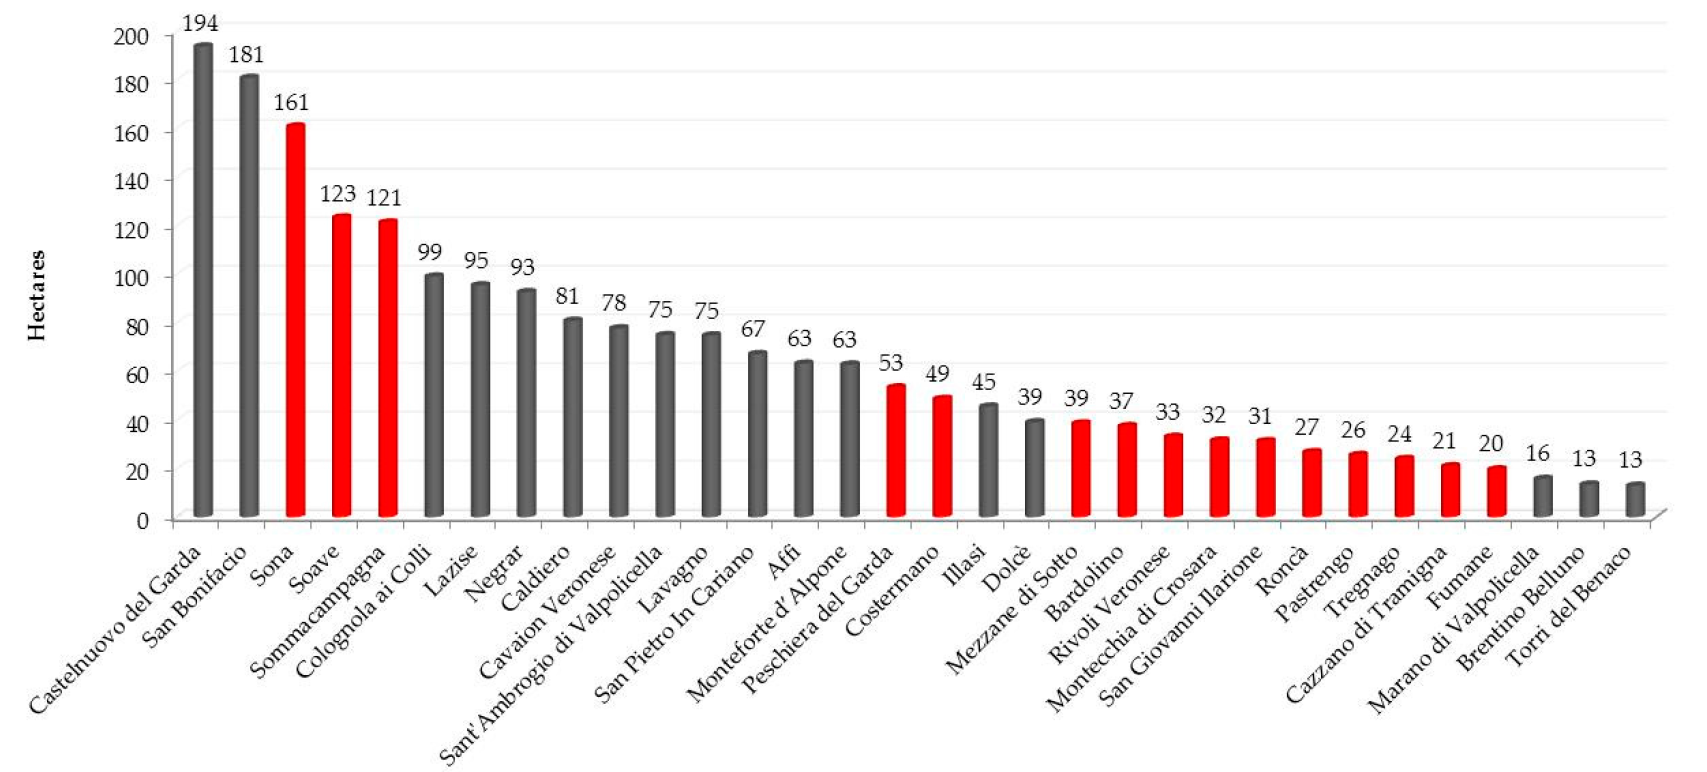
3.1. Vine-Growing Farms in the Province of Verona: An Overview Using Agricultural Census Data

An examination of the data for the whole period shows a marked decrease in the number of farms with their business center located in the municipalities under investigation. Between 1982 and 2010, they declined by a third (Table 2). For over a decade, there was in fact a boost in the concentration and consolidation of the market in the hands of fewer companies, often wine cooperatives. They became true wine multinationals, incorporating local identity references—for example, winescape—into the value of the product, thus making them an integral part of the competitive advantage [47]. However, in 2010, in the 32 municipalities alone (Table 2), vine-growing farms represented a third of the total number of agricultural holdings active at the Provincial level (19,687).
In the period 1982–2010, the vineyard surface associated with the business center increased by 20%. Since 2000, however, this trend has been increasingly moving away from the urbanized belt, ascending the hills towards the north on the slopes and summits: this was once uncultivated land, or planted with grass or copses.
A farm can have its registered office in a municipality and, at the same time, Utilized Agricultural Area in others. Using only data linked to the statutory location of the business makes it hard to identify the actual surface area covered by vines in a given municipality. Luckily, the latest census gathered both types of information. At our request, the Veneto Region released a 2010 database containing only information on the actual vine-growing area. We therefore analyzed these data to identify municipalities with a great wine-producing vocation, which deserved closer attention. A quick look tells us that in 70% of the municipalities, the Utilized Agricultural Area with vines exceeds 50% of the total, with points in the following entities now almost totally with vineyard monoculture: Monteforte d’Alpone (96%), Soave (94%), Dolcè (91%) and Colognola ai Colli (90%) (Figure 4). This fact is also confirmed when we examine how much of the profitability of the municipality is attributable to the specialization (i.e., when calculating the percentage of standard output particularly associated with high-quality wine production in the municipal total): many municipalities in the Province of Verona fall within the higher classes (Figure 5).

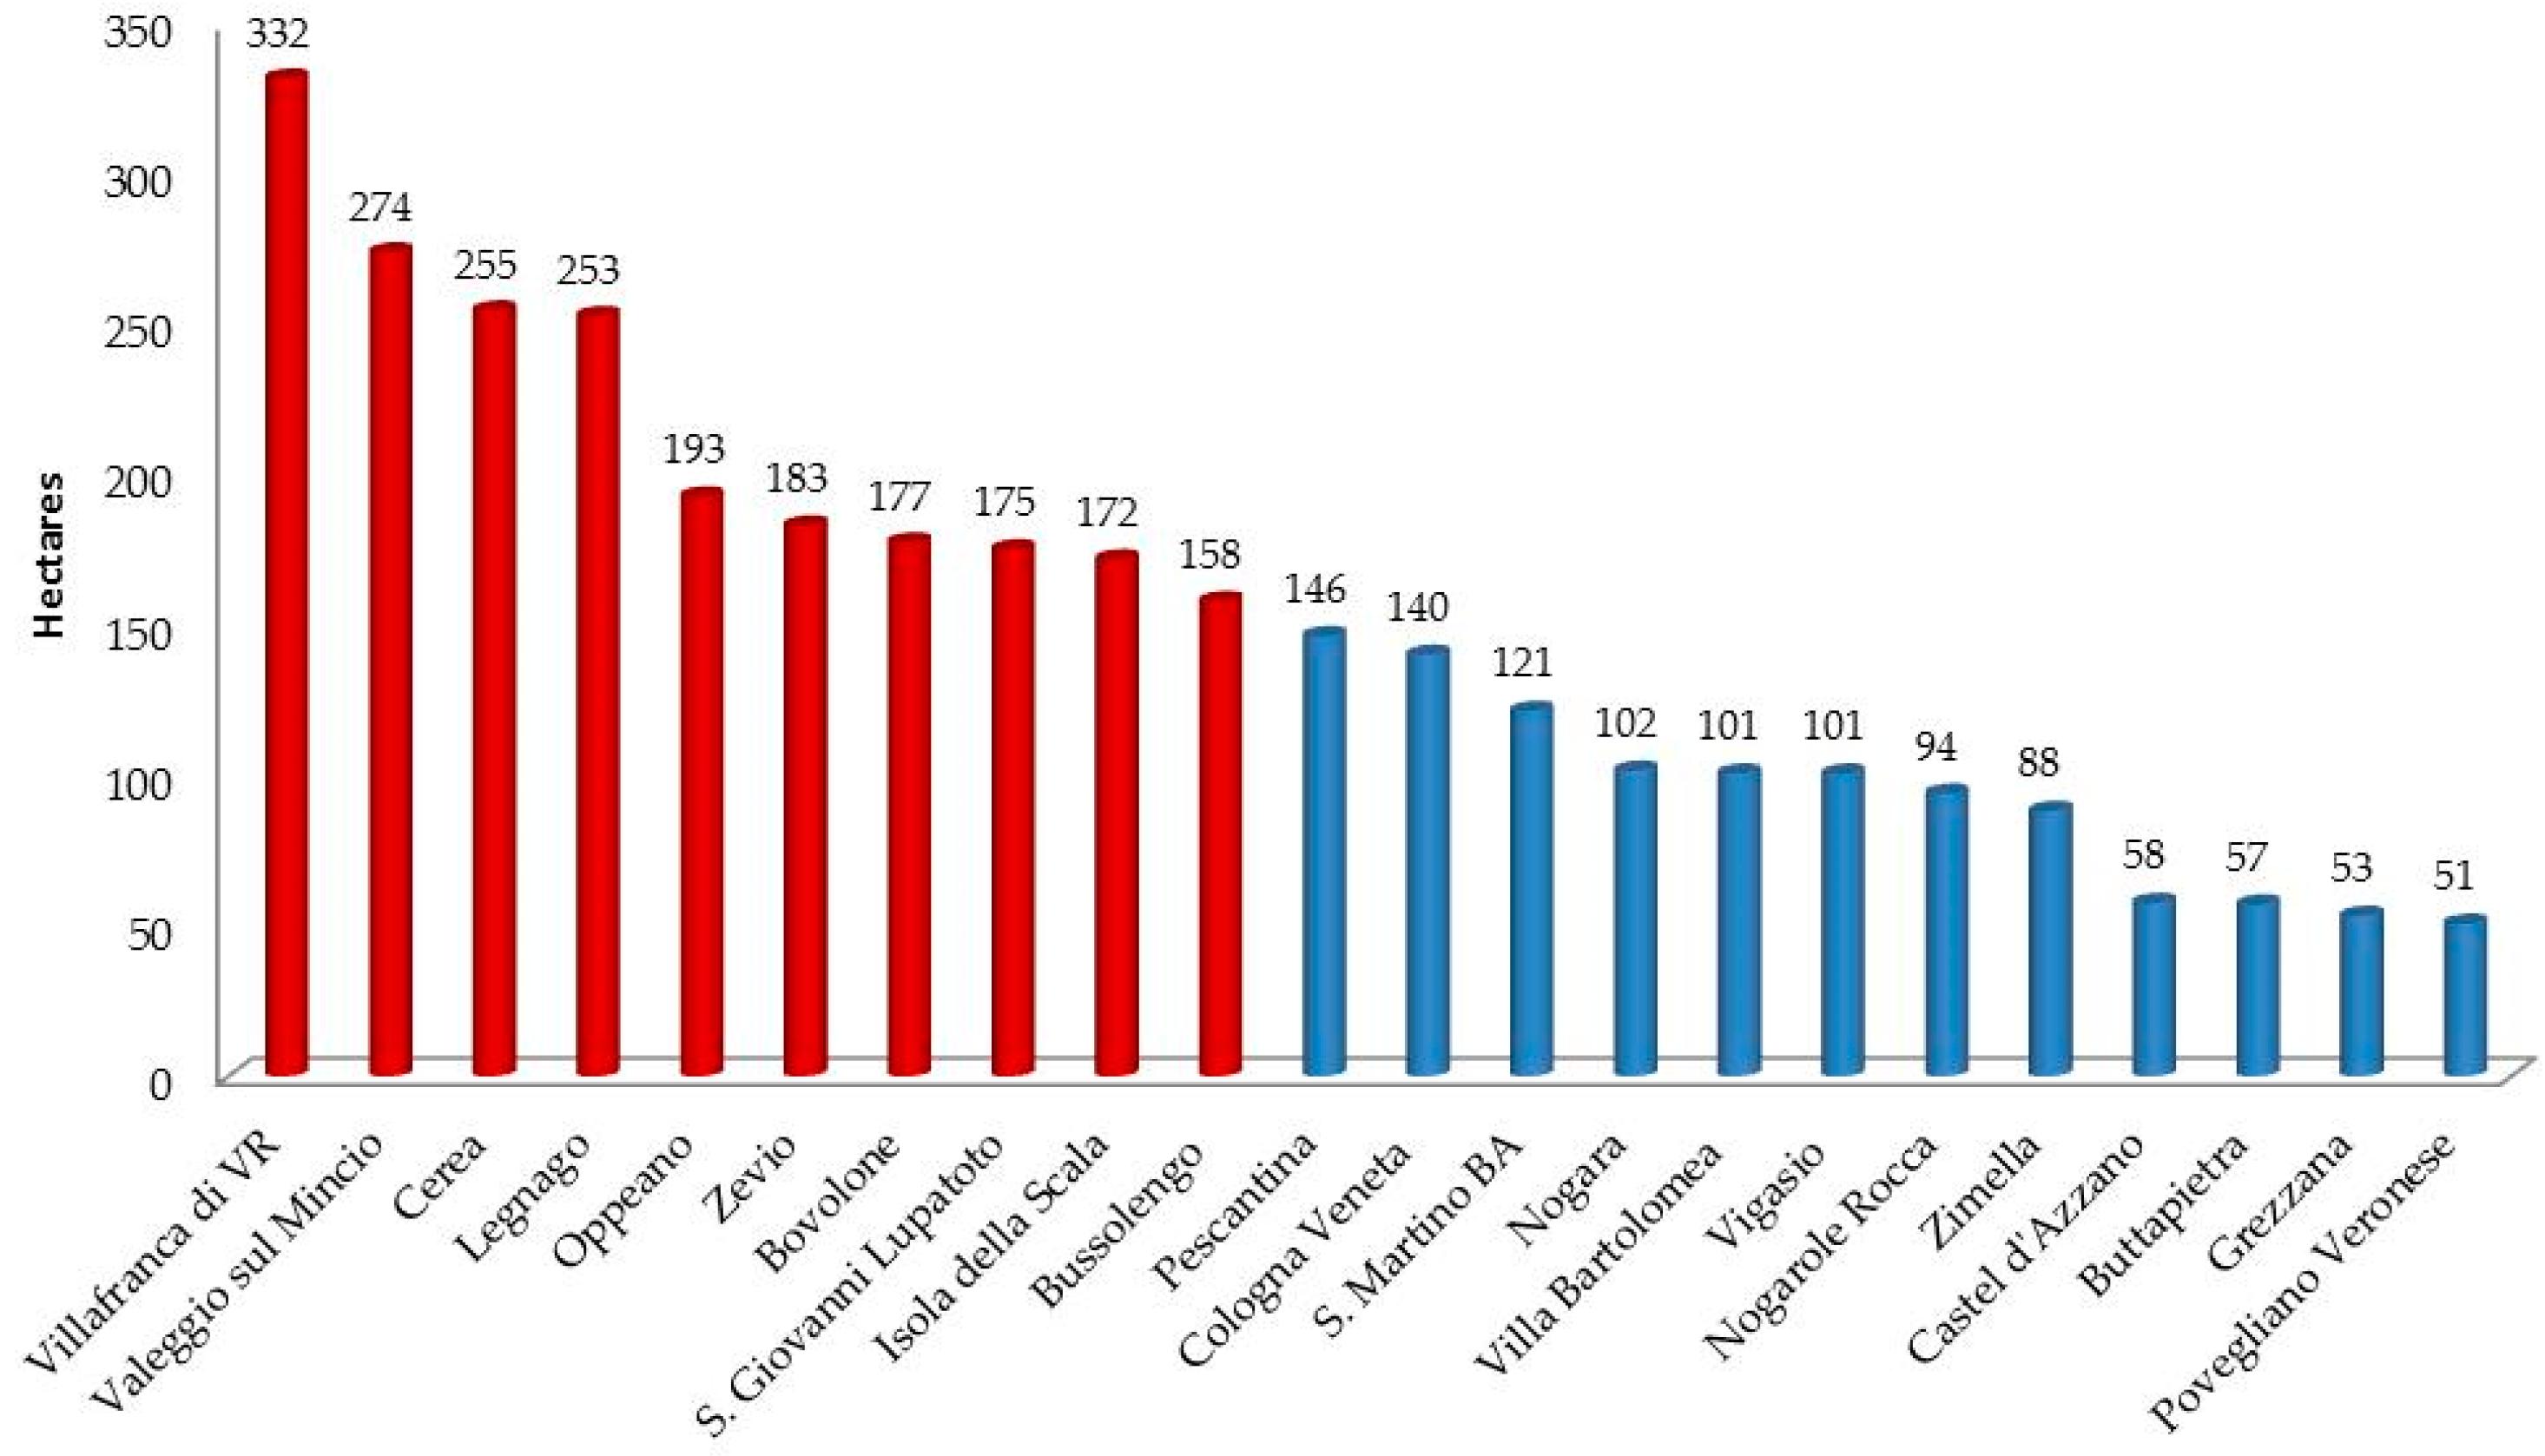
3.2. Competing Land Demands at the Provincial and Municipal Levels. Trends in Land Take

Over the past 50 years, the Veronese area has been subjected to a massive overbuilding. The municipalities of the first belt around the Provincial capital (Verona) were the first to be affected by this phenomenon, followed by some from the second belt and around Lake Garda. A look at the values of the indices elaborated on the Regional land use data support the claim made: between 1983 and 2006, at the Provincial level, artificially-modeled surfaces increased on average by 23%, mainly in the 1983–1996 sub-interval. Approximately 8000 hectares are in a new artificial state. Analysis at the municipal level allows a more thorough reading, while confirming the trend. The territories that, in a more or less accentuated manner, show vine-growing propensity (32 municipalities that exceed the threshold of 25% of vineyard surface relative to the total agricultural use) have lost 2083 hectares. It seems evident that the bulk of the change in destination of land use (about 75% of the 8063 hectares mentioned) occurs in municipalities where the Type of Farming (EC Reg. n. 1242/2008) in question has now little relevance. The trend fades in the period 1996–2006, in which only 30% of the LUCC can be attributed. One trait is, however, common to both groups: almost all of the conversions are due to the transformation of agricultural lands (99%).
The observed pattern—while being aware of the impossibility of a direct comparison between datasets—is, moreover, consistent with the findings from the analysis of ISTAT census data in 2000 and 2010: the Utilized Agricultural Area and the Total Agricultural Area in the Veneto decreased, in fact, by 4.6% and 13.7% respectively [48]. From 1970 to 2010—for a much longer period than we analyzed—in the Province of Verona, the Total Agricultural Area suffered a decrease of 17.5% and the Utilized Agricultural Area of 12.6% (25,000 hectares) [49] (p. 8). Consistent with what we have shown by analyzing the data on land use, the trend accelerated sharply especially in the 1990s and the first decade of the 21st century. The reduction of the production base and the consequent depletion of the agricultural resource is, in part, due to the divestment of activities on less productive agricultural and forest land. This phenomenon—for years endemic in Veneto and linked to depopulation—was caused by technological progress, driven by the need to increase the competitiveness of the sector, crop intensification and specialization. The decrease of agricultural area is offset by the new destination of use, especially in flat areas where the soils are more valuable and often most fertile. The fact is linked to the growing demand for land to be converted into building fabric: residential, commercial and service, and—above all—functional to the increase of communication routes and industrial areas [22] (p. 29). In the 1960s and 1990s, industrialization changed, in fact, almost every part of the plain. It first affected the Provincial capitals and then—moving as a wave—the urban belt and small areas in nearly all rural municipalities [50]. This was the triumph of localism, clusters, districts and meta-districts (industrial and other types) [51]. They ranged from agro-industrial districts [52,53] to ones specializing in advanced mechanics.
Generally, the bulk of LUCC concerns non-viticultural municipalities, overwhelmed as early as the 1970s by the economic boom, with non-stop, intense building activity (productive, residential and roadway). Good examples are Zevio, San Giovanni Lupatoto, Oppeano, Valeggio sul Mincio and Villafranca di Verona, on which we have focused here by way of example (Figure 6). In the latter, the expansions of the productive areas towards the northeast from Villafranca have created compact areas that extend almost as much as the town itself (Figure 7). The number of businesses—especially in the second and third sectors—clearly reflects this phenomenon as is evident from reading the Chamber of Commerce figures [54]. The urbanization described has led to a growth in roads and traffic.
In the municipalities suited to vineyards, conversely, the hectares converted to artificial fabric usually have lower values (Figure 8).
This is not always the case, however. In some, in fact, numerous manufacturing companies, and now even service providers, are localized. Moreover, they have welcomed and still welcome the migratory flows generated by residential decentralization and that point to the second belt (portions of the population attracted by lower costs, by not being far away from the Provincial capital and by a good level of quality of life). This is the case, for example, of Colognola ai Colli, Soave and San Bonifacio—located along the Verona/Vicenza corridor [55]—or Sona, Sommacampagna and Castelnuovo del Garda. In them, the areas associated with polygons transformed into artificially-modeled territory are not negligible, although they do not reach the peaks expressed by the entities mentioned just above. This seems obvious when we analyze the data of the land use plan of Colognola (PATI) (Section 3.3.1).

3.3. Settlement Growth and Changing Urban Shapes: Towards a More Compact Development?

The Kernel density estimation revealed results consistent with previous findings, obtained through the calculation of average nearest neighborhood statistics (using, therefore, an alternative method) [56]. At Provincial level, clear patterns are evident. Between 1983 and 1996, there was a decline in dispersed artificial surfaces (−2.1%) as opposed to non-defined areas and compact developments (both increasing by 1.5% and 2.4%, respectively). This pattern was then confirmed during the second decade (1996–2006). There emerges, however, a notable change when regarding the overall period (1983–2006): at the Provincial level, urban forms develop in a more “compact” way. Developments are built with higher densities than the typical suburban areas of the past (clustered areas increased over 4.5%, while dispersed surfaces decreased by about 4%) (Table 3).
Based on the above, urban density maps have been developed to visually highlight different settlement forms, together with the spatial distribution of the classes calculated. A series of maps at the Provincial level (one for each time threshold) show a noticeable evolution of expansion of artificial surfaces (in black and red). Polygons depicted in light blue-turquoise identify dispersed areas, spread over the entire surface. The development is unmistakably centered along the road and transportation axis, and tends to enlarge and connect the existing (urban) nuclei. Most of the clustered surface is of course located around the capital city of the Province (Verona) (Figure 9).
Going into more detail and analyzing municipalities whose area under vines is between 25% and 60% of the total utilized agricultural area, and those whose threshold exceeds 60%, we observe similar (albeit less obvious) general trends. In the former group, out of the total Provincial area (3097 km2), dispersed built-up areas have decreased by about 0.8% over the entire period. They declined marginally more during the first period (1983–1996) compared to the second (1996–2006), by 0.5% and 0.3% respectively. From the first to the last time series, clustered urban development increased by 0.8%. Coherently with the description of the LUCC provided in Section 3.2, the phenomenon slowed down somewhat in the period 1996–2006. In monoculture areas, dispersed artificial surfaces decreased slightly. Clustered artificial surfaces, instead, increased all together by 0.5% (Table 3). Studying the map, however, the above is only slightly noticeable. With the purpose of a deeper examination, the potential evolution of one of the most industrialized municipalities of the monoculture districts (Colognola ai Colli) was then tested: one which has therefore experienced—and experiences—conflicting pressures. This municipality exemplifies all those which, although suited to viticulture, present the same characteristics and LUCC as those with above average capacity.
A premise must however be made: the kernel analysis of the 1983–2006 data has been applied separately to the areas covered by the two masks (that which isolates the monoculture area and that which views wine as a protagonist despite being a polyculture). Focusing on values that affect the areas of rural municipalities having little manufacturing or dedicated to services—and for which there are few hectares involving class switching towards 1 (for example, Illasi, Cazzano di Tramigna or Marano di Valpolicella)—the trend is much more contained, indicating a lower contraction of the agricultural structure (and therefore less deterioration of the landscape).

3.3.1. Peering into the Future, Testing Spatially Explicit Urban Planning Data: The Exemplary Case of the Municipality of Colognola ai Colli

Analyzing the PATI of Colognola gave interesting results. The projection suggests that clustered urban developments may expand even in grape-growing areas. This occurs, though, in areas that are also heavily industrialized. The emerging pattern is similar to that identified at a Provincial scale when examining data relative to previous decades. The clustered area, in fact, increases at a rate of 9% during the first decade, and by 10% during the second. Dispersed artificial areas, on the other hand, decline constantly. Examining PATI land use data highlights an increment in compact developments potentially of about 10%. Dispersed artificial territories may decline at a rate of 8% (Table 4 and Figure 10).
In Section 4, we will review the evidence discussed in Section 3 in view of the development model change that characterizes the Veneto Region.

4. Discussion

In Veneto, the convulsive urbanization of the central belt—often with speculative logic [49]—determines the compact metropolization of the Padua-Venice-Treviso area, with significant accumulations, as demonstrated, even around the other capitals (Verona and Vicenza) and extensions along the connecting axes and those radial with respect to the centers. Polycentrism is manifested not only in the Provincial capitals but also in many smaller towns and tourist centers: seaside and lake resorts, spas and inland. Sprawl has, therefore, not only hit the central strip [57].
Referring now specifically to the Veronese area, it should be remembered that the proliferation of built-up areas has created very different morphologies. In the 1960s and 1970s, in the peri-urban municipalities, there was disharmonious, dense residential construction, often set on previous narrow roads, intensive in terms of land use but giving rise to continuous additions of small areas of low density, to which a portion of more relevant density was attached (4–5 story apartment blocks); all with local services. Small industrial areas were located in both ad hoc areas taken from agriculture and along the roads. The 1980s witnessed a spread of construction, nearly always extensions to previous buildings, followed by the establishment of several new allocations (detached and terraced houses, and even more several story-high apartment buildings) [55].
New types of commercial suburban forms began to take hold in the late 1980s, then becoming pervasive in the 1990s [58]. Furthermore, in this latter period and in the 2000s, new multifunctional suburban polarities were generated (for example in Affi, at the exit of the Brennero A22 motorway in connection with Lake Garda). These were based on the acquisition of vast agricultural or abandoned areas, and have new building morphologies and land use. New distribution activities were installed that occupy large areas such as hypermarkets, new formats such as retail parks and new types of tourist activities (like hotels with attached conference centers and spas). New infrastructures were also added for recreation (such as multiplex cinemas), buildings with various activities (gymnasiums, for example) and water or amusement parks. At the same time, another widely-consuming land area is the tertiary sector for large storage infrastructure and trade. Examples include distribution centers, logistics platforms, and also large-scale retail businesses in the non-grocery product category (such as Decathlon and Leroy-Merlin). The freight village “Interporto Quadrante Europa” and the agro-food Center, new road nodes, communication routes as well as new toll gates have been built. The above-mentioned structures encourage car ownership that induces, in turn, other land uses related to the general demand for car parks and roads. Over time, the scenario has changed: it has gone from a “city region” to an “urban region” [59,60].
In addition, we see now that the economic structure has undergone considerable metamorphosis with respect to the “Third Italy” model of the 1970s and 1980s [61]. From the (Marshallian) district structure—in which the economy-society-territory nexus is strong and in the hands of SMEs—there has emerged both a structure in which the industry is partly divorced from the territory and a strong service sector; in the territory in a broad sense, we see the coexistence of multiple activities [62]. In this “new post-metropolitan Veneto”, even the choice of location changes logic following different needs with respect to those in the past (for example related to Knowledge Intensive Business Services). All of the above has negative consequences that artificially shape the territory. Projects that speak of territorial transformation and associated changes in land use are still numerous and will impact, if and when completed, on large areas. They go hand-in-hand with a policy of expansion recorded in plans approved in the recent past. Local policies still do not adequately stop the conversion of land, and seem to be out of control at higher levels, which are unable to harness them.
Within this context of pervasive land-take, vineyards tenaciously preserve farming areas. They create ordered and attractive landscapes, and help to mitigate the perverse effects of a settlement and development model, which is at times schizophrenic (having serious implications not only with regard to landscape deterioration but also in terms of increased vulnerability to disasters and the decreased resilience of territories [63,64]). Vineyards, though, may not always act in a virtuous way and could create diseconomies if not properly regulated (such as vines recently planted along the sides of roads, thus narrowing the carriageway and impeding the use of the roadside for other purposes).

5. Conclusions

In the study area, detected LUCCs occurred on a settlement basis consisting of several centers often placed linearly and successively: the new compact development enlarged them and made them closer to each other, and differentiated their functions. Nevertheless, the agricultural settlement structure of scattered houses and nuclei is basically dispersed, and has remained so. The trend identified at a Provincial level—decreasing dispersed artificial surfaces (remaining nonetheless worthy of note) and increasing clustered urban developments—was also detected in areas under vine, but was more modest to the point of being nearly unnoticeable. The land use data provided by the Veneto Region seem to indicate that this agricultural vocation has, in the past, “created resistance” to the alienation of land. This statement, however, needs to be investigated in other vine-growing areas and on a more appropriate scale: i.e., at a municipality level. As emerged when examining Colognola ai Colli Land Use Plan, studying individual trajectories of municipalities seems crucial. The risk, it turns out, is that even in the vine-growing areas the urban-rural interface will in the future eat away that very mixed capital (cultural and natural) to be used as a base to allow multiple specializations to express their potential.
In the post-metropolitan rural Veneto [65,66], these cannot be activated if they are not based on spatially explicit and embedded resources: the expertise of farmers on the one hand, and the terroir and the landscape on the other. The artifacts produced even in these territories, however, often delineate the contours of incoherent development models, which mostly deterritorialize (only in some cases do they territorialize, recovering—“updated”—identity values). The landscape is in fact dotted with areas where buildings abound that do not have any real use, and which are often unsold. These spaces (perhaps because companies have ceased to exist) are only partly the subject of regeneration with new functions. They are scattered because the desired industrial areas are scattered. If the picture and the economic and productive model is changed, this built-up area—often close to heritage (for example, vineyard landscapes)—ends up becoming a potential future heterotopia, with spaces “unresolved” for many years: iconic cathedrals of a speculative logic, disconnected with the soul of places and communities.

Acknowledgments

This paper is supported by the 60%/2014 Fund of the Interuniversity Department of Regional and Urban Studies and Planning of the University of Turin (Italy). M.G. Lucia is responsible for this Fund. The authors would like to thank the Direzione Pianificazione Territoriale of the Regione Veneto (Italy) for its kind cooperation, and for having released the data drawn from the Quadro Conoscitivo e strumenti urbanistici, L.R. 11/2004 (PATI). For Regione Veneto, we would also like to thank the Sezione Sistema Statistico Regionale for having released the Italian Agricultural Census data (1982, 1990, 2000, and 2010) and the Dipartimento Territorio/Sezione Pianificazione Territoriale Strategica e Cartografia for releasing the land use and cover data (1983, 1996, and 2006).

Author Contributions

Luca Simone Rizzo, Raffaela Gabriella Rizzo and Filippo Smerghetto conceived and designed the study, outlined the methodology, and elaborated the data. The drafting is attributed to: Luca Simone Rizzo for Section 1, Section 1.1, Section 2.1, Section 2.2.1, Section 3.2 and Section 4; Raffaela Gabriella Rizzo composed Section 1.2 and Section 3.1; Section 2.2.2, Section 3.3 and Section 3.3.1 are written by Luca Simone Rizzo and Filippo Smerghetto; and Section 5 was written by all authors. Maria Giuseppina Lucia contributed to the paper by offering policy suggestions. All maps were created by L.S. Rizzo and F. Smerghetto using ArcGIS 10.2. All authors have read and approved the final manuscript.

Conflicts of Interest

The authors declare no conflict of interest.

References

  1. EEA. Urban Sprawl in Europe. The Ignored Challenge. Report 10. 2006. Available online: http://www.eea.europa.eu/publications/eea_report_2006_10 (accessed on 21 December 2016).
  2. Siedentop, S.; Fina, S. Who sprawls most? Exploring the patterns of urban growth across 26 European countries. Environ. Plan. A 2012, 44, 2765–2784. [Google Scholar] [CrossRef]
  3. Antrop, M. Landscape change and the urbanization process in Europe. Landsc. Urban Plan. 2004, 67, 9–26. [Google Scholar] [CrossRef]
  4. Abrantes, P.; Soulard, C.; Jarrige, F.; Laurens, L. Dynamiques urbaines et mutations des espaces agricoles en Languedoc-Roussillon (France). Cybergeo: Eur. J. Geogr. 2010, 485, 1–20. (In French) [Google Scholar] [CrossRef]
  5. Gricorescu, I.; Mitrica, B.; Mocanu, I.; Ticana, N. Urban sprawl and residential development in the Romanian Metropolitan Areas. Rev. Roum. Geogr. 2012, 56, 43–59. [Google Scholar]
  6. Jiang, L.; Deng, X.; Seto, K.C. The impact of urban expansion on agricultural land use intensity in China. Land Use Policy 2013, 35, 33–39. [Google Scholar] [CrossRef]
  7. Prokop, G.; Jobstmann, H.; Schonbauer, A. Report on Best Practices for Limiting Soil Sealing and Mitigating Its Effects; DG Environment—European Commission: Luxembourg, 2011; pp. 1–230. [Google Scholar]
  8. Poyat, R.V.; Pataki, D.E.; Belt, K.T.; Groffman, P.M.; Hom, J.; Band, L.E. Effects of Urban Land-Use Change on Biogeochemical Cycles. In Terrestrial Ecosystems in a Changing World; IGBP Series; Candell, J.G., Pataki, D.E., Pitelka, L.F., Eds.; Springer: Berlin/Heidelberg, Germany, 2007; pp. 45–56. [Google Scholar]
  9. EC. Guidelines on Best Practice to Limit, Mitigate or Compensate Soil Sealing; SWD (2012) 101 Final; European Commission: Brussels, Belgium, 2012; pp. 1–65. [Google Scholar]
  10. Briassoulis, H. Analysis of Land Use Change: Theoretical and Modeling Approaches; Regional Research Institute, West Virginia University: Morgantown, WV, USA, 2000; Available online: http://econpapers.repec.org/bookchap/rriwholbk/17.htm (accessed on 4 August 2016).
  11. Bičı́k, I.; Jelecek, L.; Stepanek, V. Land-use changes and their social driving forces in Czechia in the 19th and 20th centuries. Land Use Policy 2001, 18, 65–73. [Google Scholar] [CrossRef]
  12. Verburg, P.H.; Schot, P.P.; Dijst, M.J.; Veldkamp, A. Land use change modelling: Current practice and research priorities. GeoJ. 2004, 61, 309–324. [Google Scholar] [CrossRef]
  13. Hietel, E.; Waldhardt, R.; Otte, A. Analysing land-cover changes in relation to environmental variables in Hesse, Germany. Landsc. Ecol. 2004, 19, 473–489. [Google Scholar] [CrossRef]
  14. Bender, O.; Boehmer, H.J.; Jens, D.; Schumacher, K.P. Analysis of land-use change in a sector of Upper Franconia (Bavaria, Germany) since 1850 using land register records. Landsc. Ecol. 2005, 20, 149–163. [Google Scholar] [CrossRef]
  15. Bender, O.; Boehmer, H.J.; Jens, D.; Schumacher, K.P. Using GIS to analyse long-term cultural landscape change in Southern Germany. Landsc. Urban Plan. 2005, 70, 111–125. [Google Scholar] [CrossRef]
  16. Chabra, A.; Geist, H.; Houghton, R.A.; Haberl, H.; Braimoh, A.K.; Vlek, P.L.G.; Patz, J.; Xu, J.; Ramankutty, N.; Coomes, O.; Lambin, E.F. Multiple Impacts of Land-Use/Cover Change. In Land-Use and Land-Cover Change: Local Processes and Global Impacts; Lambin, E.F., Geist, H.J., Eds.; IGBP Series; Springer: Berlin/Heildelberg, Germany, 2006; pp. 71–116. [Google Scholar]
  17. Christiansen, P.; Loftsgarden, T. Drivers Behind Urban Sprawl in Europe; Institute of Transport Economics, Norwegian Centre for Transport Research: Oslo, Norway, 2011; pp. 1–41. Available online: https://www.toi.no/getfile.php/Publikasjoner/T%C3%98I%20rapporter/2011/1136–2011/1136–2011-el.pdf (accessed on 24 September 2016).
  18. Kretschmer, O.; Ultsch, A.; Behnisch, M. Towards an understanding of land consumption in Germany-outline of influential factors as a basis for multidimensional analyses. Erdkunde 2015, 69, 267–279. [Google Scholar] [CrossRef]
  19. Plieninger, T.; Draux, H.; Fagerholm, N.; Bieling, C.; Burgi, M.; Kizos, T.; Kuemmerle, T.; Primdahl, J.; Verburg, P.H. The driving forces of landscape change in Europe: A systematic review of the evidence. Land Use Policy 2016, 57, 204–214. [Google Scholar] [CrossRef]
  20. Bencardino, M. Consumo di suolo e sprawl urbano. Boll. Soc. Geogr. Ital. 2015, VIII, 491–514. Available online: http://societageografica.net/wp/wp-content/uploads/2016/08/bencardino_eng.pdf (accessed on 8 September 2016). (In English)[Google Scholar]
  21. Munafò, M. Il consumo di suolo in Italia. Urban. Inf. 2013, 247, 19–21. Available online: http://www.urbinfo.it/UI/UI247.pdf#page=21 (accessed on 8 September 2016). (In Italian)[Google Scholar]
  22. Rizzo, L.S.; Rizzo, R.G.; Tizzani, P. The impact of anthropogenic land use changes on the ecological quality of (selected) territories in Northern Italy. In Land Use—Land Cover Changes in Selected Regions in the World. Atlas; Bičík, I., Himiyama, Y., Ferenac, J., Kupcova, L., Eds.; IGU Commission: LUCC, Charles University in Prague-Institute of Geography, Hokkaido University of Education: Asahikawa, Japan, 2014; Volume IX, pp. 19–32. [Google Scholar]
  23. Iovino, G. L’Italia consumata. Configurazioni e tendenze del land take. Boll. Soc. Geogr. Ital. 2015, VIII, 217–237. Available online: http://societageografica.net/wp/wp-content/uploads/2016/08/4–15_iovino_eng.pdf (accessed on 8 September 2016). (In English)[Google Scholar]
  24. Munafò, M.; Strollo, A.; Zitti, M.; Salvati, L. Soil sealing and urban sprawl nei territori in transizione: Una prospettiva italiana. Riv. Geogr. It. 2011, 118, 269–296. (In Italian) [Google Scholar]
  25. Petsimeris, P. Counter-urbanization in Italy. In The International Handbook of Urban Systems; Geyer, H.E., Ed.; Elgar: Cheltenham, UK, 2002; pp. 215–240. [Google Scholar]
  26. Barney, J.B. Firm resources and sustained competitive advantage. J. Manag. 1991, 17, 99–120. [Google Scholar] [CrossRef]
  27. West, G.P.; Bamford, C.E.; Marsden, J.W. Contrasting Entrepreneurial Economic Development in Emerging Latin American Economies: Applications and Extensions of Resource-Based Theory. Entrep. Theory Pract. 2008, 32, 15–36. [Google Scholar] [CrossRef]
  28. Denicolai, S.; Cioccarelli, G.; Zucchella, A. Resource-based local development and networked core-competencies for tourism excellence. Tour. Manag. 2010, 31, 260–266. [Google Scholar] [CrossRef]
  29. Costantini, E.A.C.; Bucelli, P. Suolo, vite ed altre colture di qualità: l’introduzione e la pratica dei concetti “terroir” e “zonazione”. Ital. J. Agron./Riv. Agron. 2008, 1, 23–33. Available online: https://www.researchgate.net/profile/E_Costantini/publication/50257670_Soil_vine_and_other_quality_cultures_terroir_and_zonazione_concepts_introduction_and_practice/links/02e7e5305c07410d7d000000.pdf (accessed on 8 September 2016). (In Italian)[Google Scholar] [CrossRef]
  30. Douglas, N.; Derret, R. (Eds.) Special Interest Tourism; Wiley: Melbourne, Australia, 2001.
  31. Pitte, J.-R. La nouvelle géographie de vins français. Treb. Soc. Catalana Geogr. 2004, 53, 107–119. (In French) [Google Scholar] [CrossRef]
  32. Bastian, O.; Grunewald, K.; Syrbe, R.U.; Walz, U.; Wende, W. Landscape services: The concept and its practical relevance. Landsc. Ecol. 2014, 29, 1463–1479. [Google Scholar] [CrossRef]
  33. Bruwer, J.; Lesschaeve, I. Wine tourists’ destination region brand image perception and antecedents: Conceptualization of a winescape framework. JTTM 2012, 29, 611–628. [Google Scholar] [CrossRef]
  34. Croce, E.; Perri, G. Food and Wine Tourism: Integrating Food, Travel and Territory; Cabi Tourism Texts: Wallingford, UK, 2010. [Google Scholar]
  35. Gallo, D.; Zanetti, P.G. Paesaggi Agrari della Pianura Veneta; Veneto Agricoltura: Legnaro, Italy, 2014; Available online: http://www.venetoagricoltura.org/basic.php?ID=5300 (accessed on 10 June 2016). (In Italian)
  36. ISMEA. Aspetti Strutturali e di Mercato del Comparto dei vini DOC-DOCG; Società Editrice Imago Media: Dragoni, Italy, 2008; Available online: http://www.ismea.it/flex/cm/pages/ServeBLOB.php/L/IT/IDPagina/2945 (accessed on 15 September 2016). (In Italian)
  37. Rizzo, L.S. IT: Da ausilio tecnico gestionale a fattore di cambiamento territoriale e paesaggistico. Un caso emblematico nella filiera viticola del Veneto Occidentale. In Nuove Comunicazioni Globali e Nuove Geografie; Corna Pellegrini, G., Paradiso, M., Eds.; CUEM: Milan, Italy, 2009; pp. 237–254. (In Italian) [Google Scholar]
  38. ISTAT, Agricultural Census. Available online: http://www.istat.it/en/agricultural-census (accessed on 16 August 2016).
  39. CORINE Land Cover. Available online: http://www.eea.europa.eu/publications/COR0-landcover (accessed on 12 September 2016).
  40. Il Piano di Assetto del Territorio. Available online: https://www.regione.veneto.it/web/ambiente-e-territorio/pat (accessed on 18 August 2016). (In Italian)
  41. EUROSTAT, RAMON—Reference and Management of Nomenclatures. Available online: http://ec.europa.eu/eurostat/ramon/nomenclatures/index.cfm?TargetUrl=DSP_GLOSSARY_NOM_DTL_VIEW&StrNom=CODED2&StrLanguageCode=EN&IntKey=16664635&RdoSearch=&TxtSearch=&CboTheme=&IntCurrentPage=1 (accessed on 31 December 2016).
  42. Schwarz, N. Urban form revisited—Selecting indicators for characterising European cities. Landsc. Urban Plan. 2010, 96, 29–47. [Google Scholar] [CrossRef]
  43. Steinmann, R.; Krek, A.; Blaschke, T. Can online map-based applications improve citizen participation? In E-Government: Towards Electronic Democracy; Bohlen, M., Gamper, J., Polasek, W., Wimmer, M.A., Eds.; Springer: Berlin/Heidelberg, Germany, 2005; pp. 25–35. [Google Scholar]
  44. Danese, M.; Lazzari, M.; Murgante, B. Kernel Density Estimation Methods for a Geostatistical Approach in Seismic Risk Analysis: The Case Study of Potenza Hilltop Town (Southern Italy). In Computational Science and Its Application—ICCSA 2008; Gervasi, O., Murgante, B., Lagana, A., Taniar, D., Mun, Y., Gavrilova, M.L., Eds.; Springer: Berlin/Heidelberg, Germany, 2008; pp. 415–429. [Google Scholar]
  45. Meyer, S.P. Finance, insurance and real estate firms and the nature of agglomeration advantage across Canada and within metropolitan Toronto. Can. J. Urban Res. 2007, 16, 149–181. [Google Scholar]
  46. Cusimano, M.D.; Chipman, M.; Glazier, R.H.; Rinner, C.; Marshall, S.P. Geomatics in injury prevention: The science, the potential and the limitations. Inj. Prev. 2007, 13, 51–56. [Google Scholar] [CrossRef] [PubMed]
  47. Rizzo, L.S. Wine cooperatives in the East of the Verona Province. Company consolidation and networking: An update. In The Role of Cooperatives in the European Agro-Food System; Fanfani, R., Ricci-Maccarini, E., Eds.; AIEA2—Department of Statistics University of Bologna, Bononia University Press: Bologna, Italy, 2009; pp. 281–302. [Google Scholar]
  48. Povellato, A. (Ed.) Rapporto di Analisi per la Priorità 4 e 5 del PSR Veneto 2014–2020; INEA Veneto: Legnaro, Italy, 2013; Available online: http://piave.veneto.it (accessed on 23 August 2016). (In Italian)
  49. Legambiente. Mattone e Finanza. Consumo di Suolo e Ruolo Della Pianificazione Nella Provincia di Verona; Legambiente: Verona, Italy, 2013; Available online: http://www.legambienteverona.it/iniziative/Legambiente%20word%20press/Documenti/Urbanistica/Dossier%20mattone%20e%20finanza.pdf (accessed on 20 September 2016). (In Italian)
  50. Rizzo, G. Veneto. Alla ricerca di nuove strategie. In I Sistemi Locali delle Regioni Italiane (1970–1985); Landini, P., Salvatori, F., Eds.; Memorie della Società Geografica Italiana: Roma, Italy, 1989; pp. 119–166. (In Italian) [Google Scholar]
  51. Corò, G.; Rullani, E. (Eds.) Percorsi Locali di Internazionalizzazione. Competenze e Auto-Organizzazione Nei Distretti Industriali del Nord-Est; Franco Angeli: Milano, Italy, 1998. (In Italian)
  52. Murdoch, J. Networks—A new paradigm of rural development? J. Rural Stud. 2000, 16, 407–419. [Google Scholar] [CrossRef]
  53. Sonnino, R. The power of place: Embeddedness and local food systems in Italy and the UK. AOF 2007, S2. Available online: http://aof.revues.org/454 (accessed on 28 December 2016). [Google Scholar]
  54. Camera di Commercio di Verona, Villafranca—Statistiche Economiche. Available online: https://www.vr.camcom.it/sites/default/files/statistiche/villafranca%20di%20verona%202016.pdf (accessed on 15 September 2016). (In Italian)
  55. Robiglio, C. (Ed.) Verona Est. Le Attività Economiche e Il Territorio. Approcci e Metodi per lo Studio di Territori Complessi; ABC Studi Editore: Verona, Italy, 2006; Available online: http://www.vr.camcom.it/page.jsp?id_menu=4074&show=view&tipo_content=GENERICO&label_content=Verona+Est+-+Le+attivit%C3%A0+economiche+e+il+territorio (accessed on 1 September 2016). (In Italian)
  56. Rizzo, L.S.; Rizzo, R.G.; Smerghetto, F. Land-use and Landscape Changes: A Methodological Proposal for the Creation of Sustainable Cultural Tourism Itineraries. In Landscape Analysis and Planning; Luc, M., Somorowska, U., Szmanda, J.B., Eds.; Springer: London, UK; Heidelberg, Germany, 2015; pp. 21–44. [Google Scholar]
  57. Fregolent, L. (Ed.) Conflitti e Territorio; Franco Angeli: Milano, Italy, 2014. (In Italian)
  58. Cozzi, S. La Distribuzione Commerciale in Italia: Caratteristiche Strutturali e Tendenze Evolutive. Contributi a Cura dell’ISTAT. 2006. Available online: http://www3.istat.it/dati/pubbsci/contributi/Contributi/contr_2006/2006_8.pdf (accessed on 10 September 2016). (In Italian)
  59. Basso, M. A nord-est la dispersione non è finita. Una riflessione a partire dall’osservazione di alcune pratiche di trasformazione territoriale. Arch. Studi Urbani Reg. 2013, 108, 113–133. (In Italian) [Google Scholar] [CrossRef]
  60. Fregolent, L.; Vettoretto, L. Contemporary process of urban regionalization: The case of the Veneto Region. In Proceedings of the 55th European Regional Science Congress, Lisbon, Portugal, 25–28 August 2015; Available online: https://www.researchgate.net/profile/Luciano_Vettoretto/publication/295912430_Contemporary_process_of_urban_regionalization_the_case_of_the_Veneto_Region/links/56d0689008ae059e375d40d6.pdf (accessed on 15 September 2016).
  61. Bagnasco, A. Tre Italie; Il Mulino: Bologna, Italy, 1977. (In Italian) [Google Scholar]
  62. Vettoretto, L.; Fregolent, L. Il Veneto dopo la Terza Italia: Spazi metropolitani e post metropolitani. Territorio 2016, 76, 46–51. (In Italian) [Google Scholar] [CrossRef]
  63. Vassena, G.P.M.; Chiamone, T.; Rizzo, R.G.; Rizzo, L.S.; Tizzani, P. Tecniche di rilievo 3D in territori complessi con zone ad elevato rischio idrogeologico. Condivisione in rete di dataset ad alta risoluzione (derivati da dati LiDAR). Boll. AIC 2014, 149, 173–187. Available online: http://hdl.handle.net/10077/9946 (accessed on 2 September 2016). (In Italian)[Google Scholar]
  64. Rizzo, L.S.; Rizzo, R.G.; Sambugaro, G.; Tizzani, P. Gestione di un territorio ad alto rischio idrogeologico e riflessi su conservazione e fruizione dell'heritage in esso dislocato. Boll. AIC 2012, 144–146, 245–258. Available online: http://hdl.handle.net/10077/11715 (accessed on 2 September 2016). (In Italian)[Google Scholar]
  65. Garavaglia, L.; Pennati, D. I corridoi nello scenario territoriale e urbano italiano. Territorio 2016, 76, 23–27. (In Italian) [Google Scholar] [CrossRef]
  66. Messina, P. La Metropolizzazione Come Strategia di Sviluppo. Nuove forme di Governance e Modi di Regolazione per le City Regions Europee; Congresso nazionale della SISP, Univ. di Perugia: Perugia, Italy, 2014; Available online: http://www.sisp.it/files/papers/2014/patrizia-messina-1986.pdf (accessed on 18 August 2016). (In Italian)
Figure 1. In the upper part: Italy and the Triveneto; in the lower part: the Province of Verona with its municipalities (in red, the municipality of Colognola ai Colli, also in the detail to the right).
Sustainability 09 00116 g001
Figure 2. Outline of the methodology used to carry out the spatial analysis.
Sustainability 09 00116 g002
Figure 3. Outline of the methodology used to carry out the geostatistical analysis.
Sustainability 09 00116 g003
Figure 4. Municipalities of the Province of Verona with wine-grape producing vocation higher than 25% [(Utilized agricultural area with vines/Total utilized agricultural area) × 100]. Source: Agricultural Census data (ISTAT, 2010), processed by L.S. Rizzo (2016).
Sustainability 09 00116 g004
Figure 5. Standard output of farms in the Province of Verona (Italy): high-quality grape-growing as a proportion of the total. Source: Agricultural Census data (ISTAT, 2010).
Sustainability 09 00116 g005
Figure 6. Land-take 1983–2006: LUCCs towards class 1 (artificial surfaces) detected in the municipalities with a grape-growing vocation lower than 25% (examples) (in red: values higher than 150 ha; in blue: values lower than 150 ha). Source: Land use and land cover data, Veneto Region.
Sustainability 09 00116 g006
Figure 7. The municipality of Villafranca di Verona: satellite imagery.
Sustainability 09 00116 g007
Figure 8. Land-take 1983–2006: LUCCs towards class 1 (artificial surfaces) detected in the municipalities with a vine-growing vocation higher than 25%. In red, municipalities with a vine producing vocation higher than 60%. Source: Land use and land cover data, Veneto Region.
Sustainability 09 00116 g008
Figure 9. Province of Verona: Kernel density maps and maps of reclassified Kernel values.
Sustainability 09 00116 g009
Figure 10. Kernel density maps of the municipality of Colognola ai Colli.
Sustainability 09 00116 g010
Table 1. A selection of indicators concerning land use patterns [42] (pp. 31–33).
Name of the IndicatorMeasurement
Size of continuous areaSpatial extent of continuous area (ha or km2)
Share of continuous/residential landPercentage of continuous residential area over the entire residential area
Share of continuous/urban land (similar to above)Percentage of continuous residential area over the entire urban area
Size of discontinuous areaSpatial extent of discontinuous area (ha or km2)
Share of discontinuous/residential landPercentage of discontinuous residential area over the entire residential area
Size of sealed urban surfaceSpatial extent of sealed artificial area [ha or km2]
Size of arable landSpatial extent of arable land area [ha or km2]
Share of arable land/agricultural areasPercentage of arable area over the entire agricultural area
Size of permanent crop areaSpatial extent of permanent crop area [ha or km2]
Share of permanent crops/agricultural areasPercentage of permanent crops over the entire agricultural area
Size of pasture areaSpatial extent of pastures area [ha or km2]
Share of pastures/agricultural areasPercentage of pastures (area) over the entire agricultural area
Size of heterogeneous agricultural areasSpatial extent of heterogeneous agricultural areas [ha or km2]
Share of heterogeneous agricultural areas/agricultural areasPercentage of heterogeneous agricultural areas over the entire agricultural area
Table 2. Grape-growing farms in municipalities where the UAA with vines exceeds 25% of the total (see Figure 4) (number of farms and surface area relating to the statutory headquarters).
Year1982199020002010% Var.
2010–1982
N. farmsArea
[ha]
N. farmsArea
[ha]
N. farmsArea
[ha]
N. farmsArea
[ha]
N. farmsArea
Total922119,100819219,032717620,213663722,947−2820
Source: Agricultural Census data (ISTAT, 1982, 1990, 2000, 2010).
Table 3. Reclassified Kernel density values (1983, 1996, 2006).
First MaskKm2% of Area% Variation
Province of Verona19831996200683960683–9696–0683–06
Dispersed urban development1486.21421.91364.548.0%45.9%44.1%−2.1%−1.9%−3.9%
Non-defined427.6473.9495.913.8%15.3%16.0%1.5%0.7%2.2%
Clustered urban development262.3336.2401.88.5%10.9%13.0%2.4%2.1%4.5%
Total analyzed area2176.12232.12262.370.3%72.1%73.0%1.8%1.0%2.8%
Total Provincial area3097.5
Second maskKm2% of Area% Variation
25% < index * < 60%19831996200683960683–9696–0683–06
Dispersed urban development228.7213.9203.87.4%6.9%6.6%−0.5%−0.3%−0.8%
Non-defined85.393.795.92.8%3.0%3.1%0.3%0.1%0.3%
Clustered urban development52.866.876.71.7%2.2%2.5%0.5%0.3%0.8%
Total analyzed area366.8374.4376.411.8%12.1%12.2%0.3%0.1%0.3%
Total area of municipalities541.0
Total Provincial area3097.5
Third maskKm2% of Area% Variation
60% < index *19831996200683–9696–0683–0683–9696–0683–06
Dispersed urban development169.1161.4155.25.5%5.2%5.0%−0.3%−0.2%−0.5%
Non-defined51.353.856.41.7%1.7%1.8%0.1%0.1%0.2%
Clustered urban development23.832.839.10.8%1.1%1.3%0.3%0.2%0.5%
Total analyzed area244.1248.0250.67.9%8.0%8.1%0.1%0.1%0.2%
Total area of municipalities354.8
Total Provincial area3097.5
Source: Land use and cover data of the Veneto Region (1983, 1996, 2006). * [(Utilized agricultural area with vines/Total utilized agricultural area) × 100].
Table 4. The municipality of Colognola ai Colli: reclassified Kernel density values (1983, 1996, 2006, and PATI data).
Km2Percent Variation
198319962006PATI83–9696–06“06-PATI Data”83–0683-PATI Data
Dispersed urban development12.712.411.810.9−2%−4%−8%−7%−14%
Non-defined5.95.85.75.6−1%−3%−2%−4%−6%
Clustered urban development1.51.61.82.09%10%10%20%33%
Source: Land use and cover data of the Veneto Region (1983, 1996, 2006) and land use data drawn from the PATI of Colognola ai Colli.

