Article

Valuing Ecosystem Services and Disservices across Heterogeneous Green Spaces

1
Environmental Science and Studies, DePaul University, 1110 W. Belden Ave, Chicago, IL 60614, USA
2
Department of Natural Resources and the Environment, Center for Environmental Sciences and Engineering, University of Connecticut, Storrs, Mansfield, CT 06269, USA
*
Author to whom correspondence should be addressed.
Sustainability 2016, 8(9), 853; https://doi.org/10.3390/su8090853
Submission received: 12 July 2016 / Revised: 9 August 2016 / Accepted: 15 August 2016 / Published: 29 August 2016
(This article belongs to the Special Issue Maintaining Ecosystem Services to Support Urban Needs)

Abstract

:
This study investigates small-scale variability in ecosystem services and disservices that is important for sustainable planning in urban areas (including suburbs surrounding the urban core). We quantified and valued natural capital (tree and soil carbon stocks) ecosystem services (annual tree carbon sequestration and pollutant uptake, and stormwater runoff reduction) and disservices (greenhouse gas emissions and soil soluble reactive phosphorus) within a 30-hectare heterogeneous green space that included approximately 13% wetland, 13% prairie, 16% forest, and 55% subdivision. We found similar soil organic carbon across green space types, but spatial heterogeneity in other ecosystem services and disservices. The value of forest tree carbon stock was estimated at approximately $10,000 per hectare. Tree carbon sequestration, and pollutant uptake added benefits of $1000+ per hectare per year. Annual per hectare benefits from tree carbon stock and ecosystem services in the subdivision were each 63% of forest values. Total annual greenhouse gas emissions had significant spatial and temporal variation. Soil soluble reactive phosphorus was significantly higher in the wetland than in forest and prairie. Our results have implications for urban planning. Adding or improving ecosystem service provision on small (private or public) urban or suburban lots may benefit from careful consideration of small-scale variability.

1. Introduction

With only 2.4% of the global landmass, urban areas house more than half the global population and by 2050, they are expected to hold 70% of the global population [1]. Definitions of urban are highly variable [2,3,4]. Urban areas can be defined by administrative boundaries, density, or other criteria [3]. In the U.S., urban expansion often occurs via development of residential subdivisions sited along undeveloped edges of existing urban areas [5]. Many future “urban dwellers will live in areas that are suburban” [6]. Millington defines urban as giving individuals access to lives that would not be possible elsewhere [2]. This concept of access informs our definition of urban areas. As lower-density development of subdivisions around cities is often created for access to the urban centers, we include subdivisions in our definition of urban. Regardless of definition, urban expansion and human migration to cities and their suburbs makes understanding urban environments, and their associated natural capital and ecosystem services, increasingly important.
Natural capital is the stock of the world’s natural assets. Ecosystem services are flows from natural capital, defined as “the conditions and processes through which natural ecosystems, and the species that make them up, sustain and fulfill human life” [7]. Some urban ecosystem services, like those from urban forests and urban vegetation, have been well-quantified for various locations [8,9]. Interception of rainfall by trees, rain gardens, wetlands, and other vegetation reduces pressure on urban drainage systems by percolating and storing water [10,11]. Vegetation absorbs heat from the air through evapotranspiration, particularly when humidity is low [12], and urban trees moderate local temperatures by this process and shading [10]. Cooling by urban vegetation can buffer the impact of heat waves in cities [12]. McPherson et al. [13] calculated that an average Chicago tree was worth $15 for 0.5 GJ of cooling benefits in 1991.
Urban wetlands, or urban green infrastructure (GI) modified to serve the functions provided by wetlands, also provide ecosystem services in an urbanizing world [14,15]. Services include flood and flow control, storm buffering, sediment retention, groundwater recharge/discharge, nutrient retention, biological diversity, micro-climate stabilization, carbon sequestration, water-quality improvement, and ground water recharge [16,17,18]. Urban wetland services have been incorporated into stormwater “infrastructure” planning via work on sustainable urban drainage systems (SuDS), where natural systems are integrated into urban stormwater drainage management [19,20,21]. Since characteristics of urban areas can include polluted runoff from streets, limited species habitat, and higher property densities (and often higher property values), wetland services have a higher payoff in averted flood damages and water quality improvement services in urban areas. Indeed, Boyer and Polasky [22] found “that urban wetlands are more highly valued by nearby property owners than are rural wetlands”.
Urban green spaces also include private property, which contain a substantial portion of urban trees [23]. This is particularly true in the suburban landscape. Subdivisions, common in U.S. development, are typically lower density than the urban core and for those outside the U.S., might be better described as new greenfield housing developments where residences are associated with a private plot of green space. Gardens and private plots in residential areas provide below- and above-ground carbon stocks and water infiltration, among other services, though type and quantity of natural capital and ecosystem services on private property can vary spatially with attributes like number and species of trees. Tree carbon stock in private lots in Bloomington, Indiana averaged 2.52 kg·C·m−2 (±2.69), ranging from zero to 11.22 kg·C·m−2. Soil carbon was less variable in a Richmond, Virginia study, and averaged 4.7 kg·C·m−2 (±1.15) [24], with little difference between lawns in unoccupied and occupied residential lots [25]. Quantifying natural capital contained in urban soil carbon stocks is the subject of an increasing amount of research at various scales [26,27].

1.1. Valuing Ecosystem Services

“The concepts of natural capital stocks and ecosystem service flows are increasingly useful ways to highlight, measure, and value the degree of interdependence between humans and the rest of nature” [28]. We implicitly value ecosystems and their services every time we make a decision involving trade-offs (e.g., development versus preservation) but the values of ecosystems and their services are hidden from view during these decisions. Valuing ecosystem services allows for a more fair comparison of alternative scenarios by including all consequences, not just consequences easily measured and valued in monetary terms [22,28]. Work that quantifies and values the natural capital (stocks) and ecosystem service (flows) of urban green spaces are therefore useful to inform planning decisions involving maintenance or creation of urban green space. Indeed, substantial advances have been made in urban ecosystem valuation [29,30,31]. Ecosystem valuation, however, is not without controversy. Economic techniques cannot capture the intrinsic worth of ecosystems, are centered on human preferences [32], and may represent the commodification of global life support [33]. However, the goal of valuation lies not in conversion of non-market-values to monetary terms, but its ability to “frame choices and make clear the tradeoffs between alternative outcomes” [22], and to avoid the scenario where assigning no value to ecosystem services leads to the assumption of zero value. The role of valuation in our study is to represent (in a common unit) different ecosystem services across urban green space types to better understand small scale spatial variability.

1.2. Ecosystem Disservices

Benefits of green spaces in urban areas can be partially offset by ecosystem disservices—“functions of ecosystems that are perceived as negative to human well-being” [34]. The concept of detrimental environmental effects is not new [35]. While urban areas depend foundationally on ecosystems and their services, understanding ecosystem disservices allows for better urban planning through understanding the trade-offs (balance of ecosystem services and disservices) associated with different green space types. While there are many ecosystem disservices, we focus on two: soil soluble reactive phosphorus (SRP) and greenhouse gas (GHG) emissions.
Wetlands are often effective in removing excess nutrients, especially nitrogen and phosphorus, from surface and groundwater [36,37]. Phosphorus retention via sorption, burial, and uptake by plants contributes to water quality improvement [36,38]. However, restored or created wetlands on former agricultural lands can act as a source of nutrients to the water column as reflooding of drained agricultural areas stimulates P release [39,40]. Phosphorus from fertilizers, commonly used to increase production in agricultural areas, can accumulate in biotic ecosystem compartments due to incorporation of P into organic matter and abiotic compartments due to adsorption of P by soil and sediments [41,42]. Montgomery and Eames [43] found that the wetland at our study site, Prairie Wolf Slough (PWS), was a point source of SRP to the Middle Fork-North Branch Chicago River. This continued phosphorus release (Montgomery, unpublished data) could be a costly ecosystem disservice as it speeds up eutrophication, seen via excess algae growth [44] and seasonal hypoxia [45] in receiving waters. We therefore focus on SRP because of its site-specific importance [43]. We include GHG emissions because they can offset vegetative carbon sequestration and are rarely quantified in urban green spaces [11]. Urban wetland soils can be either a small source or sink of CH4 and N2O depending on the oxidation status of the soil [46,47,48,49].
The objective of this study is to investigate the natural capital, ecosystem services, and disservices provided by urban green spaces, using the Prairie Wolf Slough Wetland Forest Preserve (PWS) and an adjacent subdivision as a case study (Figure 1). Many studies of the natural capital, ecosystem services, and disservices provided by urban green space have been done at larger scales, like city-level studies of soil carbon [26], state-level assessments of the projected impacts of land-use change on ecosystem services [31], and national-level studies of tree and soil carbon stocks [9,27,50] and wetland ecosystem services [51]. This study provides information on small-scale variability in ecosystem services that is important for planning, especially in urban areas (including suburbs surrounding the urban core) where opportunities for creating or improving green space may focus on small public or private lots. Suburban areas often offer more potential for green space due to larger private lots, and opportunities for development that can include setting aside green space reserves, or “land sparing” [52].

2. Materials and Methods

2.1. Overview

We quantified a subset of the natural capital (tree and soil carbon stock), ecosystem services (annual tree carbon sequestration and pollutant uptake, and stormwater runoff reduction), and disservices (greenhouse gas emissions and soil SRP) provided by a 30-hectare heterogeneous green space. We report tree carbon stock, annual tree carbon sequestration, and tree pollutant uptake for the forest and subdivision (Table 1). Specific quantified ecosystem services from tree pollutant uptake included annual removal of carbon monoxide, nitrogen dioxide, ozone, particulate matter (less than 2.5 microns and 2.5 to 10 microns), and sulfur dioxide. Soil carbon stock was quantified and valued in the forest, prairie, and cattail marsh (Table 1). Carbon sequestration by trees was compared with disservices from GHG emissions (CO2, CH4, and N2O) from the forest and cattail marsh. We also include GHG emissions for the wet meadow and prairie (Table 1). We modeled and valued stormwater runoff reductions from the residential lots and the wetland, and measured soil SRP, which can indicate potential for phosphorus release in runoff. We assigned monetary values to both ecosystem services, disservices from GHG emissions, and natural capital. For stocks, valuation was based on the avoided damages from conversion. All GHG emissions were converted to carbon dioxide equivalents prior to valuation.

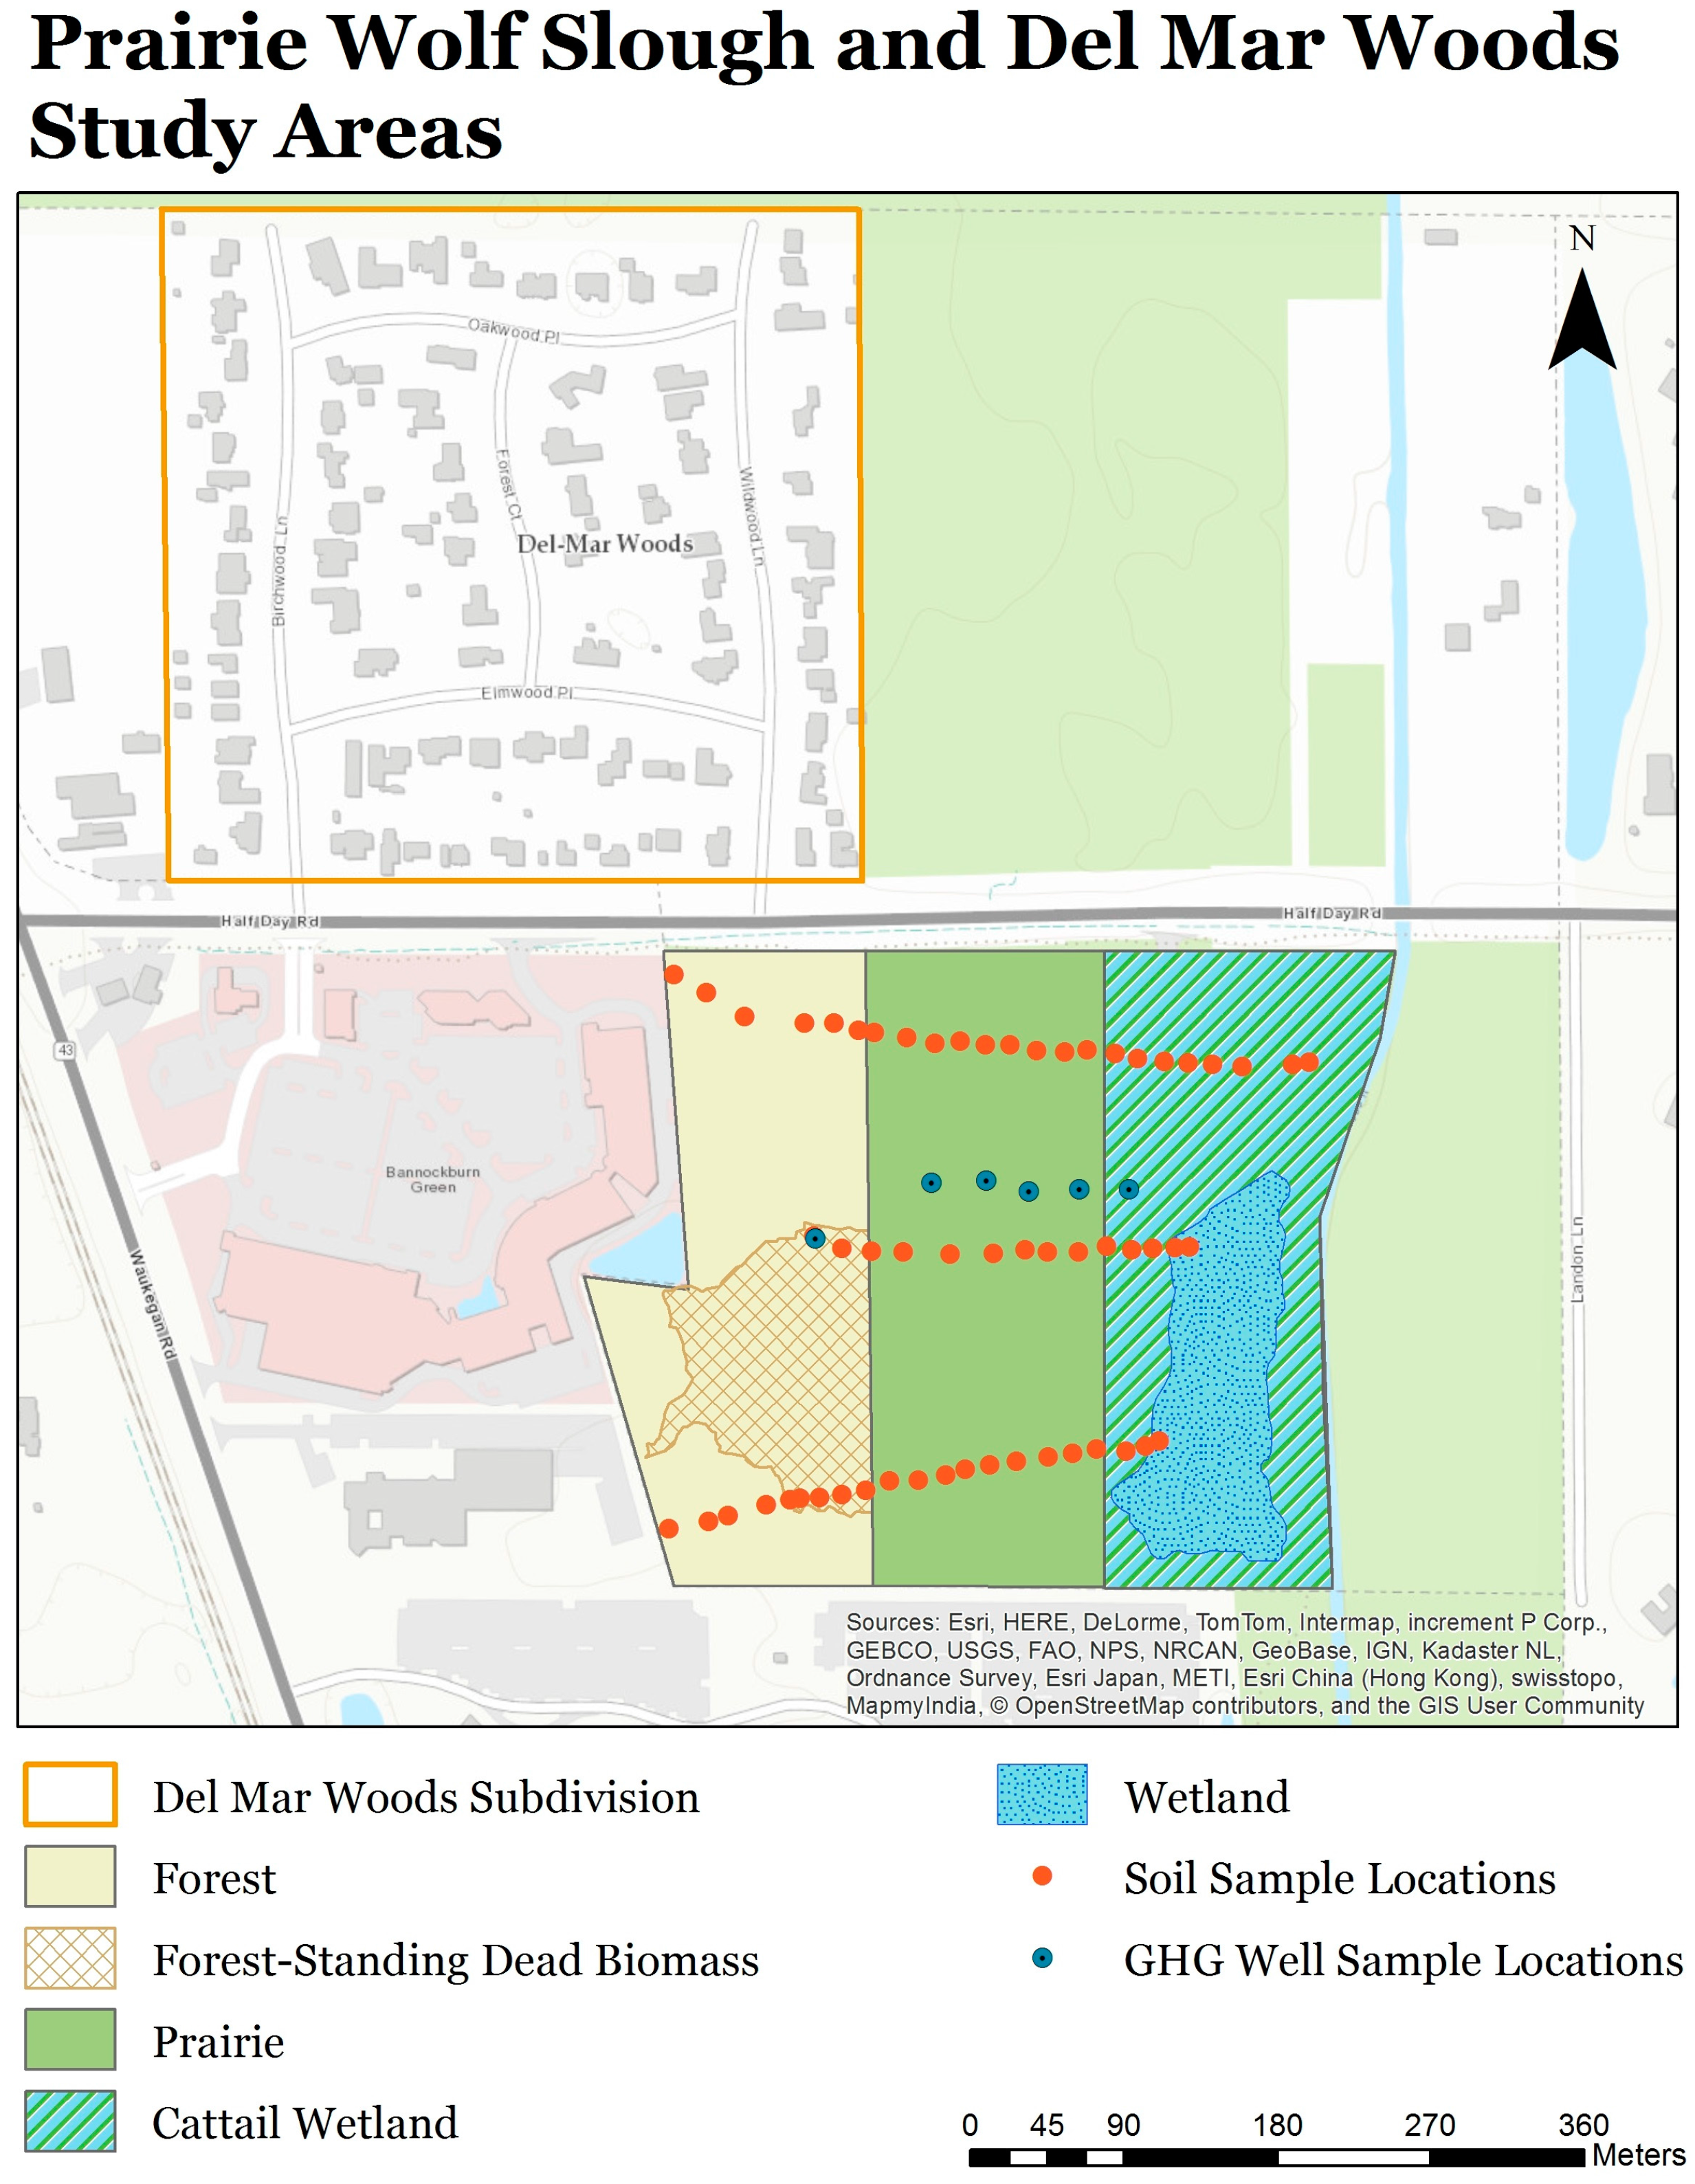
2.2. Site Description and History

The study area encompassed a 30-hectare area of heterogeneous green space that included approximately 13% wetland (cattail marsh), 13% prairie (including areas of wet meadow near the cattail marsh border), 16% forest, and 55% subdivision (residential). The wetland, prairie, and forest were within the Prairie Wolf Slough (PWS) County Forest Preserve (latitude 42°11′51.53″N, longitude 87°51′13.77″W). PWS is the drainage basin for a surrounding 98 ha area, and water from the site eventually flows into the Chicago River. The PWS Forest Preserve is a restoration project on an abandoned (~25 years ago) farm field with poorly drained hydric soils [53] that has since been enveloped by suburban development [43] in unincorporated Lake County, Illinois. The farmland was drained approximately 80 years ago using tile drains. Restored ecological communities include savanna, mesic and wet prairie, and a 8.1-hectare shallow palustrine emergent marsh [43] adjacent to a low-density subdivision (Figure 1). The subdivision (Del Mar Woods) has private residential lots ranging from 0.11 to 0.2 hectares, with some lots bordering the PWS Forest Preserve. For our study, we use the following green space types to refer to each ecological community: forest, residential (subdivision), wetland (cattail marsh), and prairie (including areas of wet meadow).

2.3. Forest Carbon Stocks and Sequestration

We used two methods to estimate tree carbon stocks. For the first, we used images from ArcMap to delineate the total area of each green space type. We divided the forest into 30-m wide transects and randomly selected two of the East-West transects for our tree inventory. Transects captured a topographic and ecological gradient from forest to prairie. In each transect, we used biophysical data to calculate the total aboveground carbon pools in trees. For all trees ≥10 cm diameter at breast height (dbh), we measured tree diameter, cross-sectional canopy area (m), and tree species during fall 2014 and spring 2015. To calculate forest carbon stocks, we used dbh-dependent allometric equations [54,55,56]. Total aboveground tree biomass included stem, branches and leaves. All calculations were estimated as total kilograms of dry biomass for each of the 238 inventoried trees. Above-ground biomass was converted to whole tree biomass based on a root-to-shoot ratio of 0.26 [57]. Total biomass was summed and converted into total metric tons of carbon stored in the forest (dividing by 2), and metric tons CO2 per hectare.
In addition to the field inventory, we used the i-Tree canopy model to calculate total tree carbon stock. The i-Tree Canopy model reviews Google Maps aerial photographs at random points to conduct a tree cover assessment within a defined area [29]. Based on this tree cover assessment, i-Tree calculates gross and net carbon sequestered annually by the urban forest and additional tree benefits (e.g., annual CO, NO2, and O3 removal) [58]. Benefits were valued within i-Tree using the U.S. EPA Environmental Benefits Mapping and Analysis Program EPA [59]. Pollution removal value was calculated based on the following prices: $1469.94 per metric ton of carbon monoxide, $906.45 per metric ton of nitrogen dioxide, $4434.93 per metric ton of ozone, $201,317.75 per metric ton of particulate matter less than 2.5 μm, $336.88 per metric ton of sulfur dioxide, and $6909.77 per metric ton of particulate matter less than 10 μm and greater than 2.5 μm. Monetary values came from a study [60] that analyzed total daily tree cover and leaf area index, hourly pollutant flux to and from leaves, the effects of pollutant removal on atmospheric pollutant concentrations, and the health impacts and monetary value of the change for urban and rural areas (income and currency year 2010) in N2O, O3, PM2.5 and SO2 [59]. Carbon stock was valued by multiplying carbon stock by $40.03/metric ton of CO2 based on the estimated marginal costs of carbon dioxide emissions used by i-Tree [29]. The default value from i-Tree is based on the EPA’s social cost of carbon for regulatory impact analysis for 2015 (in 2007 dollar values) using a 3% discount rate [61] adjusted to 2014 dollar values using GDP implicit price deflator (108.289) [62]. These are marginal costs: the cost of damage from an additional metric ton of CO2 in the atmosphere. We value tree and soil carbon stocks based on the avoided damages associated with CO2 release from these stocks, though we do not expect these stocks to be released in the short term. We also calculated total biomass and metric tons of carbon dioxide equivalent stored in standing dead biomass, but since this carbon is being emitted via post-mortality decomposition, we report the current carbon stocks but do not estimate a monetary value.

2.4. Del Mar Woods Carbon Stock

Our methodology for estimating above-ground biomass at the Del Mar Woods residential subdivision lots (Figure 1) differed from that used at PWS Forest Preserve (Figure 1) due to the private vs. public nature of the two areas. As we were unable to get permission from all homeowners to inventory the trees on their property, estimates of tree carbon stocks, sequestration, and pollution reduction were only from i-Tree Canopy aerial images.

2.5. Soil Carbon Stock and Nutrient Analysis

By extending the two West–East forest transects used for dbh and adding a third West–East transect, we used a total of three transects for soil sampling (Figure 1). The soil transects traversed the forest, prairie (including wet meadow), and wetland areas of PWS (Table 1), ending at the seasonally inundated cattail marsh area of the wetland. In summer 2015, we collected one soil sample every 50 m along each transect (n = 14 in the cattail marsh, n = 29 in the prairie, and n = 20 in the forest). We sampled to a depth of 15 cm using a 14.6 cm bucket auger. We analyzed soil samples for percent soil organic matter (SOM) using loss on ignition (LOI). Percent soil organic matter (SOM) and bulk density were used to calculate soil organic carbon (SOC) [63]. We calculated soil soluble reactive phosphorus (SRP) using a Mehlich-III extractant [64] followed by ascorbic acid reduction and analysis of filtrates spetrophotometrically using an EasyChem discrete analyzer (Chinchilla Scientific, Oak Brook, IL, USA). We conducted a one-way ANOVA followed by a Tukey’s post hoc test in R [65] to determine whether there was a difference in SOC and SRP between the forest, prairie, and wetland (α = 0.05).

2.6. Greenhouse Gas Flux

During the 2013 growing season, we measured CO2, CH4, and N2O fluxes four times (June, August, September, and October) across a hydrological gradient that encompassed four green space types: forest, prairie, wet meadow, and wetland (cattail marsh) (Table 1; Figure 1). Gas sampling locations were determined based on proximity to established groundwater monitoring wells in each green space type. Within 5 m of each well, we established three gas sampling plots by inserting chamber collars (20 cm diameter, 20 cm-tall PVC chambers) 10 cm into the soil. We measured GHG fluxes using vented, non-flow through chambers [66]; while we did not estimate diurnal fluxes (day/night) or non-growing season fluxes, this method is appropriate for comparing GHG fluxes between different green space types. We measured soil-atmosphere fluxes and positioned chambers to avoid large plants such that these CO2 flux measurements did not encompass photosynthetic uptake, but autotrophic (root) and heterotrophic (microbial) respiration. Litter was not removed from inside the soil collar, but if present, vegetation was clipped to 5 cm to place the chamber cap onto the collar. Chamber caps were constructed from opaque 20-cm molded PVC caps with gas-tight rubber gaskets, a sampling port with rubber septum, and vent tube. Changes in the concentration of CO2, CH4, and N2O within the chamber were measured by withdrawing three 30 mL samples from the chamber at 0, 10, 20, and 30 min after cap placement. Gas samples were transferred to gas tight crimped vials and transported to a university laboratory for analysis using a gas chromatograph (model 8610, SRI Instruments, Torrance, CA, USA) equipped with an ECD to estimate N2O concentration and FID with methanizer to estimate CO2 and CH4. Standard gases of known concentration were periodically sampled in the field to ensure vials were properly retaining gas samples.
Measured concentrations were converted to mass units and corrected to field conditions by applying the Ideal Gas Law. Under ideal conditions, gases accumulate or are consumed linearly over time during static chamber incubations, hence, the slope of a graph of gas concentration vs. time can be used to estimate gas flux rate [67]. Flux rates are not always linear; when the concentration vs. time line was non-linear (r2 < 0.80), we used guidelines established by Morse, Ardon, and Bernhardt [68] to estimate flux rates. For each gas (CO2, CH4, and N2O), we used ANOVA to test for differences between green space types, sampling dates, and their interaction. We transformed all GHGs into CO2 equivalents by using Global Warming Potentials (GWPs). The 100-year global warming potential (a measure of the total energy a gas absorbs compared to CO2) is 23 for CH4 and 296 for N2O, indicating how much more effective these GHGs are at trapping heat relative to CO2 [69]. Ecosystem disservices from 2013 GHG emissions (averaged across sample dates) in metric tons of CO2 equivalents per hectare per year were valued (for a 1-year period) using the marginal social cost of carbon of $40.03 [59,61].

2.7. Stormwater Runoff

We modeled stormwater runoff for PWS and Del Mar Woods using the weighted average volume technique [70]. Input for the model included estimates of pervious surfaces in PWS and Del Mar Woods, precipitation data for each rainfall event, and pervious and impervious curve numbers. A curve number characterizes runoff properties based on soil and ground cover. Each curve number is based on “soil permeability, surface cover, hydrologic condition, and antecedent moisture” [71]; a high curve number like 98 for pavement causes most of the rainfall to appear as runoff.
We calculated ecosystem services from avoided runoff for each 2014 and 2015 (eight-month period from January to August) precipitation event with rainfall ≥ 0.75 cm per event using data from the Riverwoods, Illinois weather station (NOAA). We chose storms with rainfall ≥ 0.75 cm per event based on Garn’s [72] findings that runoff from Wisconsin lawns occurred for more than 50% of the storms with rainfall at or exceeding 0.75 cm. We also calculated ecosystem services from avoided runoff from one short duration (three to twelve hours) rain event. Forty short duration rain events are expected throughout Illinois in an average year [73]. Short duration rain events associated with flash floods contribute most to runoff with 4-h rainfall totals in excess of 7.6 cm, based on well-measured data from 32 such storms [73].
We used aerial images verified with ground-truthing in the subdivision to estimate impervious (roads, sidewalks, driveways, houses, etc.) and pervious (grass, gardens, etc.) surface areas at Del Mar Woods as a percentage of the total residential area. We used a Stormwater Quality Design Storm of 0.74 cm, pervious curve number (CN) = 66.8 computed specifically for PWS [74], impervious CN = 98, and the assumption that all impervious cover was connected to a stormwater conveyance system. Total runoff volume was the sum of impervious and pervious area runoff volume. We calculated ecosystem services (and valuations) based on model estimates of the avoided runoff from infiltration in pervious areas for each rainfall event ≥ 0.75 cm and one short duration storm. We used the Metropolitan Water Reclamation District of Chicago’s 2015 estimated marginal cost of collection and treatment at $0.000063 per liter [75] to calculate the avoided cost of treatment of runoff captured within vegetated areas.

3. Results

3.1. Tree Carbon Stock and Pollutant Removal

The forest areas we inventoried in this study encompassed ~16% of the 4.7 hectares of total forested area in PWS (Figure 1). The total forested area comprised approximately ~16% of the 30-hectare study area. Total carbon stock in living biomass extrapolated to the entire forest (Figure 1) was 1755.4 metric tons CO2 (373.5 t CO2/hectare): 1299 metric tons CO2 of above-ground biomass (Appendix A), and 456.4 metric tons CO2 below-ground biomass. This carbon stock was valued at $14,951 per hectare. The inventory also included areas of predominantly standing dead biomass. Tree mortality was partially attributed to rising water tables. Removal of invasive species such as European buckthorn, and the associated reduction in transpiration, combined with the loss of ash trees to Emerald Ash Borer has contributed to these areas of standing dead biomass (Figure 1). Total carbon stock in standing dead biomass for the whole forest was 164.4 metric tons CO2 (35.0 t CO2/hectare): 96.59 metric tons CO2 of above-ground biomass, and 33.9 metric tons CO2 below-ground biomass. As this biomass was in the process of decomposition, we did not include it in valuation estimates.
From i-Tree, the value of tree carbon stock was estimated at $49,899.12 ± $850.22 for the total forested area and $10,616.83 per hectare (Table 2) in 2014 dollar values [61,62], 71% of estimates of carbon stock from the field inventory. Benefits from carbon sequestration and other ecosystem services summed to an additional $1123.32 per hectare per year (Table 2). Carbon stock and related benefits associated with tree canopy in the subdivision were 63% of the per hectare values in the forest: $6727.16 and $711.78 for per hectare tree carbon stock and ecosystem services, respectively (Table 2). The subdivision had larger total benefits from carbon stock ($110,998.16 ± 2980.81) and ecosystem services ($11,744.25) (Table 2) due to the larger area (16.5 hectares in the subdivision versus 4.7 hectares of forest).

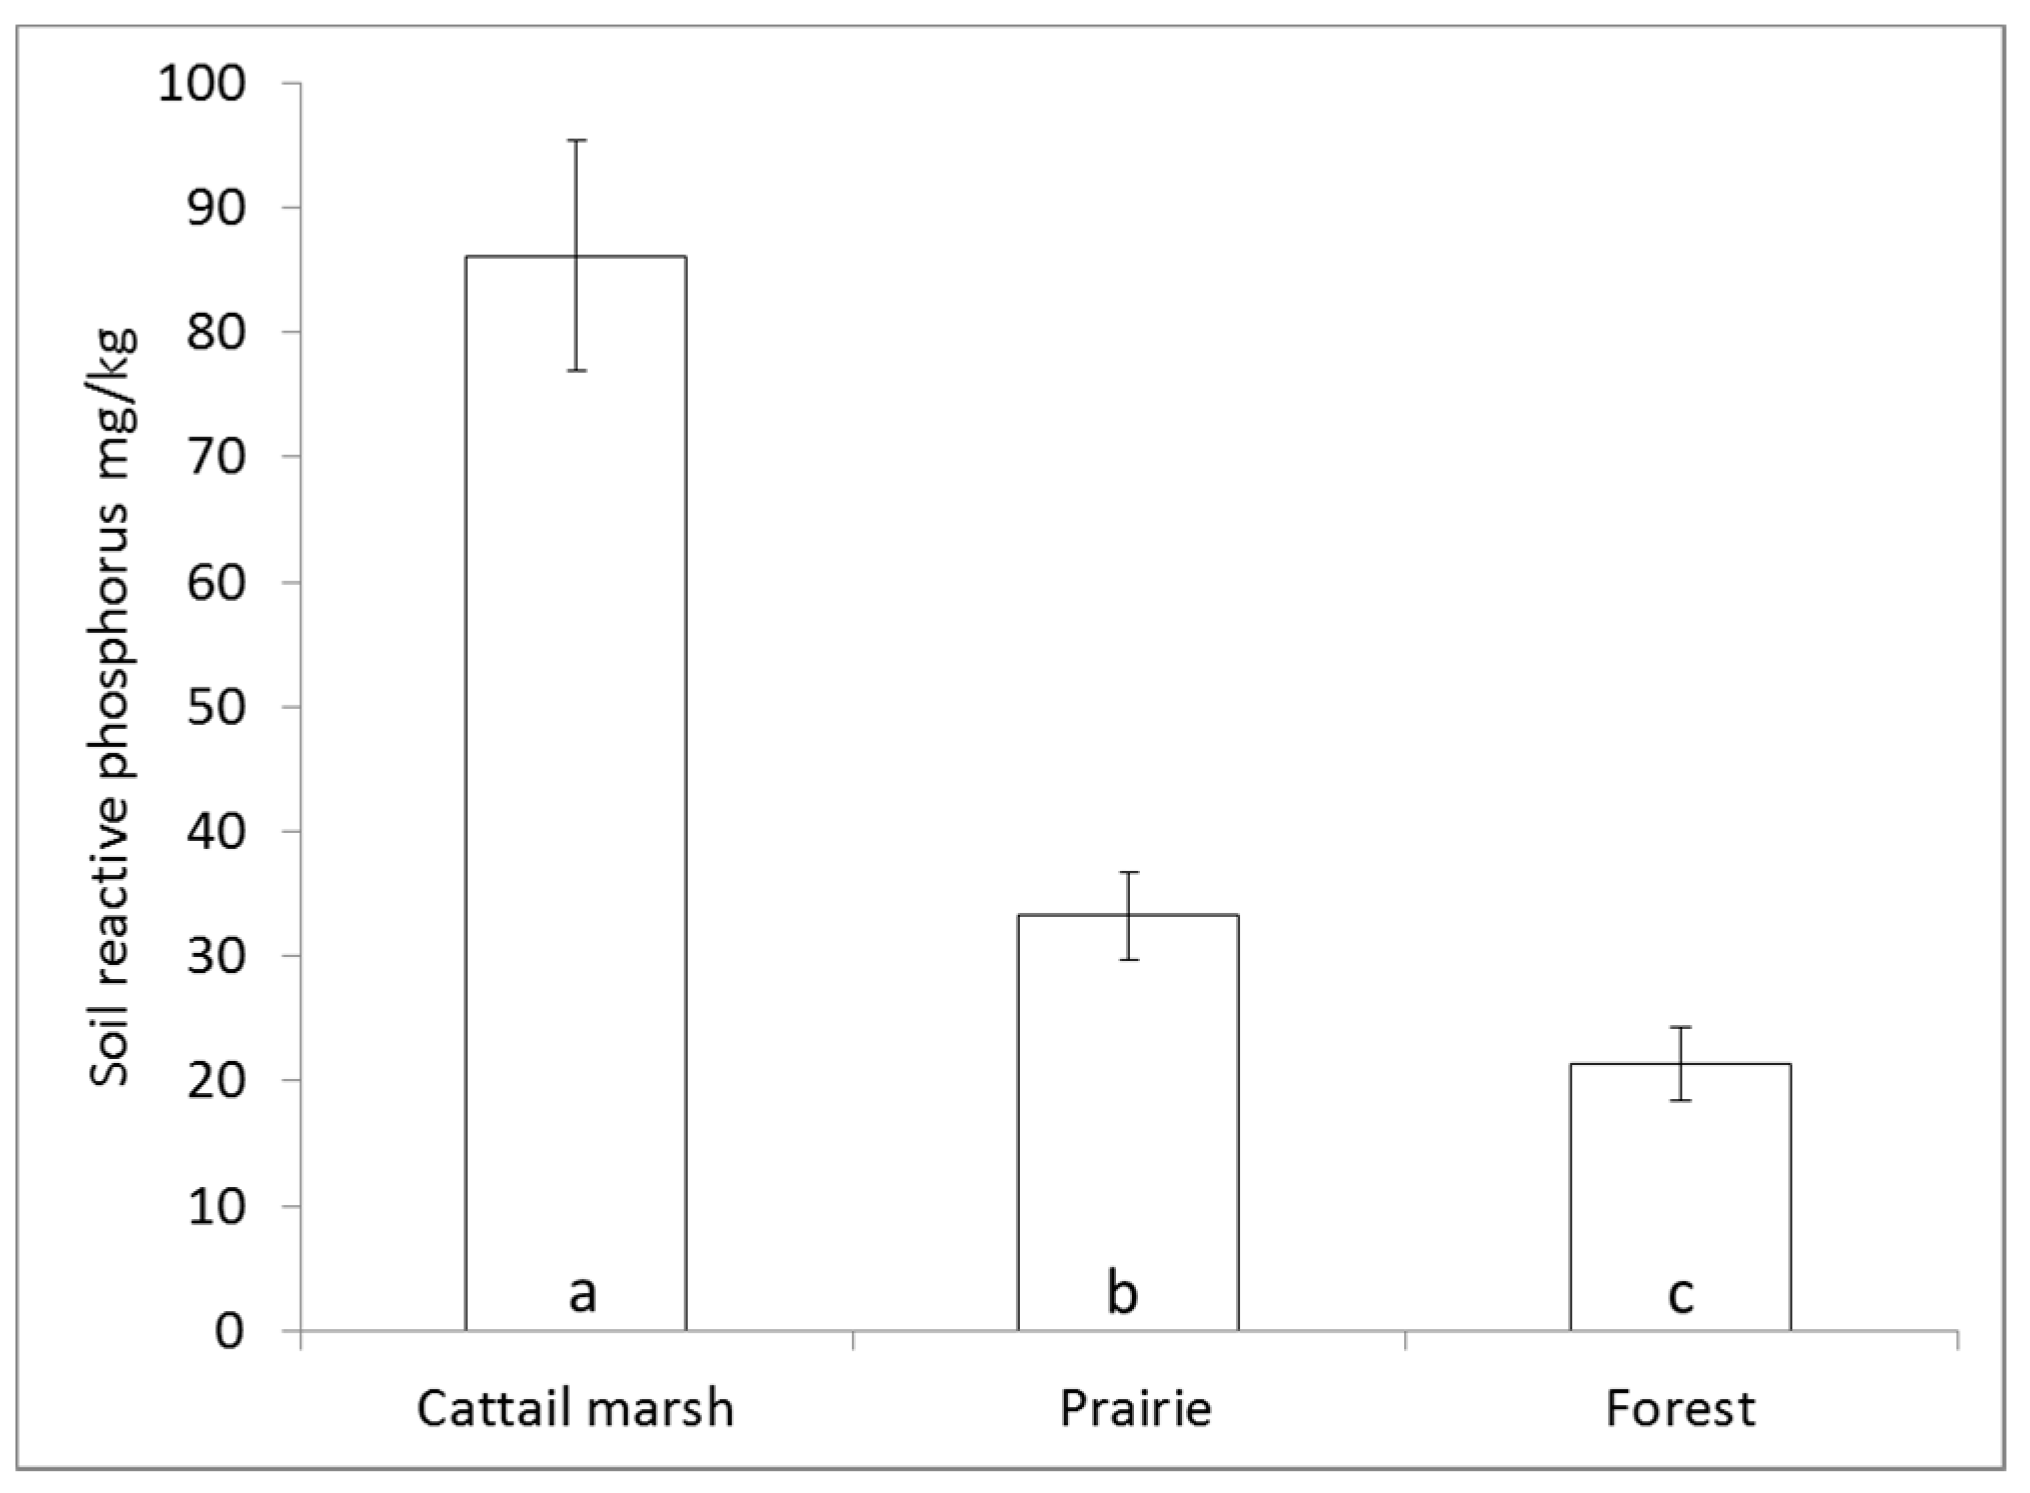
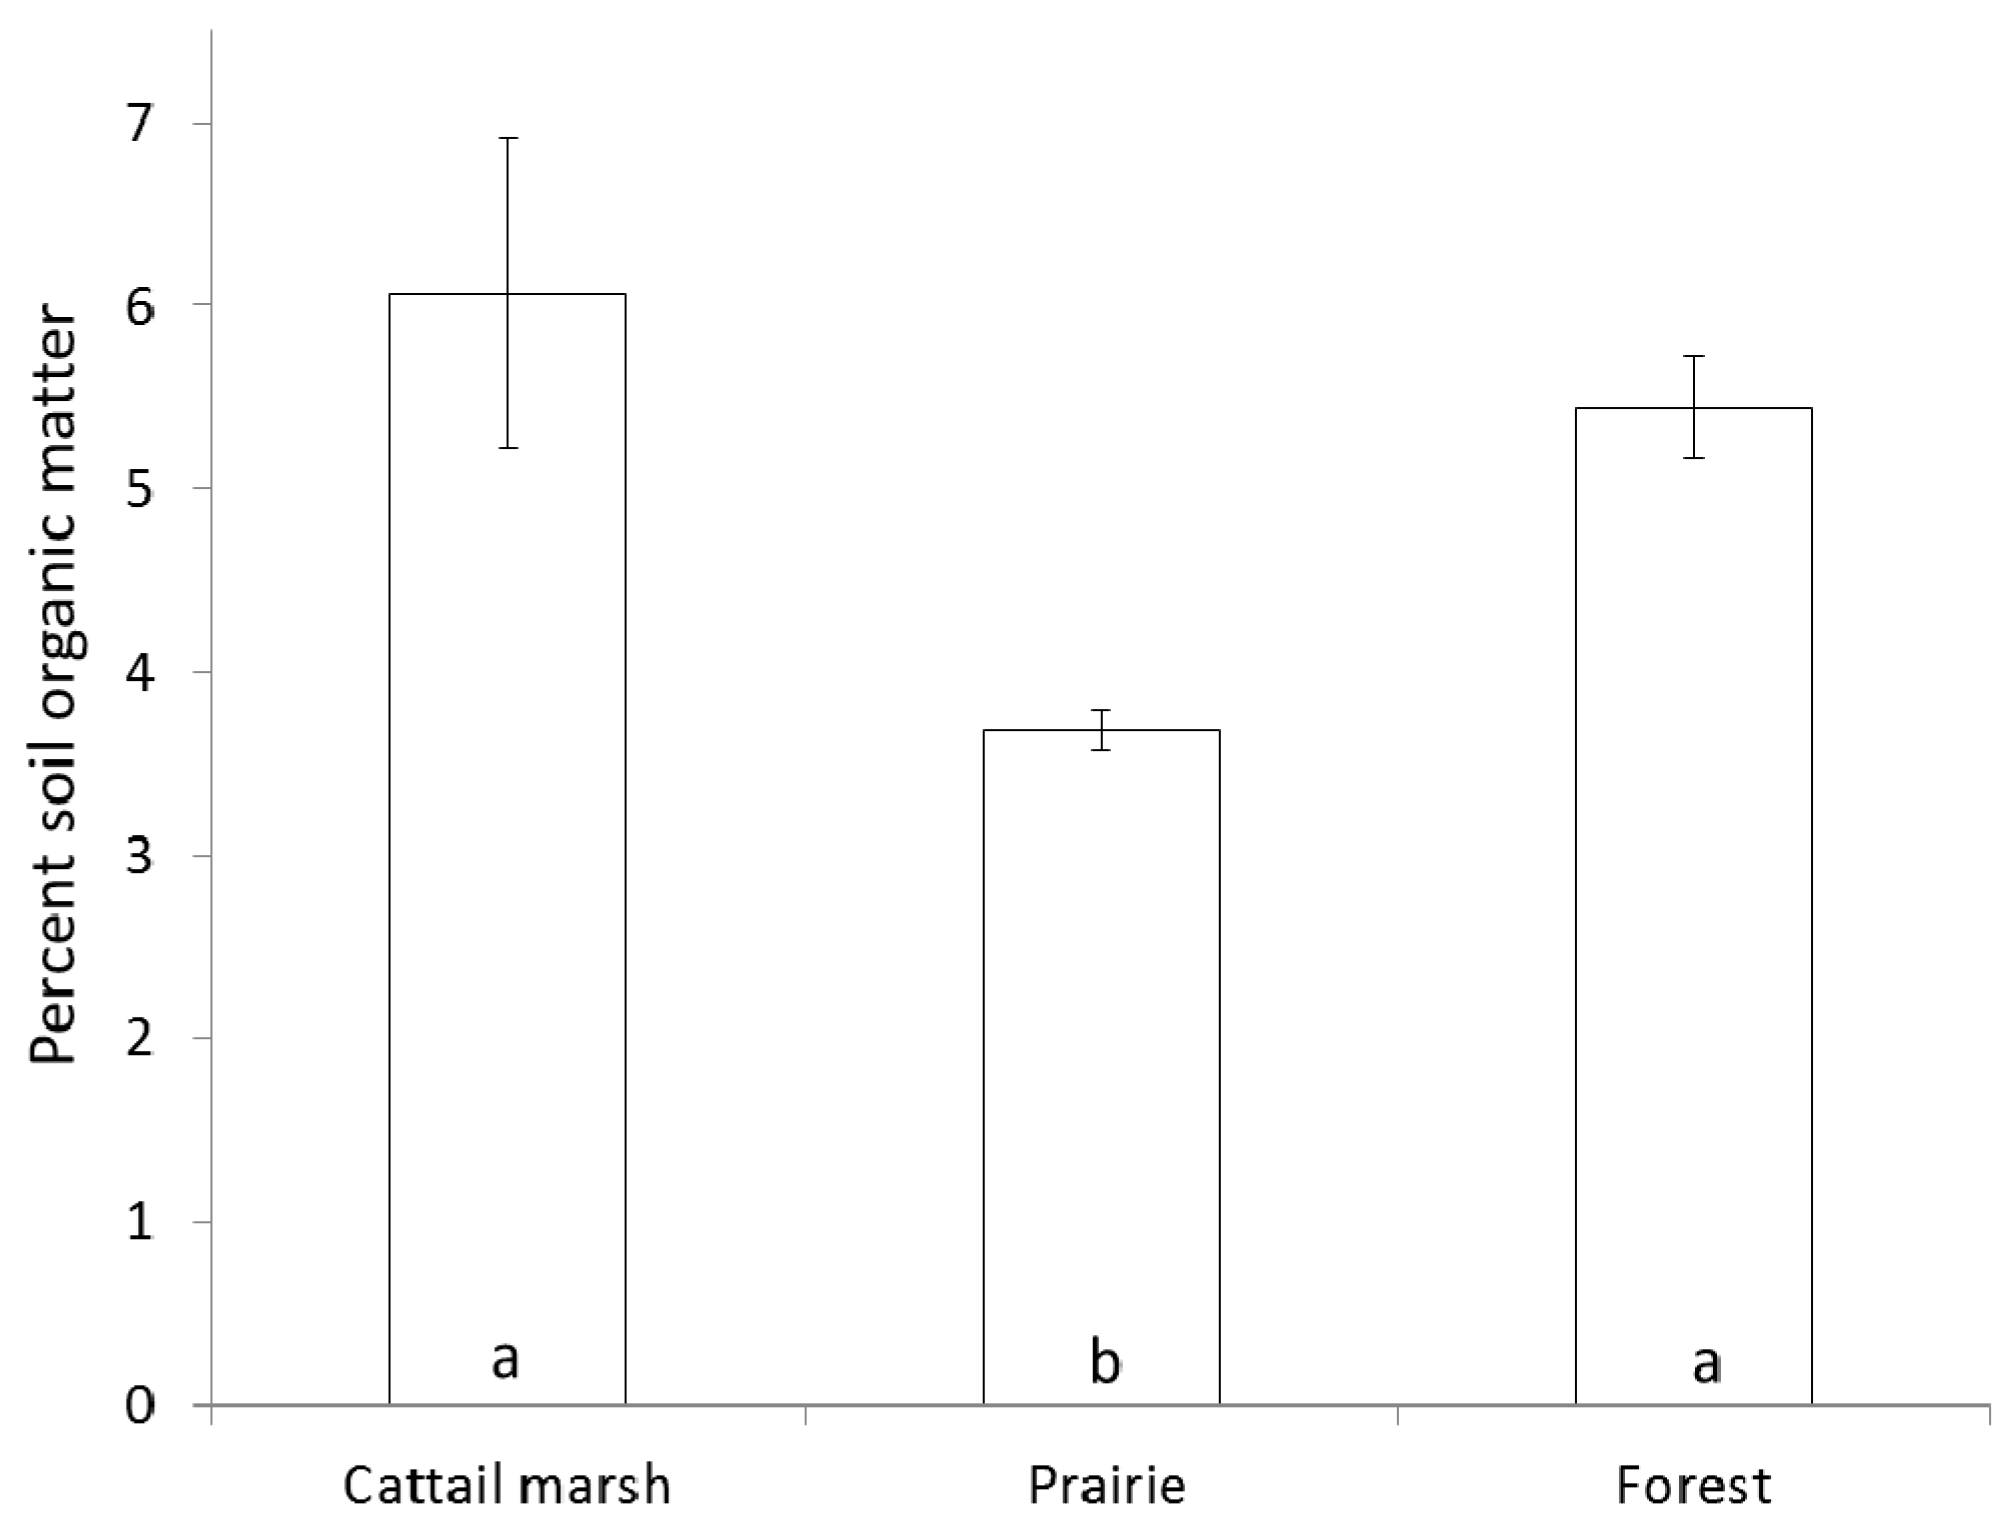
3.2. Soil Carbon Stock and Soil Soluble Reactive Phosphorus Analysis

Soil organic matter (SOM) was normally distributed, as was soil SRP following a natural log transformation. ANOVA results indicated a significant difference in SOM and SRP between green space types (forest, prairie, and cattail marsh). SOM was high across all green space types, ranging from 3.7%–6.1%. Univariate statistics indicated that there was a significant difference between organic matter by green space type (p < 0.001, df = 2, F = 11.76), with greater organic matter in the forest and cattail marsh section of the wetland than in the prairie (Figure 2). Once converted to SOC using bulk density, there was no difference between green space types (p = 0.227; forest = 6.2 ± 1.4; prairie = 5.3 ± 0.9; cattail marsh = 5.9 ± 3.1 kg·C·m-2 ± SD; to 15 cm depth). Soil carbon stock was valued between $7925.94 and $9126.84 per hectare for the different green space types (Table 2). We found high soil SRP in the wetland; SRP in the wetland soil significantly exceeded soil SRP in forest and prairie (p < 0.001 for both comparisons). Prairie soil SRP was also significantly higher than in the forest (p = 0.019) (Figure 3). Since we do not have information on phosphorus mobilization and flow into receiving water bodies, we are hesitant to attribute a monetary value to this ecosystem disservice (though, see the discussion for values of phosphorus removal in water bodies).

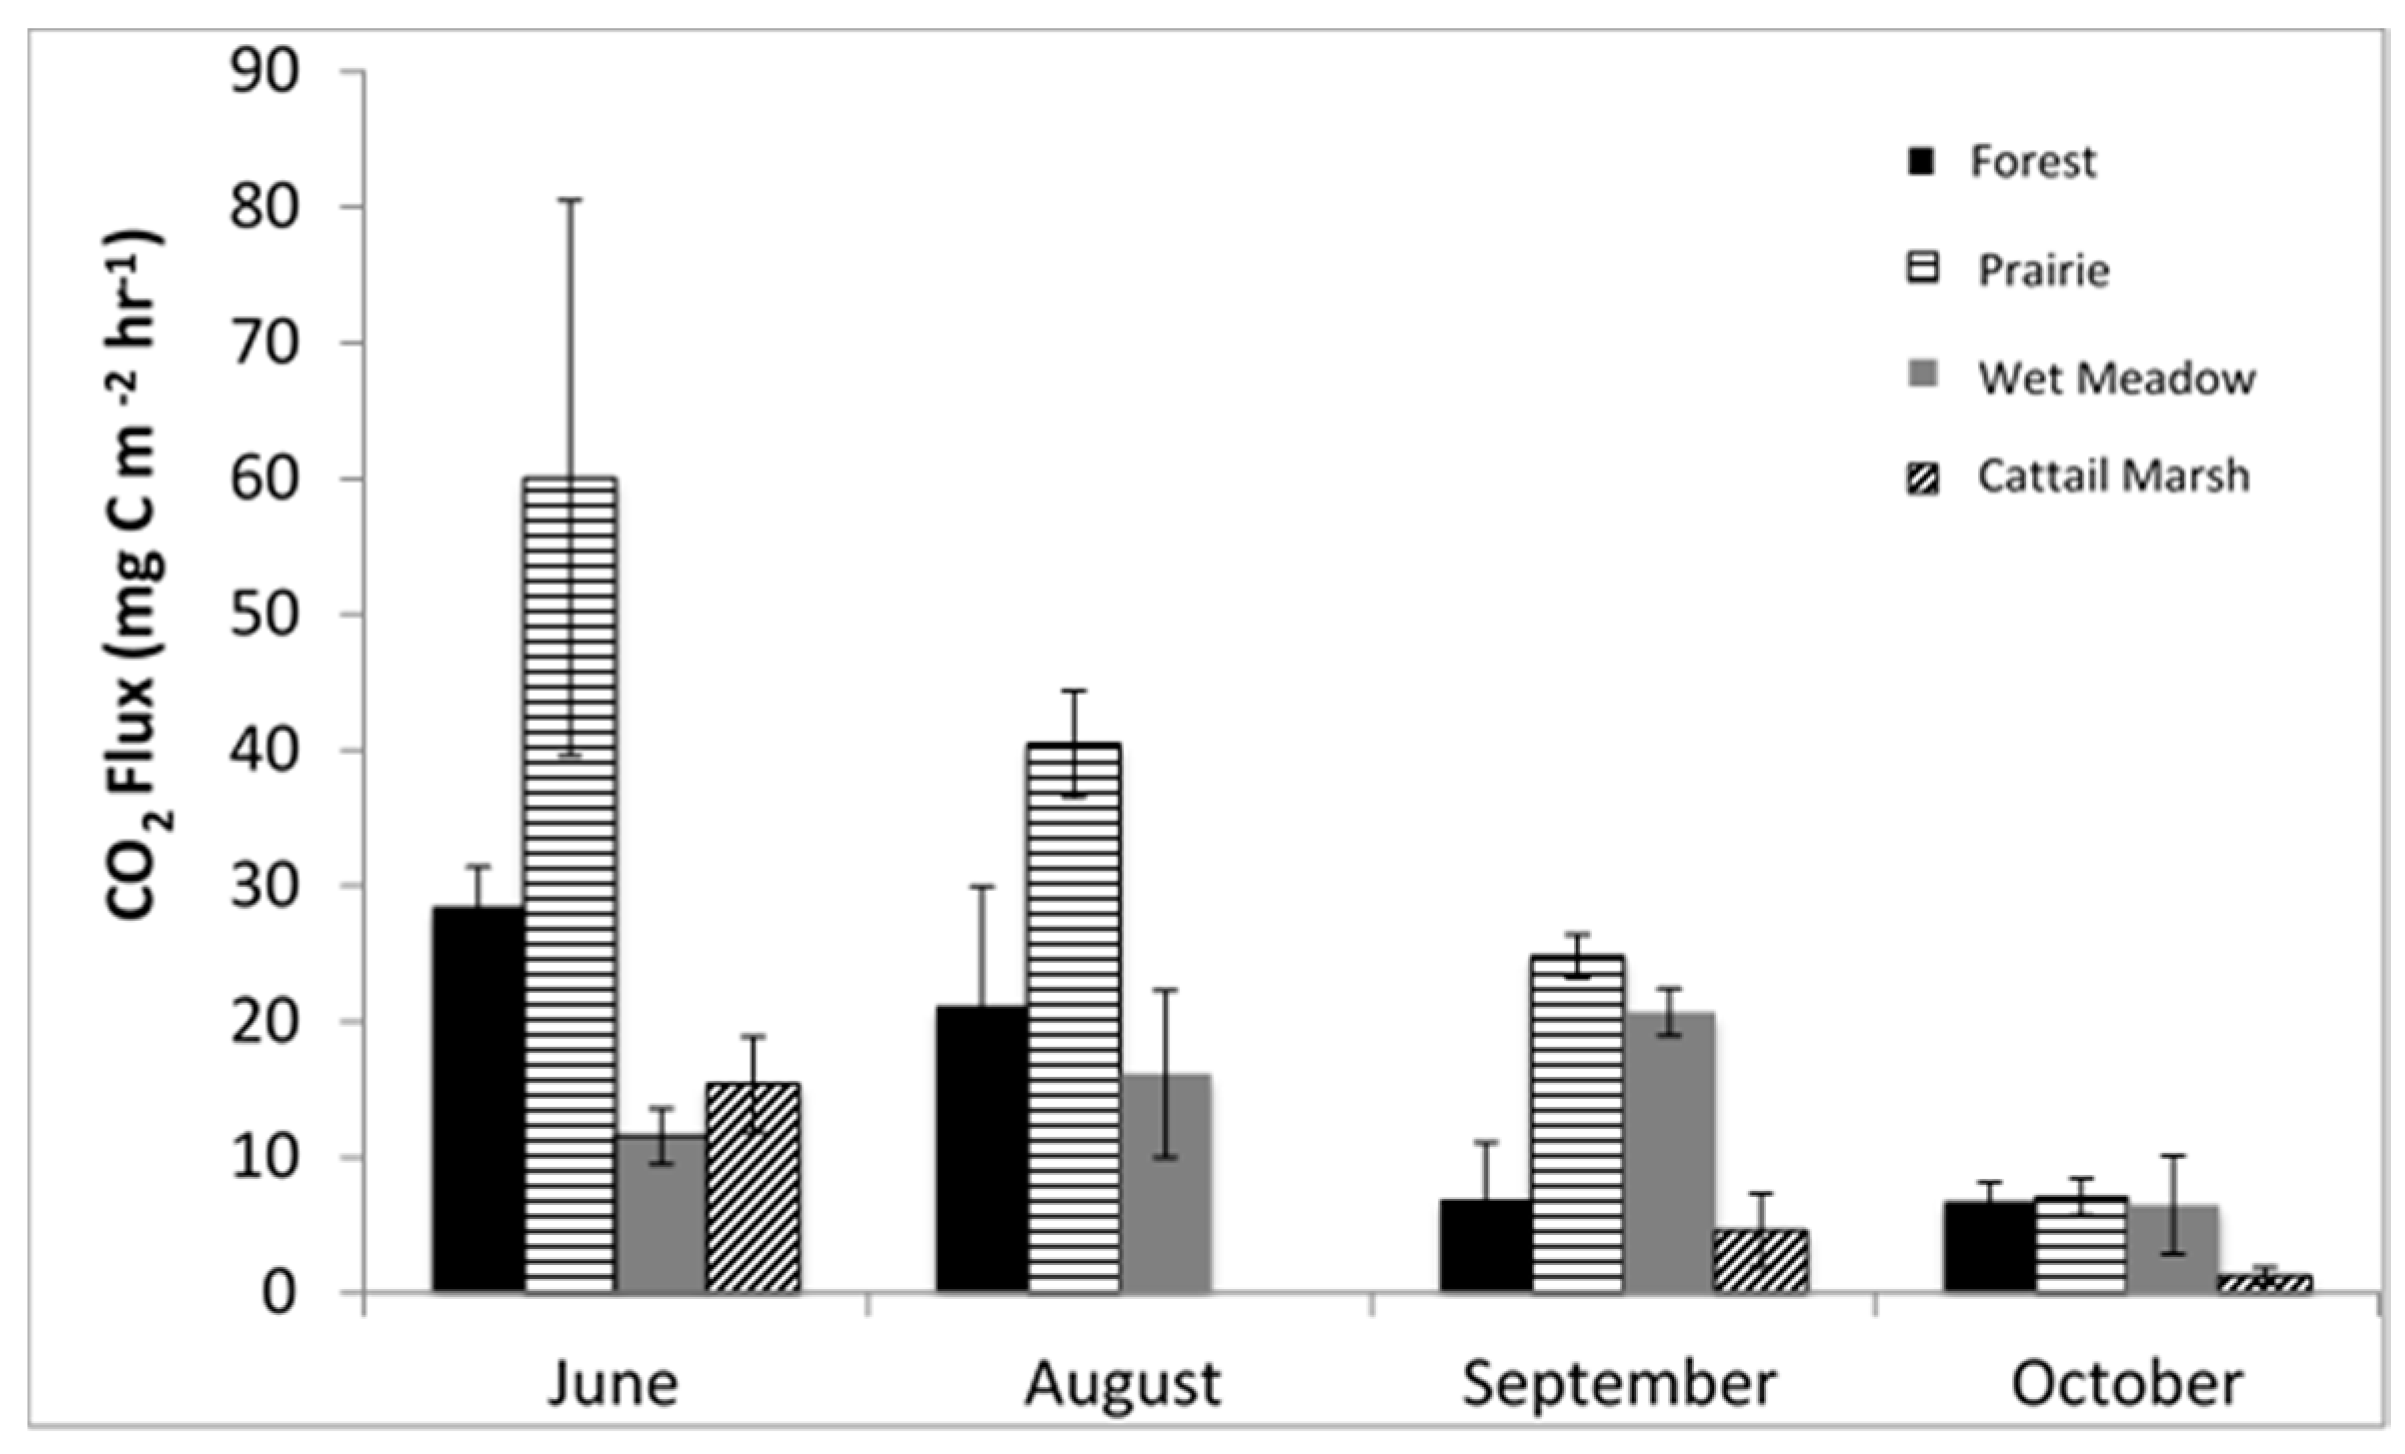
3.3. Greenhouse Gas Flux Results

In 2013, CO2 flux varied significantly among months (p < 0.001, degrees of freedom (df) = 3, F = 12.17) and by green space type (p < 0.001, df = 3, F = 12.66) (Figure 4). Average CO2 was highest in the prairie (33.10 ± 7.36 (1 SE)) milligrams of carbon per meter-squared (mg·C·m−2·h−1), followed by the forest (15.84 ± 3.29 mg·C·m−2·h−1), wet meadow (13.71 ± 2.23 mg·C·m−2·h−1), and cattail marsh (7.08 ± 2.49 mg·C·m−2·h−1). ANOVA results revealed that CH4 varied by month (p = 0.006, df = 3, F = 5.725), while N2O flux varied among green space types (p < 0.002, df = 3, F = 9.850) but not by month (Table 2). This variability adds uncertainty to our ecosystem disservice estimates from GHG emissions, which were calculated using average monthly emissions (Table 2). Additionally, GHG measurements are positively correlated with soil temperatures, and therefore highest during the growing season. Our results likely captured the highest gas flux rates. This may overestimate ecosystem disservices from GHG emissions and we recommend caution if extrapolating these results.

3.4. Stormwater Runoff Results

The total drainage area of the subdivision was 16.55 hectares, with 2.8 hectares of roads/driveways, and 2.2 hectares of houses, totaling 5 hectares of impervious surfaces (~30% of the subdivision); pervious area was 11.55 hectares (the remaining ~70% of the subdivision). Runoff from impervious surfaces from one modeled large rain event totaled 3500 m3 and runoff from pervious surfaces totaled 1696 cubic meters. Total runoff volume was 5196 cubic meters for a 7.62 cm rainfall event (assuming an annual occurrence interval and using published rainfall intensity-duration frequency curves) [71]. Avoided runoff totaled 6442 cubic meters for the subdivision, or 389 cubic meters per hectare for a 7.62 cm rainfall event. The cost associated with treating 6442 cubic meters of runoff based on operating costs (not associated capital or maintenance costs) necessary for water treatment, would total $407.57 or $24.62 per hectare for each 7.62 cm rainfall event.
While not as damaging, there is runoff from smaller storms as well [72]. In addition to ecosystem services provided during the expected one large rain event annually, ecosystem services from infiltration are also provided for more than 50% of precipitation events with rainfall ≥ 0.75 cm [72]. Total precipitation for 34 such events was 25 cm in 2014, and 17 cm for 22 events during the eight-month 2015 period (January–August). For each of the smaller storms with rainfall ≥ 0.75 cm per event that contributed to this total annual precipitation, we calculated the ecosystem service benefit of avoided runoff. The cost of treatment of avoided runoff would have been $3114 or $188 per hectare in 2014. For the eight months of 2015, the cost of treatment would have been $2216 or $134 per hectare. While the runoff from the subdivision (upper half of Figure 1) drains into storm sewers, the runoff from the PWS watershed (lower half of Figure 1) drains directly into the Middle Fork of the North Branch of the Chicago River, not the local storm sewers. Therefore, there is no treatment cost for PWS runoff.

4. Discussion

4.1. Tree Carbon Stock and Pollutant Removal

Our results indicate a substantial carbon stock and sequestration benefit from trees on residential green space. Per hectare, the value from tree carbon stock in the subdivision was approximately 63% of forest carbon stock. Tree carbon stock in both forest and residential tree cover in this study was higher than the U.S. national average carbon stock density of 92.1 t·CO2/ha, and the average carbon stock density of 114.5 t·CO2/ha for urban land in Illinois [9]. Carbon stock estimates from the field inventory were higher than those from i-Tree aerial estimates. Species-specific allometric equations may have resulted in higher values for carbon stock. Ground-based estimates may have also captured trees in the subcanopy that were hidden from view in the aerial images by taller individuals. We expected lower carbon stock in the subdivision due to lower tree densities, though the relatively high total values from subdivision trees stem from the combination of benefits from carbon stock, sequestration, and pollution mitigation (Table 2) in this human-modified area. Most homes in the subdivision were built after 1940, but whether the high tree cover is a result of land sparing during development [52] or the result of early tree planting efforts is not known. Either way, results indicate value from natural capital (carbon stock) and ecosystem services (sequestration and pollution mitigation) on both public and privately-owned lands as well as potential for maintaining high natural capital and ecosystem services from trees in privately-owned lots.
Benefits associated with particulate matter removal (less than 2.5 μm) had the highest value per hectare ($463.77) followed by CO2 sequestration, and ozone removal. This is partially due to the urban site location. The value of pollutant removal is higher in urban areas where pollutants are concentrated. Air pollution removal estimates from i-Tree were calculated based on field, pollution concentration, and meteorologic data described in-detail in other publications [50,58,60]. Open-grown, maintained trees tend to have less aboveground biomass than those in forests, and multiplying biomass by 0.8 is used to adjust for these differences [76]. We did not multiply biomass by 0.8 for the subdivision trees. Although some were open-grown maintained trees, others were small forest stands on private property. If proportions of open-grown maintained trees relative to total trees in the subdivision were high, our carbon and pollutant removal estimates may have overestimated actual benefits in the subdivision.
Benefits per hectare of tree cover are variable based on location and population density: benefits ranged from $9 in rural areas to $481 in urban areas (mean = $26) [77]. BenMap values are based on human health (i.e., mortality, morbidity, reductions in respiratory symptoms) which is dependent on population density [59]. Additional limitations of the approach are detailed in Nowak [60]. We emphasize the limitations of the monetary valuation to stress that these numbers are not precise estimates of value, rather “a first-order approximation” [60] of these benefits. Additionally, these are conservative estimates of monetary value for pollutant reduction, including only human health values from four of the six criteria air pollutants, and only human health values [60].

4.2. Soil Carbon Stock

We found high SOC across all green space types (Table 2), though percent organic matter did differ significantly between green space types (Figure 2). Like other studies [78], we saw high SOC in wetland soils. Our results add to research illustrating the importance of natural capital from urban soils [8]. Small-scale urban green spaces can provide substantial carbon reserves: Mestdagh et al. [79] found that SOC of “grassy roadsides, waterways and railways” in urban areas totaled 10%–15% of the toal SOC stocks in Flemish grasslands, though they do not report what percent of the urban area was covered by these small-scale urban green spaces (nor their relation to total urban SOC). Our results for SOC (38.4 ± 11.5 SD·kg·C·m−2 extrapolated to a 1-m depth) are comparable to other results for Chicago urban soils. Scharenbroch (unpublished research) found mean SOC of 36 kg·C·m−2 to a 1-m depth with a range of 4–132 kg·C·m−2.

4.3. Soil Soluble Reactive Phosphorus

We found that soil SRP in the PWS wetland was significantly higher than soil SRP in forest and prairie (Figure 3), which indicates continued potential for P mobilization. Cleanup of phosphorus can be expensive. Dunne et al. [80] looked at the cost of using a constructed treatment wetland to remove external P load to a eutrophic lake as well as to reduce P already in the lake. They included construction, maintenance, and labor costs of the treatment wetland as part of their analysis. The constructed treatment wetland resulted in costs of $177 (in 2012 $) per kg of P removed, with an estimated cost of $191/kg P removed over 25 years (via forecasting future costs and benefits). The median cost for other large-scale treatment wetland systems (based only on operation and maintenance for P removal) was $277/kg [81,82,83]. At PWS, diverting outflow to the stormwater conveyance system might be a lower-cost solution. We are hesitant to attribute a monetary value as this would require information on phosphorus mobilization and flow into receiving water bodies.

4.4. Greenhouse Gas Flux across the Wetland-Forest Gradient

The anoxic conditions of wetlands make them optimum natural environments for sequestering and storing atmospheric carbon [84]. The ratio between carbon stock (in soil and trees) and annual release (via carbon equivalents from CO2, CH4 and N2O emissions, Table 2) was 117:1 in the forest, the green space type with highest GHG emissions. The ratio in the cattail marsh was 121:1, though we do not assume that stock and flux are in a steady state for any of the green space types. We did not measure vegetative carbon storage for the cattail marsh. For the forest, tree carbon sequestration (9.76 metric tons CO2 per hectare) slightly exceeded greenhouse gas emissions (4.26 metric tons CO2 equivalents per hectare per year). However, our GHG measurements are likely overestimates. GHG emissions are positively correlated with soil temperature making them highest during the growing season when we conducted flux measurements. We also noted variability in emissions: we did not detect CH4 or N2O fluxes during later measurements in the 2015 growing season. Aerobic soil conditions may reduce GHG emissions below the average used in our valuation calculations. Evaluation of GHG flux at larger spatial and temporal scales within each green space type at PWS would improve our inter-green space comparisons. There was variability within green space types that may not have been captured in our sampling methodology. For instance, the portion of the forest where we sampled typically had standing water, while wet meadow with hydric soils typically did not.
While there is still debate on whether it is beneficial to restore a wetland based on the net carbon balance [85], wetlands provide many ecosystem services in addition to carbon sequestration. Therefore, it is shortsighted to suggest that wetlands should not be created or restored because of GHG emissions.

4.5. Stormwater Runoff

Our calculations likely underestimate potential stormwater runoff. In the Chicago-Joliet-Kankakee region, which includes the study area, two-year, 24-h rainfall amounts increased by over 20% during 1941–1980, as compared with the previous 40-year period. Increases were coupled with increasing storm recurrence intervals attributed to climate change [86,87]. We also do not calculate the costs of damaging less-frequent storms in Illinois which occur, about once every two years in the state, “generally last from 12 to 24 h, produce extremely heavy rainfall over a 3219 to 8046 square-km area, and typically create 25–30 cm of rain at the storm center” [88]. Depending on whether and how much these storms increase in the future, there may be additional value of ecosystem services from infiltration during these events.
While our calculated marginal treatment costs of avoided runoff were low for any one storm, ranging from $0.49 to $16.89/ha for the Del Mar Woods subdivision in 2014, there are additional non-marginal costs to consider, including avoided infrastructure. Large infrastructure projects can be minimized or precluded by a network of small-scale water management projects. If modifying urban areas to create green space for runoff reduction can be done at lower cost than large infrastructure projects, this is further justification for additional urban green space. Maintaining current green space already provides runoff reduction at little or no cost. Because of climate change, increasing disturbance, and continued population growth and urban development, we cannot assume that maintaining urban green spaces will be the default option [89]. It may, however, be the lowest cost method of maintaining certain urban services (e.g., flood and flow control), and is therefore an extremely important consideration in urban planning.

4.6. Water Quality Improvement/Wetland Co-Benefits

While trees and urban forests are often part of green space planning, wetlands have historically been filled in urban areas. Their contribution to urban ecosystem services is increasingly acknowledged [15,90] and considered in urban planning of greenways and other urban green spaces [21,91]. This is beneficial not only for carbon, but also due to the importance of wetlands in providing ecosystem services that are lost or degraded during urban development, including flood and flow control, groundwater recharge/discharge, nutrient retention, biological diversity, micro-climate stabilization, and water-quality improvement [16,17,18,92].
Wetland services like water quality improvement are only realized where water quality has been altered [93]. Brander et al. [16] found that of the various wetland services that they identified, water quality improvement was valued the highest. Urban wetlands have the ability to realize water quality improvement due to their location in human-dominated landscapes where salt-laden road runoff and other sources of water contamination are concentrated. Compiled results from 190 wetland valuation studies with 215 value observations indicated mean wetland value of $2800 ha–1·year–1 for all associated ecosystem services, though median value was $150 ha–1·year–1 (the distribution was skewed with a long tail of high values) [16]. Another study found a median value of $1490 ha–1·year1 for US wetlands [51]. If we used published median and mean dollar values for the PWS wetland, the total value of ecosystem services ranges from between $150 and $2800 ha–1·year-1. However, “value transfer may result in substantial ‘transfer errors’, particularly when the characteristics of the site to which values are being transferred are not well represented in the data underlying the estimated value function” [94]. We think that the lower bound ($150 ha–1·year–1) is an underestimate for the PWS wetland. Brander et al. [16] found that community GDP per capita and population density variables were both significant and positive in predicting wetland values. A 10% increase in GDP per capita resulted in a 12% increase in wetland value, perhaps related to income elasticity (with higher income increasing demand for wetlands). This relationship was based on a regression of GDP per capita and wetland value (from each study in a meta-analysis) [16]. Highland Park is an affluent area with a median household income of $107,537 in 2013 (Citydata.com), well above the maximum value of US$35,000 GDP per capita modeled by Brander et al. [16]. When median household income was divided by a family of 4, Highland Park GDP per capita is still at the high end of GDP per capita used by Brander et al. [16]. More recent results from Brander et al. [51] indicated a mean value of $1490 ha–1·year–1 for U.S. wetlands only focused on flood control, water supply and nutrient cycling. Including benefits from soil carbon stock would further increase the per hectare value of U.S. wetlands.

4.7. Expanding Urban Green Spaces

Quantifying the potential value of small-scale urban green spaces is important for landscape planning and improvement of existing ecosystem services. Indeed, recent research highlights the importance of “land sparing: intensive and extremely compact urbanization alongside separate, large, contiguous green space” [52], but also highlights the necessity of land sharing—development typical of residential land where development and natural space are interspersed. The prevalence of vacant lots in some cities [95] could provide sites for expansion of urban green spaces: Wang and Medley [96] found opportunities for increasing green spaces in patches/lots smaller than five hectares. However, this requires public investment at a time when cities often face deficits and cuts in service. A complementary approach entails innovative projects that work to increase the functionality of residential areas for species habitat and ecosystem services (especially in suburbs with more expansive green space than the urban core). One example is the National Wildlife Community Habitats Certification Program where communities commit to certifying individual backyards, school grounds, and public and private areas as NWF Certified Wildlife Habitat [97] to create wildlife corridors. There are both local opportunities and justification to expand and connect existing urban green spaces. The City of Chicago’s stormwater management ordinance mandates multi-modal runoff prevention measures, including green insfrastructure (GI) products, practices and technologies [98] as part of an effort to protect Lake Michigan’s drinking water supply. Parcel-scale GI as part of larger networks to connect urban green spaces can also provide an important opportunity to expand urban green spaces in a way that can provide habitat to slow species decline in urban areas [99]. Increased tree cover or GI on private lands can add to public investment in GI, further increasing connectivity of urban green spaces.

5. Conclusions

We found spatial and temporal variation in natural capital (tree carbon stocks), ecosystem services (tree pollutant removal, tree carbon sequestration, and stormwater runoff reduction), and disservices (greenhouse gas emissions and soil SRP) within a 30-hectare heterogeneous green space. Soil carbon stocks were not significantly different between green space types (though the highest in the forest), indicating the value of soil carbon even in human-modified areas. Tree carbon stocks, sequestration, and pollutant removal varied spatially with tree cover, but were high in human-modified areas: approximately 63% of the neighboring forest. Both the wetland (~14% of the 30-hectare area) and subdivision (~55% of the 30-hectare area) reduced runoff and associated water treatment costs at the Metropolitan Water Reclamation District to varying degrees. GHG flux from soil had significant spatial and temporal variation, as did phosphorus (with higher SRP in the wetland). The fact that this restored wetland is still a source of SRP more than 20 years after restoration may be worth considering in wetland restoration projects on previous agricultural land. Phosphorus is a limiting nutrient for eutrophication and mobilization of soil P near water bodies may contribute to eutrophication potential and result in unintended cleanup costs. Incorporating knowledge of small-scale variability in ecosystem services and disservices on parcel-size lots (private or public) may improve sustainable planning in urban areas.

Acknowledgments

Field data collection for this project was funded in part by funds from DePaul University. In addition, we especially thank DePaul University for undergraduate student support for many of the individuals who contributed to the data collection effort. We would like to specially thank undergraduate researchers who participated in data collection for this paper, including Michael Berry, Carla Hernandez-Ramirez, Catherine Pease, Mary Jordan Babiez, Matthew Connors, and Jonathan Chandler. We also thank Regina Ostergaard-Klem and two anonymous reviewers for their suggestions to improve this manuscript.

Author Contributions

Beth Lawrence conceived and designed the GHG experiments and analyzed the data. Christie Klimas conceived and designed all other experiments, performed the experiments and analyzed the data. Allison Williams, Megan Hoff, Jennifer Thompson, and Jennifer Thompson performed field or laboratory analysis and Allison Williams performed all spatial mapping. Christie Klimas wrote the paper.

Conflicts of Interest

The authors declare no conflict of interest. The founding sponsors had no role in the design of the study; in the collection, analyses, or interpretation of data; in the writing of the manuscript, and in the decision to publish the results.

Appendix A. Sum of the Aboveground Biomass (kg) for Each Tree Species

Tree SpeciesSum of Biomass (kg)
American Elm1264
Ash504
Beech38
Ash
Black Ash866
G/B Ash469
Green Ash2721
Red Ash195
Black Cherry93
Box Elder162
Elm495
Hickory679
Kentucky Coffee Tree70
Linden696
Mockernut Hickory151
Norway Maple301
Oak
Chestnut Oak4568
Chestnut White Oak145
Red/Black Oak72,110
Swamp White Oak11,700
White Oak21,162
Peachleaf Willow1660
Scotch Pine550
Shagbark Hickory545
Silver Maple209
Slippery Elm3343
Swamp Cottonwood155
White Poplar1695
Walnut
Black Walnut1166
White Walnut2242
Unidentified7390

References

  1. United Nations. World Urbanization Prospects the 2007 Revision. Available online: http://www.un.org/esa/population/publications/wup2007/2007WUP_Highlights_web.pdf (assessed on 9 August 2016).
  2. Millington, G. 'Race', Culture and the Right to the City: Centres, Peripheries, Margins; Palgrave Macmillan: Basingstoke, UK, 2011. [Google Scholar]
  3. Patterson, Z.; Saddier, S.; Rezaei, A.; Manaugh, K. Use of the urban core index to analyze residential mobility: The case of seniors in canadian metropolitan regions. J. Transp. Geogr. 2014, 41, 116–125. [Google Scholar] [CrossRef]
  4. Vaughan, L.; Griffiths, S.; Haklay, M.; Jones, C.E. Do the suburbs exist? Discovering complexity and specificity in suburban built form. Trans. Inst. Br. Geogr. 2009, 34, 475–488. [Google Scholar] [CrossRef]
  5. Vaughn, R.M.; Hostetler, M.; Escobedo, F.J.; Jones, P. The influence of subdivision design and conservation of open space on carbon storage and sequestration. Landsc. Urban Plann. 2014, 131, 64–73. [Google Scholar] [CrossRef]
  6. Forsyth, A. Defining suburbs. J. Plan. Lit. 2012, 27, 270–281. [Google Scholar] [CrossRef]
  7. Daily, G.C. Nature's Services: Societal Dependence on Natural Ecosystems; Island Press: Washington, DC, USA, 1997. [Google Scholar]
  8. Churkina, G.; Brown, D.G.; Keoleian, G. Carbon stored in human settlements: The conterminous United States. Glob. Chang. Biol. 2010, 16, 135–143. [Google Scholar] [CrossRef]
  9. Nowak, D.J.; Crane, D.E. Carbon storage and sequestration by urban trees in the USA. Environ. Pollut. 2002, 116, 381–389. [Google Scholar] [CrossRef]
  10. Bolund, P.; Hunhammar, S. Ecosystem services in urban areas. Ecol. Econ. 1999, 29, 293–301. [Google Scholar] [CrossRef]
  11. Pataki, D.E.; Carreiro, M.M.; Cherrier, J.; Grulke, N.E.; Jennings, V.; Pincetl, S.; Pouyat, R.V.; Whitlow, T.H.; Zipperer, W.C. Coupling biogeochemical cycles in urban environments: Ecosystem services, green solutions, and misconceptions. Front. Ecol. Environ. 2011, 9, 27–36. [Google Scholar] [CrossRef]
  12. Hardin, P.J.; Jensen, R.R. The effect of urban leaf area on summertime urban surface kinetic temperatures: A terre haute case study. Urban For. Urban Green. 2007, 6, 63–72. [Google Scholar] [CrossRef]
  13. McPherson, E.G.; Nowak, D.; Heisler, G.; Grimmond, S.; Souch, C.; Grant, R.; Rowntree, R. Quantifying urban forest structure, function, and value: The Chicago urban forest climate project. Urban Ecosyst. 1997, 1, 49–61. [Google Scholar] [CrossRef]
  14. Brink, E.; Aalders, T.; Adam, D.; Feller, R.; Henselek, Y.; Hoffmann, A.; Ibe, K.; Matthey-Doret, A.; Meyer, M.; Negrut, N.L.; et al. Cascades of green: A review of ecosystem-based adaptation in urban areas. Glob. Environ. Chang. Hum. Policy Dimens. 2016, 36, 111–123. [Google Scholar] [CrossRef]
  15. Lantz, V.; Boxall, P.C.; Kennedy, M.; Wilson, J. The valuation of wetland conservation in an urban/peri urban watershed. Reg. Environ. Chang. 2013, 13, 939–953. [Google Scholar] [CrossRef]
  16. Brander, L.M.; Florax, R.; Vermaat, J.E. The empirics of wetland valuation: A comprehensive summary and a meta-analysis of the literature. Environ. Resour. Econ. 2006, 33, 223–250. [Google Scholar] [CrossRef]
  17. Brouwer, R.; Langford, I.H.; Bateman, I.J.; Turner, R.K. A meta-analysis of wetland contingent valuation studies. Reg. Environ. Chang. 1999, 1, 47–57. [Google Scholar] [CrossRef]
  18. Woodward, R.T.; Wui, Y.S. The economic value of wetland services: A meta-analysis. Ecol. Econ. 2001, 37, 257–270. [Google Scholar] [CrossRef]
  19. Charlesworth, S.M.; Harker, E.; Rickard, S. A review of sustainable drainage systems (SuDS): A soft option for hard drainage questions? Geography 2003, 88, 99–107. [Google Scholar]
  20. Chocat, B.; Krebs, P.; Marsalek, J.; Rauch, W.; Schilling, W. Urban drainage redefined: From stormwater removal to integrated management. Water Sci. Technol. 2001, 43, 61–68. [Google Scholar] [PubMed]
  21. Rauch, W.; Seggelke, K.; Brown, R.; Krebs, P. Integrated approaches in urban storm drainage: Where do we stand? Environ. Manag. 2005, 35, 396–409. [Google Scholar] [CrossRef] [PubMed]
  22. Boyer, T.; Polasky, S. Valuing urban wetlands: A review of non-market valuation studies. Wetlands 2004, 24, 744–755. [Google Scholar] [CrossRef]
  23. Kenney, W.A.; Van Wassenaer, P.J.E.; Satel, A.L. Criteria and indicators for strategic urban forest planning and management. Arboric. Urban For. 2011, 37, 108–117. [Google Scholar]
  24. Schmitt-Harsh, M.; Mincey, S.K.; Patterson, M.; Fischer, B.C.; Evans, T.P. Private residential urban forest structure and carbon storage in a moderate-sized urban area in the midwest, United States. Urban For. Urban Green. 2013, 12, 454–463. [Google Scholar] [CrossRef]
  25. Gough, C.M.; Elliott, H.L. Lawn soil carbon storage in abandoned residential properties: An examination of ecosystem structure and function following partial human-natural decoupling. J. Environ. Manag. 2012, 98, 155–162. [Google Scholar] [CrossRef] [PubMed]
  26. Edmondson, J.L.; Davies, Z.G.; McHugh, N.; Gaston, K.J.; Leake, J.R. Organic carbon hidden in urban ecosystems. Sci. Rep. 2012, 2, 926. [Google Scholar] [CrossRef] [PubMed]
  27. Pouyat, R.V.; Yesilonis, I.D.; Nowak, D.J. Carbon storage by urban soils in the United States. J. Environ. Qual. 2006, 35, 1566–1575. [Google Scholar] [CrossRef] [PubMed]
  28. Costanza, R.; de Groot, R.; Sutton, P.; van der Ploeg, S.; Anderson, S.J.; Kubiszewski, I.; Farber, S.; Turner, R.K. Changes in the global value of ecosystem services. Glob. Environ. Chang. Hum. Policy Dimens. 2014, 26, 152–158. [Google Scholar] [CrossRef]
  29. U.S. Forest Service and Department of Agriculture. i-Tree i-Tree Canopy. Web. i-Tree Software Suite v5.X. (n.D.). Available online: https://www.itreetools.org/ (assessed on 9 August 2016).
  30. Kovacs, K.; Polasky, S.; Nelson, E.; Keeler, B.L.; Pennington, D.; Plantinga, A.J.; Taff, S.J. Evaluating the return in ecosystem services from investment in public land acquisitions. PLoS ONE 2013, 8, e62202. [Google Scholar] [CrossRef] [PubMed]
  31. Polasky, S.; Nelson, E.; Pennington, D.; Johnson, K.A. The impact of land-use change on ecosystem services, biodiversity and returns to landowners: A case study in the State of Minnesota. Environ. Resour. Econ. 2011, 48, 219–242. [Google Scholar] [CrossRef]
  32. Spash, C.L.; Aslaksen, I. Re-establishing an ecological discourse in the policy debate over how to value ecosystems and biodiversity. J. Environ. Manag. 2015, 159, 245–253. [Google Scholar] [CrossRef] [PubMed]
  33. Rees, W.E. How should a parasite value its host? Ecol. Econ. 1998, 25, 49–52. [Google Scholar] [CrossRef]
  34. Lyytimaki, J.; Sipila, M. Hopping on one leg—The challenge of ecosystem disservices for urban green management. Urban For. Urban Green. 2009, 8, 309–315. [Google Scholar] [CrossRef]
  35. Von Dohren, P.; Haase, D. Ecosystem disservices research: A review of the state of the art with a focus on cities. Ecol. Indic. 2015, 52, 490–497. [Google Scholar] [CrossRef]
  36. Bruland, G.L.; Hanchey, M.F.; Richardson, C.J. Effects of agriculture and wetland restoration on hydrology, soils, and water quality of a Carolina bay complex. Wetl. Ecol. Manag. 2003, 11, 141–156. [Google Scholar] [CrossRef]
  37. Woltemade, C.J. Ability of restored wetlands to reduce nitrogen and phosphorus concentrations in agricultural drainage water. J. Soil Water Conserv. 2000, 55, 303–309. [Google Scholar]
  38. Ballantine, K.; Schneider, R. Fifty-five years of soil development in restored freshwater depressional wetlands. Ecol. Appl. 2009, 19, 1467–1480. [Google Scholar] [CrossRef] [PubMed]
  39. Aldous, A.; McCormick, P.; Ferguson, C.; Graham, S.; Craft, C. Hydrologic regime controls soil phosphorus fluxes in restoration and undisturbed wetlands. Restor. Ecol. 2005, 13, 341–347. [Google Scholar] [CrossRef]
  40. Kinsman-Costello, L.E.; O’Brien, J.; Hamilton, S.K. Re-flooding a historically drained wetland leads to rapid sediment phosphorus release. Ecosystems 2014, 17, 641–656. [Google Scholar] [CrossRef]
  41. Reddy, K.R.; Wetzel, R.G.; Kadlec, R.H. Biogeochemistry of phosphorus in wetlands. In Phosphorus: Agriculture and the environment; Sims, J.T., Sharpley, A.N., Eds.; American Society of Agronomy, Crop Science Society of America, Soil Science Society of America: Madison, WS, USA, 2005. [Google Scholar]
  42. Sharpley, A.; Jarvie, H.P.; Buda, A.; May, L.; Spears, B.; Kleinman, P. Phosphorus legacy: Overcoming the effects of past management practices to mitigate future water quality impairment. J. Environ. Qual. 2013, 42, 1308–1326. [Google Scholar] [CrossRef] [PubMed]
  43. Montgomery, J.A.; Eames, J.M. Prairie wolf slough wetlands demonstration project: A case study illustrating the need for incorporating soil and water quality assessment in wetland restoration planning, design and monitoring. Restor. Ecol. 2008, 16, 618–628. [Google Scholar] [CrossRef]
  44. Taebi, A.; Droste, R.L. Pollution loads in urban runoff and sanitary wastewater. Sci. Total Environ. 2004, 327, 175–184. [Google Scholar] [CrossRef] [PubMed]
  45. Hey, D.L.; Kostel, J.A.; Hurter, A.P.; Kadlec, R.H. Nutrient farming and traditional removal: An economic comparison. In Water Environment Research Foundation Final Report; Metropolitan Water Reclamation District of Greater Chicago: Chicago, IL, USA, 2005. [Google Scholar]
  46. Bronson, K.F.; Mosier, A.R. Effect of nitrogen fertilizer and nitrification inhibitors on methane and nitrous oxide fluxes in irrigated corn. Springer 1993, 278–289. [Google Scholar]
  47. Dunmola, A.S.; Tenuta, M.; Moulin, A.P.; Yapa, P.; Lobb, D.A. Pattern of greenhouse gas emission from a prairie pothole agricultural landscape in Manitoba, Canada. Can. J. Soil Sci. 2010, 90, 243–256. [Google Scholar] [CrossRef]
  48. Hernandez-Ramirez, G.; Brouder, S.M.; Smith, D.R.; Van Scoyoc, G.E. Greenhouse gas fluxes in an eastern corn belt soil: Weather, nitrogen source, and rotation. J. Environ. Qual. 2009, 38, 841–854. [Google Scholar] [CrossRef] [PubMed]
  49. Mosier, A.; Schimel, D.; Valentine, D.; Bronson, K.; Parton, W. Methane and nitrous-oxide fluxes in native, fertilized and cultivated grasslands. Nature 1991, 350, 330–332. [Google Scholar] [CrossRef]
  50. Nowak, D.J.; Crane, D.E.; Stevens, J.C. Air pollution removal by urban trees and shrubs in the United States. Urban For. Urban Green. 2006, 4, 115–123. [Google Scholar] [CrossRef]
  51. Brander, L.; Brouwer, R.; Wagtendonk, A. Economic valuation of regulating services provided by wetlands in agricultural landscapes: A meta-analysis. Ecol. Eng. 2013, 56, 89–96. [Google Scholar] [CrossRef]
  52. Stott, I.; Soga, M.; Inger, R.; Gaston, K.J. Land sparing is crucial for urban ecosystem services. Front. Ecol. Environ. 2015, 13, 387–393. [Google Scholar] [CrossRef]
  53. Natural Resources Conservation Service (NRCS); United States Department of Agriculture (USDA). Web Soil Survey. USDA-NRCS: Lincoln, Nebraska. Available online: http://websoilsurvey.sc.egov.usda.gov/App/HomePage.htm (assessed on 9 August 2016).
  54. Jenkins, J.C.; Chojnacky, D.C.; Heath, L.S.; Birdsey, R.A. Comprehensive Database of Diameter-Based Biomass Regressions for North American Tree Species. Available online: http://svinet2.fs.fed.us/ne/durham/4104/papers/ne_gtr319_jenkins_and_others.pdf (assessed on 9 August 2016).
  55. Nowak, D.J. Atmospheric carbon-reduction by urban trees. J. Environ. Manag. 1993, 37, 207–217. [Google Scholar] [CrossRef]
  56. Tritton, L.M.; Hornbeck, J.W. Biomass Equations for Major Tree Species of the Northeast. Available online: http://www.columbia.edu/itc/barnard/envsci/bc3016/edit/biomass_eq.pdf (assessed on 9 August 2016).
  57. Cairns, M.A.; Brown, S.; Helmer, E.H.; Baumgardner, G.A. Root biomass allocation in the world’s upland forests. Oecologia 1997, 111, 1–11. [Google Scholar] [CrossRef]
  58. Nowak, D.J.; Crane, D.E.; Stevens, J.C.; Hoehn, R.E.; Walton, J.T.; Bond, J. A ground-based method of assessing urban forest structure and ecosystem services. Arboric. Urban For. 2008, 34, 347–358. [Google Scholar]
  59. U.S. Environmental Protection Agency (EPA). Technology Transfer Network Air Quality System (AQS) and AQS Data Mart. Available online: https://www3.epa.gov/ttn/airs/airsaqs/ (assessed on 9 August 2016).
  60. Nowak, D.J.; Hirabayashi, S.; Bodine, A.; Greenfield, E. Tree and forest effects on air quality and human health in the United States. Environ. Pollut. 2014, 193, 119–129. [Google Scholar] [CrossRef] [PubMed]
  61. Technical Support Document: Technical Update of the Social Cost of Carbon for Regulatory Impact Analysis under Executive Order 12866. Available online: https://www.whitehouse.gov/sites/default/files/omb/inforeg/social_cost_of_carbon_for_ria_2013_update.pdf (assessed on 9 August 2016).
  62. Bureau of Economic Analysis. The National Income and Product Accounts Tables. U.S. Department of Commerce. Available online: http://www.bea.gov/index.htm (assessed on 9 August 2016).
  63. De Vos, B.; Vandecasteele, B.; Deckers, J.; Muys, B. Capability of loss-on-ignition as a predictor of total organic carbon in non-calcareous forest soils. Commun. Soil Sci. Plant Anal. 2005, 36, 2899–2921. [Google Scholar] [CrossRef]
  64. Mehlich, A. Mehlich-3 soil test extractant—A modification of mehlich-2 extractant. Commun. Soil Sci. Plant Anal. 1984, 15, 1409–1416. [Google Scholar] [CrossRef]
  65. The R Core Team. R: A Language and Environment for Statistical Computing. Available online: http://cran.fiocruz.br/web/packages/dplR/vignettes/timeseries-dplR.pdf (assessed on 9 August 2016).
  66. Livingston, G.P.; Hutchinson, G.L. Enclosure-based measurement of trace-gas exchange: Applications and sources of error. In Biogenic Trace Gases Measuring Emissions from Soil and Water; Matson, P.A., Harriss, R.C., Eds.; Blackwell Science: Oxford, UK; Cambridge, MA, USA, 1995; pp. 14–51. [Google Scholar]
  67. Holland, E.A.; Robertson, G.P.; Greenberg, J.; Groffman, P.M.; Boone, R.D.; Gosz, J.R.; Coleman, D.C.; Bledsoe, C.S.; Sollins, P. Standard Soil Methods for Long-Term Ecological Research. Available online: https://books.google.com/books?hl=en&lr=&id=npbmCwAAQBAJ&oi=fnd &pg=PR11&dq=Standard+soil+methods+for+long-term+ecological+research&ots=d92MLGNaFP&sig=bzQl86N6wb9DW6D1L_A8vHNt1H0#v=onepage&q=Standard%20soil%20methods%20for%20long-term%20ecological%20research&f=false (assessed on 9 August 2016).
  68. Morse, J.L.; Ardon, M.; Bernhardt, E.S. Greenhouse gas fluxes in southeastern U.S. Coastal plain wetlands under contrasting land uses. Ecol. Appl. 2012, 22, 264–280. [Google Scholar] [CrossRef] [PubMed]
  69. Solomon, S. Climate Change 2007: The Physical Science Basis: Contribution of Working Group I to the Fourth Assessment Report of the Intergovernmental Panel on Climate Change; Cambridge University Press: Cambridge, UK, 2007. [Google Scholar]
  70. Roger, C. Urban Hydrology for Small Watersheds. Available online: http://repositories.tdl.org/tamug-ir/bitstream/handle/1969.3/24438/6545-Urban%20Hydrology%20for%20Small%20Watersheds.pdf?sequence=1&isAllowed=y (assessed on 9 August 2016).
  71. Cox, C.B. Stormwater and Nonpoint Source Pollution Control: Best Management Practices Manual. Available online: https://www.pca.state.mn.us/water/stormwater-best-management-practices-manual (assessed on 9 August 2016).
  72. Garn, H.S. Effects of Lawn Fertilizer on Nutrient Concentration in Runoff from Lakeshore Lawns, Lauderdale Lakes, Wisconsin. Available online: http://wi.water.usgs.gov/pubs/wrir-02-4130/wrir-02-4130.pdf (assessed on 9 August 2016).
  73. Changnon, S.A.; Vogel, J.L. Hydroclimatological characteristics of isolated severe rainstorms. Water Resour. Res. 1981, 17, 1694–1700. [Google Scholar] [CrossRef]
  74. Schlindwein, P.A. Hydrologic Study of the Prairie Wolf Slough Wetlands Demonstration Project, Illinois—For Friends of the Chicago River, Inc. And the Lake County Forest Preserve District. Available online: http://onlinelibrary.wiley.com/doi/10.1111/j.1526-100X.2008.00492.x/full (assessed on 9 August 2016).
  75. Metropolitan Water Reclamation District Reports. Available online: https://www.mwrd.org/irj/portal/anonymous?NavigationTarget=navurl://02b3c7f46cefc82c570d76ddf9fe9b2c (assessed on 9 August 2016).
  76. McPherson, G.E.; Nowak, D.J.; Rowntree, R.A. Chicago’s Urban Forest Ecosystem: Results of the Chicago Urban Forest Climate Project. Available online: http://www.treesearch.fs.fed.us/pubs/4285 (assessed on 9 August 2016).
  77. Kim, G.; Miller, P.A.; Nowak, D.J. Assessing urban vacant land ecosystem services: Urban vacant land as green infrastructure in the city of Roanoke, Virginia. Urban For. Urban Green. 2015, 14, 519–526. [Google Scholar] [CrossRef]
  78. Bae, J.; Ryu, Y. Land use and land cover changes explain spatial and temporal variations of the soil organic carbon stocks in a constructed urban park. Landsc. Urban Plann. 2015, 136, 57–67. [Google Scholar] [CrossRef]
  79. Mestdagh, I.; Sleutel, S.; Lootens, P.; Van Cleemput, O.; Carlier, L. Soil organic carbon stocks in verges and urban areas of Flanders, Belgium. Grass Forage Sci. 2005, 60, 151–156. [Google Scholar] [CrossRef]
  80. Dunne, E.J.; Coveney, M.F.; Hoge, V.R.; Conrow, R.; Naleway, R.; Lowe, E.F.; Battoe, L.E.; Wang, Y. Phosphorus removal performance of a large-scale constructed treatment wetland receiving eutrophic lake water. Ecol. Eng. 2015, 79, 132–142. [Google Scholar] [CrossRef]
  81. Lynch, S. Compilation of Benefits and Costs of Sta and Reservoir Projects in the South Florida Water Management District, Report for the World Wildlife Fund Acting on Behalf of the Florida Ranchlands Environmental Services Project. Available online: http://www.fresp.org/pdfs/Compilation%20of%20STA%20and%20REZ%20Benefits%20Costs%20HandS%2011_2011.pdf (assessed on 9 August 2016).
  82. Sano, D.; Hodges, A.; Degner, R. Economic Analyses of Water Treatements for Phosphorus Removal in Florida. Available online: http://edis.ifas.ufl.edu/pdffiles/FE/FE57600.pdf (assessed on 9 August 2016).
  83. Keller, C.H.; Wetland Solutions Inc. Development of Design Criteria for Stormwater Treatement Areas (STAs) in the Northern Lake Okeechobee Watershed. Available online: http://www.wetlandsolutionsinc.com/download/TreatmentWetlands/Final%20NLO%20Design%20Criteria%20Task%202.pdf (assessed on 9 August 2016).
  84. Mitsch, W.J.; Bernal, B.; Nahlik, A.M.; Mander, U.; Zhang, L.; Anderson, C.J.; Jorgensen, S.E.; Brix, H. Wetlands, carbon, and climate change. Landsc. Ecol. 2013, 28, 583–597. [Google Scholar] [CrossRef]
  85. Bridgham, S.D.; Megonigal, J.P.; Keller, J.K.; Bliss, N.B.; Trettin, C. The carbon balance of North American wetlands. Wetl. 2006, 26, 889–916. [Google Scholar] [CrossRef]
  86. Changnon, S.A. Trends in floods and related climate conditions in Illinois. Clim. Chang. 1983, 5, 341–363. [Google Scholar] [CrossRef]
  87. Huff, F.A.; Angel, J.R. Frequency Distribution and Hydroclimatic Characteristics of Heavy Rainstorms in Illinois. Available online: http://www.isws.illinois.edu/pubdoc/B/ISWSB-70.pdf (assessed on 9 August 2016).
  88. Changnon, S.A.; Kunkel, K.E.; Changnon, D. Winter 2007—2008: Record-Setting Storms Caused Major Damages in Illinois. Available online: http://docplayer.net/504631-Winter-2007-2008-record-setting-storms-caused-major-damages-in-illinois.html (assessed on 9 August 2016).
  89. McKinley, D.C.; Ryan, M.G.; Birdsey, R.A.; Giardina, C.P.; Harmon, M.E.; Heath, L.S.; Houghton, R.A.; Jackson, R.B.; Morrison, J.F.; Murray, B.C.; et al. A synthesis of current knowledge on forests and carbon storage in the United States. Ecol. Appl. 2011, 21, 1902–1924. [Google Scholar] [CrossRef] [PubMed]
  90. Sander, H.A.; Zhao, C. Urban green and blue: Who values what and where? Land Use Policy 2015, 42, 194–209. [Google Scholar] [CrossRef]
  91. Barbosa, A.E.; Fernandes, J.N.; David, L.M. Key issues for sustainable urban stormwater management. Water Res. 2012, 46, 6787–6798. [Google Scholar] [CrossRef] [PubMed]
  92. Barbier, E.; Acreman, M.; Knowler, D. Economic Valuation of Wetlands: A Guide for Policy Makers and Planners. Available online: http://www.terrabrasilis.org.br/ecotecadigital/pdf/economic-valuation-of-wetlands.pdf (assessed on 9 August 2016).
  93. Reiss, K.C. Florida wetland condition index for depressional forested wetlands. Ecol. Indic. 2006, 6, 337–352. [Google Scholar] [CrossRef]
  94. Brouwer, R. Environmental value transfer: State of the art and future prospects. Ecol. Econ. 2000, 32, 137–152. [Google Scholar] [CrossRef]
  95. City of Chicago. City-Owned Land Inventory. Available online: http://www.cityofchicago.org/city/en/depts/dcd/supp_info/city-owned_land_inventory.html (assessed on 9 August 2016).
  96. Wang, D.H.; Medley, K.E. Land use model for carbon conservation across a midwestern USA landscape. Landsc. Urban Plan. 2004, 69, 451–465. [Google Scholar] [CrossRef]
  97. National Wildlife W Federation. Available online: http://www.nwf.org/How-to-Help/Garden-for-Wildlife/Community-Habitats.aspx (assessed on 9 August 2016).
  98. USEPA. Green Infrastructure Strategic Agenda. Available online: http://water.epa.gov/infrastructure/greeninfrastructure/upload/2013_GI_FINAL_Agenda_101713.pdf (assessed on 9 August 2016).
  99. Rayfield, B.; Pelletier, D.; Dumitru, M.; Cardille, J.A.; Gonzalez, A.; Travis, J. Multipurpose habitat networks for short-range and long-range connectivity: A new method combining graph and circuit connectivity. Methods Ecol. Evolut. 2016, 7, 222–231. [Google Scholar] [CrossRef]
Figure 1. This map represents the approximately 30-hectare study site. The area includes subdivision (residential), wetland (cattail marsh), prairie (areas of wet meadow closer to the cattail marsh are not outlined due to variability in boundaries), and forest green space types. Part of the forested area of Prairie Wolf Slough was in the process of transitioning to areas of predominantly standing dead biomass (the cross-hatched area of the forest). The East and West transects were used to sample tree carbon stocks in trees in the forested area, and soil carbon in the forest, prairie (including wet meadow), and cattail marsh. Greenhouse gas flux was measured in (from West to East) forest, prairie, wet prairie, and cattail marsh. GHG Well Sample Locations are indicated in blue.
Sustainability 08 00853 g001
Figure 2. Percent soil organic matter (SOM) for the cattail marsh, prairie, and forest are shown with standard error bars. Letters at the base of each bar indicate significant differences: letters in one green space type that differ from those of other green space types indicate a significant difference in terms of soil organic matter.
Sustainability 08 00853 g002
Figure 3. Soil soluble reactive phosphorus (SRP) for the cattail marsh, prairie, and forest are shown with standard error bars. Letters at the base of each bar indicate significant differences: letters in one green space type that differ from those of other green space types indicate a significant difference in terms of soil soluble reactive phosphorus.
Sustainability 08 00853 g003
Figure 4. Analysis of Variance revealed that CO2 flux varied significantly among months (F = 12.17, p < 0.001) and by green space (F = 12.66, p < 0.001) in 2013. Note that no GHG samples were collected from the cattail marsh in August due to chambers being vandalized.
Sustainability 08 00853 g004
Table 1. Ecosystem service and disservice measurements and the green space types where samples were taken.
ForestPrairieWet MeadowCattail MarshSubdivision
Tree carbon stockx x
Soil organic carbonxx x
Greenhouse gas fluxxxxx
Stormwater runoff reductionxxxxx
Soil soluble reactive phosphorusxx x
Table 2. This table indicates measured ecosystem services and disservices. Benefits from tree canopy cover were calculated for the forest and subdivision. With the exception of carbon dioxide stock, all benefits are based on annual benefits from pollutant removal (i.e., carbon monoxide removed annually) and calculated using i-Tree canopy [29]. Amounts are in kg unless otherwise noted in the table. The monetary values associated with tree carbon stock and carbon sequestration were calculated by multiplying by $40.03/metric ton of CO2 based on the estimated marginal social costs of carbon dioxide emissions. Pollution removal value was calculated based on the following prices: $1469.94 per metric ton of carbon monoxide, $906.45 per metric ton of nitrogen dioxide, $4434.93 per metric ton of ozone, $201,317.75 per metric ton of particulate matter less than 2.5 μm, $336.88 per metric ton of sulfur dioxide, and $6909.77 per metric ton of particulate matter less than 10 μm and greater than 2.5 μm. Benefits from stormwater reduction in the subdivision are also shown (see text for complete methods and explanation). Soil organic carbon per hectare in CO2 equivalents (15 cm depth) and per hectare valuation is illustrated for forest, prairie, and cattail marsh. Ecosystem disservices from greenhouse gas flux (CO2, CH4, and N2O) are also displayed for the forest, prairie, wet meadow, and cattail marsh. CH4 and N2O estimates were averaged across months and converted to CO2 equivalents in metric tons per hectare per year. Valuation for soil carbon and GHG emissions were calculated using the social cost of carbon of US$40.03 to match valuations from i-Tree.
Ecosystem Services from Tree CanopyForestSubdivision
Value ($)AmountValue per HectareAmount per HectareValue ($)AmountValue per HectareAmount per Hectare
Carbon monoxide$8.28 ± 0.145.64 ± 0.10$1.761.20$18.43 ± 0.4912.54 ± 0.34$1.120.76
Nitrogen dioxide$38.59 ± 0.6642.57 ± 0.73$8.219.06$85.83 ± 2.3094.69 ± 2.54$5.205.74
Ozone$831.07 ± 14.16187.39 ± 3.19$176.8239.87$1848.68 ± 49.65416.85 ± 11.19$112.0425.26
Particulate matter less than 2.5 microns$2179.74 ± 37.1410.83 ± 0.18$463.772.30$4848.72 ± 130.2124.08 ± 0.65$293.861.46
Sulfur dioxide$5.15 ± 0.0915.3 ± 0.26$1.103.26$11.47 ± 0.3134.04 ± 0.91$0.702.06
Particulate 2.5 microns > 10 microns$380.66 ± 6.4955.09 ± 0.94$80.9911.72$846.76 ± 22.74122.55 ± 3.29$51.327.43
Carbon dioxide sequestration$1836.12 ± 31.2945.87 ± 0.78 t$390.669.76 t/ha$4084.36 ± 109.68102.04 t ± 2.74$247.546.18 t
Total annual benefit$5279.61 $1123.32 $11,744.25 $711.78
Carbon dioxide storage *49,899.12 ± 850.221.25 ± 0.02 kt$10,616.830.27 kt/ha$110,998.16 ± 2980.812.77 kt ± 0.07 kt$6727.160.17 kt
Stormwater runoff reduction----$3521.5755,670 m3$212.623363 m3
Forest Prairie Wet Meadow Cattail Marsh
Value per HectareAmount per HectareValue per HectareAmount per HectareValue per HectareAmount per HectareValue per HectareAmount per Hectare
Soil carbon storage (tons CO2 per hectare)$9126.84228$7925.94198--$8806.60220
Ecosystem disservice from GHGs (CO2e)−$170.534.26−$209.765.24−$51.241.81−$72.241.28
CO2−$55.641.39−$116.092.90−$24.810.62−$48.041.20
N2O in CO2e−$96.472.41−$78.061.95−$18.410.46−$20.020.50
CH4 in CO2e−$18.410.46−$15.610.39−$8.010.20−$4.400.11
* This benefit is not an annual rate.

