1. Introduction
Crude oil has been the focus of greater attention than other commodities. It plays a significant role in the economy and the financial market. Many economists have noticed the impacts of crude oil price on the economy [
1,
2,
3,
4,
5]. As a barometer of the economy, the stock market’s reaction is a reasonable and useful measure to reflect the impact of oil price shocks on the economy [
6]. Abundant literature has investigated the link between oil price and stock markets and concludes that oil price shocks have substantial effects on stock markets [
7,
8,
9,
10,
11,
12,
13,
14,
15,
16,
17,
18,
19,
20,
21].
Particularly, China has become the largest oil importer and consumer [
22].
Table 1 shows that the crude oil imports of China increased rapidly from 126.8 million tons in 2005 to 335.5 million tons in 2015. And oil imports accounted for 60.6% of the country's total oil consumption in 2015. China is a giant player in the global oil market. In addition, the Chinese stock market has been the second largest in terms of both trading volume and capitalization. Therefore, a lot of literature has focused on the link between oil prices and the Chinese stock market [
23,
24,
25,
26,
27,
28,
29,
30]. These studies however, do not elaborate various complexities in the link between oil price and stock prices. For instance, stock markets may react differently to oil price shocks during bullish and bearish times. The effects of oil price shocks may be nonlinear or may be asymmetrical in negative and positive oil price shocks. Therefore, the effects of oil price shocks may be heterogeneous and varying depending on market conditions and the types of the oil price shocks. It is worth examining the effect of oil price shocks on the Chinese stock market simultaneously under the control of the oil and stock market conditions.
In this paper, this issue will be addressed by using a quantile impulse response function which can be calculated via a quantile vector autoregression frame. This method was first proposed by Cecchetti and Li [
33] and has been used to explore the asymmetric and nonlinear effects between financial and economic variables [
34,
35]. Lee and Kim [
36] argue that the quantile impulse response function is widely applicable and is beneficial in that it captures the dynamic responses that the conventional impulse response does not explain. Moreover, the impulse responses in multiple quantiles can be deemed a scenario analysis that is a forecast of a variable under a scenario of a specific economic shock. Therefore, we use a quantile impulse response approach to investigate the impact of oil price shocks on stock market returns during different oil market states, with particular interest in extreme stock market circumstances (i.e., bearish and bullish markets).
We will investigate the responses of Chinese stock market returns to oil price shocks in terms of several aspects. First, each variable in the quantile VAR (Vector Autoregression) model can be defined to be at some specific state of the business for the analysis, i.e., the quantiles may differ across equations. In order to analyse the asymmetric shock effects, we propose relating conditional quantiles of the change rate of supply and demand in the oil market to business states [
34]. In the oil market, the lower negative change rate of global oil production, global real economic activity and the real oil price (at lower quantiles of the change rate distribution) can be attributed to business busts, whereas their higher positive change rates (at upper quantiles of the change rate distribution) can be attributed to a boom business state. This means that during a business bust phase, the supply and demand in the oil market should decrease while during a business boom phase, the supply and demand will increase. This assumption is reasonable. For example in a boom state, on one hand oil producers may adjust their oil production to increase the oil supply. On the other hand, a high demand for oil would drive up the price of oil. Therefore lower quantiles correspond to a bust oil market state, while upper quantiles correspond to a boom oil market state. Additionally, the lower quantiles of stock market return distributions correspond to a bearish market and its upper quantiles correspond to a bullish market.
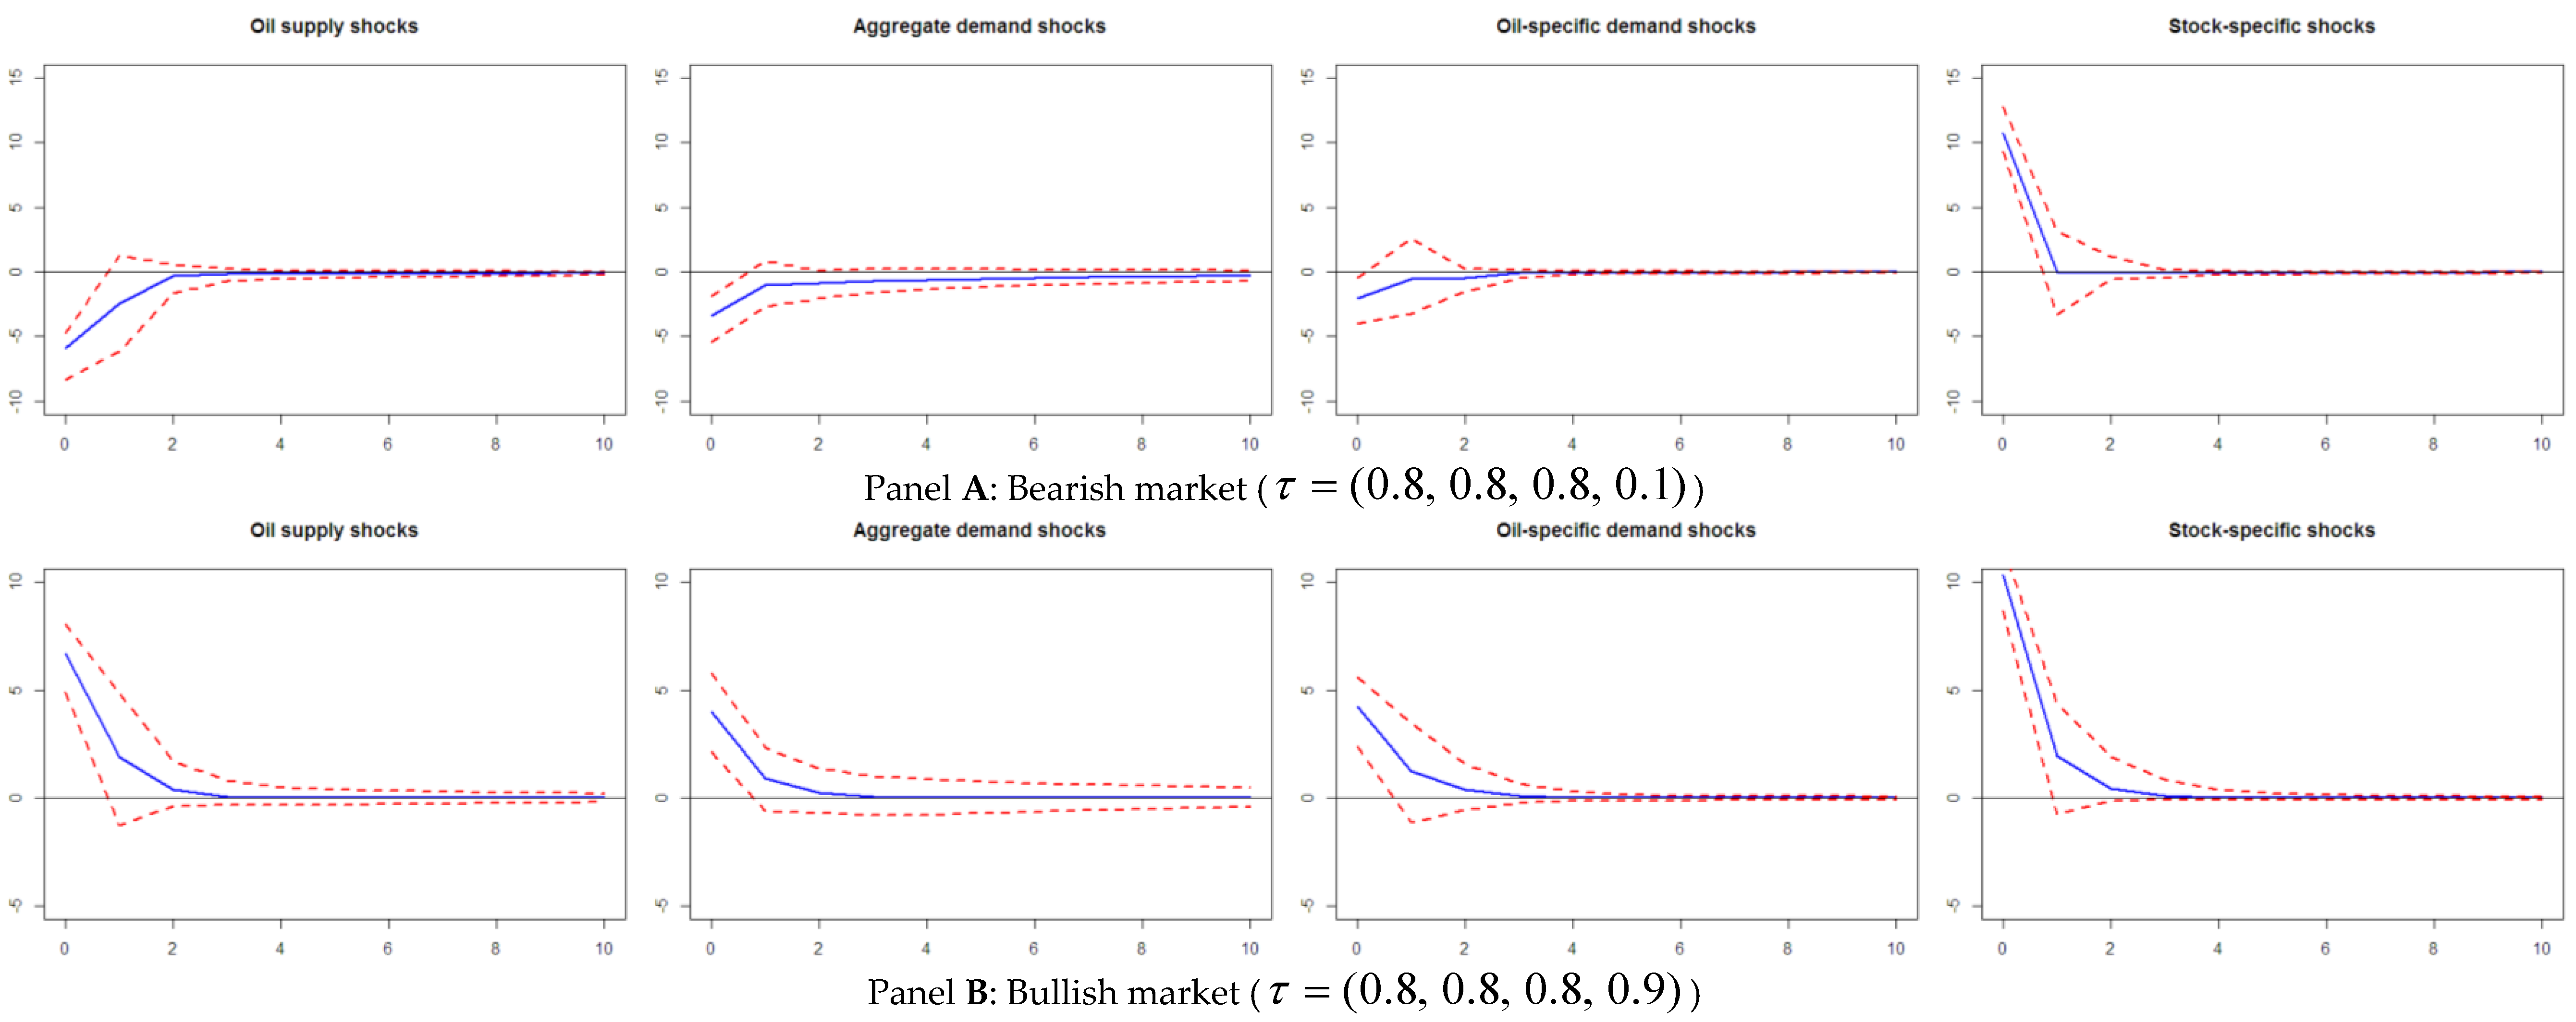
Second, following Kilian and Park [
12], oil price shocks are broken down into three different components: supply shocks, aggregate demand shocks and specific demand shocks. Then we investigate their effects on the Chinese stock market. Applying a quantile impulse response analysis, we study the direction, magnitude and duration of effects of oil price shocks on the Chinese stock market during different oil market conditions. Our empirical evidence indicates that the reaction of the Chinese stock market to oil price shocks depends on oil market conditions and the underlying forces of oil price shocks. Specifically during a bust phase, oil supply and demand shocks significantly depress stock market returns, while during a boom phase, only aggregate demand shock is positive, persistent and statistically significant. Additionally, we find that the different stock market circumstances (i.e., bearish and bullish markets) have different responses to oil price shocks.
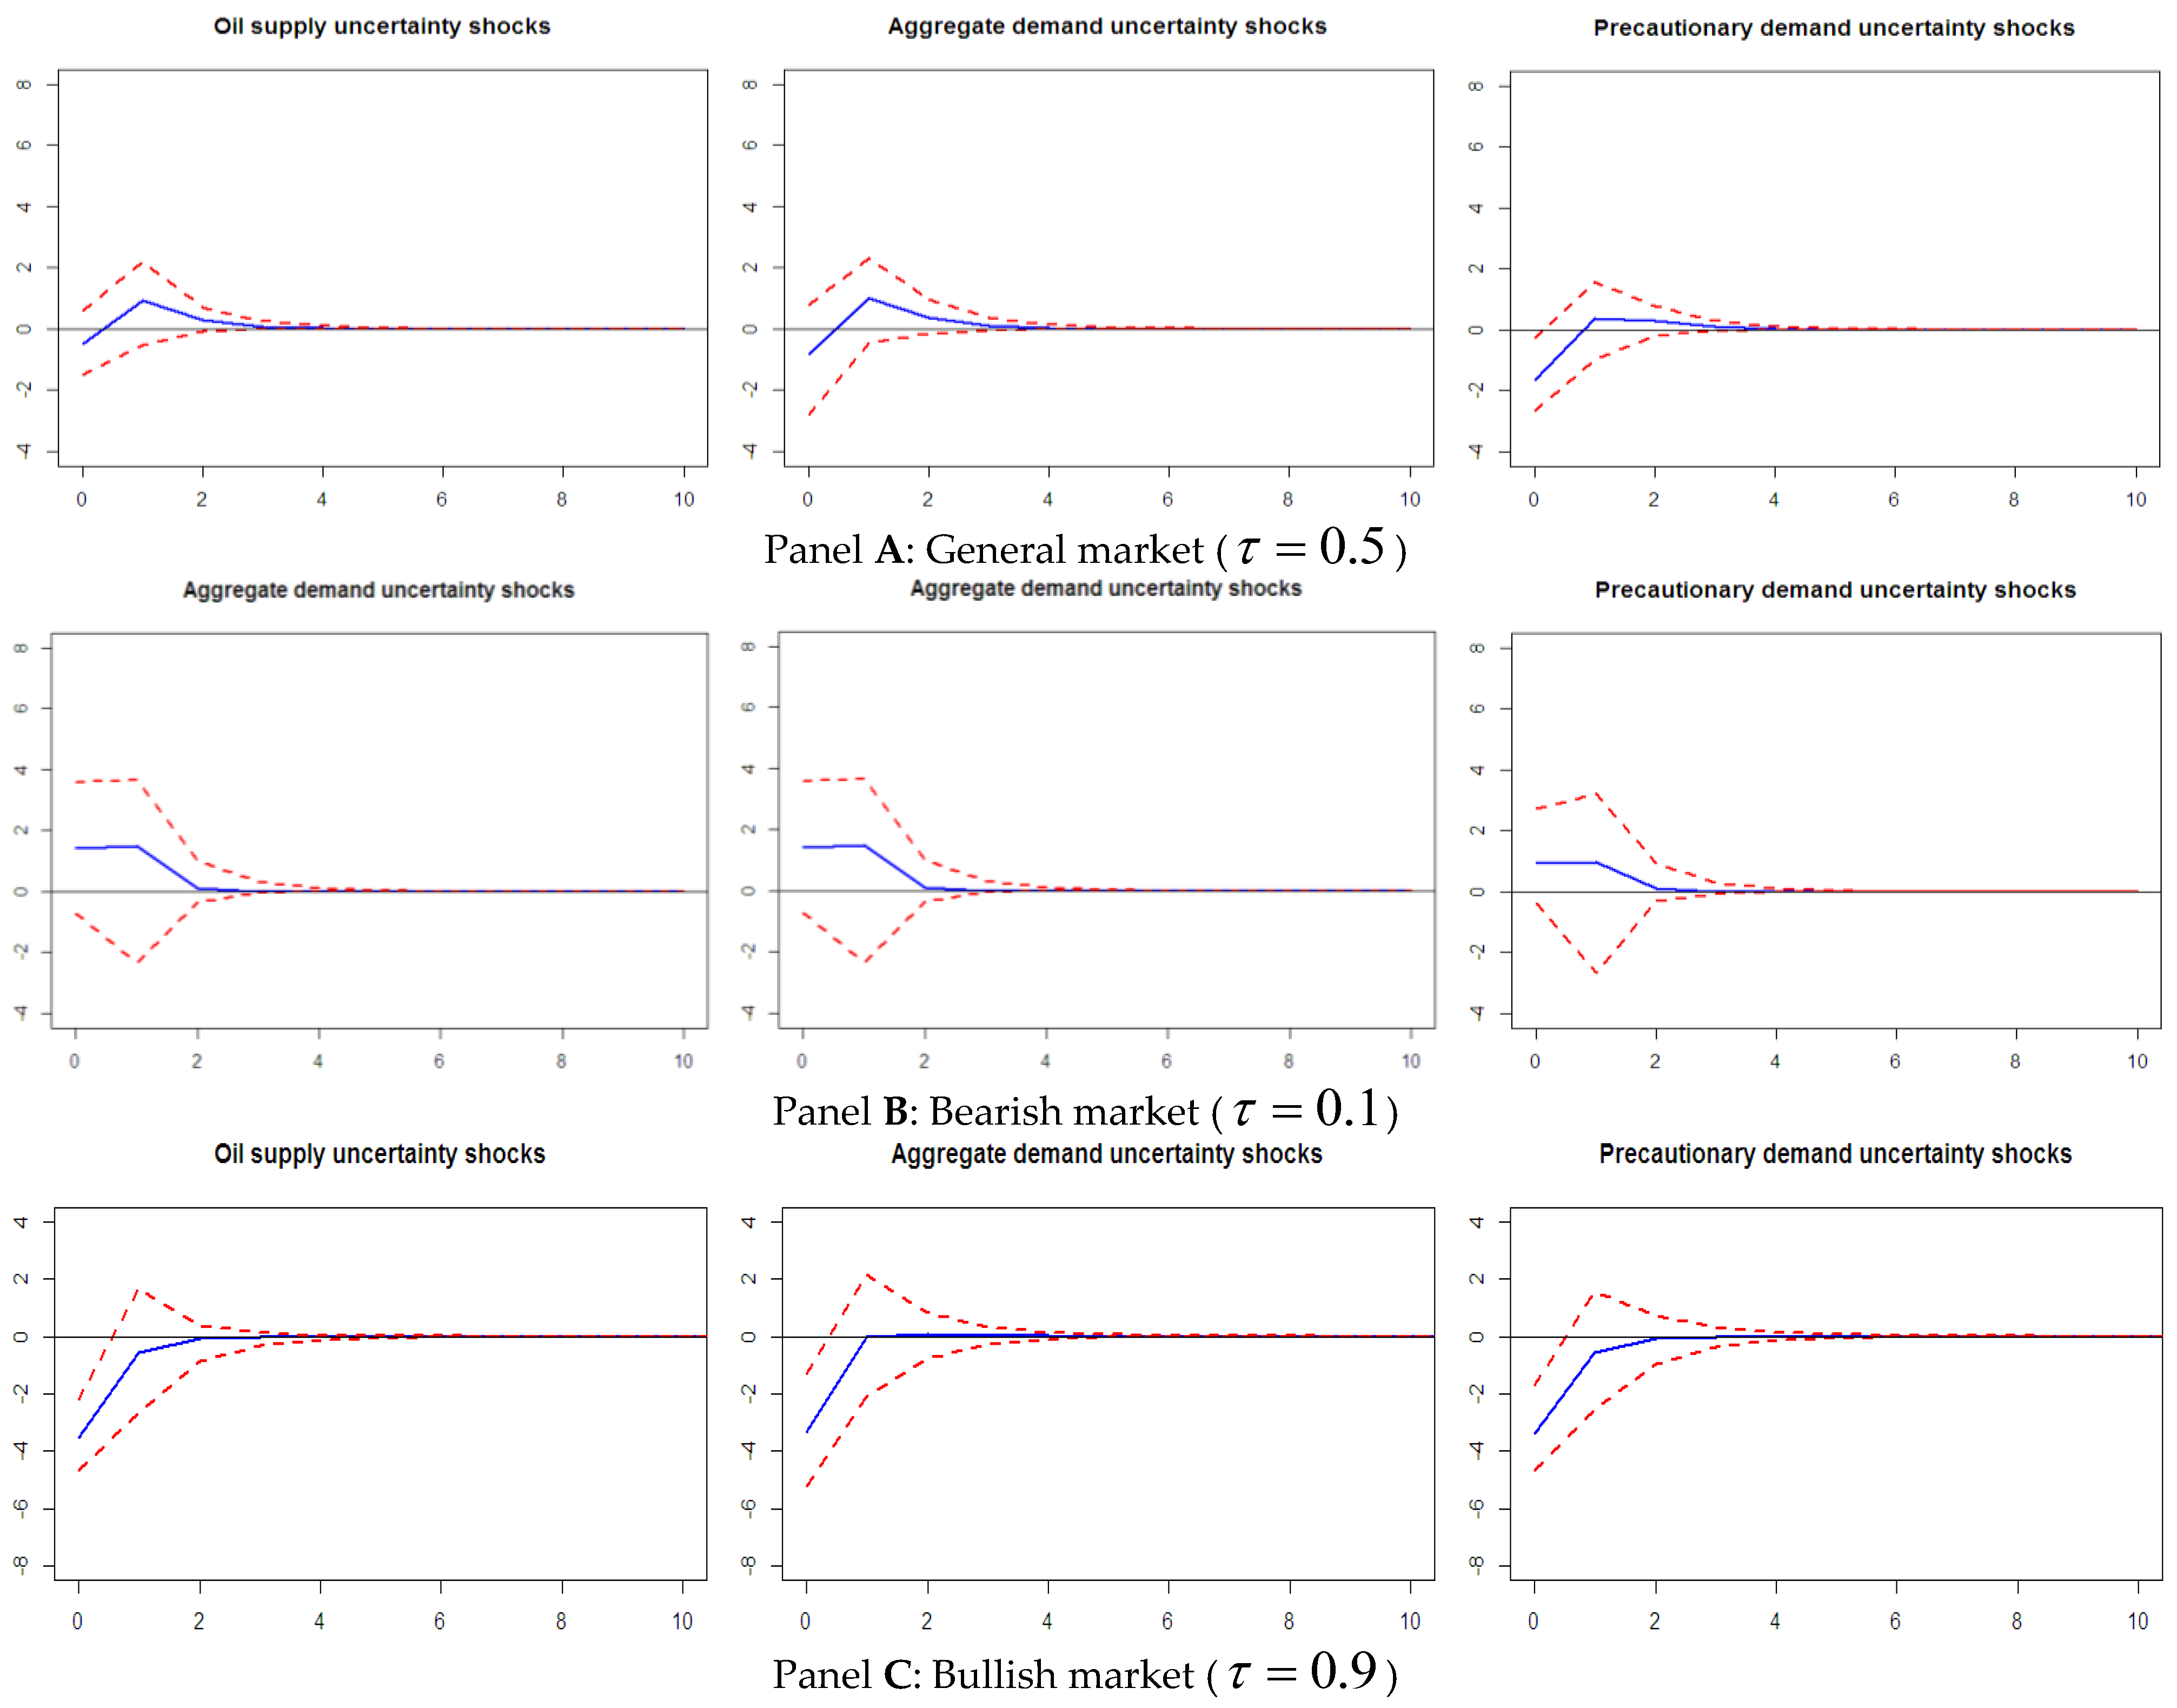
Third, we examine the impact of oil price uncertainty on the Chinese stock market. Some literatures have investigated the relationship between oil price and the Chinese stock market. However, few studies examine the effects of oil price uncertainty on the Chinese stock market. In this paper, we use a quantile impulse response analysis to investigate the shock effects of oil price uncertainty. Our results indicate that in a bearish market, oil supply and demand uncertainties have positive shock effects on Chinese stock market returns, while in a bullish market, oil supply and demand uncertainties show negative shocks effects.
The rest of this paper is organized as follows.
Section 2 briefly reviews the literature. The methodology is presented in
Section 3.
Section 4 describes the data and their descriptive statistics.
Section 5 provides empirical results and
Section 6 concludes.
2. Literature Review
Numerous literatures have illustrated the effects of oil price shocks on stock market, for example, with a standard cash flows/dividends valuation model, Jones and Gautam [
7] investigate the effects of oil price shocks on the stock markets in four developed countries US, Canada, Japan and England. Their empirical results show the important effects of the change in the oil price on the four countries’ stock markets. Huang et al. [
37] support causality effects from oil futures prices to stock prices. Sadorsdy [
8] shows the significant role of oil price shocks and volatility in explaining the real stock returns in the US and a negative effect of oil price volatility on stock prices. Papapetrou [
38] provides evidence that oil prices goes a long way in explaining stock price movements in the Greek stock market and shows the suppressing effects of positive oil price shocks on real stock market returns. Park and Ratti [
11] comprehensively analysed the impact of oil price shocks on the stock markets of the United States and 13 European countries. The effect of oil price shocks on oil-importing countries is negative, however the effects on oil-exporting countries are positive.
To capture the specific relationships between the oil price and stock market returns, Kilian [
5] adopts a structural VAR to decompose the oil price shocks into oil supply shocks, aggregate demand shocks and oil-specific demand shocks. Following the procedure of Kilian [
5], many studies have examined the impact of oil supply and demand shocks on the stock market. Kilian and Park [
12] show the different responses of aggregate US real stock market to different types of oil shocks. Specifically, oil supply shocks have no significant impact on stock market. Apergis and Miller [
39] investigate the effects of structural oil price shocks on eight developed countries’ stock markets (Australia, Canada, France, Germany, Italy, Japan, the United Kingdom and the United States). They find little evidence that oil market shocks have a significant impact on those stock markets. Basher et al. [
17] investigate the dynamic relationship between oil shocks and emerging stock markets. They show that the positive oil supply shocks decrease the oil prices while the positive oil demand shocks create an increase the oil price. Moreover, oil prices react positively to positive shocks of the emerging stock markets. Wang et al. [
40] study the effects of three structural shocks on the stock market in nine oil-importing countries and seven oil-exporting countries. Their empirical results suggest that the effect of oil price shocks on the stock market of a country depends on the net position of that country and the type of oil price shocks.
Recently, many economists have studied the effect of oil price shocks on the Chinese stock market. For example, Cong et al. [
23] adopted the VAR approach to explore this topic and found no effect of oil price shocks on the Chinese stock market, except in the manufacturing sector and some oil companies. Employing an ARJI(-ht)-EGARCH model, Zhang and Chen [
41] found that the Chinese stock market correlated only with expected volatilities in global oil prices and global oil prices have only minor positive effects on the Chinese stock market. Fang and You [
42] evaluated the effects of oil supply and demand shocks on the Chinese stock market with a structural VAR approach. They drew the conclusion that it presented a significant negative effect on oil-specific demand shocks but no statistically significant effects on global demand oil shocks. Based on the extreme value theory, Chen and Lv [
28] show a positive extremal dependence between oil prices and the Chinese stock market. It is noteworthy that Fang and You [
42] seemed to look at different types of oil shocks but not look at the effects of different quantiles, whereas Chen and Lv [
28] suggested that the extremes of the distribution of the oil market and stock market are dependent; however, they do not look at different types of oil shock.
In a previous paper [
43], we applied a quantile regression technique to investigate the linkage between oil price and Chinese stock market returns. Our results showed that the effects of crude oil price shocks on industry stock market returns presented significant heterogeneous across the stock return distribution. However, we did not identify the trigger forces of oil price shocks in the previous paper. In addition, relative to the quanitle regression method the quantile impulse response method can systematically analyse the shock effects under different stock and oil market states (boom or bust). Therefore, we further analyse the impact of oil price shocks on the Chinese stock market in the present paper.
Focusing on understanding how large positive or negative oil price shocks impact different stock market return quantiles, Sim and Zhou [
44] proposed a novel quantile-on-quantile approach to examine the quantile dependence relationship between oil prices and United States stock returns. In this paper, the lower oil price shock quantiles are regarded as large and negative oil price shocks, while the upper oil price shock quantiles are seen as large and positive oil price shocks. They find that the relationship between oil prices on US equities is asymmetric. Along these lines, Reboredo and Ugolini [
45] use a copula-quantile method to capture quantile dependence between oil price shocks and stock market returns in three developed economies and five BRICS countries. They examine how quantile and interquantile oil price movements impact different stock return quantiles and find asymmetric effects of oil price shocks on stock market returns. However, both studies analyse the asymmetric effects of oil price shocks on stock market returns in two-dimensional systems, so we cannot extend their methods to higher-dimensional situations. The present methodology has the advantage in that it can easily accommodate higher-dimensional models.
Our research sought to explore the impact of oil supply and demand shocks on Chinese stock market returns during different oil market phases. To the best of our knowledge, no paper has yet thoroughly investigated this topic. Furthermore, we adopt the quantile impulse response analysis based on a quantile structural VAR model because it offers a structural multiple equation framework i.e., it is vital to model the interaction effects of a system of variables.
3. Methodology
Our interest is using the quantile impulse response to uncover the dynamic responses of Chinese stock market returns to oil market structural shocks in the different phases of the business. In order to calculate quantile impulse responses, we use a quantile structural vector autoregression technique which employs a quantile regression method to estimate a structural vector auto-regressions model. In this section, we first briefly introduce the quantile regression method, then present the reduced form of the quantile structural VAR and identify the structural shocks to conduct quantile impulse response analysis.
3.1. Quantile Regression
Quantile regression can be seen as a flexible generalization of standard regression equations [
46]. Compared with the least-square method, it has two major advantages. The first is that quantile regression estimations can be robust to non-Gaussian or heavy-tailed data, and the second is that the quantile regression model allows practitioners to provide more easily interpretable regression estimates
. The quantile regression model explains the
quantile of
, given the values of a vector of explanatory variables
as
where
,
is the probability distribution function of the random variable
yt. The notation
highlights that there is a potentially different parameter vector at each respective quantile
of the distribution. The unknown parameter vector
can be estimated for any quantile
by minimizing the following expression with respect to
:
where
is the usual indicator function. The solution to the quantile regression model is obtained using the programming algorithm suggested by Koenker and D’Orey [
47]. The resulting estimate
can capture the extent to which the
quantile of the conditional distribution of
changes if
changes by one unit. In this way, one can characterize the impact of changes in the
variables on the whole conditional distribution of
, measured at any of its quantiles that are of interest to the researcher.
3.2. The Reduced-Form Quantile Structural VAR
From the point of view of program implementation, we first present the reduced form of quantile structural VAR. The structural model is then recovered in a second step by decomposing the covariance matrix of the error term. In this paper, the reduced form quantile VAR is given as
where
Here, is a 4 vector of endogenous variables in which denotes the percentage change in global crude oil production, denotes the percentage change in global real economic activity, denotes percentage change in the real price of oil, and denotes the percentage change in real stock price index. is a 4 vector of intercepts at quantiles , for denotes the matrix of lagged coefficients at quantiles , and is a vector of error terms.
The quantile VAR model emphasizes the important fact that the parameters in each equation may pertain to different quantiles of the conditional distribution of the respective left-hand side variable. This model is attractive because it allows us to use the estimated model to answer a variety of interesting empirical questions. For instance, there is a boom oil market in which the oil supply, the real economic activity and oil price are in the 90th percentile of the data (), whereas in a bearish stock market, stock returns are in the 10th percentile of the distribution .
To obtain the estimated coefficient matrices
and
, we assume that the errors
satisfy the population quantile restrictions
. These restrictions imply that the population responses of the
at quantiles
are characterized by
Since each equation of (4) has the same right-hand side, the model can be estimated on an equation-by-equation basis for each vector
using quantile regression [
33].
3.3. The Quantile Impulse Response
In order to identify the structural shocks of the global oil market, we give these error terms
et as a structure restriction, which specifies the contemporaneous relationship between the reduced-form disturbances and the underlying structural disturbances. By modifying the procedure of Kilian and Park [
12], we decompose the structural shocks as follows:
where
represents a white noise process in which the covariance matrix is an identity matrix. The identifying restrictions underlying Equation (5) have their own nature and origin. First, because oil production is capital-intensive and time-consuming, therefore the oil supply shock cannot trigger changes of aggregate demand and crude oil price in the short term. Second, although the response of global economy activity to oil-specific demand shock is lagging behind, it can still react immediately to oil supply shock. In addition, in the short term, stock price shock cannot influence world economic activity. Third, the expected shortfall in oil supply and global economic activity can create changes in precautionary demand [
12]. The oil-specific shock responses to oil supply and aggregate demand shocks. Finally, many other factors such as changes in interest rates and exchange rates can trigger stock-specific shock [
17,
48].
According to the above structural shocks identified, we orthogonalize the covariance matrix of the residuals using a Cholesky decomposition and calculate the associated quantile-specific impulse response function. The 95% confidence interval of the impulse response function is obtained using the ‘bootstrapping’ approach. The 95% confidence bounds are provided to judge the statistical significance of the impulse response functions. Using the impulse response function, we are able to implement impulse response analysis in our compelling quantile levels and plot the impact of a one-unit increase in the one variable’s innovation at date on another variable at date . Therefore, we can find the response of the interesting variable’s change when shocks occur in other variables under various quantiles.
4. Data and Summary Statistics
The data applied in this paper is monthly and spans the period from October 2001 to December 2015. We selected October 2001 as the start date because the State Council of China further deregulated the domestic oil-pricing mechanism until October 2001. In order to identify oil market supply and demand shocks on the Chinese stock market, global oil production, global real economic activity index, the world oil price and stock price index are collected. The global oil production data measured in thousands of barrels per day are sourced from the US Energy Information Administration. The global real economic activity index is likely to capture shifts in the demand for industrial global business markets and is available to download from Lutz Kilian’s homepage. Moreover, Kilian [
5] has fully explained the rationale of using this index to measure the global demand for oil. The world real oil price in dollars per barrel is measured using the US refiner acquisition cost of crude oil and then deflated by US Consumer Price Index (CPI). It is worth noting that we abandoned the country-specific oil price and instead used the world oil price because the world oil price could better capture the impact of oil price shock on stock markets than country-specific prices, which reflected the offsetting movements in exchange rates [
11]. The world oil price may affect the Chinese stock market through different channels. On one hand, because China is net oil-importer, therefore, a dramatic increase in the world oil price may lead to lower consumption demand and higher production costs, all of which would constrain the economic development and ultimately decreasing stock market returns. On the other hand, the global economic cycles will influence the China’s real economy and financial market. Therefore, a fluctuation of the world oil price will affect China’s exports and real economy and the Chinese stock market will reflect the world oil price trends. As a proxy for the Chinese stock market, Shanghai Composite index is collected from CSMAR. The Shanghai composite index is a stock market index of all stock (A shares and B shares) traded on the Shanghai stock exchange. It reflects the changes in stock prices traded on the Shanghai stock exchange. The nominal price index is converted to the real price index using Chinese CPI. These CPI data are available from the OECD.
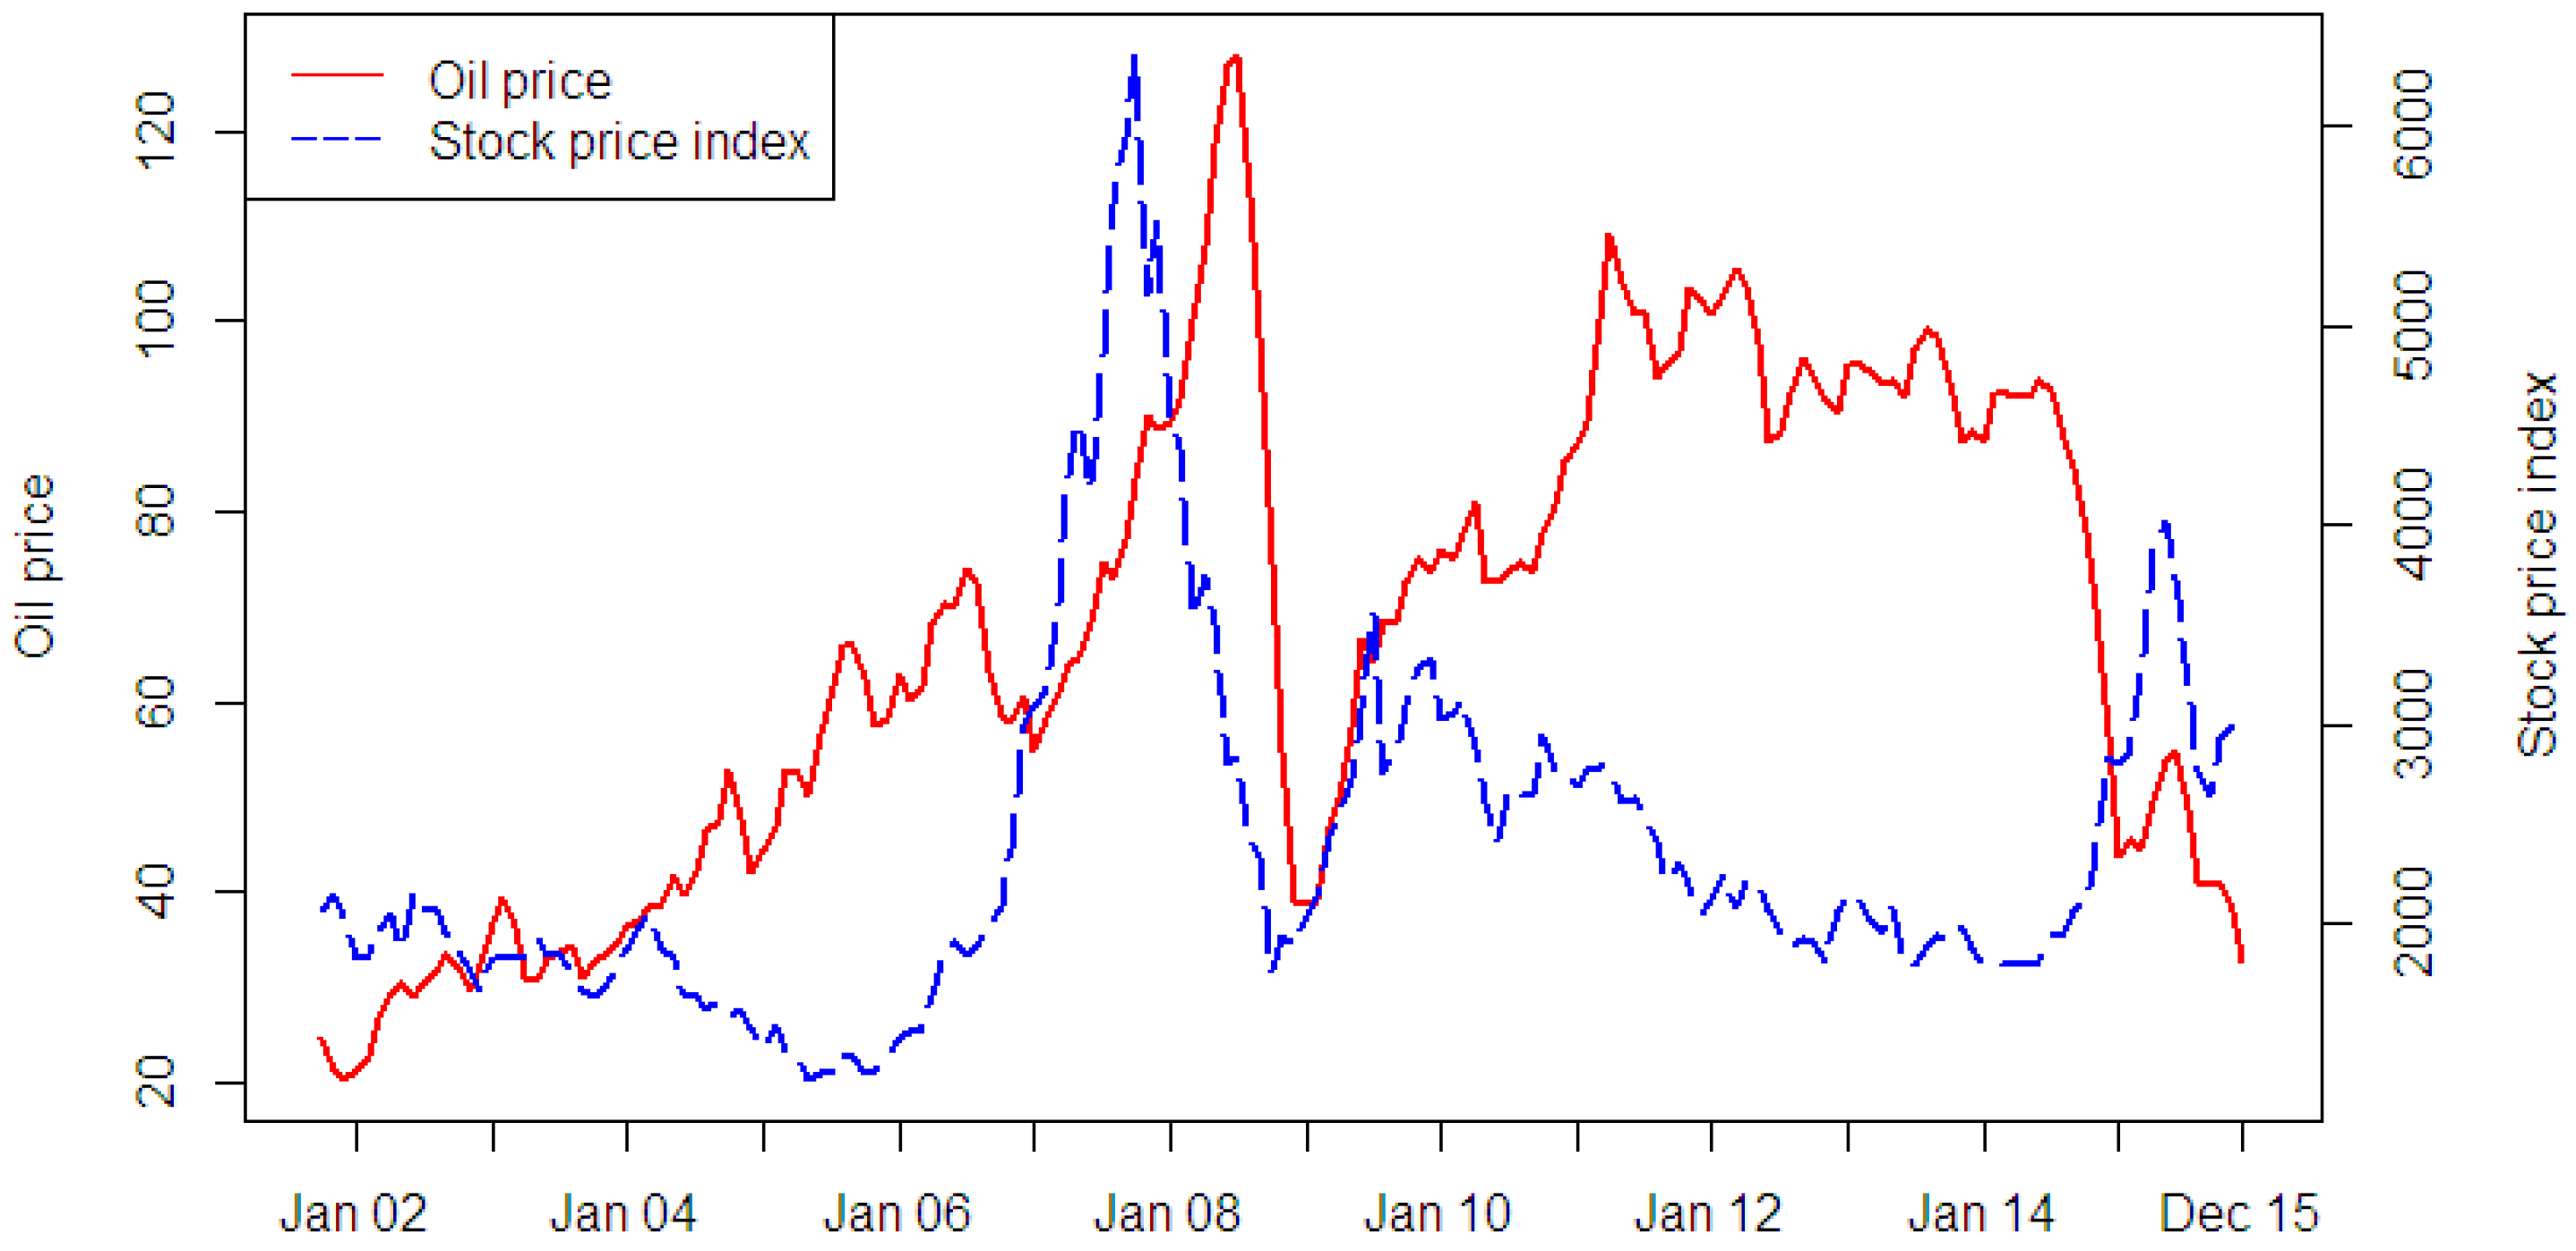
Figure 1 plots the real oil prices, as well as Shanghai composite index prices. Observe that the real oil prices and stock prices appear in an inconsistent variation trend, sometimes moving together but frequently moving in opposite directions, which verifies the fact that various complexities exist in the relationship between oil prices and stock prices. According to
Figure 1, we can intuitively identify the periods of boom and bust of oil and stock markets. For the world oil market, the most remarkable surge in the price of oil since 1979 occurred between mid-2003 and mid-2008, in which the oil price surge was not caused by oil supply disruptions but by a series of increases in the crude oil demand associated with an unexpected expansion of the global economy and driven by strong additional demand for oil from emerging Asia in particular. From June 2008 to February 2009, the world oil price presented a sharp drop which was caused by the financial crisis of 2008. In 2009, the collapse of the global financial system was not imminent, the demand for oil recovered to levels prevailing in 2007 and the price of oil stabilized near 100 US dollars per barrel between 2010 early 2014. Between June 2014 and January 2015 the world oil price appeared a sharply decline. After a slight and transitory rise, since July 2015 the world oil price continued to fall. For the Chinese stock market, it underwent a bull market four times in the sample periods. The Shanghai composite index increased from 1080.94 in June 2005 to 5954.77 in October 2007, which was triggered by the reform of shareholder structure and the RMB appreciation. From November 2008 to July 2009, the four trillion investments of the central government and the ten industrial revitalization planning antagonized the stock price surge. Due to the influences of the second round of quantitative easing monetary policy, the Chinese stock market appeared in a transitory bull market from July to November 2010. Between July 2014 and June 2015, a series of reform programs and policy guidance of the Chinese government triggered an increase in the Shanghai composite index from 2201.56 to 4277.22.
In order to check if the fundamental oil supply and demand shocks influence Chinese stock market, we try to incorporate changes of crude oil production, economic activity and crude oil price into the shocks mentioned above. Thus, these variables showed the first changes in obtaining their real change rate.
Table 2 presents descriptive summary statistics for this study. Maximum and minimum values demonstrate change of crude oil production is far less than the variability of global economy activity and oil price change, which indicates that crude oil supply presents a stable increase however, global economic activity and oil-specific demand is increasing drastically. Thus, we conclude that shocks on crude oil demand have a large impact on the fluctuations of the crude oil price. Different from other variables, the mean of the global real economic activity is negative. However, all of the variables show negative skewness and excess kurtosis. The Shapiro-Wilk test results show that the normality of the change rate of oil market shocks and real stock returns are strongly rejected, which further validates the rationality of using the quantile regression method to estimate the VAR model.
Granger and Newbold [
49] noted that a VAR model that contains non-stationary variables may suffer from a spurious regression problem and the results may not be reliable. Accordingly, we pretest our variables for stationarity data using the Augmented Dickey Fuller (ADF) test. The results of unit root tests are shown in
Table 3, in which each variable in the structure VAR model is stationary.
6. Conclusions
This paper sheds light on the asymmetric effects of global oil price shocks on the Chinese stock market. We argue that the conditional quantiles of oil price distribution may be related to the different oil market states. Building on this, we use a quantile impulse response approach to uncover the asymmetric effects of oil price shocks in various oil and stock market states.
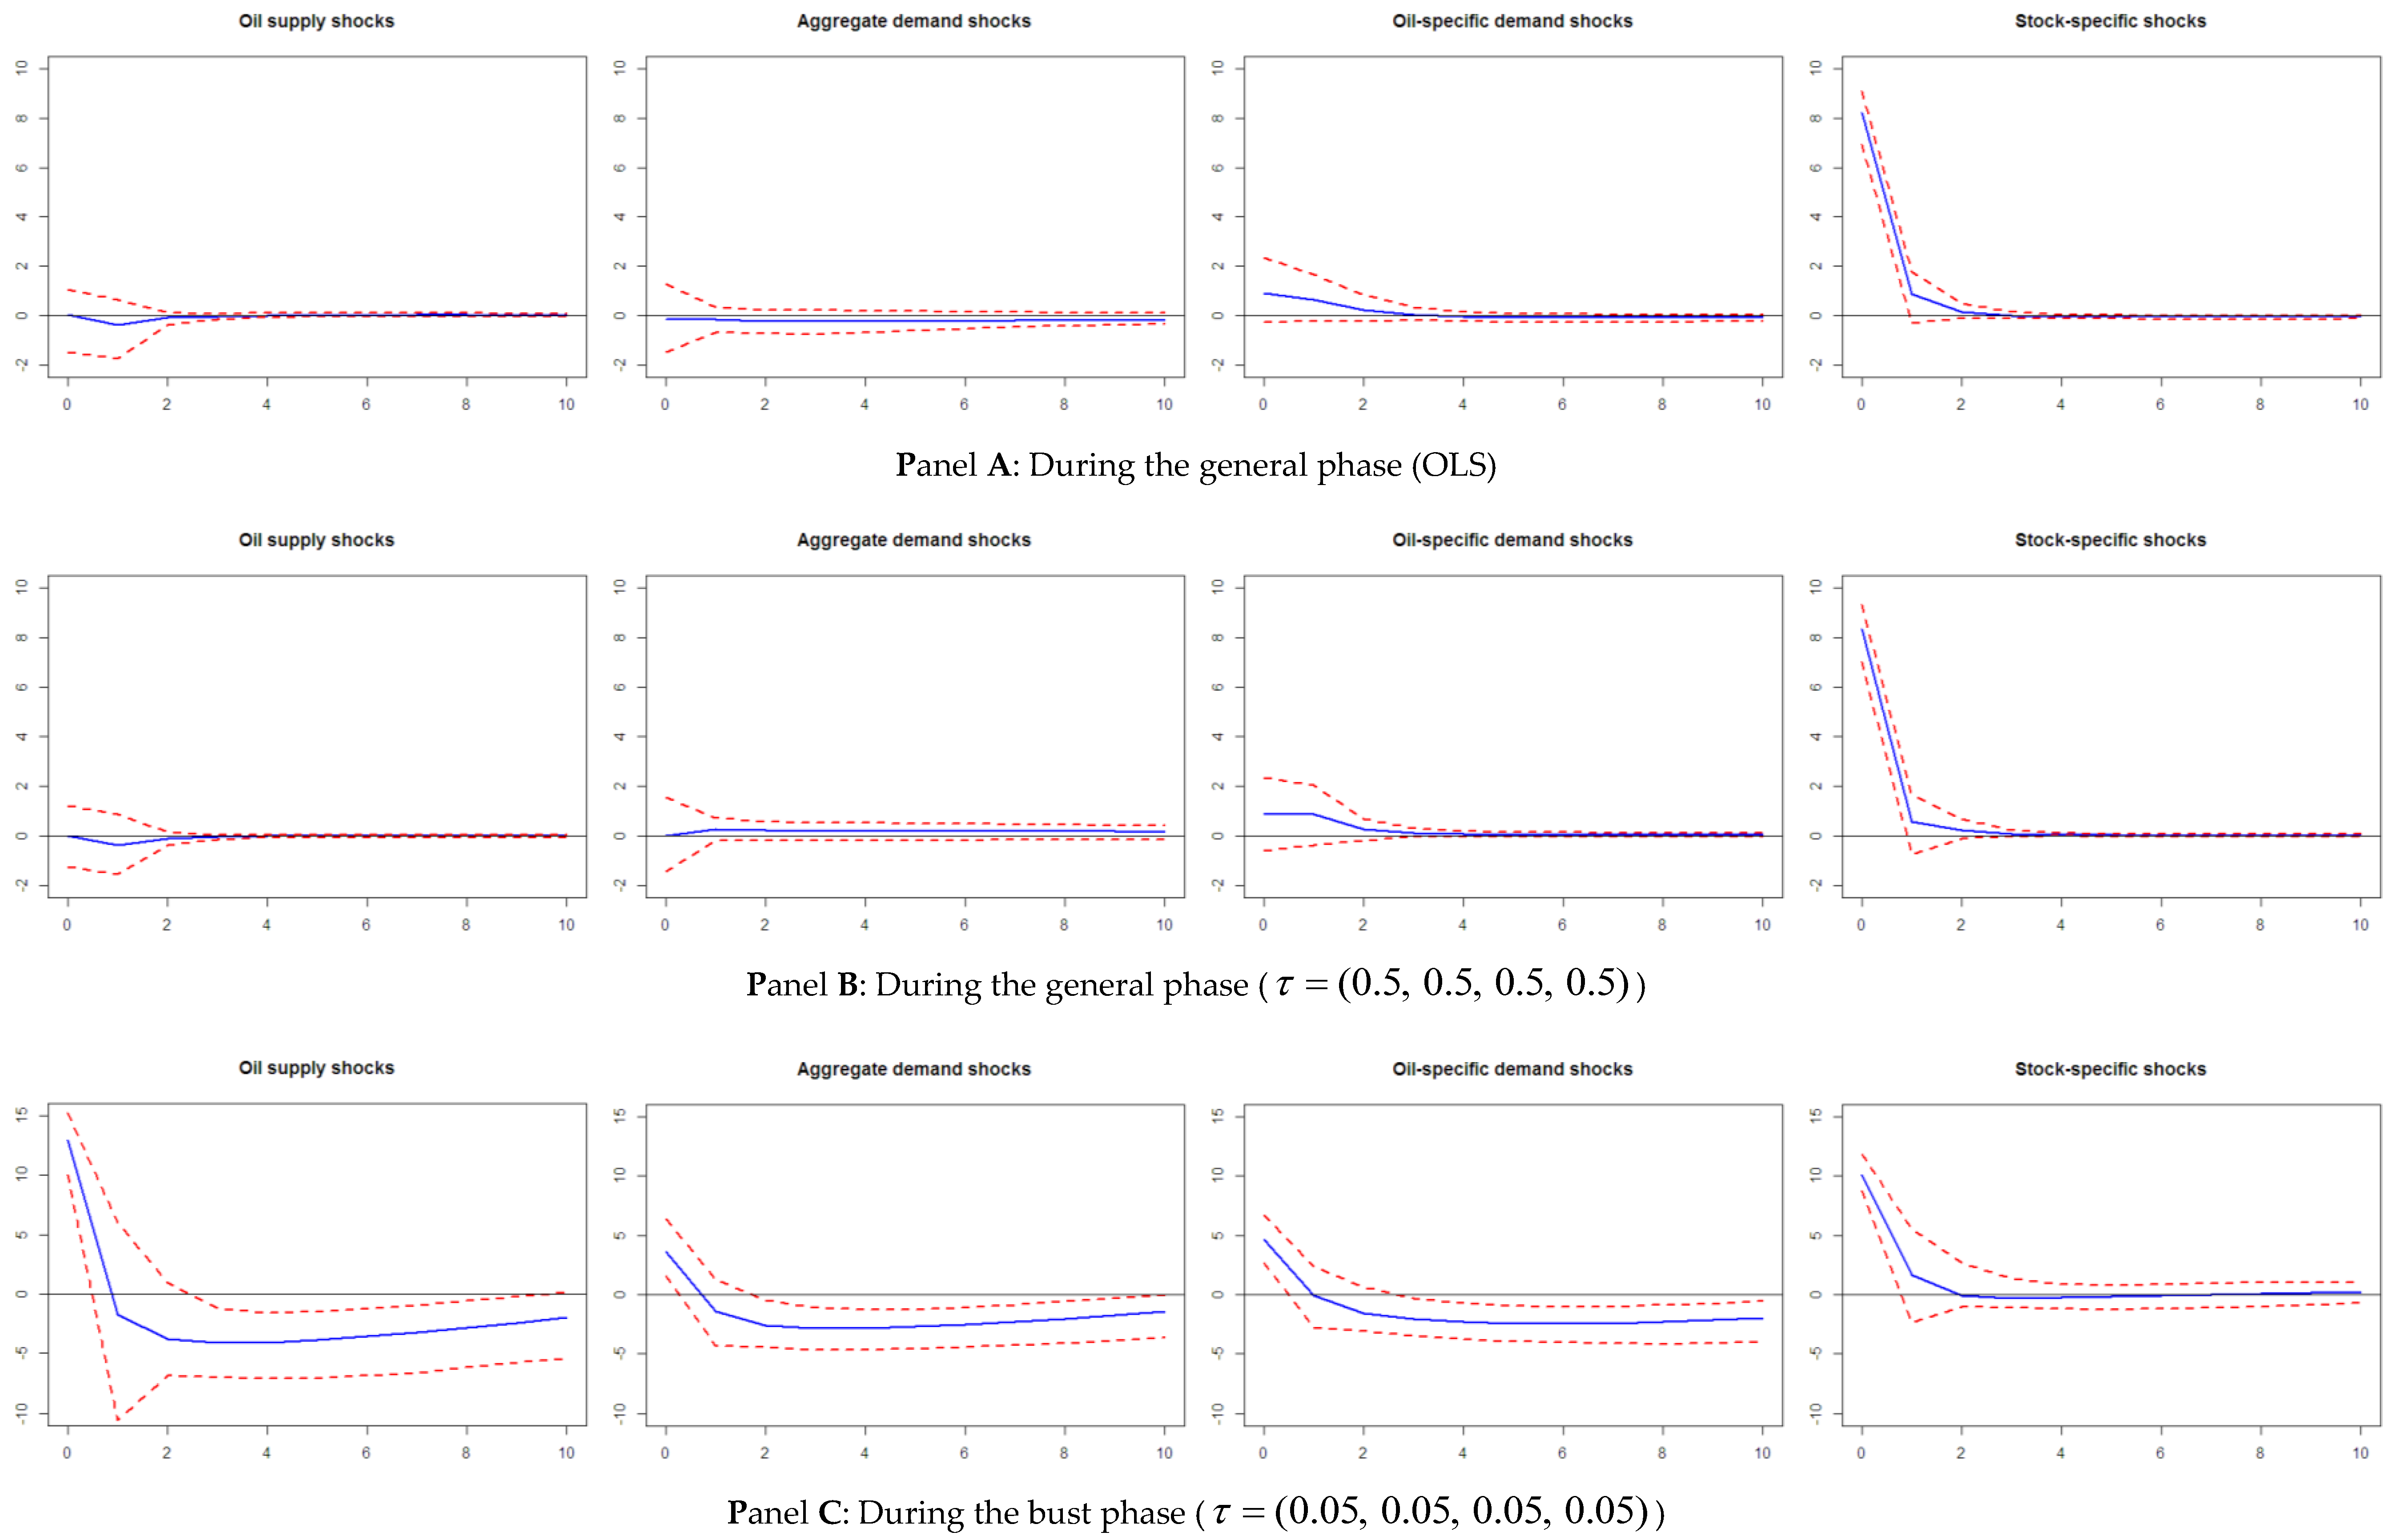
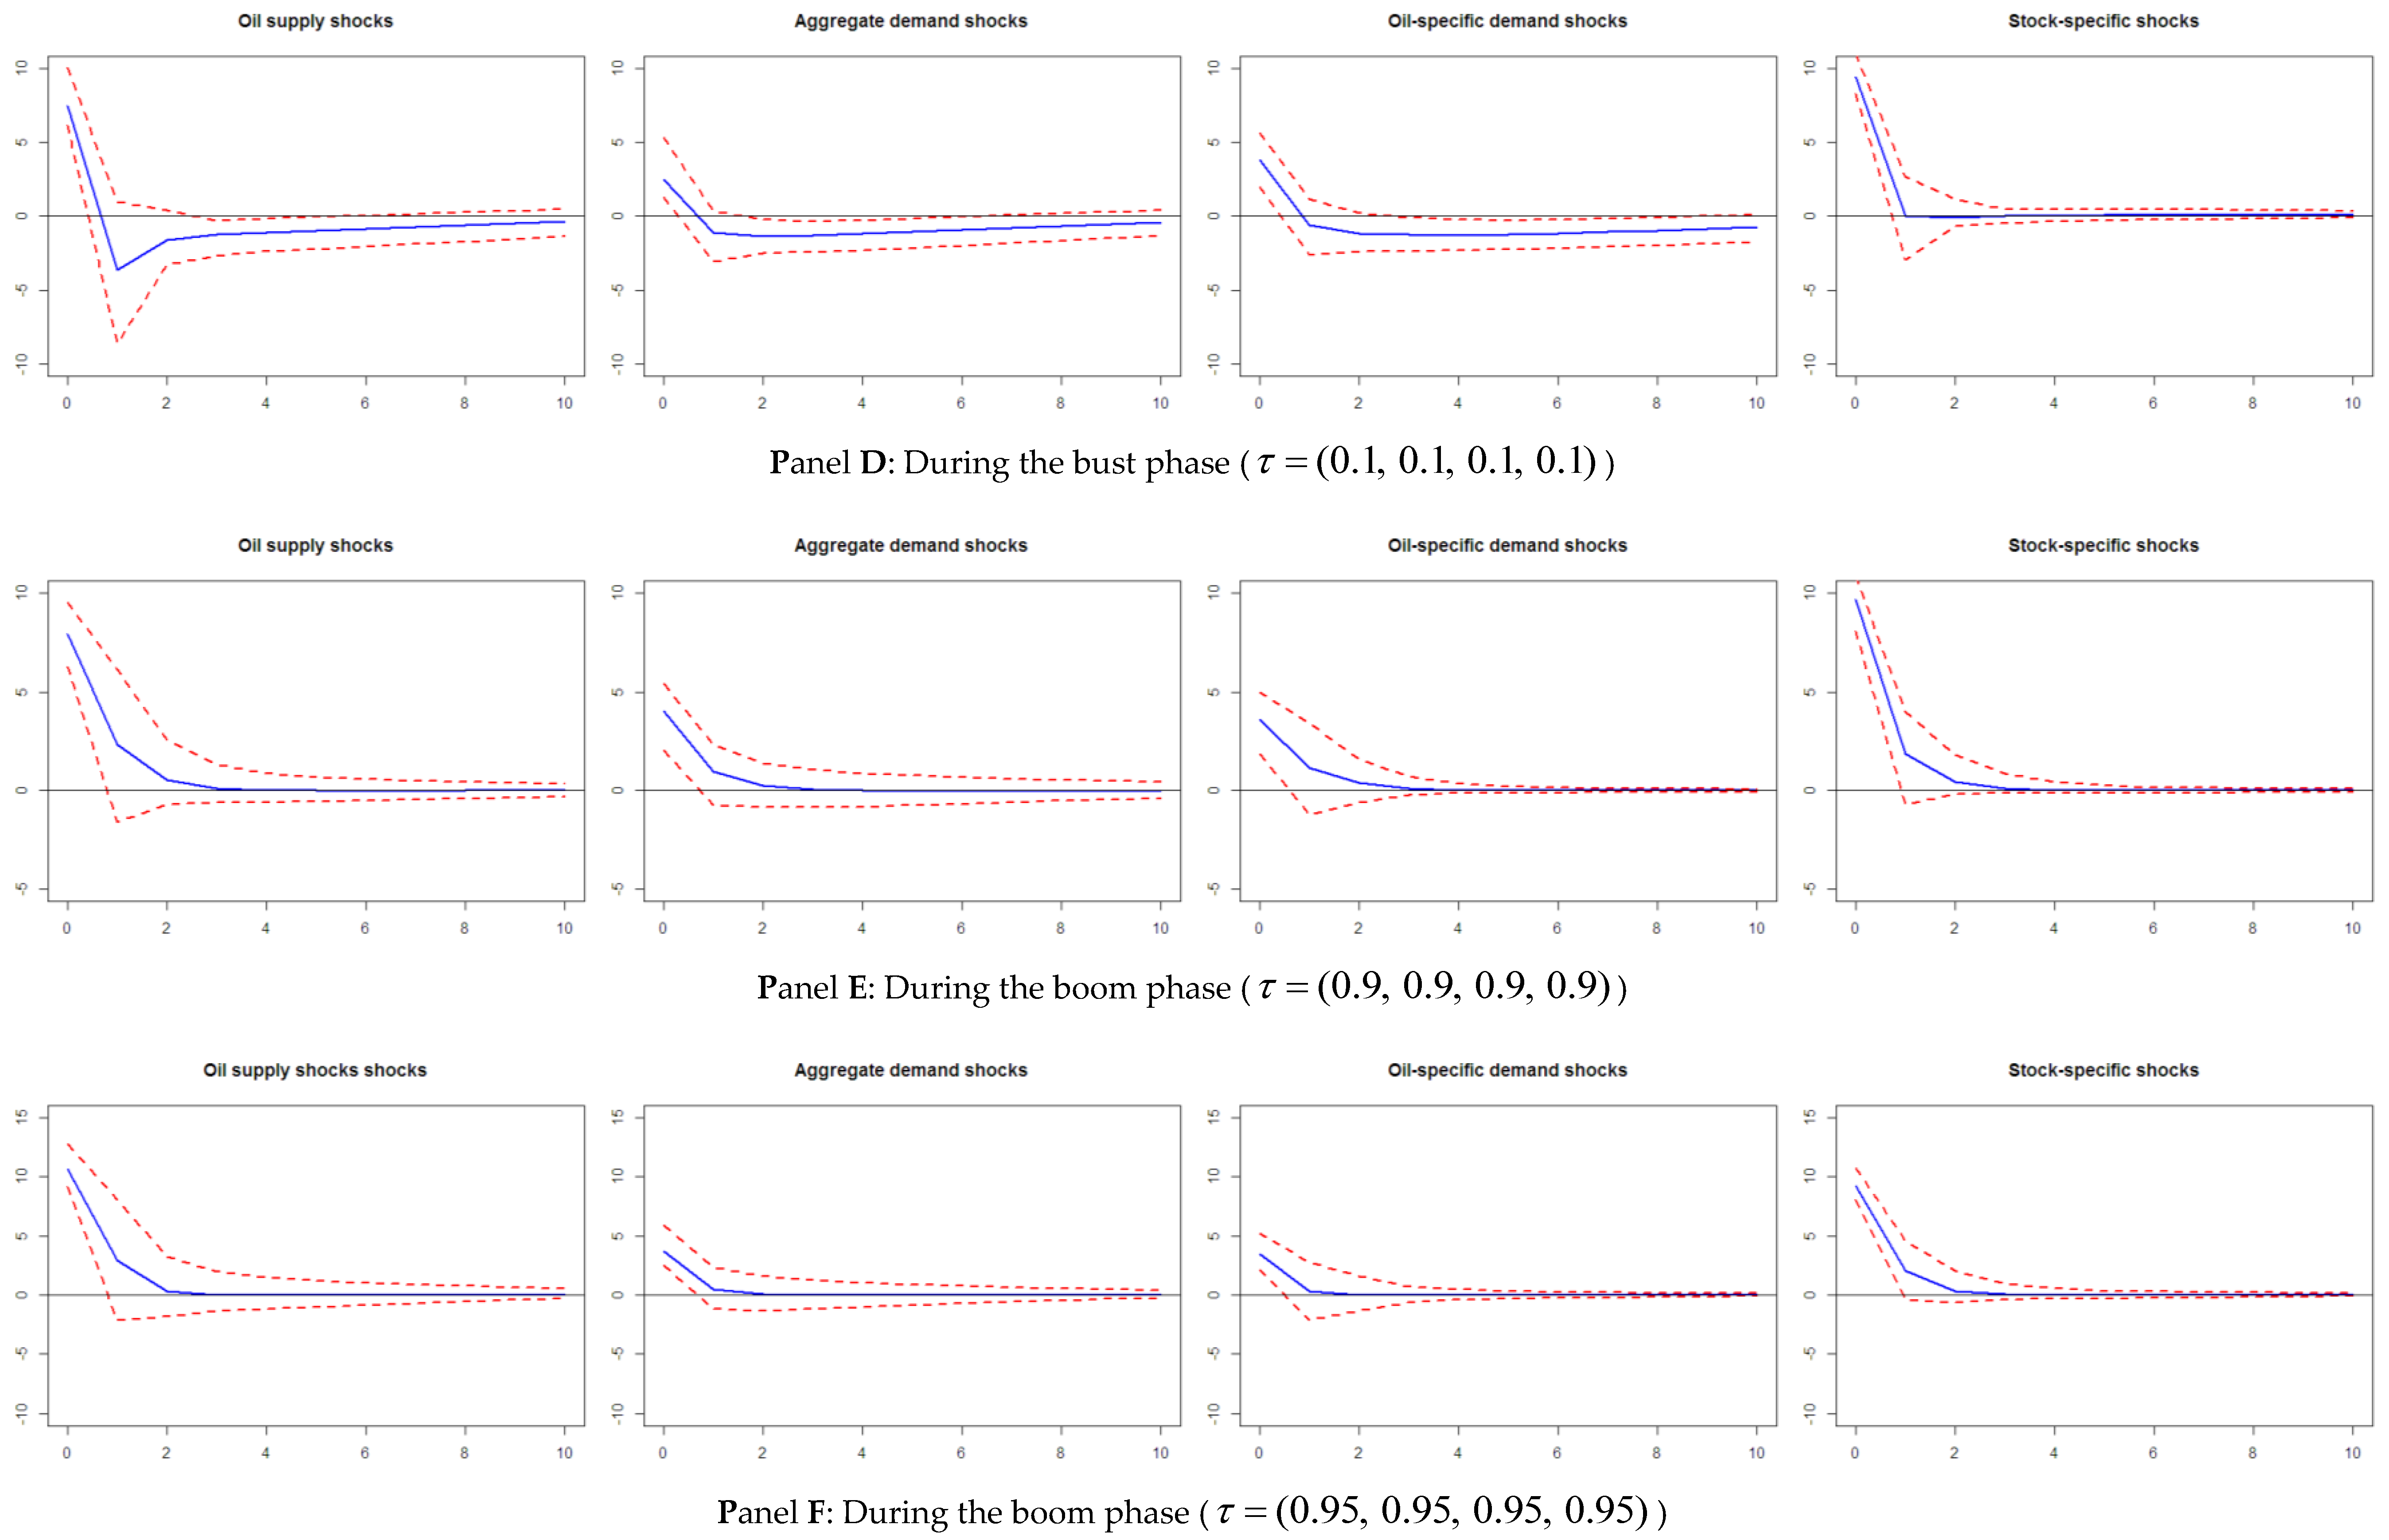
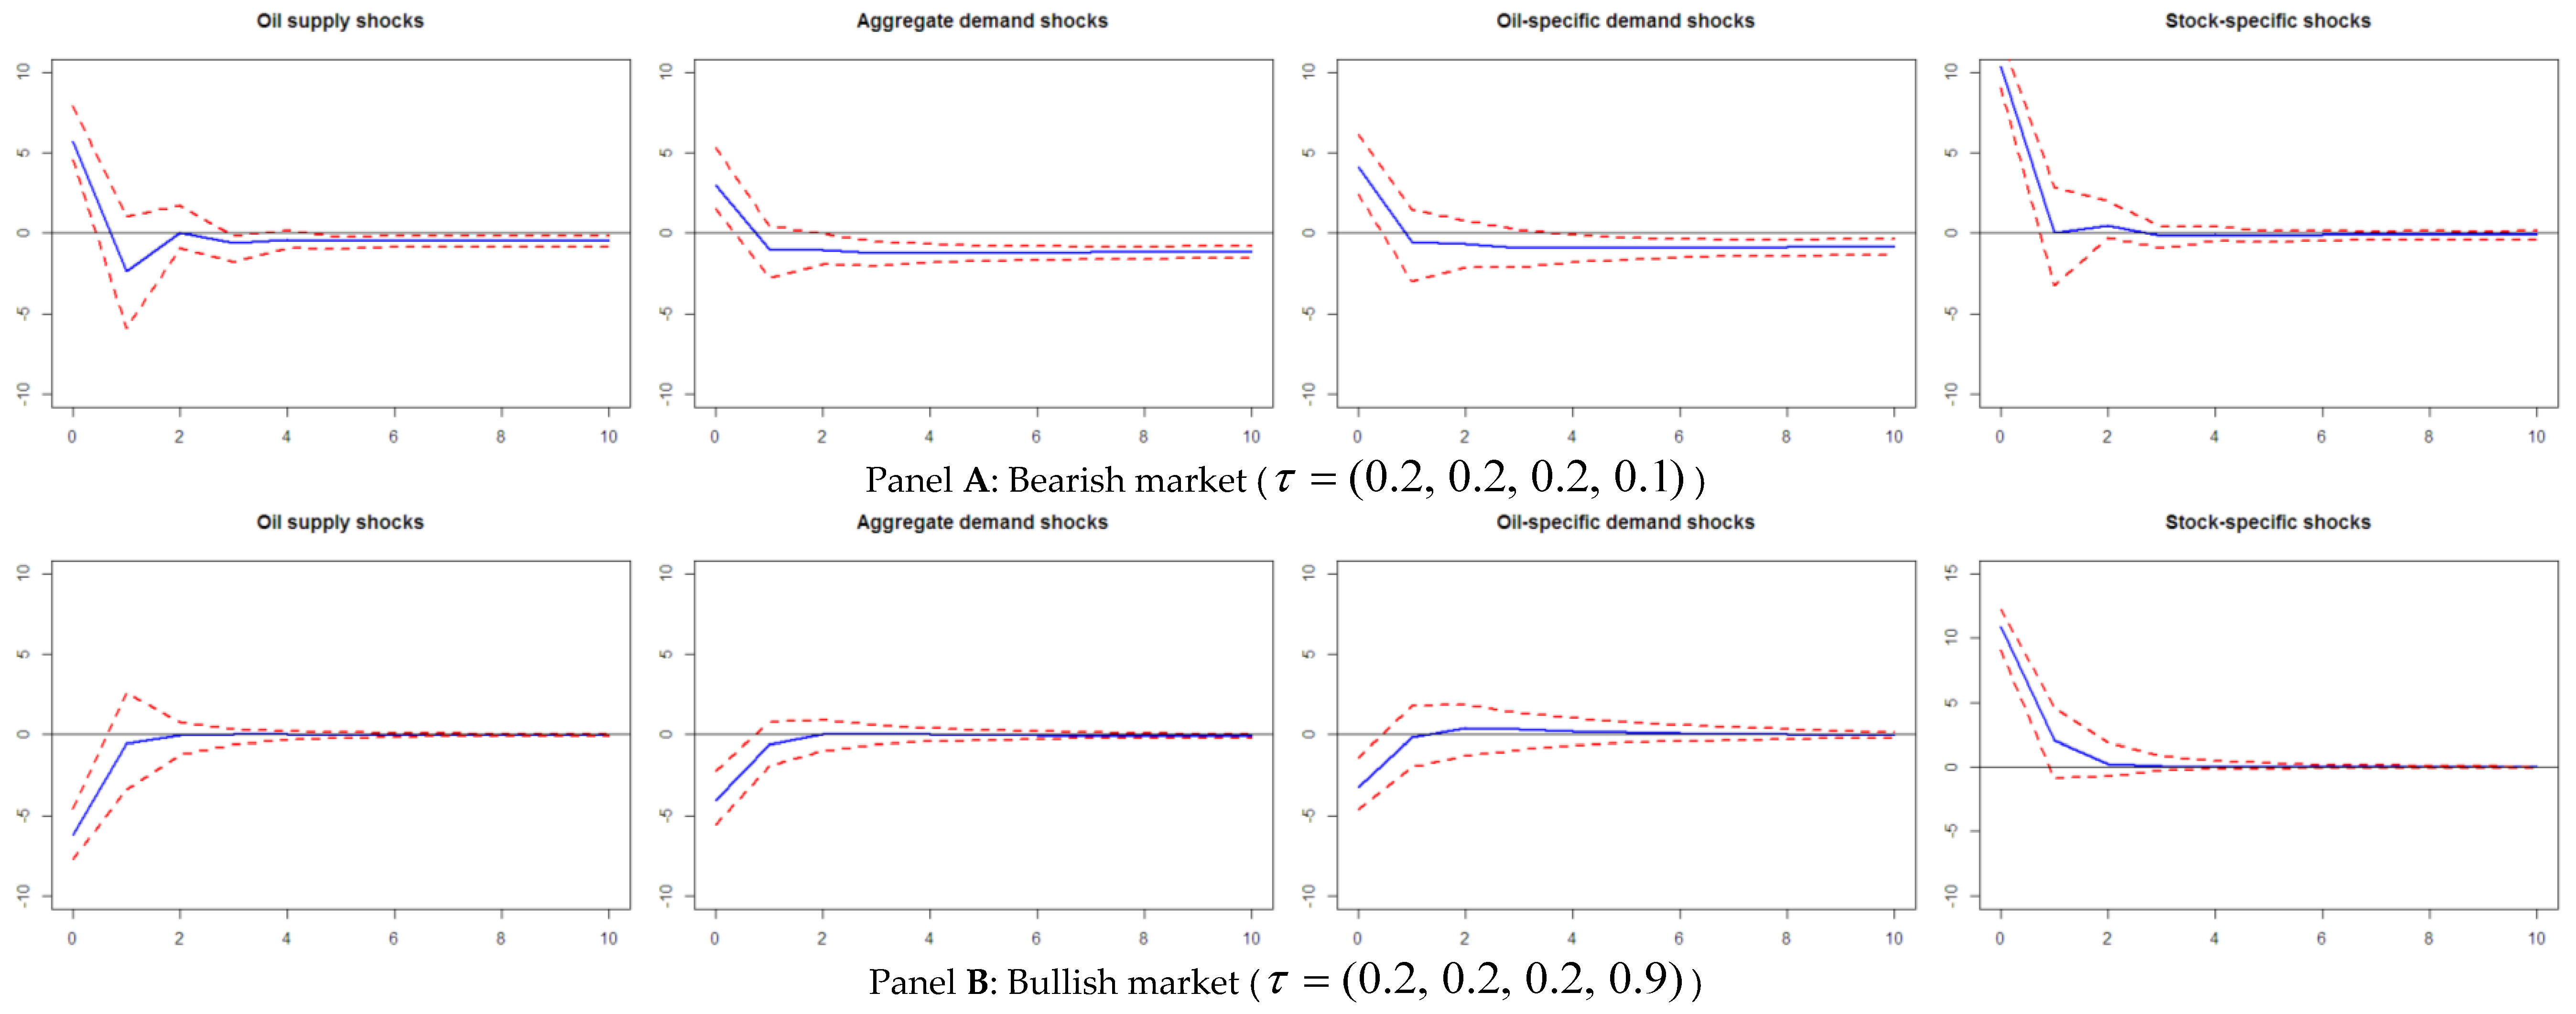
The empirical results show that the impacts of oil price shocks on Chinese stock market returns depends on whether the oil and stock market state is in bust or boom, as well as whether the shock is caused by supply or demand. During a bust phase, the oil supply and demand shock effects have a negative, statistically significant effect on Chinese stock market returns, which is in line with theoretical considerations. This can be explained by the fact that China is a net oil-importing country, so the increase in the oil price will raise the production costs of companies and then depress the stock market returns. However during a boom period, only the aggregate demand has positive statistically significant shock effects on Chinese stock market returns. This is easy to explain. On one hand, the growth in global economic activity simultaneously stimulates the increase in crude oil and stock prices. On the other hand, the special adjustment mechanism in Chinese oil prices may greatly weaken the negative effects. Moreover, when the oil market is in a bust period, while the stock market is a bullish market, the aggregate demand shock shows positive significant effects on Chinese stock market returns. This may be argued to constitute empirical evidence for the phenomenon of speculative bubbles, as unexpected changes to oil prices leads to positive growth in the stock market.
In addition, we find that the impact of oil price uncertainty on the Chinese stock market could vary across the stock return distribution. In a bearish market, the impact of oil price uncertainty is positive, while in a bullish market, the impact of oil price uncertainty is negative. This indicates that in different stock markets, investors have different responses to the uncertainty of shocks.
Our results suggest several important implications. First, they show that the impact of oil price shocks on the Chinese stock market is heterogeneous, providing us with a scientific basis in which to make clear the dynamics of stock prices and helps to have a better understanding of some counterintuitive stock market behavior appearing in China. Second, our results uncover some stock market risks related to oil price shocks and this can offer valuable advice to investors and decision makers. Investors should hold oil stocks to diversify their investment portfolio and pay close attention to the asymmetric effects of oil price shocks on the stock market in order to consider long and short positions in a bearish and bullish stock market. The decision makers, during different oil and stock market states, should adopt diverse strategies to hedge the risk of oil price shocks, thereby lessening upheaval in the financial markets caused by a significant oil price shocks.


