Article

Life Cycle Assessment and Life Cycle Cost Analysis of Magnesia Spinel Brick Production

1
Department of Environmental Engineering, Faculty of Engineering, Anadolu University, Eskişehir 26555, Turkey
2
Ceramic Research Center Inc., Eskişehir 26555, Turkey
3
Department of Materials Science and Engineering, Faculty of Engineering, Anadolu University, Eskişehir 26555, Turkey
4
Sörmaş Söğüt Refractory Materials Inc., Bilecik 11660, Turkey
*
Author to whom correspondence should be addressed.
Sustainability 2016, 8(7), 662; https://doi.org/10.3390/su8070662
Submission received: 13 April 2016 / Revised: 2 July 2016 / Accepted: 5 July 2016 / Published: 20 July 2016
(This article belongs to the Special Issue Sustainability and Materials)

Abstract

:
Sustainable use of natural resources in the production of construction materials has become a necessity both in Europe and Turkey. Construction products in Europe should have European Conformity (CE) and Environmental Product Declaration (EPD), an independently verified and registered document in line with the European standard EN 15804. An EPD certificate can be created by performing a Life Cycle Assessment (LCA) study. In this particular work, an LCA study was carried out for a refractory brick production for environmental assessment. In addition to the LCA, the Life Cycle Cost (LCC) analysis was also applied for economic assessment. Firstly, a cradle-to-gate LCA was performed for one ton of magnesia spinel refractory brick. The CML IA method included in the licensed SimaPro 8.0.1 software was chosen to calculate impact categories (namely, abiotic depletion, global warming potential, acidification potential, eutrophication potential, human toxicity, ecotoxicity, ozone depletion potential, and photochemical oxidation potential). The LCC analysis was performed by developing a cost model for internal and external cost categories within the software. The results were supported by a sensitivity analysis. According to the results, the production of raw materials and the firing process in the magnesia spinel brick production were found to have several negative effects on the environment and were costly.

1. Introduction

Refractories are indispensable in almost all ferrous and non-ferrous industries where high temperature furnace or kilns are being used. More than half of refractory products are preferred in the steel industry, followed by the cement and lime and ferrous and non-ferrous industries. The others are employed in the ceramic and glass industry, incineration, the chemical industry, and many more. Magnesia spinel bricks are generally used in the cement and steel industries. Worldwide, 8 million tons of refractories are produced on a yearly basis. Consequently, sustainable production of these products has become very important.
Various methods are employed by the refractory industry in the manufacture of bricks. The simplest procedure is to saw shapes from natural or artificially produced raw materials. Highly refractory materials are nowadays manufactured increasingly by fine crushing and wet mixing and afterwards the refractory materials are formed by means of extrusion, slip casting, or pressing (hydraulic or isostatic). The production process includes the stages of raw materials storage, raw materials preparation, shaping, drying, firing, and subsequent treatment. Refractory products are fired at temperatures between 1250 and 1850 °C. Magnesia spinel bricks are fired at 1760–1850 °C in tunnel kilns and the minimum specific energy requirement for 1 kg magnesite brick is 6000–9700 kJ/kg [1]. In addition to various gaseous emissions, emissions to water and soil result from refractory plants depending on the types of raw materials, fuels, and production processes, especially from drying and firing processes. Several studies have already been conducted on the recycling of refractory materials. Recycling of MgO refractories from electric arc furnaces was studied by Lule-Gonzalez et al. (2005), the recovery and recycling of scrap refractories was studied by Valoref (1998), and the steel industry and the recycling of refractories were investigated by Nakamura et al. (1999) [2,3,4].
Refractory production is covered by the Turkish Regulation on Monitoring of Greenhouse Gas (GHG), in force since 2014 [5]. In accordance with the regulation, refractory production facilities should monitor the GHG emissions arising from plants and form a GHG monitoring plan. On the other hand, sustainable use of natural resources in the production of construction materials has become a necessity in Europe and also in Turkey to comply with the requirements of the European market. The European Construction Products Directive (89/106/EEC) [6], which was adopted in 1989, includes building materials such as bricks, sanitaryware, wall, floor and porcelain tiles, technical ceramics, and refractory materials. As for the other construction materials, refractories used in Europe should have European Conformity (CE) and Environmental Product Declaration (EPD) certificates, as per the related Directive. EPD is a certificate that provides relevant, verified, quantitative, and comparable information about the environmental impact of materials. An EPD certificate can be granted by performing a Life Cycle Assessment (LCA) study, which is a technique to evaluate all environmental impacts associated with all the stages of an action or a product’s life.
LCA is a methodology for evaluating the environmental loads of processes and products during their whole life cycle. The assessment includes the entire life cycle of a product, process, or system, encompassing the extraction and processing of raw materials; manufacturing, transportation, and distribution; use, reuse, maintenance, recycling, and final disposal. LCA has become a widely used methodology because of its integrated way of treating the framework, impact assessment, and data quality [7].
Construction materials have become a hot topic in LCA research in recent decades. Glass, aluminum alloy, stone, and ceramic materials have been analyzed as typical construction materials by using the LCA [8,9,10,11] and Life Cycle Energy Analysis (LCEA) methods [12]. Besides, some LCA studies have been conducted for a number of ceramic products [13,14,15,16,17,18,19] and they have all reported the high energy consumption in the ceramic manufacturing stage (production process), especially during firing. Additionally, LCA has also been widely applied to assess the environmental impacts of the cement production process [20,21,22,23,24,25,26]. LCA and LCC methods are the most important tools approaching from the raw material of a product until the end use for all phases [27]. The LCC method used in this study is the economic equivalent of the LCA method. IEC 60300-3-3 Life Cycle Cost Implementation Guide has emerged as a standard of all applications with the general introduction of the LCC concept. According to the IEC 60300-3-3 standard, LCC analysis consists of four stages: research and development costs, construction costs, production costs, and disposal costs [28,29,30]. A systematic model for building construction material has been developed to optimize carbon dioxide emissions and environmental costs by addressing fossil fuels, electricity, and water consumption in the construction sector by Chou and Yeh (2015) [31]. Abdul-Wahab et al. (2015) have developed a new model for cost reduction efforts as well as reduction of the environmental impact of cement production [32].
However, there is a dearth of literature on LCA and LCC studies of refractory brick production. In this context, the aim of this study is make an environmental and economic assessment of refractory brick production processes by using these methods. For this aim, licensed SimaPro 8.0.1 software (Amersfoort, The Netherlands) was used to calculate different environmental impact categories. In addition, the internal and external costs of the magnesia spinel brick were obtained by LCC method. Finally, a sensitivity analysis was performed with ‘what-if’ scenarios to determine the changes on the LCA results.

2. Materials and Methods

2.1. Life Cycle Assessment

The LCA technique used in this study is based on the ISO 14040 and ISO 14044 guidelines and requirements, consisting of four steps; goal and scope definition, inventory analysis, impact assessment, and interpretation [33,34,35,36]. Data regarding the production process were obtained from the refractory plant, the relevant literature [37], and also from the software database. CML (Center of Environmental Science of Leiden University) IA method included in licensed SimaPro 8.0.1 software was used for the assessment from the perspectives of impact categories. The impact assessment method implemented as CML-IA methodology is defined for the midpoint approach [38]. LCC analysis was carried out to develop a new economic method for internal cost (i.e., energy, materials, and transport) and external cost (i.e., environmental) categories by using licensed SimaPro 8.0.1 software [39].

2.1.1. Goal and Scope Definition

The main goal of this study is to identify key issues associated with the life cycle of a magnesia spinel refractory brick. One ton of magnesia spinel refractory brick was chosen as the functional unit. The characteristics of magnesia spinel brick are summarized in Table 1. A cradle-to-gate LCA was performed and system boundaries are given in Figure 1. Infrastructure was excluded from the system boundary. Solid waste from production below 2.5% was neglected.

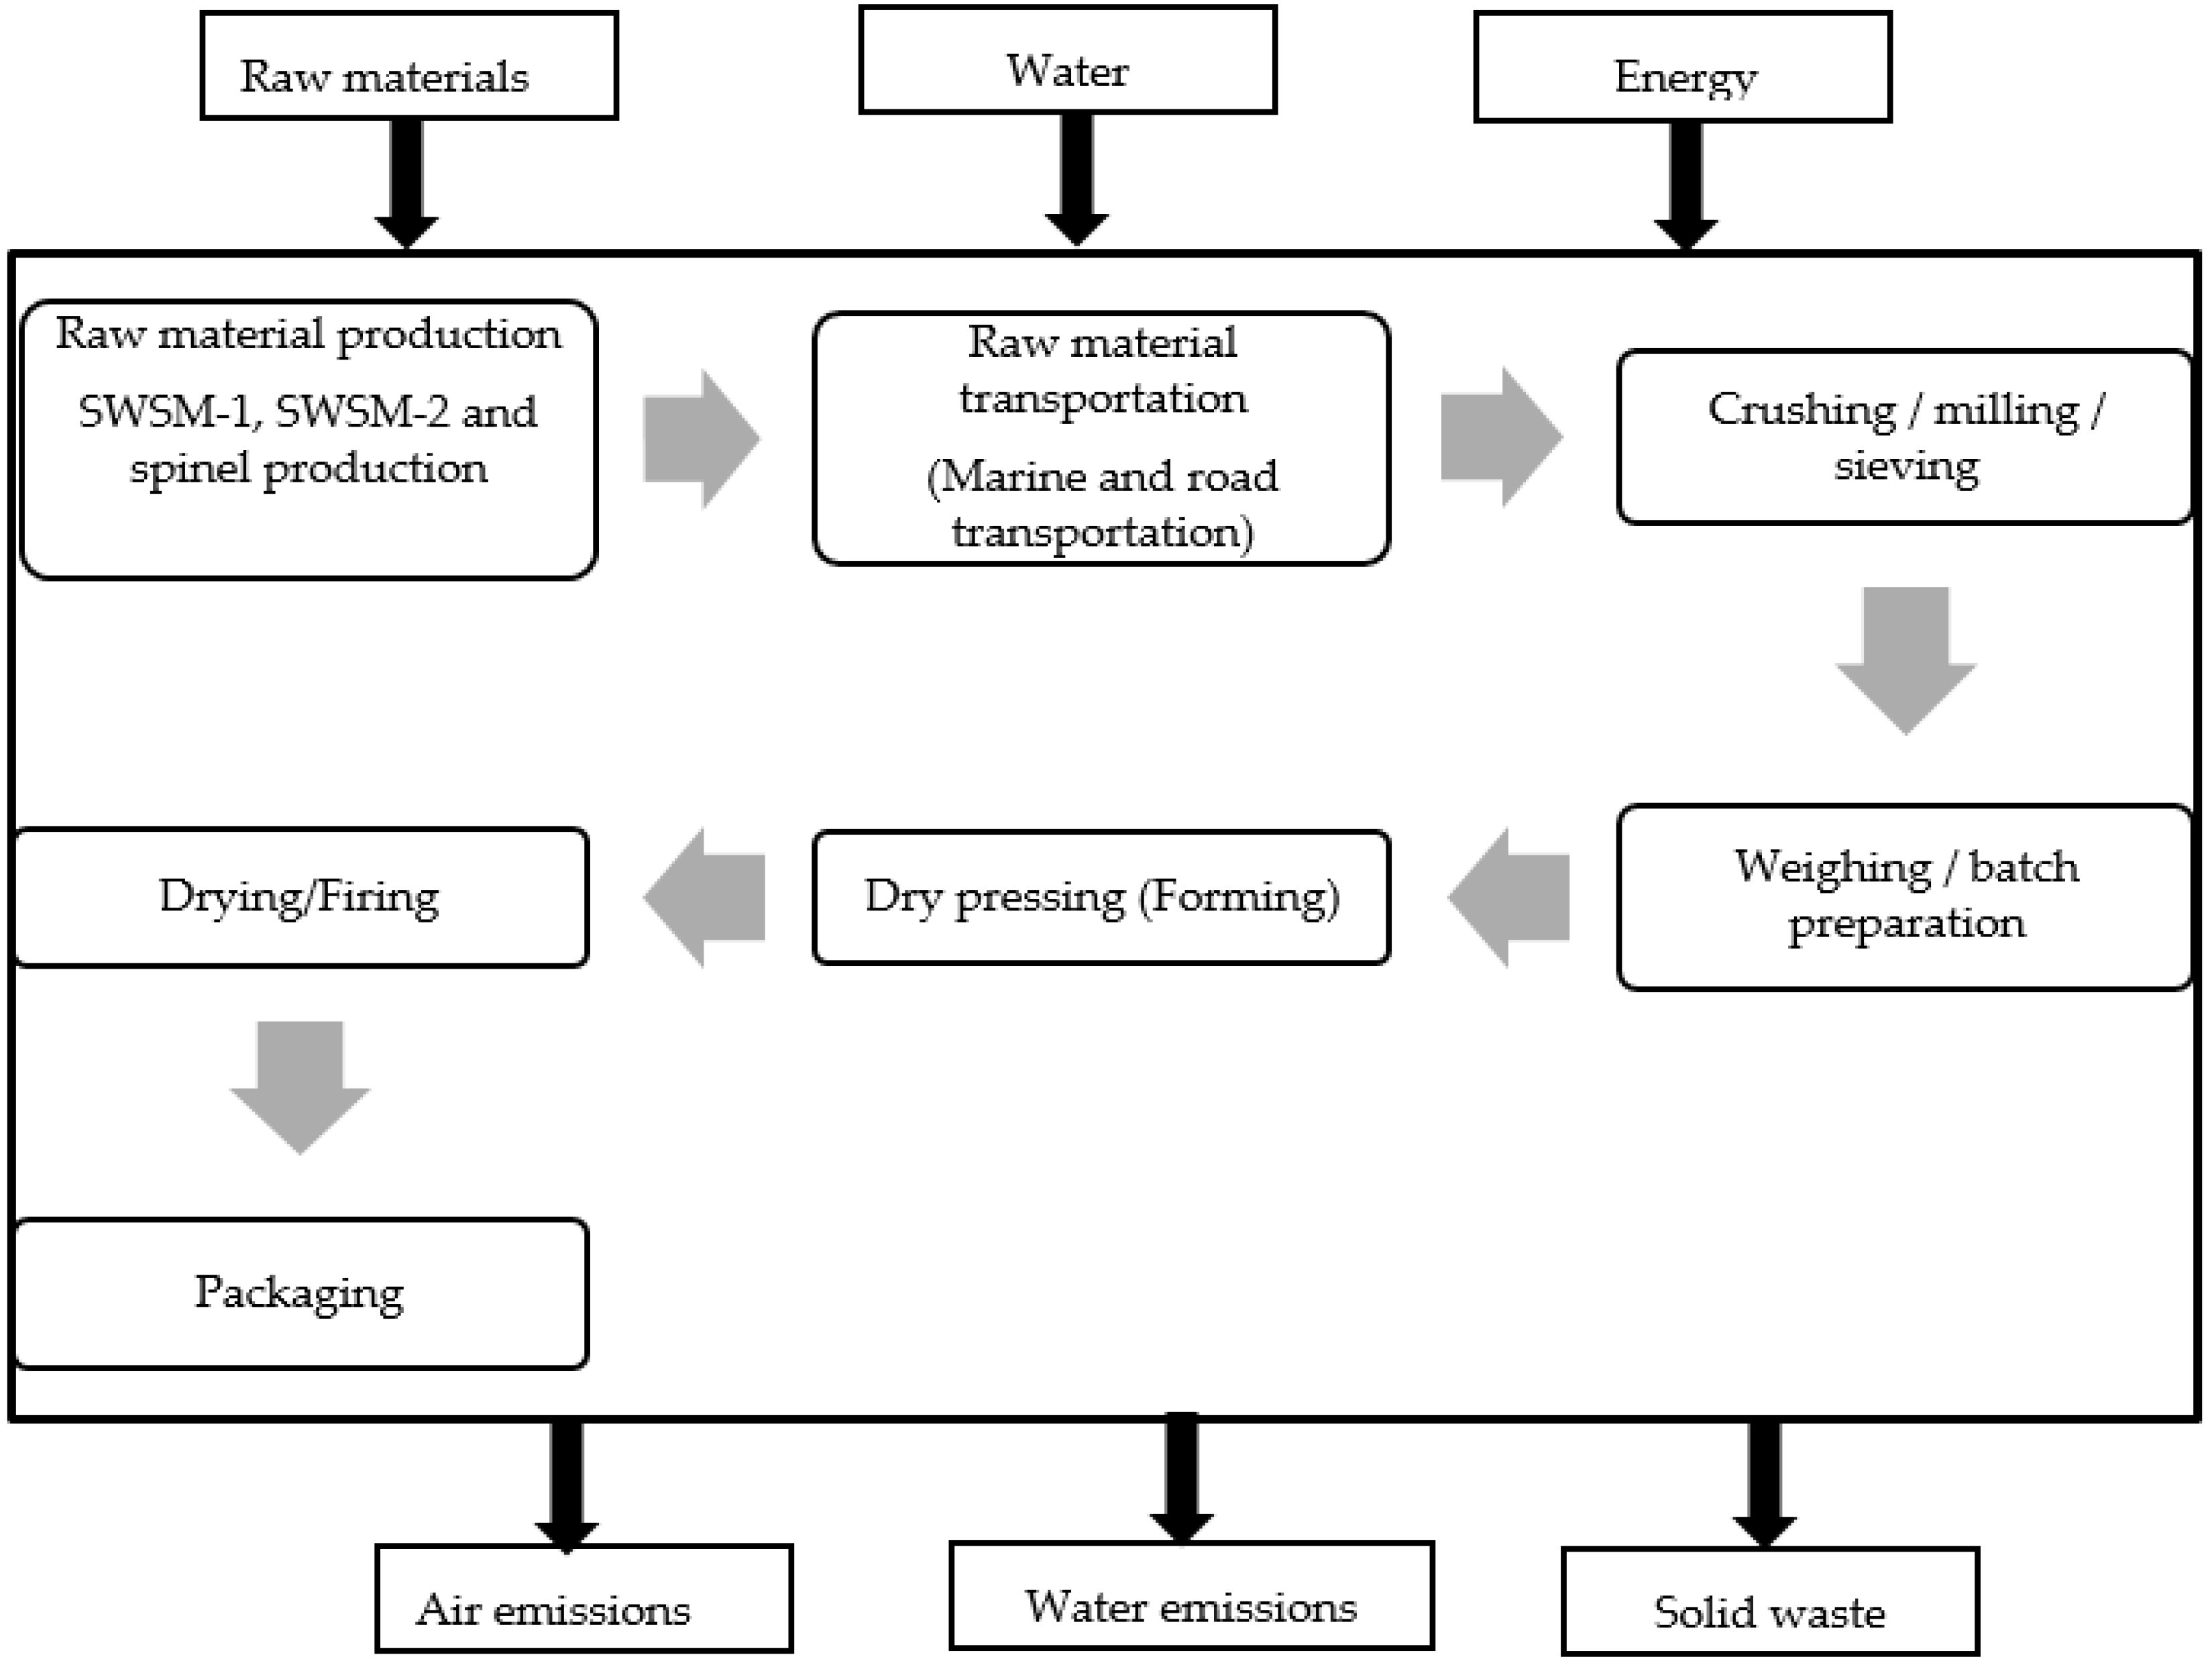
2.1.2. Life Cycle Inventory Analysis

Environmental impacts of one ton refractory brick are determined by data groups of stages of raw material production, energy consumption, atmospheric emissions, and waste generation. The data were taken from the brick production plant in Turkey, on-site measurements, and EcoInvent (v.3), included in SimaPro 8.0.1.

Raw Material Production

The raw material used for the production of refractory bricks was seawater-sintered magnesia (SWSM) (85%) and sintered spinel (15%). Half of the seawater-sintered magnesia used in refractory brick was provided from Mexico (SWSM-1); the other half is obtained from Netherlands (SWSM-2). The sintered spinel was provided from China. The raw materials were transported to the refractory brick plant by marine and road transportation.
In the SWSM process, magnesium hydroxide (Mg(OH)2) is precipitated from magnesium chloride (MgCl2) and dolomitic lime (including CaO and MgO). The precipitated Mg(OH)2 is thickened, washed, and dewatered using rotary vacuum filters. Then, a Mg(OH)2 filter cake is calcined in multiple-hearth furnaces at about 1000 °C to create caustic magnesia, a fine magnesium oxide powder. After calcination, the caustic magnesium oxide (MgO) is compacted into briquettes and densified by sintering in vertical shaft kilns at temperatures of over 1900 °C. Life cycle inventory data for one ton of SWSM (MgO) obtained from related plants and literature [37] are shown in Table 2.
Most refractory grade sintered spinels are made from a combination of high purity synthetic aluminum oxide (Al2O3) and chemical-grade MgO. In this production, MgCO3 is the starting material for MgO. Its solid state synthesis from magnesia and alumina occurs by interdiffusion (3Mg2+ ↔ 2Al3+) of cations through the product layer between the oxide particles, necessitating the use of high processing temperatures (>1400–1500 °C). Synthesis takes place either in a shaft kiln for sintered spinel. The advantage of sintered spinel is that this is a continuous ceramic process, with controlled feed-rate and uniform temperature distribution in the kiln, leading to a homogeneous product that contributes to the excellent high-temperature properties. Life cycle inventory data of sintered spinel production are given in Table 3.

Experimental

Raw materials were taken into silos in various fractions after the crushing/milling and sieving processes. Material and energy inventories of refractory brick production process can be seen in Table 4 according to the functional unit. Measurement of the gas emissions during firing was carried out by an accredited laboratory during the magnesia spinel refractory brick production process.
CO and CO2, NOx and SO2 were determined by electrochemical cell method according to TS ISO 12039, EPA CTM-022 and ISO 7935, respectively. Particulate matter was withdrawn isokinetically from the source and collected on a glass fiber filter and was determined gravimetrically after the removal of uncombined water (TS ISO 9096, TS EN 13284-1). Hydrogen fluoride and hydrogen chloride concentrations were determined with alkaline absorbing solutions in samples that are withdrawn isokinetically (EPA Method 26 A). Concentrations of volatile organic compounds (VOC) were obtained by activated carbon and solvent desorption method (TS EN 13649). For heavy metal analyses, a stack sample was withdrawn isokinetically from the source, particulate emissions were collected with a probe on a heated filter, and gaseous emissions were then collected in an aqueous acidic solution. Then, the recovered samples were digested and analyzed with ICP-OES (EPA Method 29). Formaldehyde concentration was determined according to acetyl acetone colorimetric method (EPA Method 323). The results are given for one ton of brick production in Table 5. The solid waste below 2.5 wt % was neglected.

2.1.3. Life Cycle Impact Assessment

Eight impact categories included by the CML-IA baseline (v.3) method were investigated: abiotic depletion (elements and fossil fuel) (kg Sb eq. and MJ), acidification (kg SO2 eq.), photochemical oxidation (kg C2H4 eq.), global warming potential (kg CO2 eq.), ozone layer depletion (kg CFC-11 eq.), eutrophication (kg PO43− eq.), human toxicity (kg 1,4-DB eq.), and ecotoxicity (fresh water, marine aquatic, and terrestrial) (kg 1,4-DB eq.). All the impact calculations were performed with the licensed LCA software SimaPro 8.0.1.

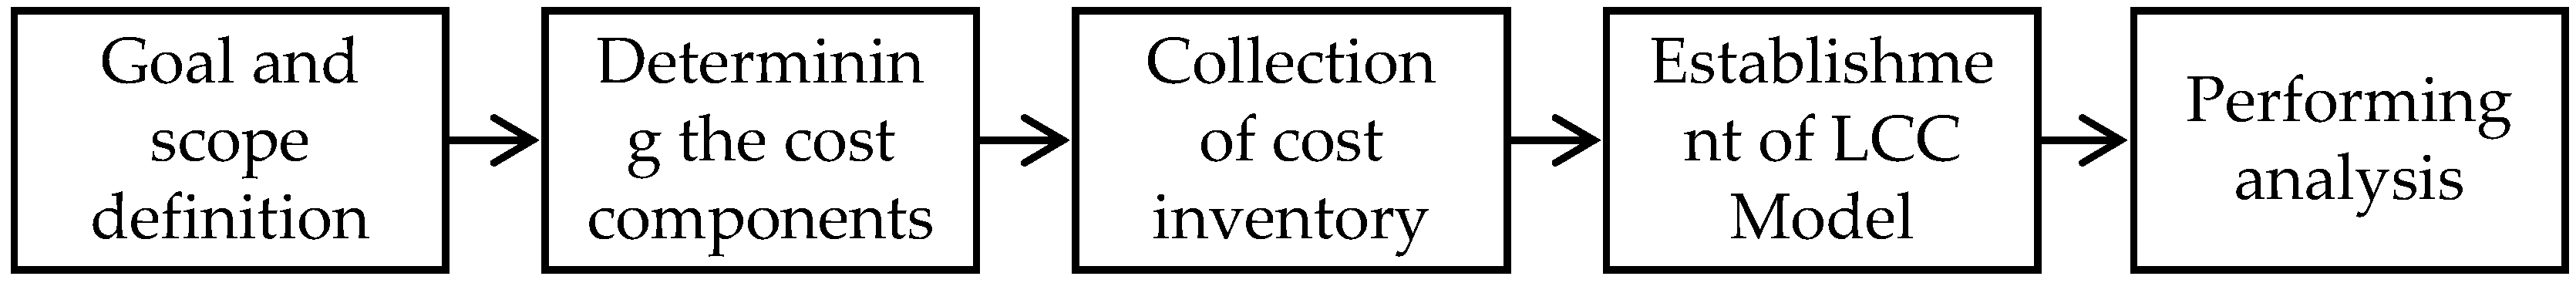
2.2. Life Cycle Cost (LCC) Analysis

In this part of the study, LCC analysis of the refractory bricks production process was carried out in five steps (Figure 2). The functional unit was selected as “one ton of magnesia spinel refractory brick” and the system boundaries were taken as LCA studies.
Cost components of the production of one ton of magnesia spinel refractory brick were examined in two parts: internal and external (Table 6).
Internal cost data regarding the refractory brick production were obtained from the plant and the relevant literature [30]. The results of the LCA study were used for environmental costs. Internal and external costs are given in Table 7 and Table 8. Unit costs for external costs were obtained from Banar and Özdemir (2015) [30].
The structure of the method consists of four components: general properties, characterization, damage assessment, and weighting. These general properties were the first component in the creation of a new economic method in the software. As a next step, characterization, the required cost types together with their unit cost ($/kg) were added under “impact category”. Damage assessment was the second component, which was defined in the top level cost category as “damage category”. In the easiest case, everything is in one currency and at one time; the factor will then be 1. Weighting was the final component on the method. A weighting factor has been entered as “1” for simple addition of all cost categories, which is often a useful approach. Normalization has not been taken into account since it is commonly not applied in LCC.

3. Results

3.1. LCA Results

According to the CML-IA method, total life cycle assessment results of one ton of magnesia spinel refractory brick are summarized in Table 9 and total characterization and normalization results are given in Supplementary Materials (Tables S1 and S2). According to the tables, marine aquatic ecotoxicity, acidification, and global warming potential are the main effects. The distributions of indicators based on the processes are given in the Supplementary Materials (Figure S1).
Element basis Abiotic Depletion Potential (ADPe) is related with consumption of elements and minerals. The effect of two different sea water magnesia to ADPe were almost the same (37%) and higher than the others. The effect of these stages are followed by crushing/milling/sieving (7.51%), forming (7.51%), and sintered spinel process (5.54%). Chromium (45.1%), uranium (39.9%), and nickel (10.3%) cause this effect because of raw material extraction.
Fossil fuels basis ADP (ADPff) impacts of SWSM-1 and SWSM-2 are 35% and 33%, respectively. Natural gas consumption is the dominant effect (61%) in the ADPff. It is followed by coal (21%) and crude oil consumption (18%).
Acidification potential (AP) mainly resulted from drying and firing process emissions with 84.1%. Impact percentages of SWSM-1, SWSM-2 and sintered spinel are low compared to the drying/firing process. On a pollutant parameter basis, it was determined that the SO2 and NOx contents of stack gas have the greatest effect on the acidification potential at 92.5% and 7.4%, respectively.
Eutrophication Potential (EP) mainly results due to emission of nitrogenous and phosphorous compounds. The SWSM-1 and SWSM-2 production are influenced by 32.5% and 32%, respectively. These productions are followed by the firing process of the refractory brick (20.5%), sintered spinel production, and other subprocesses in refractory brick production.
Global Warming Potential (GWP) is affected mainly by the firing process in the refractory brick production (68.6%). The effects of two different sea water magnesia on global warming potential are 13.5% and 13.2% for SWSM-1 and SWSM-2, respectively. It is determined that CO2 emissions released into the atmosphere during the calcination process in sintered magnesia production cause this impact.
Ozone Depletion Potential (ODP) is affected by seawater magnesia production by about 70%. Other subcategories that affect the ozone layer depletion are drying/firing process and sintered spinel production. Halogenated gases resulting from the drying and firing processes in refractory brick production and sintered magnesia production are the dominant causes this impact.
Photochemical Oxidation Potential (POP) is primarily influenced by the drying/firing processes during refractory brick production, by 87%, due to the emissions in the stack. It is followed by raw materials (SWSM-1, SWSM-2, and sintered spinel) production.
Human Toxicity Potential (HTP) is affected by the drying and firing processes in refractory brick production (93%) because of hydrogen fluoride and benzene emissions. Emissions into water have a significant effect on human toxicity, with prominent elements including selenium, vanadium, nickel, and barium.
Marine Aquatic Ecotoxicity Potential (MAETP) is affected by refractory brick production (98.8%) due to the effect of fluorinated gases. Emissions into water have a significant effect on MAETP, with prominent elements including vanadium, beryllium, nickel, cobalt, and selenium.
Fresh Water Aquatic Ecotoxicity Potential (FAETP) is caused by seawater magnesia production (97%). It is determined that fluorinated gas emissions cause FAETP; and prominent elements in water emissions are nickel, copper, beryllium, and arsenic.
Terrestrial Ecotoxicity Potential (TEP) is contributed by SWSM-1 (40.4%) and SWSM-2 (38.8%) production. This occurs during extraction of raw materials for magnesite production. In addition, chromium (VI), zinc, nickel, beryllium, and formaldehyde, released during electricity generation for forming and crushing/milling processes, etc., have a significant effect on terrestrial ecotoxicity.

3.2. LCC Results

The LCC results of one ton of magnesia spinel refractory brick and distribution of cost components are given in Table 10. According to the results, total cost is mainly shared by external and internal costs with percentages of 60% and 33%, respectively. When considering environmental costs, 83.9% represents refractory production, the most affected subcategory. This is followed by seawater magnesia production. In addition to this observation from Table 10, although SWSM-1 and SWSM-2 are supplied from two different plants from abroad, these plants have almost the same environmental costs ($492 and $483, respectively).
Considering the environmental costs of the production of one ton of magnesite spinel refractory brick based on impact categories, it is observed that the maximum cost among the categories is attributed to ozone layer depletion.

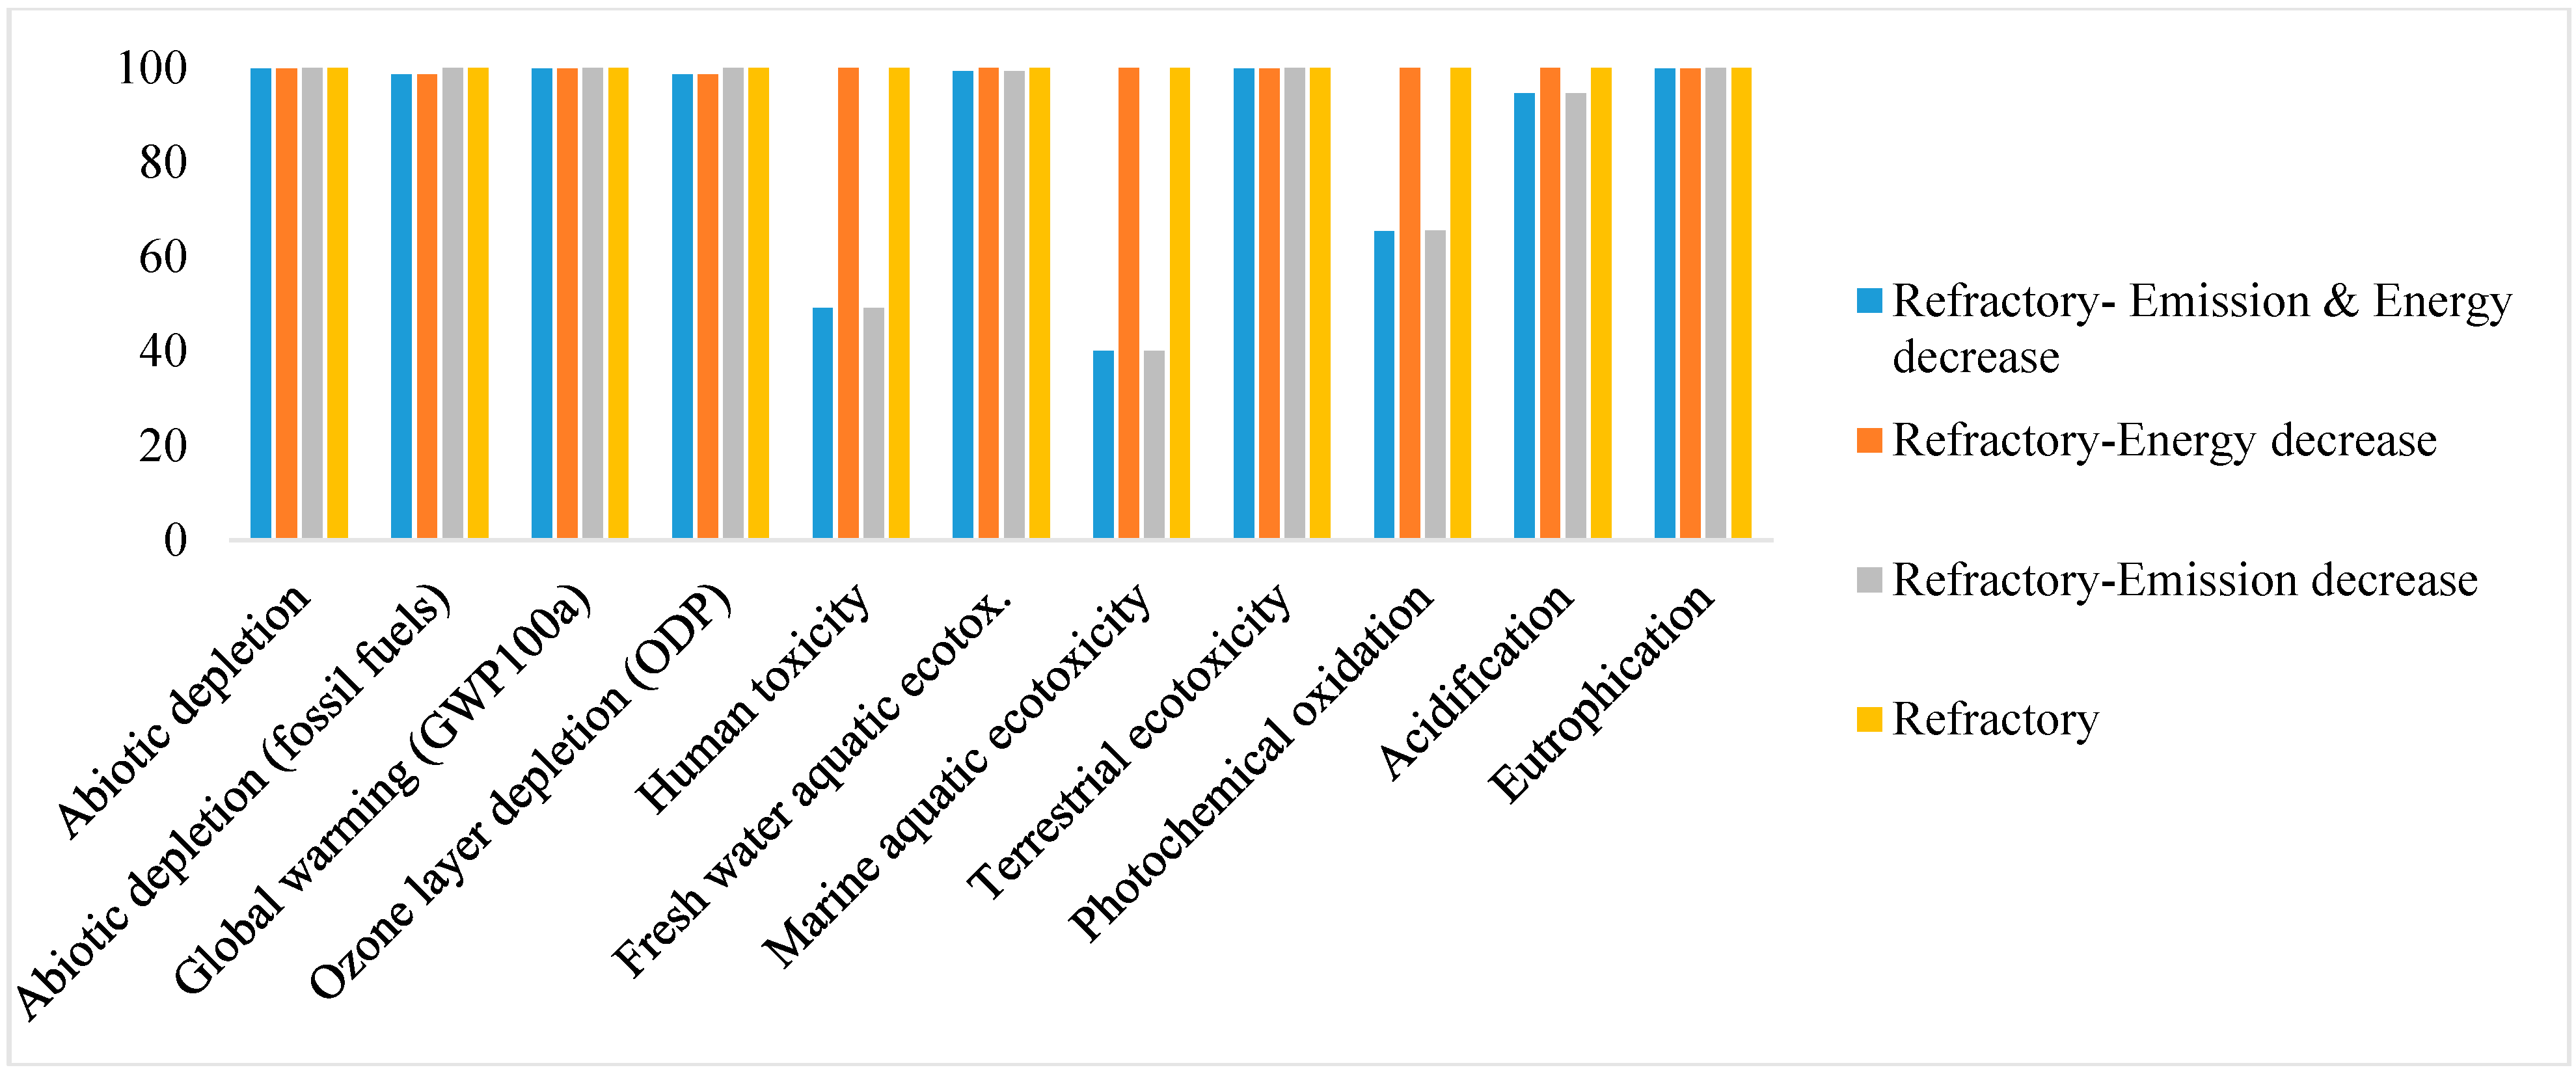
3.3. Sensitivity Analysis

Environmental performance of refractory brick production can be improved with the best available techniques. According to EIPPCB (European Integration Pollution Prevention Control Bureau) documents, the energy requirements for the drying/firing process of magnesite-containing refractories are given in Table 11.
According to Best Available Technologies Reference (BREF) documents, the energy requirement for the drying/firing process of magnesite = containing refractories is about 3–6.3 MJ/kg. When the energy consumption is reduced from the current system to 3 MJ/kg (decreased by 8.4%) in the firing process of refractory production, a refractory plant can reach the minimum energy value given in the EIPPCB document. Table 12 shows the minimum and maximum emission values of magnesite containing refractories in BREF documents.
For sensitivity analysis, energy consumption is reduced by 8.4% and emission values are decreased according to the BREF document. Sensitivity analyses were performed in two what-if scenarios: (i) energy reduction only; (ii) energy reduction and emissions decreasing. A graph is given in Figure 3. It shows that an 8.4% energy decrease s slightly lowers some environmental impact values. It is seen that human toxicity, marine aquatic ecotoxicity, photochemical oxidation formation, and acidification effects are decreased by a reduction in energy and emissions. As human toxicity is related to the HF component, reduction of this emission value decreases this impact category by 51%. Reduction of fluoride gas emissions decreases the marine aquatic ecotoxicity impact category by 60%. Change in the amount of SO2 affects some impact categories, especially acidification, and leads to a decrease in these impact categories by 5.4%. SO2 emissions from firing process of refractory brick production causes photochemical oxidation and reduction of this emission component provides an improvement of this impact category by 35%.

4. Discussion

The environmental impacts of the magnesia spinel refractory brick production process mainly resulted from the drying/firing process. The emissions of fluorinated gases SO2, NOx, and CO2 during the production process contributed to marine aquatic ecotoxicity, acidification, and potential global warming. The seawater-sintered magnesite production process is another important process due to raw material consumption, halogenated, phosphorus, and heavy metal emissions. Raw material consumption caused abiotic depletion while emissions are responsible for eutrophication, ozone layer depletion, and freshwater aquatic and terrestrial ecotoxicity. Stack gas released during the sintering process also has a negative effect on the environment due to its VOC and CO content. Taking these results into consideration, it can be suggested that air pollution control equipment should be improved in order to decrease the environmental impacts. An activated carbon unit will be able to remove the VOC constituent. The presence of CO indicates that the combustion process has an inappropriate air/fuel (A/F) ratio. Thus, further improvement is also required in A/F for CO and VOC removal.
LCA and LCC, when carried out in an integrated manner and from a systems perspective, have a high potential for moving industrial practice towards sustainable development. Furthermore, an LCC analysis integrated with LCA may contribute to more sustainable decision-making in refractory industries, taking into account long-term costs and environmental consequences. Environmental costs account for approximately 60% of the total cost of this process due to emissions.

5. Conclusions

This study shows that LCA and LCC are useful tools to determine the environmental and economic performance of refractory materials. In addition to this, the results can be used to prepare a Product Category Rule (PCR) since there is no certain PCR on magnesia spinel refractory brick production. A prepared PCR would increase the refractory products with EPD certificate on the construction area.
Finally, a comparable environmental database would be obtained to select the product with the highest environmental performance.

Supplementary Materials

The following are available online at www.mdpi.com/2071-1050/8/7/662/s1. Figure S1: Distribution of indicators based on processes, Table S1: LCA characterization results, Table S2: LCA normalization results.

Acknowledgments

This study was supported by TUBITAK (The Scientific and Technological Research Council of Turkey) under Grant No. 114Y525.

Author Contributions

Melike Metesoy observed the data, Levent Karacasulu and Gülden Tok analyzed the data with LCA and LCC, Alpagut Kara supervised refractory production process, and Zerrin Günkaya, Aysun Özkan, and Müfide Banar interpreted the LCA and LCC results. All authors have read and approved the final manuscript.

Conflicts of Interest

The authors declare no conflict of interest.

References

  1. EIPPCB (European Integration Pollution Prevention Control Bureau). Reference Document on Best Available Techniques in the Ceramic Manufacturing Industry; European Commission: Brussels, Belgium, 2007. [Google Scholar]
  2. Lule-Gonzalez, R.G.; Lopez-Acosta, F.; Rodriguez, R. Recycling MgO-C Refractory in the EAF of Mittal Steel Lazaro Cardenas. AIST Iron Steel Technol. 2006, 1, 76–84. [Google Scholar]
  3. Nakamura, Y.; Hirai, N.; Tsutsui, Y.; Uchinokura, K.; Tamura, S.I. Recycling of refractories in the steel industry. Indian Ceram. 1999, 19, 111–114. [Google Scholar]
  4. Valoref, A.O. Recovery and recycling of scrap refractories. World Ceram. Refract. 1998, 9, 13–16. [Google Scholar]
  5. Republic of Turkey Ministry of Environment and Urbanization. Turkish Regulation on Monitoring of Greenhouse Gas (GHG), No. 29003, 17 May 2014. Available online: http://www.mevzuat.gov.tr (accessed on 11 July 2016). (In Turkish)
  6. The Construction Products Directive (89/106/EEC). 1989. Available online: http://eurocodes.jrc.ec.europa.eu/doc/construction_products_directive.pdf (accessed on 11 July 2016).
  7. Khasreen, M.M.; Banfill, P.; Menzies, G.F. Life-Cycle Assessment and the Environmental Impact of Buildings: A Review. Sustainability 2009, 1, 674–701. [Google Scholar] [CrossRef]
  8. Almeida, M.I.; Dias, A.C.; Demertzi, M.; Arroja, L. Contribution to the development of product category rules for ceramic bricks. J. Clean. Prod. 2015, 92, 206–215. [Google Scholar] [CrossRef]
  9. Han, B.; Wang, R.; Yao, L.; Liu, H.; Wang, Z. Life cycle assessment of ceramic façade material and its comparative analysis with three other common façade materials. J. Clean. Prod. 2015, 99, 86–93. [Google Scholar] [CrossRef]
  10. Kim, K.H. A comparative life cycle assessment of a transparent composite façade system and a glass curtain wall system. Energy Build. 2011, 43, 3436–3445. [Google Scholar] [CrossRef]
  11. Souza, D.M.; Lafontaine, M.; Charron-Doucet, F.; Bengoa, X.; Chappert, B.; Duarte, F.; Lima, L. Comparative Life Cycle Assessment of ceramic versus concrete roof tiles in the Brazilian context. J. Clean. Prod. 2015, 89, 165–173. [Google Scholar] [CrossRef]
  12. Cabeza, L.F.; Rincon, L.; Vilarino, V.; Perez, G.; Castell, A. Life cycle assessment (LCA) and life cycle energy analysis (LCEA) of buildings and the building sector: A review. Renew. Sust. Energy Rev. 2014, 29, 394–416. [Google Scholar] [CrossRef]
  13. Almeida, M.; Dias, A.C.; Arroja, L. Environmental product declaration in Portuguese ceramic tile. In Proceedings of the SIM 2011 International Conference on Sustainable Intelligent Manufacturing, Leiria, Portugal, 29 June–1 July 2011.
  14. Bribian, I.Z.; Capilla, A.V.; Uson, A.A. Life cycle assessment of building materials: comparative analysis of energy and environmental impacts and evaluation of the eco-efficiency improvement potential. Build. Environ. 2011, 46, 1133–1140. [Google Scholar] [CrossRef]
  15. Banar, M.; Çokaygil, Z. Environmental Evaluation of Ceramic Floor Tiles through Life Cycle Analysis Method. In Proceedings of the Solid Waste Management Symposium in Turkey (TÜRKAY 2009), Istanbul, Turkey, 15–17 June 2009.
  16. Bovea, M.D.; Saura, U.; Ferrero, J.L.; Giner, J. Cradle to gate study of red clay for use in the ceramic industry. Intl. J. Life Cycle Assess. 2007, 12, 439–447. [Google Scholar] [CrossRef]
  17. Koroneos, C.; Dompros, A. Environmental assessment of brick production in Greece. Build. Environ. 2007, 42, 2114–2123. [Google Scholar] [CrossRef]
  18. Nicoletti, G.M.; Notarnicola, B.; Tassielli, G. Comparative Life Cycle Assessment of flooring materials: Ceramic versus marble tiles. J. Clean. Prod. 2002, 10, 283–296. [Google Scholar] [CrossRef]
  19. Rouwette, R. LCA of Brick Products: Life Cycle Assessment Report E Final Report after Critical Review; Think Brick Australia J/N 107884; Energetics: Melbourne, Australia, 2010. [Google Scholar]
  20. Boesch, M.E.; Hellweg, S. Identifying improvement potentials in cement production with life cycle assessment. Environ. Sci. Technol. 2010, 44, 9143–9149. [Google Scholar] [CrossRef] [PubMed]
  21. Chen, C.; Habert, G.; Bouzidi, Y.; Jullien, A. Environmental impact of cement production: Detail of the different processes and cement plant variability evaluation. J. Clean. Prod. 2010, 18, 478–485. [Google Scholar] [CrossRef]
  22. Feiz, R.; Ammenberg, J.; Baas, L.; Eklund, M.; Helgstrand, A.; Marshall, R. Improving the CO2 performance of cement, part II: Framework for assessing CO2 improvement measures in cement industry. J. Clean. Prod. 2015, 98, 282–291. [Google Scholar] [CrossRef]
  23. Güeraca, L.P.; Torres, N.; Juarez-Lopez, C.R. The co-processing of municipal waste in a cement kiln in Mexico. A life-cycle assessment approach. J. Clean. Prod. 2015, 107, 741–748. [Google Scholar] [CrossRef]
  24. Valderrama, C.; Granados, R.; Cortina, J.L.; Gasol, C.M.; Guillem, M.; Josa, A. Implementation of best available techniques in cement manufacturing: A lifecycle assessment study. J. Clean. Prod. 2012, 25, 60–67. [Google Scholar] [CrossRef]
  25. Huntzinger, D.N.; Eatmon, T.D. A life-cycle assessment of Portland cement manufacturing: Comparing the traditional process with alternative technologies. J. Clean. Prod. 2009, 17, 668–675. [Google Scholar] [CrossRef]
  26. Vares, S.; Hakkinen, T. LCA Tool for Cement Manufacturers for System Optimization and for Environmental Reporting; Koukkari, H., Nors, M., Eds.; Life Cycle Assessment of Products and Technologies: Espoo, Finland, 2009; pp. 122–133. [Google Scholar]
  27. Simoes, C.L.; Costa Pinto, L.M.; Bernardo, C.A. Environmental and economic assessment of a road safety product made with virgin and recycled HDPE: A comparative study. J. Environ. Manag. 2013, 114, 209–215. [Google Scholar] [CrossRef] [PubMed]
  28. Asiedu, Y.; Gu, P. Product life cycle cost analysis: State of the art review. Intl. J. Prod. Res. 1998, 36, 883–908. [Google Scholar] [CrossRef]
  29. Norris, G.A. Integrating Life Cycle Cost Analysis and LCA. Intl. J. LCA 2001, 6, 118–120. [Google Scholar]
  30. Banar, M.; Özdemir, A. An evaluation of railway passenger transport in Turkey using life cycle assessment and life cycle cost methods. Transp. Res. D 2015, 41, 88–105. [Google Scholar] [CrossRef]
  31. Chou, J.S.; Yeh, K.C. Life cycle carbon dioxide emissions simulation and environmental cost analysis for building construction. J. Clean. Prod. 2015, 101, 137–147. [Google Scholar] [CrossRef]
  32. Abdul-Wahab, S.A.; Al-Rawas, G.A.; Ali, S.; Al-Dhamri, H. Impact of the addition of oil-based mud on carbon dioxide emissions in a cement plant. J. Clean. Prod. 2015, 112, 4214–4225. [Google Scholar] [CrossRef]
  33. Curran, M.A. Life Cycle Assessment Handbook: A Guide for Environmentally Sustainable Products; Wiley: Hoboken, NJ, USA, 2012. [Google Scholar]
  34. Baumann, H.; Tillman, A. The Hitch Hiker’s Guide to LCA: An Orientation in Life Cycle Assessment Methodology and Applications; Studentlitteratur AB: Lund, Sweden, 2004. [Google Scholar]
  35. International Organization for Standardization. Environmental Management—Life Cycle Assessment—Principles and Framework; International Standard ISO 14040:2006; International Organization for Standardization: Geneva, Switzerland, 2006. [Google Scholar]
  36. International Organization for Standardization. Environmental Management—Life Cycle Assessment—Requirements and Guidelines; International Standard ISO 14044:2006; International Organization for Standardization: Geneva, Switzerland, 2006. [Google Scholar]
  37. EIPPCB. Reference Document on Best Available Techniques in Large Volume Inorganic Chemicals—Solids and the Others Industry; European Commission: Brussels, Belgium, 2007. [Google Scholar]
  38. Guinée, J.B.; Gorrée, M.; Heijungs, R.; Huppes, G.; Kleijn, R.; de Koning, A.; van Oers, L.; Wegener Sleeswijk, A.; Suh, S.; Udo de Haes, H.A.; et al. Handbook on Life cycle Assessment. Operational Guide to the ISO Standards. Part III: Scientific Background; Kluwer Academic Publishers: Dordrecht, The Netherlands, 2002; p. 692. [Google Scholar]
  39. Tok, G. Evaluation of Refractory Brick Production through Life Cycle Assessment and Life Cycle Cost Methods. Master’s Thesis, Anadolu University, Eskisehir, Turkey, 2015. [Google Scholar]
  40. BOTAS. Available online: http://www.botas.gov.tr (accessed on 1 June 2015). (In Turkish)
  41. TEDAS. Available online: http://www.tedas.gov.tr (accessed on 1 June 2015). (In Turkish)
Figure 1. System boundaries (SWSM: seawater sintered spinel).
Sustainability 08 00662 g001
Figure 2. LCC methodology.
Sustainability 08 00662 g002
Figure 3. Sensitivity analysis results.
Sustainability 08 00662 g003
Table 1. Characteristics of the magnesia spinel refractory brick.
Control PropertiesValues
Bulk density (g/cm3)2.95
Apparent porosity (%)16
Cold crushing strength (N/mm2)75
Chemical analysis (wt %)
MgO89.0
Al2O39.0
SiO20.3
CaO0.8
Fe2O30.5
Design properties
Refractoriness under load, °C>1750
Thermal expansion (1000 °C, %)1.5
Table 2. Life cycle inventory data of SWSM.
Natural ResourcesUnitAmountEmissionsUnitAmount
MgCl2kg1200SO2kg7–0.6
Waterm320CO2kg570
Materials and energy NOxkg2.32–3.25
Natural gasGJ11.04COkg3.35–9
MgOkg502Particulate matterkg1.32–0.3
CaOkg698Bg50
ElectricitykWh72.22Crg1.28
Marine transportationt·km6993–14,297Zng0.64
Road transportt·km144Mgkg6.6
Water emissions Cakg422.2
Mg+2kg6.6Kkg10.8
Ca+2kg422Nakg44.2
K+kg10.8Clkg839.8
Na+kg44.2
Clkg840
B+3g50
Crg1.28
Zng0.64
Table 3. Life cycle inventory data of one ton of sintered spinel.
Natural ResourcesUnitAmount
MgCO3kg688
Materials and energy
Heavy fuel oilGJ3.52
Al2O3kg653
ElectricitykWh72.22
Marine transportationt·km17,946
Land transportt·km141.552
Emissions
SO2g165.4
COg232.3
NOxkg1.81
CO2kg619
PM < 10g70.4
PM < 2.5g70.4
Non methanogenic volatile organic matter (NMVOC)g88
Table 4. Material and energy inventories of the production of one ton of refractory brick.
Materials and EnergyUnitAmount
SWSM-1kg425
SWSM-2kg425
Sintered spinelkg150
Waterm325
Electricity
Crushing/milling and sievingkWh100
Weighing/batch preparationkWh40
Dry pressingkWh100
Natural gaskcal782,025
Packaging (carton, plastic)kg3.5
Table 5. Gas emissions during production of one ton of refractory brick.
EmissionAmount (g)EmissionAmount (g)
CO3237O-xylene0.954
CO2425.785Isopropyl benzene0.083
SO22465n-propyl benzene0.215
NOx183Trimethyl benzene0.895
Particulate matter30.2Butylbenzenes0.936
Hydrogen fluoride38.254-Isopropyltoluen0.264
Hydrogen chloride23.44Naphthalene0.123
4-chlorotoluene0.921Formaldehyde1.99
2-chlorotoluene0.914Arsenic0.0729
1,1,2,2-tetrachloroethane20.370Chromium0.1102
Benzene5.149Cadmium0.0044
Toluene7.916Copper0.1248
p+m xylene1.504Manganese0.0189
Ethylbenzene1.496Nickel0.0038
Styrene0.698Lead0.0970
Titanium0.2011
Table 6. Classification of life cycle cost components.
LCC CostLCC ComponentLCC Subcomponent
InternalRaw materialsRaw materials and transportation cost
ProductionEnergy cost
Labor cost
Maintenance cost
Packaging cost
ExternalPollutant costsEutrophication
Acidification
Photochemical oxidation
Ozone layer depletion
Global warming
Toxicity (Human toxicity, ecotoxicity)
Table 7. Internal cost inventory for one ton of magnesia spinel refractory brick.
Cost ItemsUnitAmountUnit CostCost ($)Source
Natural gasm3750.32 $/m324[40]
Crushing-Milling-SievingkWh1000.095 $/kWh9.50[41]
FormingkWh1000.095 $/kWh9.50[41]
Weighing-Batch PreparationkWh400.095 $/kWh3.80[41]
Labor$62.741 $/$62.74The plant
Maintenancekg10000.03 $/kg30The plant
Packagingkg11.33.2 $/kg36.16The plant
Table 8. External costs.
Environmental IndicatorsAmountUnit Cost ($/kg)Cost ($)
Acidification (kg SO2 eq.)38.629.2355.304
Photochemical oxidation (kg C2H4 eq.)2.812.46.744
Ozone layer depletion (kg CFC-11 eq.)1.2371.3445.56
Global warming (kg CO2 eq.)386.720.13752.98
Eutrophication (kg PO43− eq.)0.6764.372.95
Toxicity (kg 1,4 DB eq.)
Benzene0.070.084365.91 × 10−3
Formaldehyde1.90 × 10−90.24424.64 × 10−10
Arsenic7.57 × 10−5387.41.85 × 10−5
Cadmium1.24 × 10−431.93.96 × 10−3
Lead3.20 × 10−41061.500.3397
Mercury0.053100153.053
Nickel2.2 × 10−34.189.196 × 10−3
Table 9. Total LCA characterization results.
Impact CategoryUnitTotal
Abiotic depletion (element)kg Sb eq.1.42 × 10−5
Abiotic dep. (fossil fuels)MJ2.42 × 104
Global warming (GWP100a)kg CO2 eq.8.35 × 103
Ozone layer depletion (ODP)kg CFC-11 eq.1.88 × 10−4
Human toxicitykg 1,4-DB eq.1.68 × 103
Fresh water aquatic ecotoxicitykg 1,4-DB eq.2.11 × 102
Marine aquatic ecotoxicitykg 1,4-DB eq.2.03 × 107
Terrestrial ecotoxicitykg 1,4-DB eq.1.87 × 100
Photochem. oxidation formkg C2H4 eq.3.25 × 100
Acidificationkg SO2 eq.4.70 × 101
Eutrophicationkg PO43− eq.1.61 × 100
Table 10. LCC results of one ton of magnesite-spinel refractory brick.
Cost CategoriesRaw Material ProductionRefractory Brick ProductionTotal Costs
SWSM-1SWSM-2Sinter Spinel
Internal costs ($)Raw material and transportation298 (60.6%)298 (61.7%)155 (74.9%)-751 (33.0%)
Energy---47 (4.3%)47 (2.1%)
Labor---63 (5.8%)63 (2.8%)
Packaging---36 (3.3%)36 (1.6%)
Maintenance---30 (2.7%)30 (1.3%)
External costs ($)Environmental costs194 (39.4%)185 (38.3%)52 (25.1%)917 (83.9%)1348 (59.3%)
Total Cost ($)492 (100%)483 (100%)207 (100%)1093 (100%)2275 (100%)
52%48%
Table 11. Energy consumption for the manufacture of magnesia refractory bricks [1].
ProcessEnergy Requirement (MJ/kg)
Crushing/Milling/Sieving0.35–0.50
Weighing/Batch Preparation0.045–0.070
Forming0.13–0.20
Drying, Firing3.0–6.3
Packaging0.08
Table 12. Raw gas values of different refractory products (EIPPCB, 2007a).
EmissionConcentration (mg/m3)
ProductMagnesiteHigh AluminaSilica
Dust8–355–8010–25
NO2110–47030–2505–100
SO290–58010–43020–150
CO12–18030–15010–50
HF0.5–1.55–501–3

