Article

Multicriteria Decision Analysis to Develop Effective Sustainable Development Strategies for Enhancing Competitive Advantages: Case of the TFT-LCD Industry in Taiwan

1
Department of Business Management, National Sun Yat-sen University, 70, Lien-Hai Rd., Kaohsiung City 80424, Taiwan
2
Institute of Management of Technology, National Chiao Tung University, Hsinchu 30010, Taiwan
3
Graduate Institute of Urban Planning, College of Public Affairs, National Taipei University, 151, University Rd., San Shia District, New Taipei City 23741, Taiwan
4
Zhongshan Institute, University of Electronic Science and Technology of China, Zhongshan 528402, China
*
Author to whom correspondence should be addressed.
Sustainability 2016, 8(7), 646; https://doi.org/10.3390/su8070646
Submission received: 13 March 2016 / Revised: 20 June 2016 / Accepted: 24 June 2016 / Published: 9 July 2016
(This article belongs to the Special Issue How Better Decision-Making Helps to Improve Sustainability - Part II)

Abstract

:
In the Internet of Things era, panel displays play a major role in human life, because humans frequently use liquid crystal displays to monitor their electrical devices. The display industry creates remarkable economic output, but every manufacturing process inevitably has some undesirable effects on the environment. With the increasing awareness of environmental protection, balanced development is necessary to address the emerging market trends. However, short-sighted manufacturing corporations that focus solely on financial performance can achieve only short-term profits. The purpose of this study was to develop the most effective sustainable improvement strategies that can enhance competitive advantages in real-world situations. The proposed method combines the balanced scorecard and a new hybrid modified multiple attribute decision-making model which together adopt the DEMATEL technique to construct the influential network relation map and develop the DEMATEL-based ANP with the VIKOR method to deliver strategies that integrate environmental sustainability and competitive advantage. Finally, a real-world case study applying the proposed method to the cases of liquid crystal display manufacturers was conducted. Then, this paper discusses the effective use of natural resources, development of enterprises, and sustainable competitive advantage in this context. Various manufacturers, communities, and stakeholders can benefit from the coopetition solutions explained by the proposed method.

1. Introduction

In the Internet of Things era, human life is intimately interconnected with digital technologies, such as thin-film transistor liquid-crystal displays (TFT-LCDs). Consumers rely on display panels to monitor their electrical devices, and growing demand has motivated the development of the TFT-LCD industry in the world. Although TFT-LCD manufacturing processes yield highly desirable products, such processes create undesirable byproducts in addition to producing pollution that can endanger the environment. Alarmed by climate change and roused to action by environmental education efforts, communities are calling for environmental protection. The common consensus is that a balance must be established among the environment, society, and governance (ESG) [1]. This environmental consciousness guides consumers’ opinions when they make purchasing decisions. Numerous advanced countries have started to redefine economic development and growth from a different perspective. However, almost all electronic products still rely on display panels for monitoring and/or control, which are manufactured by TFT-LCD factories. Even though a particular industry might produce notable quantities of pollution, that industry can commit to a constant process of improvement to become sustainable. Hence, manufacturers can embed concepts of clean production, also called green production, in their governance plans for sustainable improvement to achieve an aura of eco-friendliness in response to corporate social responsibility (CSR). Furthermore, balanced development satisfies customers’ needs while protecting the environment; this market trend will continue to be necessary in the future [2,3,4]. Therefore, the aim of this study was to develop the most effective sustainable improvement strategies for enhancing competitive advantages in real-world situations.
Before environmental awareness became widespread, the business term “competitive advantage” often referred to the pursuit of business goals, which usually meant profitability as a means to pay returns to investors and stakeholders. Stakeholders in different periods have sought different types of competitive advantage; the concept has evolved from the simple pursuit of economic growth to the maximization of ethical business. Financial performance has dominated the measurement of competitive advantage, but unsustainable growth at any cost causes short-sighted, short-term profits for corporations. Currently, companies have begun to pursue long-term and sustainable competitive advantage on the basis of the balanced scorecard (BSC) involving four dimensions: (1) Learning and Growth; (2) Internal Business Processes; (3) Customer; and (4) Financial. However, the interactions among the BSC dimensions necessitate seeking reasonable real-world solutions that are relevant to a manufacturer’s industrial characteristics [5]. Because high-tech industries have numerous attributes that can be configured in various manners, grueling competition and complicated operational processes engender resource differentials and adequacy challenges; this is especially true in the TFT-LCD panel industry in Taiwan. This study integrated sustainability and competitive advantage concepts to develop the most effective solutions for enterprises that use natural resources.
Simon received the Nobel Prize in Economics in 1978 [6] for ideas relating to sustainable competitive advantage and aspiration levels. A visionary TFT-LCD company must implement a systematic plan of sustainable improvement; this plan must grow into a comprehensive development map that combines the characteristics of the TFT-LCD panel industry with the BSC concepts of ecological responsibility. Comprehensive development maps (referred to as the influential network relation map (INRM)) and influential weights of DEMATEL-based ANP (DANP) may benefit from the DEMATEL (decision making trial and evaluation laboratory) technique, and modified VIKOR (VlseKriterijumska Optimizacija I Kompromisno Resenje, in Serbian) method challenges by integrating the BSC and the influential weights of DANP with a modified VIKOR (DANP-V). DANP-V has two main characteristics: (1) it can be analyzed under the guidelines of the appraisal program; and (2) it systematically approaches continuous improvement of its proposals. The modified VIKOR method in DANP-V can be used for bridging the performance gap by setting an “aspired-worst” benchmark to replace the “max–min” benchmark used in the conventional VIKOR approach (to avoid “picking only the best apple from a barrel of rotten apples”); this thus prevents the application of “piecemeal, stop-gap tactics” and enables achieving aspiration levels through systematic improvements based on INRM.
Since 1999, Taiwanese enterprises and the government have provided a considerable amount of talent, training, and finances to enable the TFT-LCD panel industry to obtain competitive advantage cutting-edge specialized field technology and patents because of their wide range and application in many types of electronic merchandise. The key players within the TFT-LCD manufacturing field are clustered in Taiwan and South Korea, constituting approximately 83% of the total worldwide TFT-LCD sales [7]. The industrial structures of these two countries are quite different. Compared to the Korean TFT-LCD industry, which is built up by consortium support by National Plan, the Taiwanese TFT-LCD industry consists of small and medium firms that are merged into a group [8]. Hence, the TFT-LCD panel industry business success of note, which affects the survival on a wide level, has become an indicator of Taiwanese industry. Within the past decades, numerous Taiwanese TFT-LCD panel companies have implemented cost reduction strategies and reduced the costs of production, and intense price competition was generated in the industry as an empirical real case. Taiwanese TFT-LCD firms were gradually losing ground to the competition in the global market. A resource integration strategy was executed by merging five major panel companies into two groups, Companies A and I; each group was assisted by the government and accounted for the formation of a duopoly market in Taiwan. However, these two companies still cannot effectively enhance their sustainable competitive advantage over competitors with the same technology level. TFT-LCD technology has to take into consideration the intense competition in the industry. These corporations are facing the pressure of upgrade sustainability capacity from advanced countries and the challenge to employ technology or raw materials to manufacture products in an environmentally friendly manner. If corporations do not have a standardized environmental protection policy, they cannot provide module or semi-finished products, particularly in electronic merchandise, to downstream manufacturers for produce and/or import to those advanced countries [9,10]. Therefore, the concept of sustainability has driven electronics firms to develop continuous improvement strategies intended to achieve an environmentally relevant aspiration level in Taiwan. Strategies of sustained competitive advantage for achieving the desired aspiration level are explained in terms of continuous improvement and sustainable development in the context of existing interrelationships. Through the analysis of the two companies’ architectures of performance, the problem is explained and solutions that create sustainable competitive advantage are discussed.
The research topic of this study is as follows: two major Taiwanese TFT-LCD companies are gaining consumers in advanced countries with the rise and spread of environmental awareness and face the early implementation of a cleaner production program towards the approach of sustainable development of enterprises to maintain a business competitive advantage. Sustainable development is a continuous improvement progress, thus companies will need to continue investing resources for improving ability to achieve the expectation goal in the future. However, understanding how to invest and improve in the right path for systematically sustainable development is an urgent and important issue.
The main contribution of this study is the comprehensive solution for two major TFT-LCD companies to deal with the fundamental problem (gap) of clearly understanding how to implement the company operations for sustainable development in real-world situations. Furthermore, this study also found the requirement to keep investing in the continuously improving path (INRM) with a resource integration relationship to bridge the gap, in order to make the cooperation plan of these two TFT-LCD companies toward achieving aspiration levels in the future.
The remainder of this paper is organized as follows. Section 2 presents a literature review to establish the indicator framework, and Section 3 presents the DANP-V method. Section 4 reviews the empirical facts regarding TFT-LCD companies in Taiwan, and Section 5 presents conclusions.

2. Literature Review on Establishment of the Indicator Framework

2.1. Sustainable Competitive Advantage and BSC

According to the definition by Kaplan and Norton [11], sustainability “formulates a relationship between dynamic human economic systems and slower changing ecological systems in which human life can continue indefinitely, human individuals can flourish, and human cultures can develop, while diversity, complexity, and function of the ecological life support system are protected”. Various methods that formalize knowledge of manufacturing tools and concepts can also systematize sustainability performance; among such tools are the analytic hierarchical process (AHP) [12] and the balanced scorecard method [13,14]. Such methods may help to define objectives, plan performance improvement and control practices for performance improvement [15,16,17,18], and factors (dimensions and criteria) assumed for each other’s independence.
Competition has been described as a means of encouraging “the search of new regenerating combinations of resources, skills, and processes”, whereas cooperation has been described as facilitating “access to rare and complementary resources” [19]. Numerous companies have begun adopting the BSC as a tool to measure valuable resources in their operational processes, which are analyzed in terms of independent dimensions [20,21,22]. Previous research on sustainability strategies has focused on success factors [23], coordination and control aspects [24], and governance [25]. Hence, in this research, how is the combination of BSC and DANP-V for measuring sustainable competitive advantage a reasonable solution for continuously improving strategies in the real world? This presents an important issue for analysis.

2.2. Assessment Framework of Sustainable Competitive Advantage

Evaluating the measures and criteria of sustainable development requires a strategy, a feasibility model for minimizing the performance gaps among criteria, and a method for analyzing the complicated interrelationships among dimensions and criteria in the multiple attribute decision-making (MADM) process. Decision makers engage in bridging gaps, preventing decision errors, and diminishing planning bias by using the BSC and this comprises learning and growth, internal business processes, customer, and financial dimensions. This technique was applied as a robust measure of organizational performance; however, the interactions and interrelationships among the four dimensions and criteria vary depending on the industry. The DANP-V model was applied to elucidate the interactions and interrelationships of multiple criteria and dimensions of the BSC. This process is conducted with the industrial attribute of aiming to facilitate improvement strategies under holistic diagnosis for comprehension to achieve sustainable competitive advantages for TFT-LCD companies. The BSC can be used as a tool to assist decision makers who have the authority to select ground plans on the basis of competitive advantage strategies adopted in pursuit of continuous improvement and sustainable development [26,27,28,29,30,31,32,33]. Consequently, the BSC was developed to facilitate decision making with dimensions of coordinated development and analysis and merged with the ESG concept (Table 1). The following comprehensive list of dimensions and criteria that can enhance TFT-LCD firms’ sustainable development competency was obtained on the basis of the BSC and ESG. The Learning and Growth dimension (D1) comprises four criteria: the Sustainable Employee Education (C11), Employees Professional Sustainability (C12), Sustainable Management Know-how (C13), and Employee Reaction Competency (C14). The Internal Business Processes dimension (D2) comprises four criteria: Resource Material Consumption (C21), Pollution Production Control (C22), Waste Disposal Capability (C23), and Environmental Management System (C24). The Customer dimension (D3) comprises four criteria: the Corporation Green Image (C31), Green Logistic Management (C32), Consumer Environmental Awareness (C33), and Local Market Regulations (C34). Finally, the Financial dimension (D4) comprises four criteria: the Sustainable Capital Input (C41), Recycling Cost (C42), Recovery Reuse Value (C43), and Net Profit Ratio (NPR) (C44). The dimensions and criteria are described as follows.

2.2.1. Learning and Growth

The effect of continual enhancement of sustainability and an increase in competency accumulation on learning can be observed and discussed through imperceptible influence processes. Knowledge and technology for sustainable development are achieved by learners through formal and/or informal transfer processes. Therefore, a sustainable base for lifelong learning and training processes includes Sustainable Employees Education, Employee Professional Sustainability, Sustainable Management Know-how, and Employee Reaction Competency [10,34,35,36,37,38,39,40,41,42,43,79]. The Sustainable Employees Education criterion composing eco-friendly and sustainable supply chain activities in service training, seminar, or technical exchange programs merges domain knowledge with the organizational partnership to respond to the environmental awareness of employees [37]. Sustainable employee training was also identified as a major challenge that should be addressed to endorse environmental protection and merge education with domain knowledge [35,38]; the Employee Professional Sustainability criterion for employees’ professional capacity was constructed through a long-term continual cultivated development process, embedded in the sustainability practice with high-quality procedures in the professional domain [39]. Building upon existing knowledge, skills and science expertise in sustainability applications were integrated into the routine workflow, and the requirement of environmental protection was carefully addressed in professional communities [34]. The Sustainable Management Know-how criterion comprises the relative sustainable competitive advantage of business firms from the creation, ownership, protection, and use of difficult-to-imitate commercial production methods and industrial knowledge assets [40]. It includes the intangible assets as tacit knowledge and codified know-how, both of which are generated from technical and organizational aspects, which are protected or normed through the law of intellectual property, such as trade secrets, copyrights, and patents. Management expertise and other types of know-how can facilitate employees’ research and development, facilitating the effective execution of sustainable solutions [10,38,41]. The Employee Reaction Competency criterion involves the successful management of emergency events and immediate damage control when environmental pollution is caused during an operation. Employees’ ability to manage contingency for the survival of an organization depends on how efficiently it can maintain the organizational reputation and gain a market share in particular industries. To achieve this objective, employees must be constantly prepared to prevent environmental pollution events during operations. Only employees with correct and updated knowledge, skills, and acceptable operational behaviors, and who practice them repeatedly to improve reaction ability, make an appreciable difference in resolving a crisis in their companies. Therefore, effective employee training is a critical component of Employee Reaction Competency in an organization’s strategy [42]. The competence of employees in managing pollution emergency occurrences is crucial in Employee Reaction Competency [43,79] (Table 2).

2.2.2. Internal Business Processes

Govindan et al., 2016 [10] reported that “stakeholders and competitive priorities drive profit and non-profit organizations towards the implementation of sustainability-related measures in their internal operations and in their supply chains planning”. Internal Business Processes were related to supply chain activity, particularly in the fusion with production management. The Internal Business Processes dimension comprises Resource Material Consumption, Pollution Production Control, Waste Disposal Capability, and Environmental Management System [10,41,47,48,49,50,51,52,53,54,55,56,57,58,83,84]. The Resource Material Consumption criterion was developed with reference to the Euro map 60, offering a facilitative measurement strategy and benchmarking concept; for example, measurements of energy efficiency were performed under standardized conditions such as the use of comparable raw materials [50,51]. Resource and raw material consumption were considered in the context of ecological protection during purchasing processes [10,41,47,48,49,52]. The Pollution Production Control criterion comprises command-and-control mechanisms applied to enforce companies’ solutions for implementing cleaner production processes, such as changing production processes to reduce or eliminate the emission of cleaning and diluting pollutants. Environmental regulations were focused on pollutant damage control in the operational process, that is, on reparation and setting limits to harmful activities, end-of-pipe cleaning and diluting technologies, and other cleanup strategies [55]. The average volume of air pollutants, waste liquids, solid wastes, and harmful materials released per day during manufacturing must be considered in pollution control [10,53,54,55]. The Waste Disposal Capability criterion comprises the highest standards in the European Union, such as those regarding landfills. Recycle collaboration firms have long been recognized for their role in influencing firms to re-consider their waste disposal options [83,84]. If a TFT-LCD company plans to sell products to advanced countries, such as European Union members, the capability of the company to ensure safety and protect the environment through proper waste disposal is a crucial process that must be considered [10,47,48,49,80]. The Environmental Management System criterion comprises the environmental policy regarding basic requirements for a systematic approach to management, including the generic requirements of the international standard STN EN ISO 14001 and the eco-management and audit scheme (EMAS) environmental management systems [49]. Environmental certifications, such as ISO 14000 and EMAS, environmental policies, planning environmental objectives, and verifying and environmental activities are crucial in business process operation [10,56,57] (Table 2).

2.2.3. Customer

Govindan et al. (2013) [59] reported that “sustainable supply chain management has received much attention from practitioners and scholars over the past decade owing to the significant attention given by consumers, profit and not-for-profit organizations, local communities, environmental legislation and regulation, and social and corporate responsibility”. Environmental concepts have currently attracted attention because of the pressure generated by the competition in the market for a green image through government regulations, non-governmental organizations, customer demands, diffusion by the media, and so on [85,86,87,88,89]. The Corporation Green Image criterion comprises customers’ awareness that a company does not have a green image, thus preventing the company from selling its products. Integrating green supply chain management practices requires cooperation at all levels, both internal (from top management, and engineers to laborers) and external (from distributors and vendors to sellers) [81]. The market reputation of an enterprise and environmental protection image presented to the public are crucial [59,60,61,62,63]. As such, the importance of sustainability is increasing, and modern enterprises are focusing on a green image. A corporate image shaped by an environmentally conscious mission is the preferred marketing strategy for modern enterprises. The Green Logistic Management criterion comprises product transportation, packaging, and delivery from the factory to the consumer. Such activities are associated with an increase in the total environmental footprint. In some consumer electrical product supply chains, greenhouse gasses are emitted because of the transportation of total emissions over the product life cycle [63]. Green vehicles used for transporting products to customers provide a type of green solution in operational management [47,54,59]. The Consumer Environmental Awareness criterion comprises the major influences of consumers’ selection of a green product or discount in price, operating price benefits (such as reduced electricity bills), green promotions, green features of a product, and environmental awareness related to a product [59,64,65,66]. The Local Market Regulations criterion comprises regulations by public policy organizations on the content of environmental notifications that restrict consumer choices in a local market [59,67]. Environmental notifications refer to changes in local governmental regulations [82] (Table 2).

2.2.4. Financial

Financial goals and measurements are common to all BSC dimensions. The BSC considers the financial dimension to be a measure of the financial performance that is a reflection of the past within BSC’s own existence. Financial goals and profitability-related metrics that are commonly employed in recent years are operating income, return on capital use, and added economic value. Financial goals may be to create rapid revenue growth or cash flow. However, a compromise using eco-friendly solutions is still required for sustainable development in enterprises. A visionary enterprise should consider the long-term plan, sustainability, short-term plan, and net-income simultaneously. This implies that the enterprise should devise a sustainability plan, balance eco-friendliness and production efficiency, and investigate the efficiency of the multiple effects of technological change, productivity growth, separability, aggregation, and new generation or substitution facility possibilities. The financial dimension comprises Sustainable, Recycling cost, Recovery, Reuse Value and Net Profit Ratio aspects [11,48,60,68,69,70,71,72,73,74,75,90]. The Sustainable Capital Input criterion comprises capital investment requirements for inspecting, re-manufacturing, recycling equipment, transport facilities, and infrastructure, including information technology infrastructure related to sustainable development [48,69,70,90]. The Recycling Cost criterion comprises the capital cost of augmentations that are factored into the daily recycling cost per unit of waste and the recycling facilities that are the most favored for capacity increase [76]. All types of costs related to recycling resources applied to operational processes tend to clear production [70,77]. The Recovery and Reuse Value criterion considers costs related to the direct reuse of the surplus material recycled during the production process estimation of activity costs for cleaning, inspection, and testing and the reuse value of a plant’s waste recovery resources [60,72,73,74,75]. The Net Profit Ratio (NPR) criterion comprises the relationship between the most significant calculated rates and the net profits of the company during the current period (net profit/revenue income) [11,68] (Table 2).
In this study, the scale of the importance level ranged from 0 to 100; levels of 0–20, 21–40, 41–60, 61–80, and 81–100 were defined as very unimportant, unimportant, fair, important, and very important, respectively (Figure 1).

3. Method: DANP-V Model

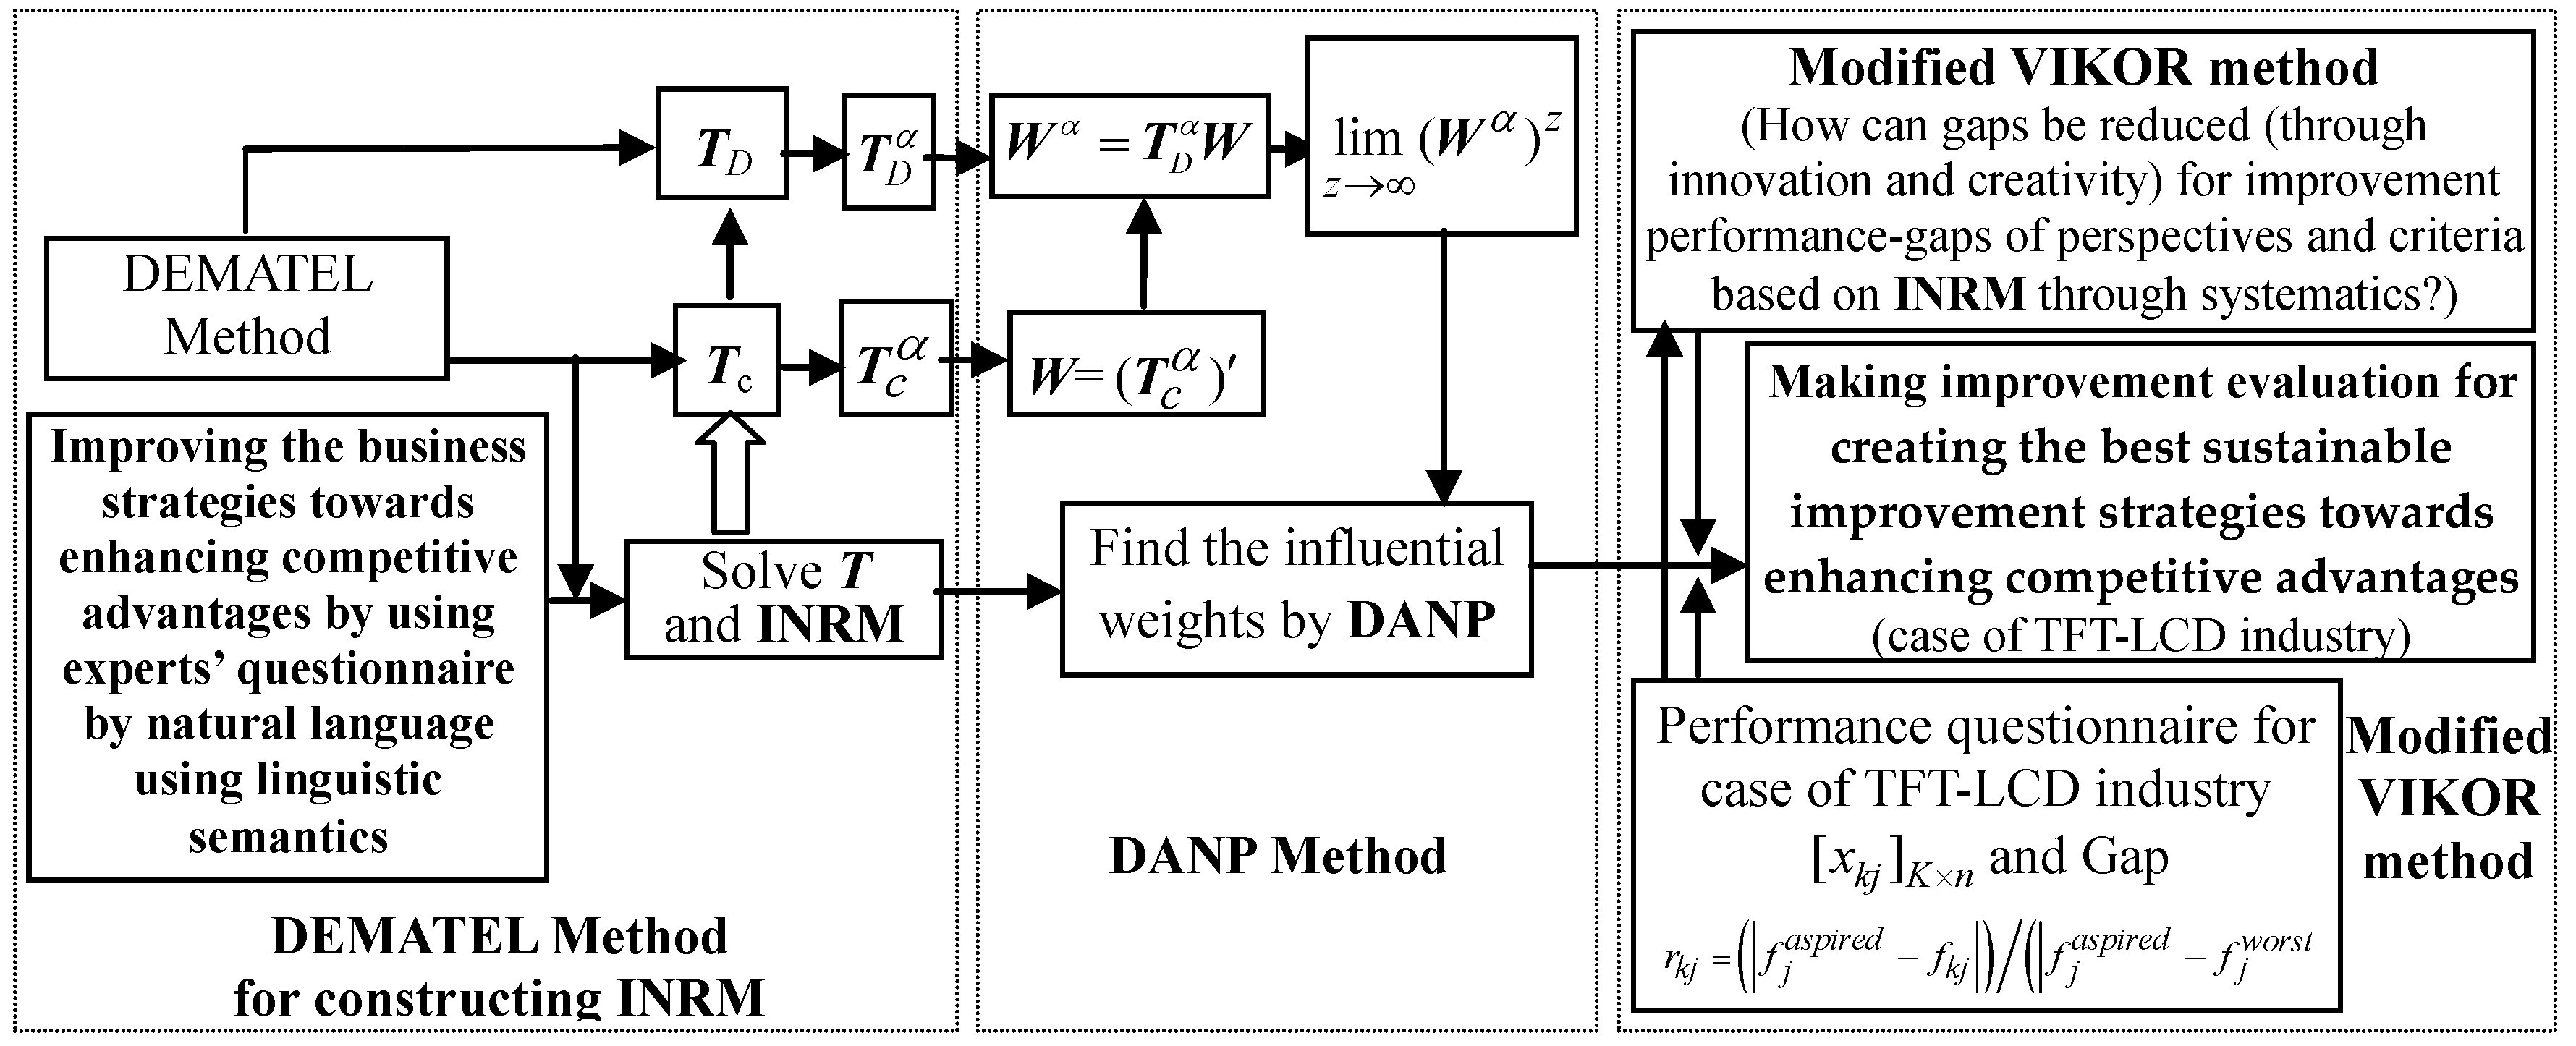
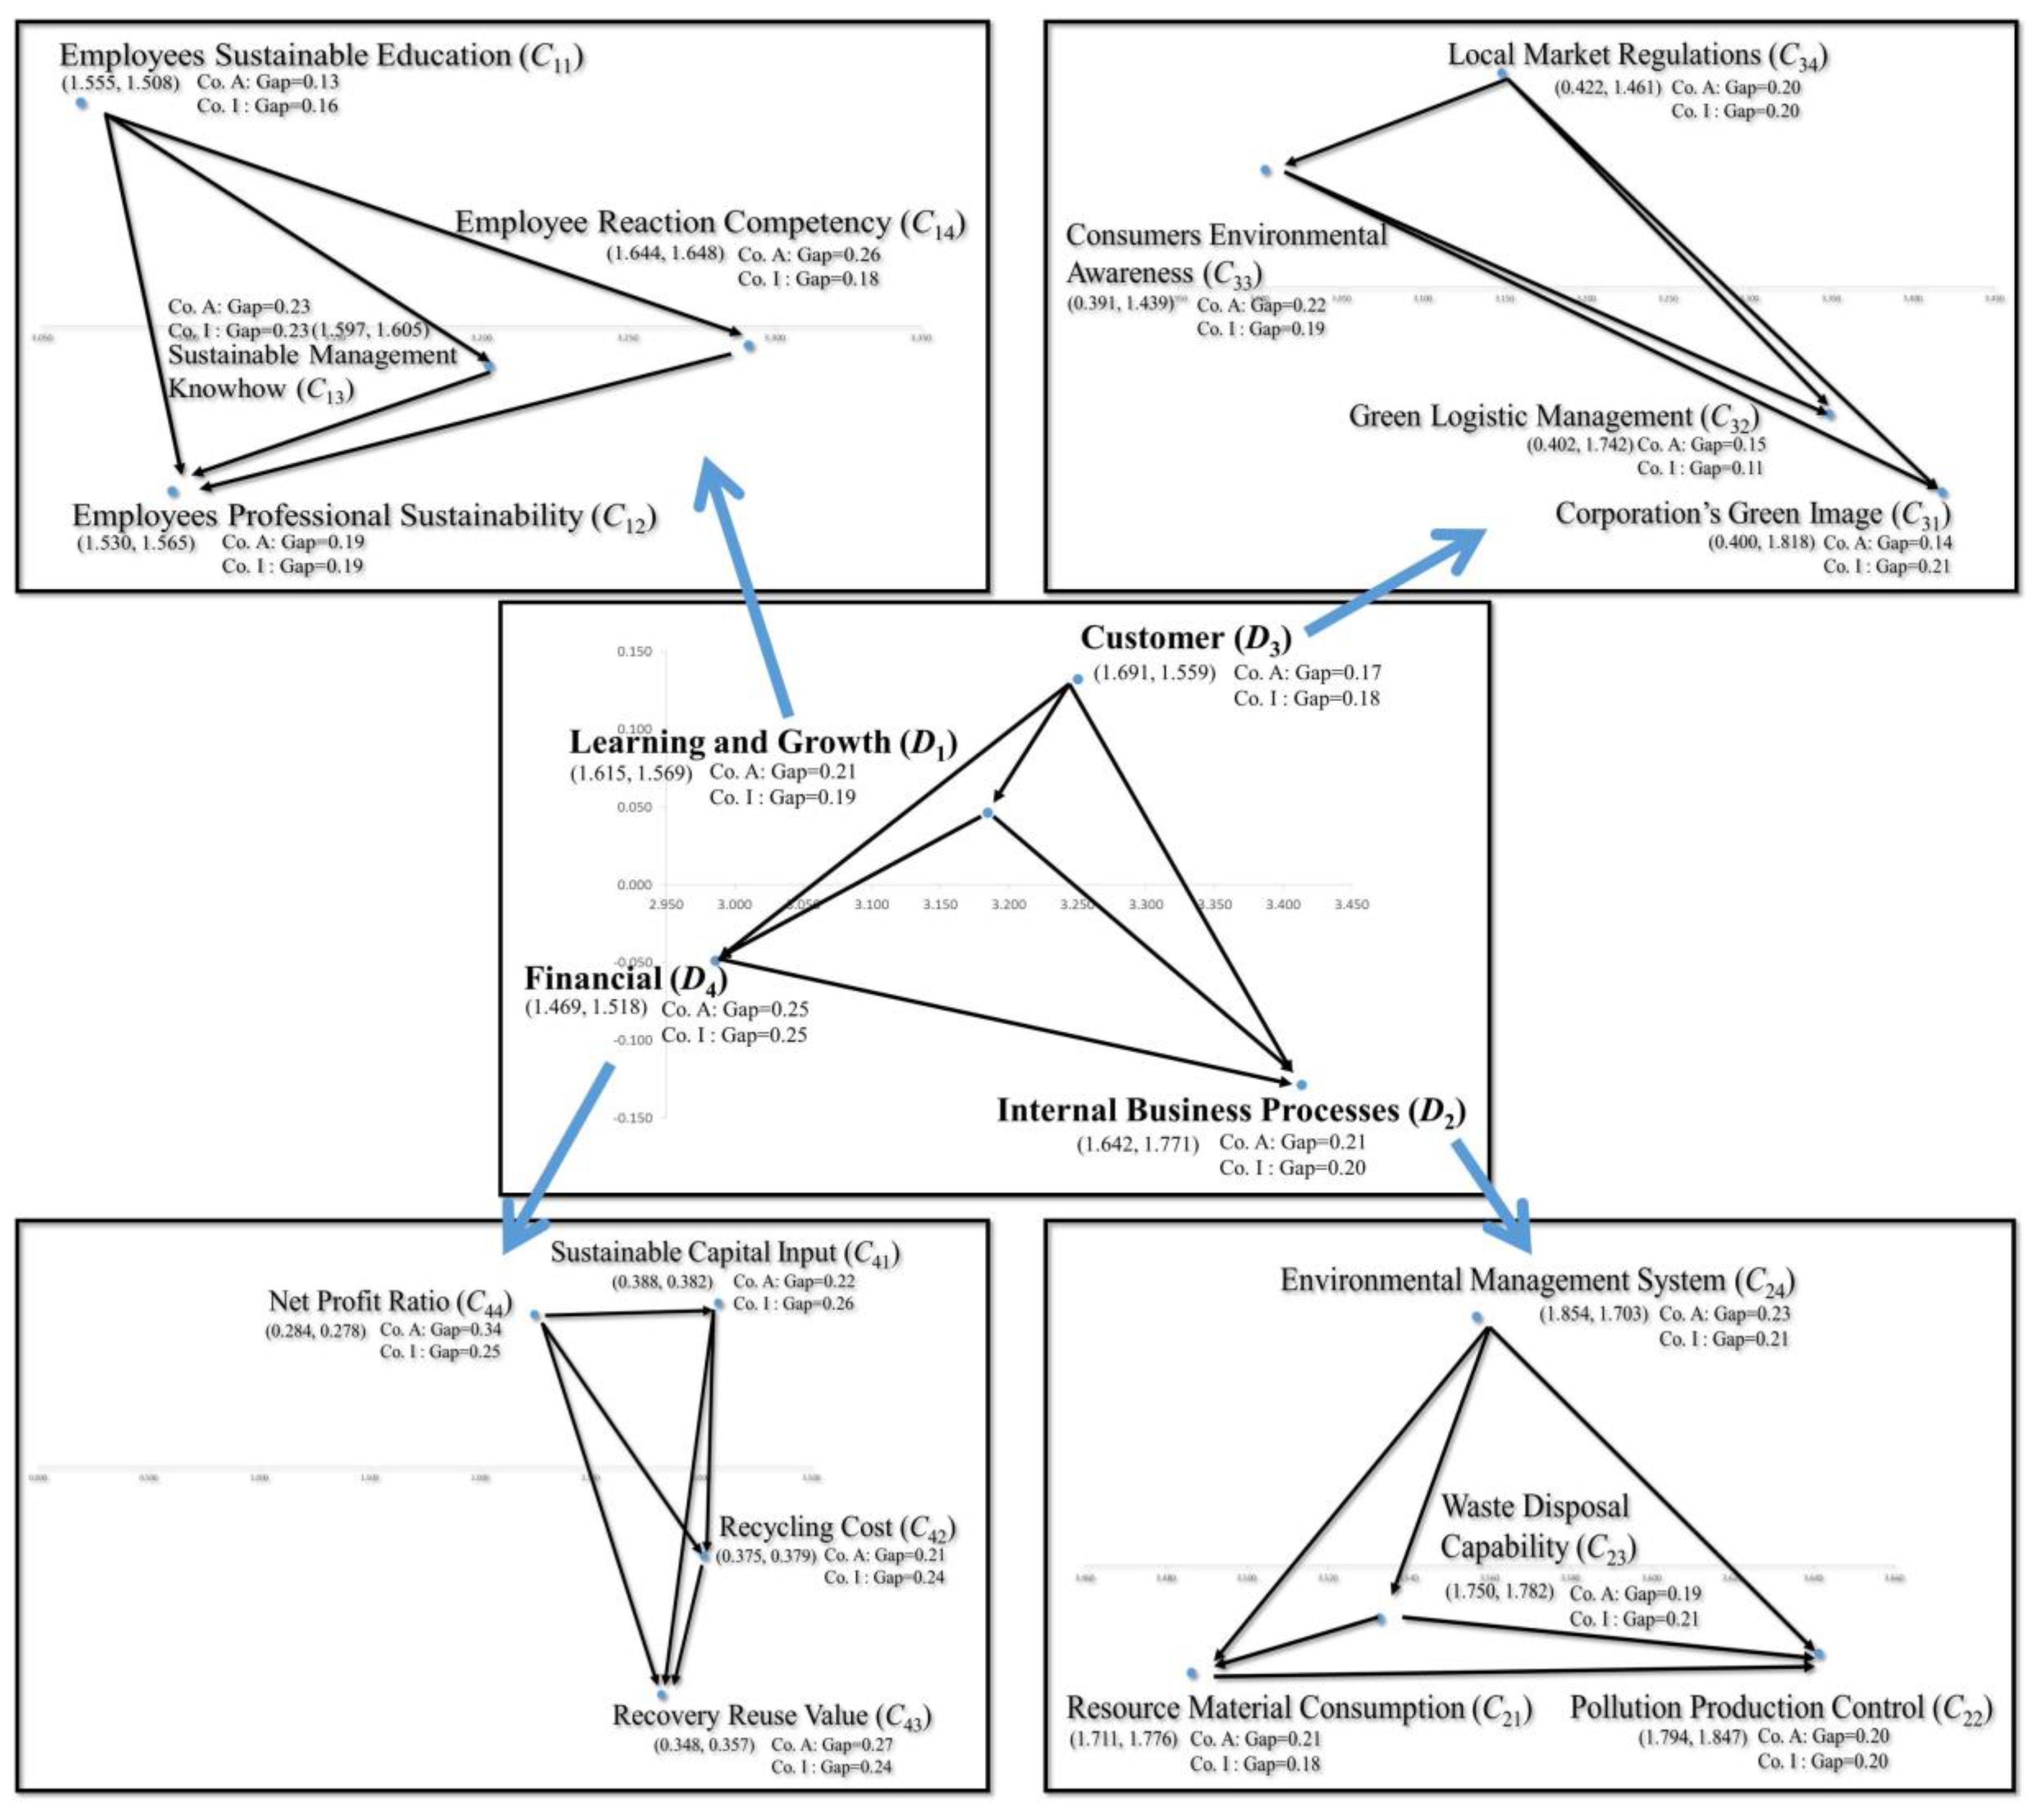
This study used a hybrid modified MADM model combined with the DEMATEL technique to construct the INRM (Figure 2, Figure 3 and Figure 4). The influential weights (IWs) of the DANP were calculated to confirm the causes and effects associated with each perspective and criterion in the existing relationships and to measure and evaluate the importance of each factor. The DANP-V model is a hybrid modified MADM model, also called the modified VIKOR-DANP model [27], developed on the basis of the aforementioned studies, and it is appropriate for assessing and improving business competitiveness [91] and bridging the performance gaps in each criterion. The dimensions and criteria were generated using the DEMATEL technique to construct the INRM and determine the IWs through a procedure of the DANP, which is a hybrid adopting the basic ANP concept by Saaty [84] and using the DEMATEL technique (Equations (7)–(12)). The global weights can also be obtained using the influence relation matrix through these hybrid methods [28]. Because the influence level is a characteristic of the weights, this study referred to these as the IWs of DANP [28,29,30,31,32,33,92,93,94,95]. The modified VIKOR method was then used to calculate the ratio of the gap between the real performance f k j and the aspiration level f j a s p i r e d in the alternative k ( k = 1 , 2 , ... , K ) of criterion j ( j = 1 , 2 , ... , n ) ; that is r k j = ( | f j a s p i r e d f k j | ) / ( | f j a s p i r e d f j w o r s t | ) such that the calculations of the IWs are integrated among various programs. Finally, the problems of each program were determined through the modified VIKOR method (If the gap value of a criterion is larger, the problems are more acute and should receive priority for improvement). The INRM was applied to determine the crux criterion through path analysis of influential directions among criteria to identify the cause of the problem and to determine how to formulate improvement strategies through systematics [29] to avoid the “stop-gap piecemeal practice” [30,31,33,92,93,94,95].
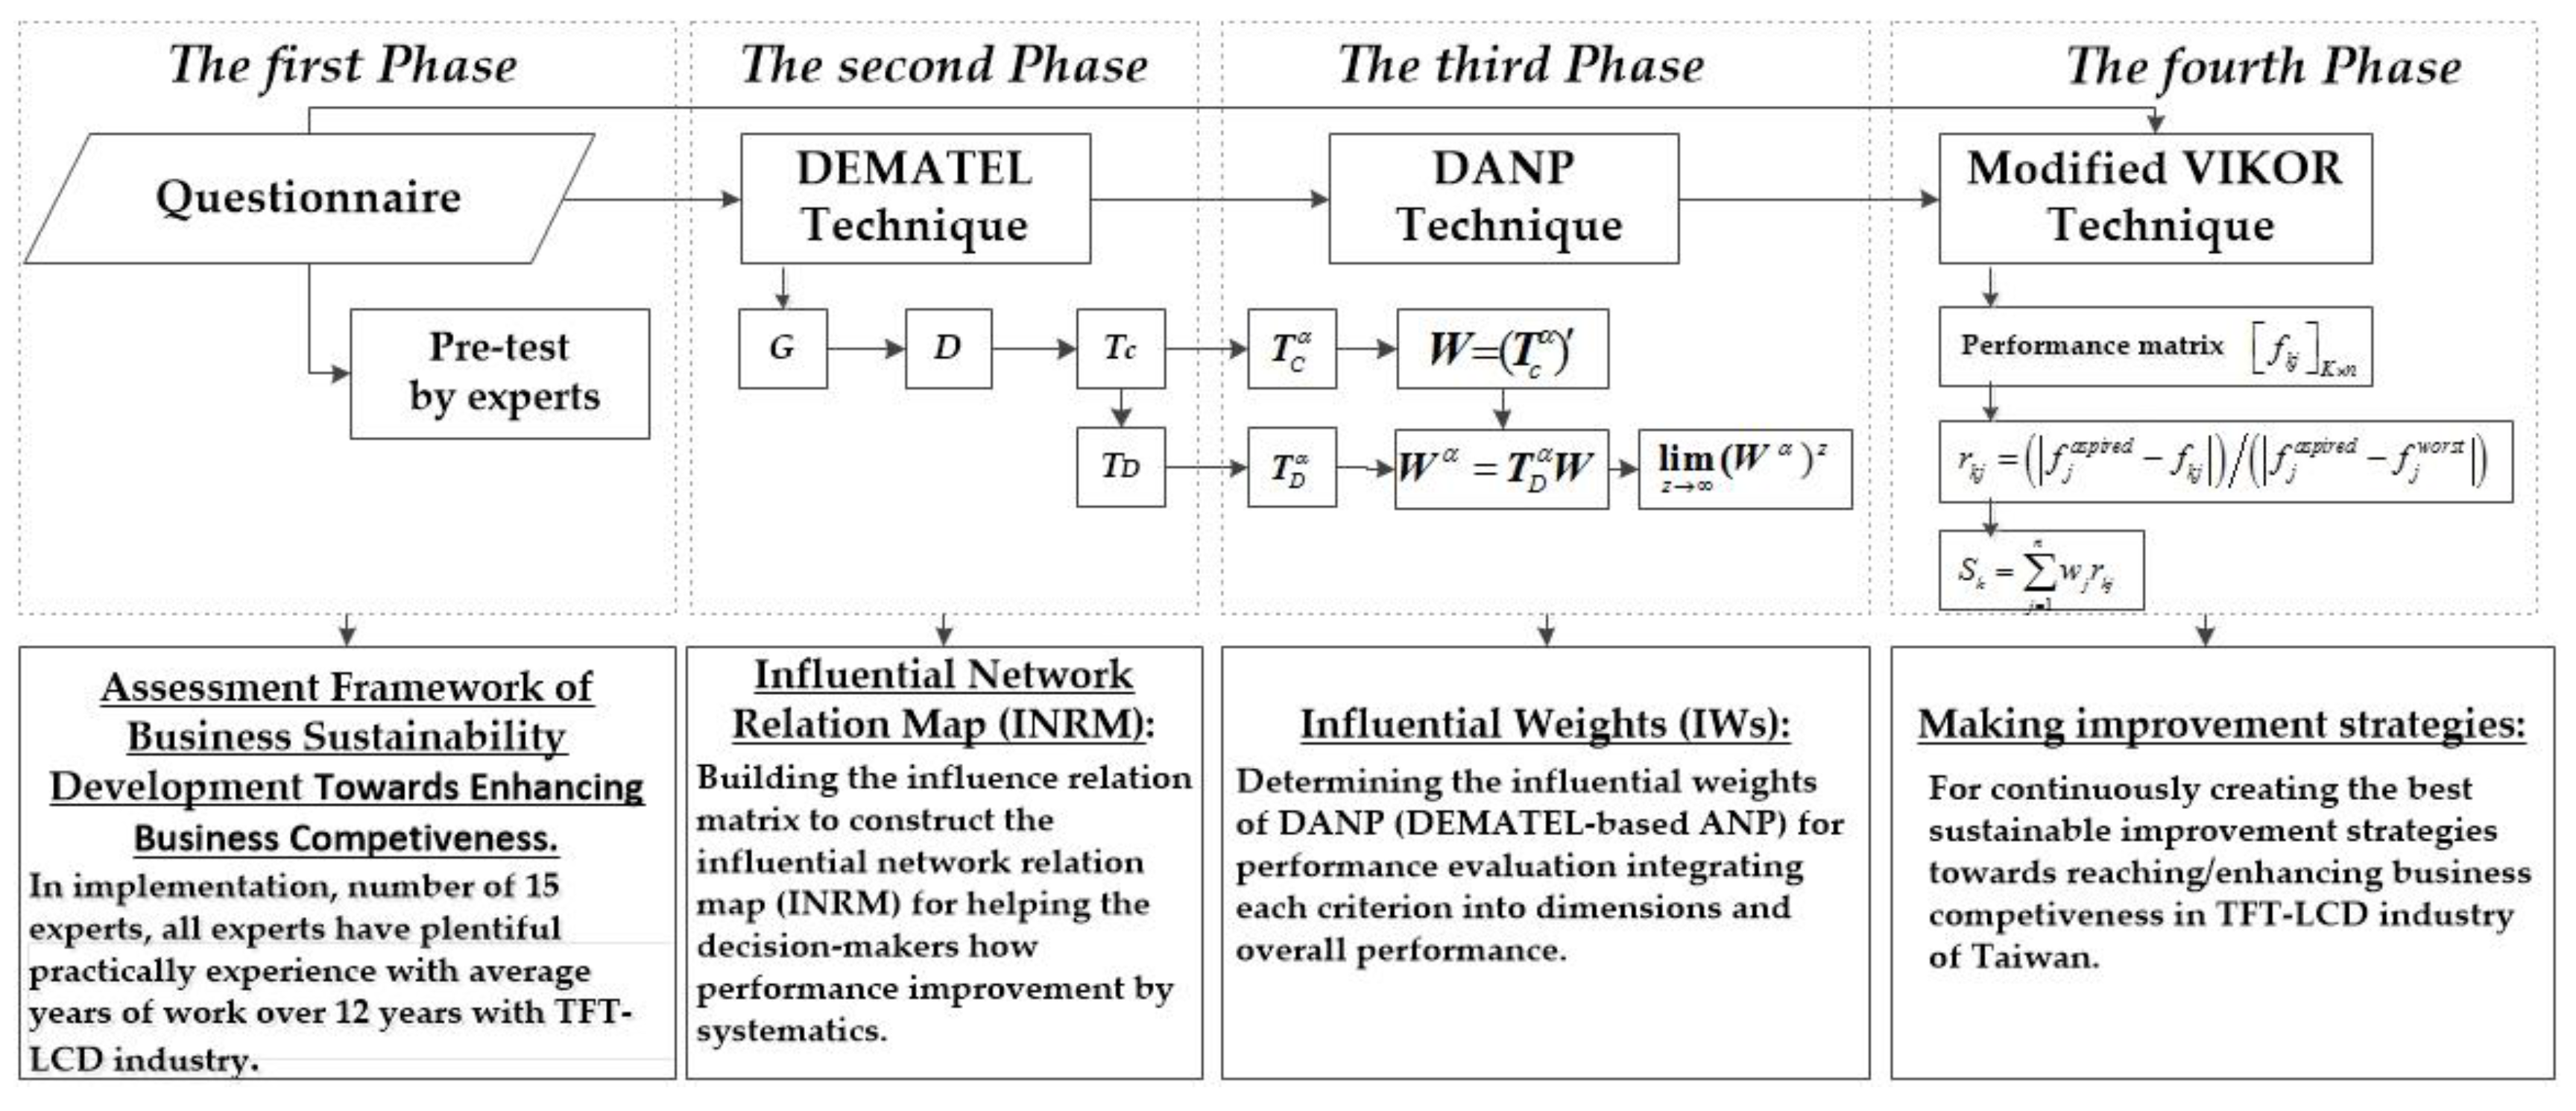
In this study, the DANP-V model was executed in four phases [31]: the first phase was a pretest of the measures in the framework, the second phase established the comprehensive, influential network diagram, the third phase entailed determining the correct training value of IWs, and the fourth phase involved programs for developing improvement strategies, as shown in Figure 2.
The main purpose of the first phase was to determine the degree of influence of each criterion on the research goal on the basis of experience of experts to ensure the reliability of the overall study. A questionnaire was designed and divided into two parts: the first part applied a 5-point Likert scale on which some of the experts evaluated the importance of each criterion; the second part of the questionnaire comprised open-answer items for enhancing the quality of the questionnaire through experts’ sharing of their experience and modified the criteria and connotations. The expert questionnaires were used to survey senior practitioners of sustainable development in the TFT-LCD industry. The selected criteria were identified by experts in fields relevant to the TFT-LCD industry. An appointment was made in advance, and the experts were asked when they could complete the expert questionnaires; the survey was then conducted. The personal information of the experts interviewed was kept confidential in accordance with the principles of research ethics. Only the relevant basic information required for this survey was disclosed. All experts had considerable practical experience, with average years of work of over 12 years within the TFT-LCD industry; they were serving as persons in charge of sustainable development duties. The experts had received Ph.D. and Master’s degrees relevant to the field as academia, industry, and government representatives.
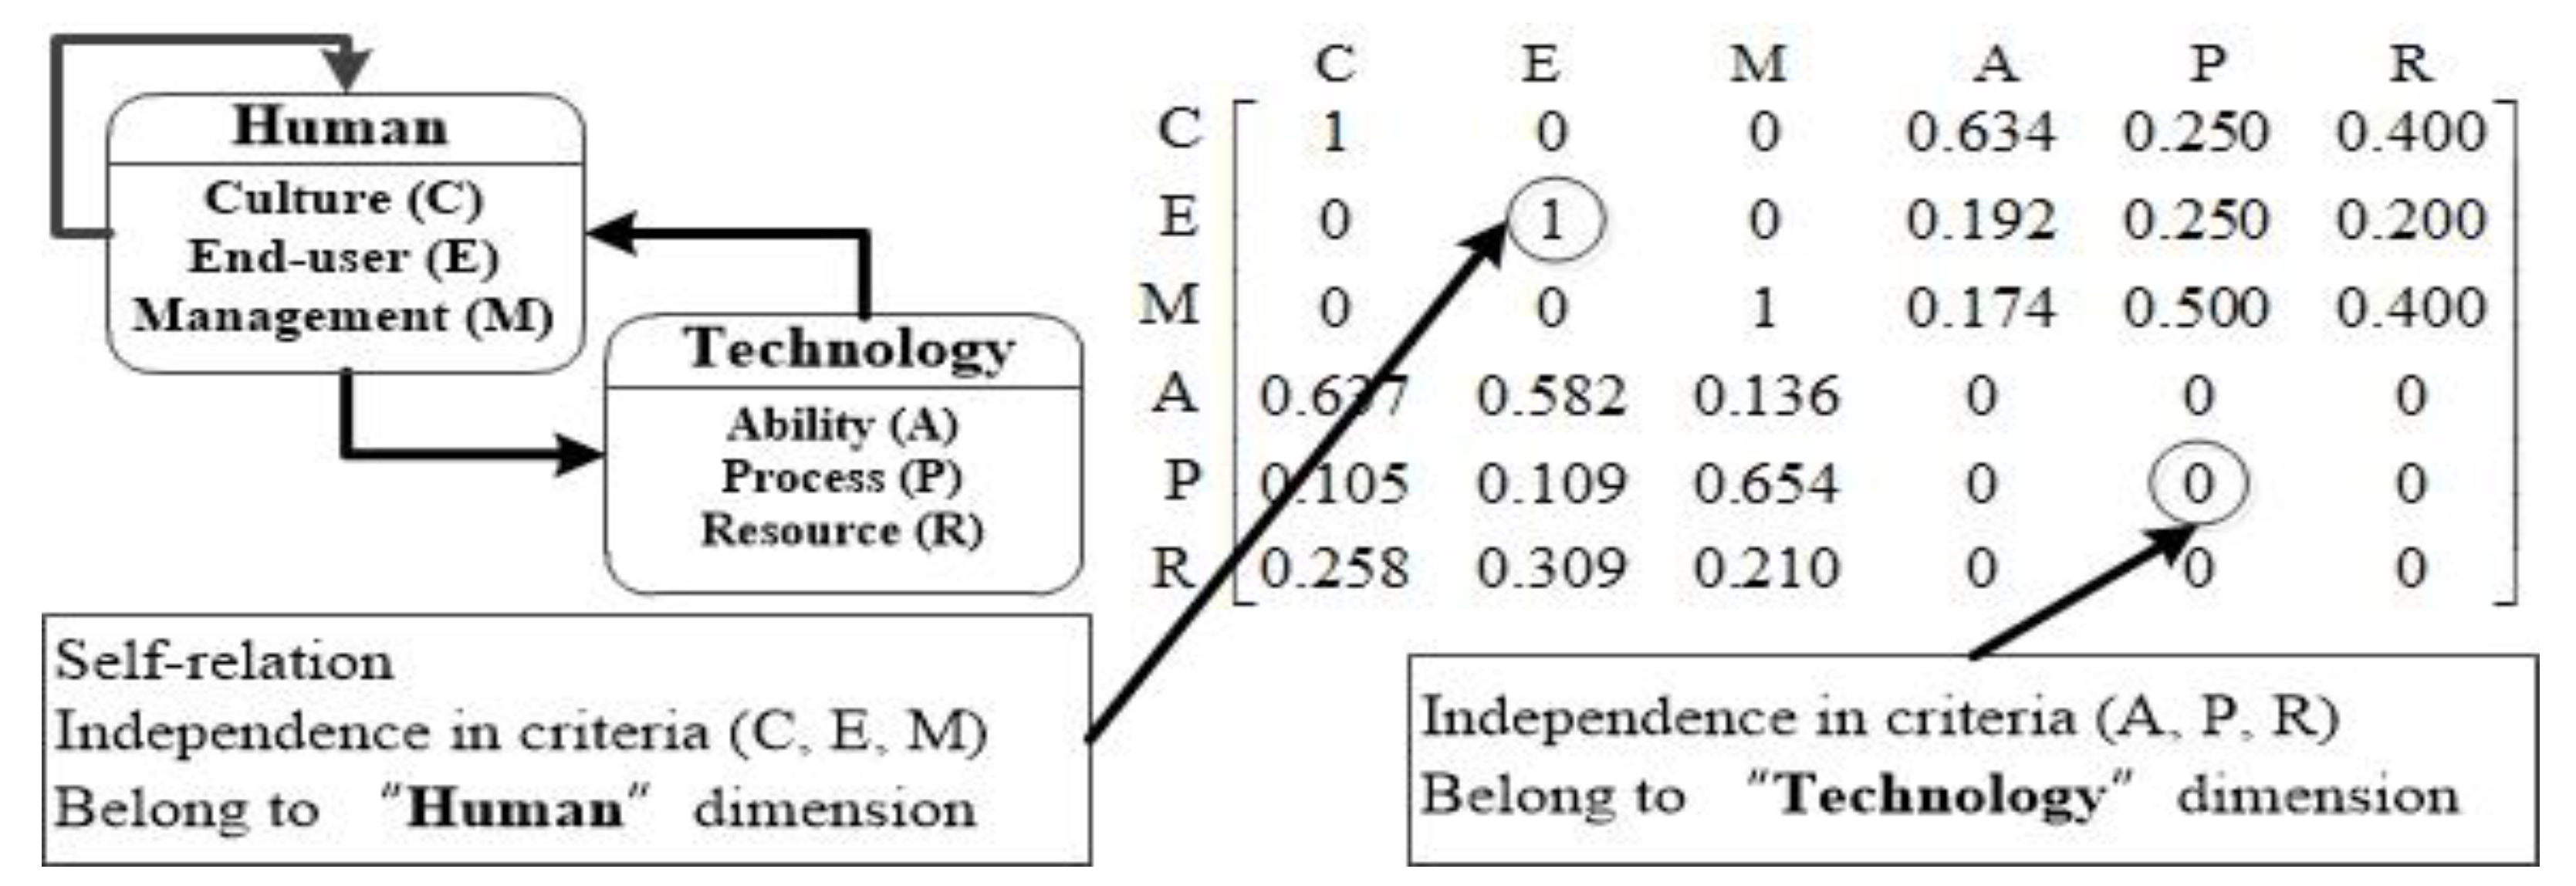
The second phase entailed establishing a comprehensive INRM through a systematic thought process. This phase of the survey involved a pair of experts who compared the degree of influence between the criterion value, aggregated it into a matrix that was initialized, and then by using the DEMATEL technique calculated the dimensions ( T D ) and criteria ( T C ) of the total influence relation matrix [83]. The INRM was constructed on the basis of the influence intensity among dimensions ( T D ) and criteria ( T C ) and then overlapped it; the overall effect diagram (see INRM in Figure 4) was then completed.
The third phase involved the DEMATEL technique, which is detailed as follows:
Step 1: Calculate the direct influence relation average matrix G . Assume the number of experts to be H and number of criteria to be n. The pairwise comparisons between any two criteria are assigned and denoted by an integer score of 0, 1, 2, 3, or 4, representing the range from “absolutely no influence (0)” to “very high influence (4)” according to natural language (e.g., semantics) and denoting the degree to which each criterion i affects each criterion j. The answers by each expert form a n × n nonnegative matrix X h = [ x i j h ] n × n , h = 1 , 2 , ... , H , where X 1 , ... , X h , ... , X H are the answer matrices of the H experts with practical experience, and the elements of X h are denoted by x i j h from expert H (h = 1, 2,‖, H). Therefore, an n × n average matrix G of all experts given can be constructed using Equation (1).
G = [ g 11 g 1 j g 1 n g i 1 g i j g i n g n 1 g n j g n n ]
The average score of the H experts is g i j = 1 H h = 1 H x i j h . The average matrix is called the initial direct relation matrix G and represents the degree of influence that one criterion exerts on another criterion as well as the degree of influence it receives from other criteria.
Step 2: Normalize the initial direct influence relation matrix. The normalized initial direct influence relation matrix D is acquired by normalizing the average matrix G. The matrix D is easily derived from Equations (2) and (3), in which all principal diagonal criteria are equal to 0:
D = G / s
s = max { max 1 i n j = 1 n g i j , max 1 j n i = 1 n g i j }
Step 3: Obtain the total influence-relation matrix T . A continual decrease in the indirect effects of problems was observed with the increasing powers of the matrix D , for example, D 2 , D 3 , , D , and lim q D q = [ 0 ] n × n , for lim q ( I + D + D 2 + + D q ) = ( I D ) 1 , where I is an n × n unit matrix. The total influence relation matrix T is an n × n matrix, and is defined by T = [ t i j ] n × n , i , j = 1 , 2 , , n as shown in Equation (4).
T = D + D 2 + ... + D q = D ( I + D + D 2 + ... + D q 1 ) = D ( I +   D + D 2 + ... + D q 1 ) ( I D ) ( I D ) 1 ,  then
T = D ( I D ) 1 ,  when   lim q D q = [ 0 ] n × n
where D = [ d i j ] n × n , ( I D ) ( I D ) 1 = I , ( I +   D + D 2 + ... + D q 1 ) ( I D ) = ( I D q ) = I (when lim q D q = [ 0 ] n × n ), 0 d i j < 1 , 0 < j = 1 n d i j 1 and 0 < i = 1 n d i j 1 , and at least one row or column of the summation, but not all, equals one; then, lim q X q = [ 0 ] n × n can be guaranteed.
Using the total influence relation matrix T = [ t i j ] n × n , ( T c = [ t i j ] n × n | m < n , j = 1 m m j = n by criteria and T D = [ t i j ] m × m by dimensions), the INRM can be acquired according to Equation (4). Equations (5) and (6) are used to generate each row sum and column sum in the matrix T = [ t i j ] n × n , respectively.
d = ( d i ) n × 1 = [ j = 1 n t i j ] n × 1 = ( d 1 , ... , d i , ... , d n )
r = ( r j ) n × 1 = ( r j ) 1 × n = [ i = 1 n t i j ] 1 × n = ( r 1 , ... , r j , ... , r n )
where d i is the row sum in the total influence relation matrix T = [ t i j ] n × n , which represents the total effects (both direct and indirect) of a criterion or perspective i on all other criteria or perspectives [ j = 1 n t i j ] n × 1 . Similarly, r j is the column sum in the total influence relation matrix T = [ t i j ] n × n , which represents the total effects (both direct and indirect) that a criterion or perspective j receives from all other criteria or perspectives [ i = 1 n t i j ] 1 × n . Therefore, when i = j, ( d i + r i ) offers an index of the strength of the total influences given and received; that is, ( d i + r i ) indicates the degree of importance of the criterion or perspective i in the system. In addition, ( d i r i ) provides an index of the degree of the cause of total influence. If ( d i r i ) is positive, then the criterion or perspective i is a net causer, and if ( d i r i ) is negative, then the criterion or perspective i is a net receiver.
The third phase involved assigning weights to training data. The total influence relation matrix ( T D and T C ) of the second phase was determined using the basic ANP concept [79,84], and the proposed training processes affected the accuracy of the values; this method is called the DANP.
The IWs can be obtained through the DANP as follows (see Appendix B.3 DEMATEL-based technique to determine the IWs in DANP (DEMATEL-based ANP):
Step 1: Total influence relation matrix T C . The DEMATEL technique is used to construct the total influence relation matrix T C from each perspective (dimension or cluster), with different degrees of influence relation for the criteria, as shown in Equation (7), where j = 1 m m j = n , m < n , and T c i j as an m i × m j matrix.
Sustainability 08 00646 i001
where D m is the mth cluster, c m m is the mth criterion in the mth dimension, and T c i j is a submatrix of the influence relation obtained from a comparison of the criteria of the ith and jth dimensions. In addition, if the ith dimension has no influence on the jth dimension, then submatrix T c i j = [ 0 ] shows independence (no influence relation) in every other criterion.
Step 2: Form an un-weighted super-matrix W . Normalize the total influence relation matrix T C as shown in Equation (8).
Sustainability 08 00646 i002
where T C α denotes the normalized total influence relation matrix. Similarly, T c α m m can be obtained.
According to pairwise comparisons with the criteria and the basic concept of the ANP, the un-weighted super-matrix W can be obtained by transposing the normalized influence-relation matrix T C α (basic ANP concept in the form of un-weighted supermatrix; see Appendix B.1 AHP and Appendix B.2. ANP) by dimensions (clusters); that is, W = ( T C α ) , as shown in Equation (9).
Sustainability 08 00646 i003
Step 3: Obtain the weighted super-matrix W α . The total influence-relation matrix T D of dimensions is derived according to the DEMATEL technique, as presented as following matrix.
T D = [ t 11 t 1 j t 1 m t i 1 t i j t i m t m 1 t m j t m m ] m × m
The normalized total influence-relation matrix T D α of dimensions can be obtained through the total influence-relation matrix T D divided by d i = j = 1 m t i j , i = 1 , 2 , ... , m , as shown in Equation (10).
T D α = [ t 11 / d 1 t 1 j / d 1 t 1 m / d 1 t i 1 / d i t i j / d i t i m / d i t m 1 / d m t m j / d m t m m / d m ] m × m = [ t 11 α D t 1 j α D t 1 m α D t i 1 α D t i j α D t i m α D t m 1 α D t m j α D t m m α D ] m × m
The normalized T D α , unweighted super-matrix W (shown as Equation (9)), and weighted super-matrix W α (normalized super-matrix) can be easily obtained through Equation (11), where t i j α D is a scalar and j = 1 m m j = n .
Sustainability 08 00646 i004
Step 4: Calculate the limit of the super-matrix W α . Limit the weighted super-matrix by raising it to the zth power until it has converged and become a stable super-matrix. The global priority vectors are obtained, which are called the IWs of the DANP, such as lim z ( W α ) z , where z represents any number.
In brief, according to the aforementioned process, the INRM and IWs can be obtained and can be used in resolving the problem of interdependence and feedback to develop the most effective systematic improvement strategies for reducing the gaps in criterion performance, such that all criteria facilitate achievement of the aspiration level.
The fourth phase entailed developing the most effective sustainable improvement strategies for enhancing competitive advantages in the TFT-LCD industry. The gaps can be calculated using the modified VIKOR method, which entails considering each absolute distance between performance values and adopting the aspiration level and worst value, called “aspired-worst”, as benchmarks [80,81,82,83,85,93,94,95,96], rather than using the relative distance and adopting positive and negative ideal points, called “max-min”, as the benchmarks as in the conventional VIKOR method [86,87,88,93,94,95,96]. Accordingly, the phase involved solving problems through the modified VIKOR programs in the problem criteria; the INRM was then used to identify the crux of the criteria (the criteria on the impact of the problem criteria). The conventional and modified VIKOR methods are compared to demonstrate the concept of continual improvement in sustainability. Finally, the reasons for the impact of the criteria through the crux are elucidated for developing the most effective improvement strategies for reaching the aspiration level.
The fourth phase: The modified VIKOR method is described as follows:
Step 1: Derive the positive and negative-ideal solutions for replacing the aspiration levels and worst value to fit the current real-world situation. Define the aspiration level f j a s p i r e d in the j criterion and worst value f j w o r s t for all criteria j = 1 , 2 , ... , n , which can be converted from the conventional form into the modified form.
(1)
The conventional approach for deriving the positive- and negative-ideal solutions as the benchmarks (max-min) is illustrated as follows.
Positive-ideal solution: f = ( f 1 , ... , f j , ... , f n ) , where f j = max k { f k j | k = 1 , 2 , ... , K } ;
Negative-ideal solution: f = ( f 1 , ... , f j , ... , f n ) , where f j = min k { f k j | k = 1 , 2 , ... , K } .
(2)
The modified approach for replacing the aspiration level and worst value as the benchmark (“aspired-worst”) is shown as follows.
Aspiration level:   f a s p i r e d = ( f 1 a s p i r e d , ... , f j a s p i r e d , ... , f n a s p i r e d ) , where f j a s p i r e d is an aspiration level, called the most effective value;
Worst values:   f w o r s t = ( f 1 w o r s t , ... , f j w o r s t , ... , f n w o r s t ) , where f j w o r s t is a worst value.
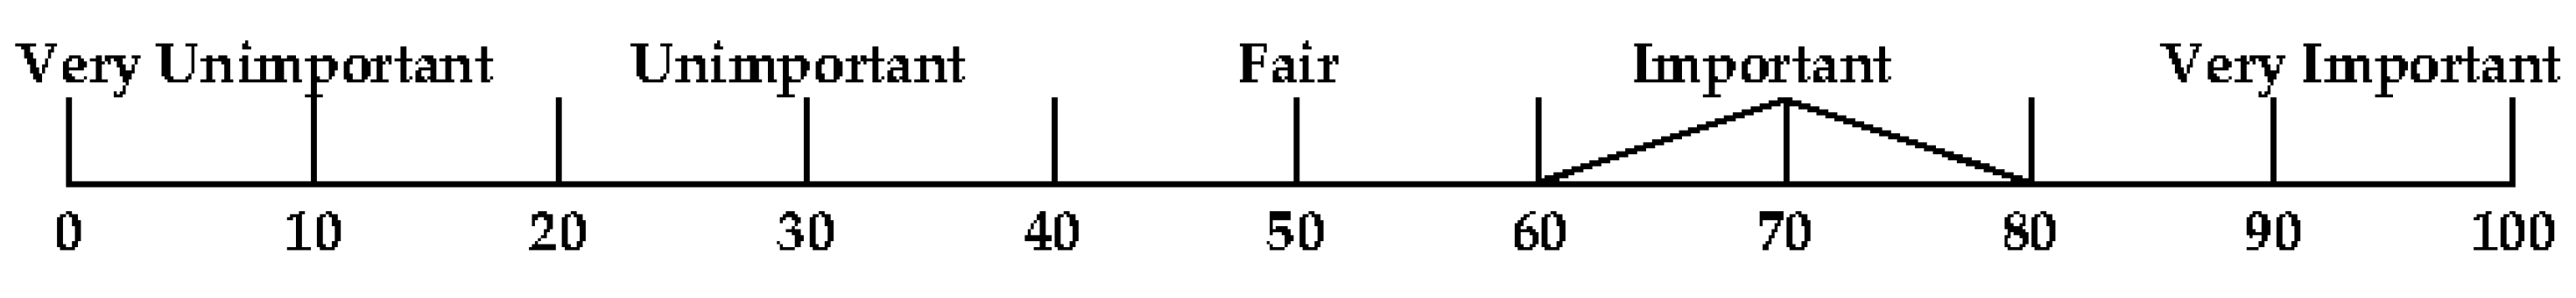
In this study, performance scores ranging from 0 to 100 (very bad ← 0, 10, 20, ..., 90, 100 very good) were used according to natural language (e.g., linguistic/semantic) in the questionnaire, therefore, the aspiration level takes the highest score of 100, and the worst value takes the value of 0. Hence, f j a s p i r e d = 100 is defined as the aspiration level and f j w o r s t = 0 as the worst value; this can prevent “choosing the most effective option from a set of substandard options”. In other words, it can prevent “picking the most effective apple from a barrel of rotten apples”.
Step 2: Determine the mean group utility S k for the gap. S k can be calculated using Equation (12):
S k = j = 1 n w j r k j = j = 1 n w j ( | f j a s p i r e d f k j | ) / ( | f j a s p i r e d f j w o r s t | )
where S k is defined as the normalized ratio of the distance to the aspiration level, which implies the synthesized gaps for the criteria; w j indicates the IWs of the criteria obtained from the DANP (called DANP-V, see Appendix B.4 Modified VIKOR; and r k j indicates the normalized gap (shown as r k j = ( | f j a s p i r e d f k j | ) / ( | f j a s p i r e d f j w o r s t | ) ) of the distance to the aspiration level.
The modified VIKOR method can be used for ranking and selecting alternatives and bridging performance gaps by evaluating all criteria, based on the INRM acquired through systematics, to avoid the “stop-gap piecemeal practice” and “pick the most effective apple from a barrel of rotten apples”. Moreover, it can be used to solve any daily or single problem (i.e., only one problem, no other alternatives) for bridging the performance-gap by considering all perspectives (dimensions) and criteria [81].

4. Empirical Case: TFT-LCD Panel Companies in Taiwan

The proposed model was applied in this study to analyze a case and understand state-of-the-art practices of continuous improvement and sustainable development based on the continual enhancement of a company’s competitiveness. Subsection 4.1 briefly describes the case, Subsection 4.2 explains analysis results, and Subsection 4.3 presents the discussion and implications based on the results. The objective of this study was to provide critical, balanced, and reasonable competitive advantages that enable a decision-maker to develop effective sustainable development strategies for bridging the gaps between the status quo and the aspiration level in each criterion through systematics.

4.1. Case Descriptions

The TFT-LCD panel industry is characterized by (1) high capital requirements, entrance barriers, and exit costs; (2) intensive technology and complicated production processes; (3) short product life cycles; (4) price sensitivity to market demand, supply, and economic cycles; (5) international division of labor; (6) high market concentration; (7) exhaustive structure, facilitating the creation of competitive advantages; (8) material costs constituting a high percentage of total costs; (9) high skilled labor circulation; and (10) highly concentrated ownership of domestic TFT-LCD panel firms [89]. Companies A and I exist in the TFT-LCD industry in the duopoly market in Taiwan. Both face the same competition problems regarding sustainable development and profit orientation, because of customers’ awareness of high sustainability provided by advanced countries. Moreover, they face competition with overseas companies with the same technology level and national resource support (e.g., South Korean competitors) or a raw material advantage (e.g., Japanese competitors). Because of the intense competition with the advanced countries, the effectiveness and efficiency of domestic companies’ resource investment toward sustainable development should be emphasized in Taiwan. Therefore, understanding the practices of Companies A and I and determining their advantages in continuous improvement and sustainable development are crucial tasks for identifying integrated opportunities; newly identified opportunities are necessary for improving the duopoly market in Taiwan.
This study examined decision making in Taiwan’s two leading TFT-LCD companies to identify the most effective performance evaluation model. The elements of the BSC pertaining to sustainable development in the TFT-LCD industry are summarized in Table 3. Companies A and I have four BSC dimensions of sustainable development in their operational practice and competitive advantages related to sustainability.
A visionary enterprise should create long-term plans for continuous improvement and sustainable development. It should demonstrate sustainable competitiveness instead of concentrating only on “cost reduction” orientation. Table 3 provides a comparison of sustainable actions in the two major TFT-LCD corporations; several complementary items are available for continuous improvement and sustainable development in a competitive environment. These companies have an opportunity to cooperate with each other. However, the complementary items cannot be integrated directly because they affect each other. Moreover, establishing effective mutual cooperation between partners to create optimal synergy for continuous improvement and sustainable development is difficult. Therefore, this study considered the short-term survival strategy, cost reduction, long-term development, and resilience of the TFT-LCD companies combined with the BSC concept, balanced development measurements, and the ESG concept for continuous improvement and sustainable development planning, which are aspects required to establish such synergy. However, the interactions and interrelationships of criteria among the BSC dimensions confronting a dilemma of resource allocation in each company for engaging in the sustainability of short- and long-term decision making in a technology-based industry, particularly the TFT-LCD industry; this dilemma is associated with the realization of resource adequacy, even though advanced countries are facing an upswing of consumer awareness about environmental concerns. Therefore, resource integration efficiency is crucial for the future mutual development planning of the two TFT-LCD corporations.

4.2. Results

The new hybrid modified MADM method (Figure 2 and Figure 3 and Equations (1)–(15)) not only retains the original function plan evaluation, but also considers the relationships of interdependence among various criteria of sustainability competitive advantage for the TFT-LCD companies. An INRM (Figure 4) was constructed on the basis of the DEMATEL technique (phase 2 in Figure 2). The INRM illustrates networks of four BSC dimensions integrated with the sustainability concept and comprising 16 criteria for measurement. The pairwise comparison technique was used in the expert questionnaire, and the mean was then calculated as the integration of experts’ opinions.
The average initial direct influence matrix G ( 16 × 16 ) was obtained through pairwise comparisons, indicating the directions of the effects of the criteria on one another; moreover, the normalized direct influence relation matrix D was calculated using Equations (2) and (3). Equation (4) was then used to calculate the total influence matrix T C (Table 4), and Equation (7) was used to calculate the criteria and total influence matrix T D (Table 5) of each dimension. The sum of the total influence, d i and r i , received by each criterion and dimension were derived, as indicated by Equations (5) and (6), respectively. As shown in Table 5 and Table 6, the two total influence matrices can be used to calculate the influences d i + r i and d i r i exerted and received, respectively. The INRM was constructed to guide decision makers in improvement processes; it can be used for addressing the aspiration gaps and to avoid “stop-gap piecemeal practice”.
An examination of Table 6 shows that d i + r i of the Internal Business Processes (D2) dimension is the index of dimensions with the highest strength of influence, the Customer (D3) dimension has the second highest strength of influence, the Learning and Growth (D1) dimension the third highest strength of influence, and the Financial (D4) dimension has the fourth highest strength of influence. This implies that the Internal Business Process (D2) dimension is the most sensitive. Moreover, d i r i showed that the characteristics of the Learning and Growth (D1) and Customer (D3) dimensions belong to the cause dimension, and those of the Internal Business Processes (D2) and Financial (D4) dimensions belong to the affected dimension. Association of d i r i has a significant positive value, implying that this dimension affects the other dimensions, suggesting that it should be a top priority for improvement. The characteristics of the Customer (D3) dimension had the highest degree of impact in a relationship that affected other dimensions.
The INRM not only provides valuable information for making accurate decisions but also provides an initial tool for demonstrating that the degrees of influence differ among the dimensions and criteria. This study used crucial and influential criteria as critical factors to bridge the maximal gap in competitiveness. The Customer (D3) dimension can influence the Learning and Growth (D1), Internal Business Processes (D2), and Financial (D4) dimensions. The Learning and Growth (D1) dimensions can influence Internal Business Processes (D2) and Financial (D4) dimensions. Finally, the Financial (D4) dimension can also impact the Internal Business Processes (D2) dimension interrelationship. This implies that the Customer (D3) dimension is the origin of influence. Thus, when the decision-maker seeks to continually improve strategies, the Customer (D3) dimension must be considered. The rules can be applied to the remaining criteria within each individual dimension.
In the third phase, the relationships between the criteria and the dimensions of IWs were trained using the DANP model. Therefore, the sustainable BSC model had to be structured using the DANP to acquire the weight of each criterion. The unweighted super-matrix based on the DANP (Table 7) was constructed using Equations (8)–(11). The weighted super-matrix (Table 8) was constructed using Equations (12)–(14) to reflect the degrees of influence exerted by various dimensions. The limiting power of the weighted super-matrix was used to reach a long-term stable condition. Each row in Table 9 represents the weights of various criteria (global weights). In the BSC structure, IWs, of the Learning and Growth (D1), Internal Business Processes (D2), Customer (D3), Financial (D4) dimensions were 0.245, 0.276, 0.243 and 0.237, respectively, as shown in Table 10. For TFT-LCD corporations that intend to improve the sustainable development status substantially, the IWs ranking is D2, D1, D3, and D4; this ranking provides a greater understanding of the effect of change. The solution obtained through the DANP method can be applied to the VIKOR method by considering each criterion performance score.
In the fourth phase, the modified VIKOR method integrated the IWs of multiple criteria (called DANP-V) to evaluate performance comprehensively. The score of each criterion and total average gap (Sk) for creating sustainable competence was acquired using the global weights obtained from the DANP (IWs) to bridge the gap ( r k j = | f j a s p i r e d f k j | / | f j a s p i r e d f j w o r s t | ) . The total average performance was determined according to the value, as shown in Table 10. Decision makers can determine problem-solving points according to performance values, either for each perspective or for the perspective of the use of criteria as a basis of ranking. Table 10 presents the performance values (sorted from highest to lowest) and aspiration gap values (sorted from lowest to highest) for the 16 criteria.
The performance of Company I is generally higher than that of Company A in Taiwan. Specifically, three dimensions of Company I are superior to those of Company A: Learning and Growth (D1), Internal Business Processes (D2), and Financial (D4). However, the Customer (D3) dimension of Company A is superior to that of Company I. For both companies, the widest gap was observed for the Financial (D4) dimension. In Company A, the gap between the current and aspiration performance levels is similar in the Learning and Growth (D1), Internal Business Processes (D2), and Customer (D3) dimensions. In Company I, the performance of the Internal Business Processes (D2), Learning and Growth (D1), and Customer (D3) dimension is higher than that of the Financial (D4) dimensions.

4.3. Discussions and Implications

The aspiration level concept was applied to bridge the gaps in each company and to construct a platform of mutual relationships of criteria and dimensions from a general perspective for grasping and eliminating the influence relationships of different organizational characteristics (such as the experts’ conscious preference and the effects of organizational culture). The TFT-LCD industry is knowledge-intensive and highly competitive; therefore, companies require adequate funding for sustainability. The sustainability resource input for organizational development is currently a major problem. However, the companies in the industry do not mutually execute the long-term sustainable development plan, because of the role of market competition. The managers of each company are not involved in cooperation and the impact of sustainability. Therefore, the concept of balance development is not applied further. Balanced development lacks a clear direction to facilitate decision making and simultaneous consideration of multiple criteria. The results of this study can help solve the problem, as shown by the INRM of total influence relationships in Figure 4. DANP-V model analysis can be applied to identify sustainable development strategies, and the results of such an analysis reveal sustainable development strategies that the Taiwanese TFT-LCD panel corporations can employ to create a continual competitive advantage. Implications of competition and coopetition strategies of Companies A and I are discussed as follows, according the results in Table 10.

4.3.1. Status Quo of Sustainable Development Strategy of Company A

Company A is a major TFT-LCD firm in the industry, existing with Company I in the duopoly market in Taiwan. Company A was established in 1998 and specializes in manufacturing TFT-LCD products and various major applications such as notebook computer displays, desktop computer monitors, and digital television screens. Company A is a professional supplier of TFT-LCD panels and solar solutions; it is dedicated not only to product innovation but also to the core values of integrity and introspection, caring and contribution, execution and excellence, and passion and professionalism for sustainable development. It sincerely seeks to collaborate with partners to protect the environment and progress toward the goal of sustainability.

4.3.2. Aspiration Level of Sustainable Development Strategy of Company A

Company A was compared with Company I regarding four BSC dimensions: Company A had a comparative advantage in the Customer (D3) dimension, particularly in the Corporation Green Image (C31) criterion. Within Company A, gaps were observed in the Financial (D4), Internal Business Processes (D2), Learning and Growth (D1), and Customer (D3) dimensions. This implies that the decision-maker should invest resources in executing a sustainable development strategy for reaching an aspiration level that primarily considers finance, particularly the NPR (C44). If this investment results in a major reduction in the NPR, the change in the plan does not succeed.
The improvement priority routes of Company A have one direct path of the Customer (D3) to the Financial (D4) dimension and one indirect path of the Customer (D3) to the Learning and Growth (D1) and to the Financial (D4) dimensions. This implies that the Customer (D3) dimension and Corporation Green Image (C31) and Local Market Regulations (C34) criteria drive Company A’s financial plan regarding the Recycling Costs (C42) and Recovery and Reuse Value (C43) criteria for sustainable development in the short term. In the long term, the Customer (D3) dimension, Corporation Green Image (C31) Local Market Regulations (C34) criteria, and Learning and Growth (D1) dimension gradually enhance the Sustainable Employees Education (C11) criterion for Company A and influence them to select eco-friendly products for sustainable development.

4.3.3. Status Quo of Sustainable Development Strategy of Company I

Company I is a competitive TFT-LCD panel manufacturer that survived a merger period in 2011. Before 2011, this company relied on cost reduction as a profitable solution to maintain a competitive advantage. In 2013, the CEO of Company I, in response to the consumer trends of advanced countries, observed that the deterioration of the living environment is a common challenge: enterprises should use their capacity to reduce the environmental impact of the production process and product to attain sustainable development within the global environment. The responsibility of eco-friendliness and low carbon emissions in the local environment is the vision of Company I’s developed guidelines.
The manager of each plant reminded employees that “For our next generation, they as entrepreneurs must show an active contribution toward energy conservation and emissions reduction. Every small effort should not be missed to ensure the survival of our global environment for all our offspring!” The processes from raw material inputs to the output of products must not harm the environment.

4.3.4. Aspiration Level of Sustainable Development Strategy of Company I

Company I was compared with Company A in four BSC dimensions: Company I exhibited comparative advantages in the Learning and Growth, Internal Business Processes, and Financial dimensions. The Employees Professional Sustainability (C12) and Employee Reaction Competency (C14) criteria in the Learning and Growth (D1) dimension, Resource Material Consumption (C21) and Environmental Management System (C24) criteria in the Internal Business Processes (D2) dimension, and Recovery and Reuse Value (C43) and Net Profit Ratio (NPR) (C44) criteria in the Financial (D4) dimension were superior to those of Company A, for which gaps were observed in the Financial (D4), Internal Business Processes (D2), Learning and Growth (D1), and Customer (D3) dimensions. This implies that the decision-maker should invest in resources for executing a sustainable development strategy for reaching an aspiration level that primarily considers finance, particularly Sustainable Capital Input (C41). If this investment results in a considerable expenditure for sustainable capital input, the change in the plan will not succeed.
The improvement priority routes of Company I have two direct paths: one from the Customer (D3) to the Financial (D4) dimensions and another from the Customer (D3) to the Internal Business Processes (D2) dimensions. This implies that the Customers (D3) dimension and Corporation Green Image (C31) and Local Market Regulations (C34) criteria drive Company A’s financial plan regarding the Recycling Costs (C42) and Recovery and Reuse Value (C43) criteria for sustainable development. Moreover, the Customers (D3) and Corporation Green Image (C31) and Local Market Regulations (C34) criteria also drive Company A’s Internal Business Processes (D2) dimension and the Waste Disposal Capability (C23), Pollution Production Control (C22), and Resource Material Consumption (C21) criteria for sustainable development in the short term.

4.3.5. Implications of Results

According to an analysis of the financial criteria or sustainable investment, Company A faces an insufficient Net Profit Ratio (NPR) (C44), while Company I’s problem is ineffective Sustainable Capital Input (C41). Therefore, the companies can cooperate to form a financial team. Company A can share its investment experience regarding sustainable capital input to assist Company I in improving its sustainable capital input efficiency. Company I should also invest more capital in sustainable development; moreover, it should identify common solutions exclusive of financial efficiency in the short-term strategy.
In its mid-term continually sustainable development strategy planning, Company A can formulate a standard operation process as a reference for Company I. Moreover, employees of both companies must enhance their weakest aspects. The Employee Reaction Competency (C14) criterion indicates that Company A must improve training to reach or exceed Company I’s standard. The Sustainable Management Know-how (C13) criterion indicates that Company I must gain knowledge from the consultants or practitioners of Company A.
In the long-term strategy plan, consumers are expected to emulate the advanced countries’ trend of eco-friendliness. Although Company A has the potential to conform to this trend, it still requires long-term financial support for sustaining the competencies to maintain continually competitive advantages. Conversely, Company I can earn more profit and employ cutting-edge equipment. However, its employees believe that they have lower ability levels than those of the employees of Company A. Therefore, Companies A and I should cooperate with each other to achieve their desired goals. Systematic thinking points that can be formulated in the cooperation between Companies A and I include improving their customers’ perception gaps, defining a strategic improvement roadmap, and combining business and environmental concerns to meet local market regulations with efficient operations.

5. Conclusions

This study successfully integrates sustainability and competitive advantage concepts to formulate the most effective allocation strategies for natural resources. This study considers sustainable competitive advantage as an aspiration level. The transmission characteristics of the TFT-LCD panel industry development guidelines are thus integrated with BSC concepts of environmental responsibility to establish an assessment framework. Through the integration of sustainability, competitive advantage, and BSC, the original four BSC dimensions and characteristics of the TFT-LCD panel industry are consolidated with environmental concepts and condensed into the 16 indicators of the DANP-V model of sustainable competitive advantage. The DANP-V model is refined and debugged and then used to conduct a case study on two Taiwanese TFT-LCD manufacturers, namely Companies A and I.
The findings of the case study are outlined as follows:
(1) Companies A and I show only a small performance gap; the overall performance of Company I (79.66) is higher than that of Company A (79.05), and the performance of Company I is superior to that of Company A in three of four dimensions, namely Learning and Growth (D1), Internal Business Processes (D2), and Financial (D4). However, in the Customer (D3) dimension, Company A is superior to Company I. Furthermore, for both companies, the performance levels on each dimension demonstrate slight advantages and disadvantages. Even though programs do not have easily distinguishable characteristics, the DANP-V method avoids the need to “pick the most effective apple from a barrel of rotten apples”.
(2) The proposed method can identify performance gaps, explain those gaps according to the INRM, and achieve lasting solutions that are not limited by “stop-gap piecemeal practices”. Currently, both companies must improve their performance in the financial dimension to achieve sustainable development and sustainable competitive advantages; cooperation is thus proposed to improve both companies. Nevertheless, the two companies present different criteria gaps. Hence, different strategies are required to improve these two companies; the heterogeneity of the backgrounds and current states of the companies are detailed in Section 4.3.1, Section 4.3.2, Section 4.3.3 and Section 4.3.4, respectively.
Because the TFT-LCD industry has complex processes, a duopoly market, and special technology patterns that induce environmental effects in Taiwan, this and follow-up studies must conform to the limitations of the industry. Follow-up studies may be designed to address loosely defined questions. Because the small- and medium-sized firms of the TFT-LCD panel industry are crucial to Taiwan, future research may focus on challenges specific to Taiwan. However, international manufacturers may use the DANP-V method to examine TFT-LCD manufacturing outside Taiwan. The present research establishes a set of indicators of sustainable competitive advantage for Taiwan. Multinational manufacturers may find that the present indicators are not suitable for other countries.
The special characteristics of Taiwan’s TFT-LCD industry include its complex processes, special environmental effects, and domestic and overseas duopoly markets. Future research may propose a newly modified hybrid of multi-attribute decision making (MADM) and multi-objective decision making (MODM); such research may propose novel improvement strategies to reach aspiration levels. Classical MODM is based on a fixed set of conditions or resources, called the “decision space”, and seeks a Pareto-optimal solution in a fixed feasible region, called the “objective space”. Moreover, future research may propose models with changeable decision spaces and objective spaces to implement and enforce sustainable improvement without being limited to Pareto optimality. Achieving an aspiration level is more useful than achieving Pareto optimality; new MADM solutions may enhance manufacturers’ performance levels for aspiration levels in criteria, dimensions, innovation, and creativity. This new thinking in changeable space programming may help decision makers to achieve win–win planning and to achieve desired aspiration levels that are preferable to Pareto-optimal solutions and ideal points [96,99,100,101,102].

Acknowledgments

The authors are extremely grateful to the Sustainability journal editorial team and reviewers who provided valuable comments for improving the quality of this article. This research was partially supported by grant MOST-104-2410-H-305-052-MY3 of the Ministry of Science and Technology, Taiwan (listed under the title “New concepts and trends of hybrid dynamic MCDM model in developments and its applications”).

Author Contributions

Iuan-Yuan Lu, Tsuanq Kuo and Ting-Syuan Lin provided the research idea and the purpose of this study topic; Gwo-Hshiung Tzeng, Ting-Syuan Lin and Shan-Lin Huang designed the research; Iuan-Yuan Lu, Tsuanq Kuo and Ting-Syuan Lin collected the data; Ting-Syuan Lin and Shan-Lin Huang analyzed the data and wrote the paper; Gwo-Hshiung Tzeng provided the research methods, and supervised, corrected, and revised this paper. All authors have read and approved the final manuscript.

Conflicts of Interest

The authors declare no conflict of interest.

Appendix A

Table A1. The Average Value of Environmental Information 2011–2014 in the TFT-LCD industry.
Item/Year2011201220132014
Energy and Material UseWater Use (million m3)26.1027.4129.2328.91
Power Use (MWh)4,888,8894,817,0904,941,5875,025,675
Diesel (MWh)72,222319832233261
LNG (MWh)110,721114,743123,018129,622
Aluminum Etch (ton)13,129.714,756.716,552.017,670.0
Developer (ton)16,188.618,936.022,378.120,800.8
Diluents (ton)5488.05721.17133.37466.9
Photo Resists (ton)5013.35649.66070.66499.3
Stripper (ton)16,482.012,438.216,108.016,111.0
Liquid Crystal (ton)73.085.362.7101.1
GHG EmissionScope1 (million tCO2e)0.4840.5660.5230.550
Scope2 (million tCO2e)2.8932.8622.8572.887
Scope3 (million tCO2e)0.0000.0000.0130.035
Wastewater DischargeWastewater (m3)19,370,00021,530,00021,895,68721,807,195
COD (ton)1100.02079.31723.22152.7
BOD (ton)30.0556.5334.1703.3
SS (ton)400.068.5621.91003.3
Recycled WaterProcess Water Recycling Rate (%)80.0%83.6%82.8%84.9%
Saved Production Water (ton)53,271,88663,444,36565,154,84069,873,633
Waste DisposalTotal Waste111,855109,936112,364111,264
Air Pollution EmissionVOCs*1 (ton)150170111.2121.5
SOx (ton)11.810.014.115.2
NOx (ton)6.67.89.316.3
Resource: the data extracted from Co. A, & I’s CSR report (2014) [97,98]. Denote: tCO2e is Tonnes of carbon dioxide.
Table A2. The status quo of average employees’ sustainable training in 2014 in TFT-LCD industry.
BasedItemManagers (Section and above)Indirect LaborDirect Labor
FemaleMaleFemaleMaleFemaleMale
ITrained People Hours (a)9134.0250,600.0971,310.02270,317.2087,616.6369,369.61
No. of People in this Category (b)23417532586703614,8669686
Average Training Hours c = a/b39.0328.8627.5838.425.897.16
IITrained People Hours (a)7502.2816,356.1133,961.9982,752.84366,360.241,013,567.68
No. of People in this Category (b)2515882281458915,58030,763
Average Training Hours c = a/b29.8927.8214.8918.0323.5132.95
Resource: the data extracted from Co. A, & I’s CSR report (2014) [97,98].

Appendix B

Appendix B.1. AHP

Figure B1. AHP [100].
Sustainability 08 00646 g005

Appendix B.2. ANP

Figure B2. The structure of AHP [100].
Sustainability 08 00646 g006
Figure B3. The structure of ANP [100].
Sustainability 08 00646 g007

Appendix B.3. DEMATEL-Based Technique to Determine the IWs in DANP (DEMATEL-Based ANP)

For solving actual real-world problems, relaxing some unrealistic assumptions in Statistics and Economics to satisfy real-world constraints is necessary. This study not only used the DEMATEL technique to identify the interrelationships among the sixteen factors, but also sought to obtain more precise IWs that fit real-world problems. Therefore, the IWs of DANP are in line with practical needs; some unreasonable assumptions in the AHP and ANP are relaxed. Saaty [84] proposed an ANP to solve dependence and feedback problems between dimensions (also denoted as clusters) and criteria (inner dimensions/clusters) in diagonal matrices under the assumption that they are independent (zero matrix, W i i = 0 ) or exhibit self-relation (Identity matrix, I). The weighted super-matrix is obtained using equal weights. Saatys’ ANP eliminates the limitations of the AHPnalytic Hierarchy Process (AHP) that assumes that all criteria (inner and outer dimensions/clusters) are independent. The difference between these methods is that the ANP is applied to decision-making problems for interrelationships in outer dimensions, whereas the AHP assumes the independence of outer and inner dimensions (i.e., all dimensions and criteria). Consequently, if there exists an influential interrelationship between dimensions and criteria that is not considered, the outcome of the decisions may be affected. Therefore, we use a new hybrid MADM model developed for improving China’s regional financial center modernization. We adopt the DEMATEL technique through expert knowledge and practical experience to establish an influence relation matrix for constructing an influential network relation matrix (INRM) and determining the IWs of the DANP, which is based on the ANP concept [103,104], to solve practical problems [32,33,92]. Hence, the calculation of the IWs of the DANP involves the following steps as: Step 1: constructing the total influence relation relation matrix T C ; Step 2: determining an un-weighted super-matrix W ; Step 3: obtaining the weighted super-matrix W α ; Step 4: Calculating the limit of the super-matrix W α .

Appendix B.4. Modified VIKOR

We define the optimal f j a s p i r e d values, called “aspiration levels” by Simon, and the lowest f j w o r s t values of all criteria, j = 1 , 2 , ... , n , in our modified VIKOR method by using the following form as the L p -metric:
L k p = { j = 1 n [ w j ( | f j a s p i r e d f k j | ) / ( | f j a s p i r e d f j w o r s t | ) ] p } 1 / p
where 1 p ; k = 1 , 2 , ... , K . The modified VIKOR method can be used not only for ranking and selection, but also for performance gap improvement of each criterion over all alternatives. The method can even be used for performance gap improvement with only one alternative, on the basis of the DEMATEL technique, to construct the INRM (Figure 4) through systematic improvement; therefore, for consistency, the weight w j is also used for the IWs derived from the DANP. The “max–min” normalization benchmark of the traditional VIKOR is replaced by “aspired–worst”, and the ranking and gap measures, L k p = 1 (as E k ) and L k p = (as Q k ), are expressed as follows:
L k p = { j = 1 n [ w j ( | f j f k j | ) / ( | f j f j | ) ] p } 1 / p
L k p = 1 = j = 1 n [ w j ( | f j f k j | ) / ( | f j f j | ) ]
L k p = = max j { ( | f j * f k j | ) / ( | f j * f j | ) | j = 1 , 2 , , n }
where f j * = max k { f k j | k = 1 , 2 , ... , K } and f j = min k { f k j | k = 1 , 2 , ... , K } form the traditional approach. These equations are then rewritten to replace “max–min” with “aspired–worst” as follows:
E k = L k p = 1 = j = 1 n [ w j ( | f j a s p i r e d f k j | ) / ( | f j a s p i r e d f j w o r s t | ) ]
Q k = L k p = = max j { ( | f j a s p i r e d f k j | ) / ( | f j a s p i r e d f j w o r s t | ) | j = 1 , 2 , , n }
The compromise solution min k L k p shows that the synthesized and integrated gap is the minimum. Consequently, it is ranked and selected, and it is improved, so that its value is sufficiently close to the aspirational level. In addition, the group utility (called the average gap or average degree of regret) is emphasized when the value of p is low (such as p = 1 ); however, if p is infinite (i.e., p = ), then the individual maximal regrets and gaps gain prominence in prior improvements. In other words, in the basic DANP-modified VIKOR method, the solution is shown by minimizing the average gap; however, min k Q k stresses selecting the kth minimum of the maximal individual regrets and gaps (shown by the maximal gap for prior improvement). The compromise-ranking/selection and DANP-modified VIKOR improvement methods follow the steps in the manuscript.

References

  1. Ghazi, N.F.; Yildirim, M.B. A sustainability approach for selecting maintenance strategy. Int. J. Sustain. Eng. 2013, 6, 332–343. [Google Scholar]
  2. Drucker, P.F. The coming of the new organization. Harv. Bus. Rev. 1988, 66, 45–53. [Google Scholar]
  3. Normann, R.; Ramfrez, R. From value chain to value constellation: Designing interactive strategy. Harv. Bus. Rev. 1993, 71, 65–77. [Google Scholar] [PubMed]
  4. Lin, M.H.; Hu, J.Y.; Tseng, M.L.; Chiu, A.S.F.; Lin, C. Sustainable development in technological and vocational higher education: Balanced scorecard measures with uncertainty. J. Clean. Prod. 2016, 120, 1–12. [Google Scholar] [CrossRef]
  5. Chen, F.H.; Hsu, T.S.; Tzeng, G.H. A balanced scorecard approach to establish a performance evaluation and relationship model for hot spring hotels based on a hybrid MCDM model combining DEMATEL and ANP. Int. J. Hosp. Manag. 2011, 30, 908–932. [Google Scholar] [CrossRef]
  6. Simon, H.A. Theories of decision-making in economics and behavioral science. Am. Econ. Rev. 1959, 49, 253–283. [Google Scholar]
  7. Lee, Z.Y.; Pai, C.C. Operation analysis and performance assessment for TFT-LCD manufacturers using improved DEA. Expert Syst. Appl. 2011, 38, 4014–4024. [Google Scholar] [CrossRef]
  8. Hung, S.W.; Tsai, J.M.; Cheng, M.J.; Chen, P.C. Analysis of the development strategy of late-entrants in Taiwan and Korea’s TFT-LCD industry. Technol. Soc. 2012, 34, 9–22. [Google Scholar] [CrossRef]
  9. Gregson, N.; Crang, M. From waste to resource: The trade in wastes and global recycling economies. Annu. Rev. Environ. Resour. 2015, 40, 151–176. [Google Scholar] [CrossRef] [Green Version]
  10. Govindan, K.; Seuring, S.; Zhu, Q.; Azevedo, S. gement and governance structures. J. Clean. Prod. 2016, 112, 1813–1823. [Google Scholar] [CrossRef]
  11. Kaplan, R.S.; Norton, D.P. The balanced scorecard-measures that drive performance. Harv. Bus. Rev. 1992, 1, 70–80. [Google Scholar]
  12. Ruf, B.M.; Muralidhar, K.; Paul, K. The development of a systematic, aggregate measure of corporate social performance. J. Manag. 1998, 24, 119–133. [Google Scholar] [CrossRef]
  13. Agle, B.R.; Kelley, P.C. Ensuring validity in the measurement of corporate social performance: Lessons from corporate united way and PAC campaigns. J. Bus. Ethics 2001, 31, 271–284. [Google Scholar] [CrossRef]
  14. Hsu, Y.L.; Liu, C.-C. Environmental performance evaluation and strategy management using balanced scorecard. Environ. Monit. Assess. 2010, 170, 599–607. [Google Scholar] [CrossRef] [PubMed]
  15. Pereira-Moliner, J.; Claver-Cortés, E.; Molina-Azorín, J.F.; Tarí, J.J. Quality management, environmental management and firm performance: Direct and mediating effects in the hotel industry. J. Clean. Prod. 2012, 37, 82–92. [Google Scholar] [CrossRef]
  16. Gadenne, D.; Mia, L.; Sands, J.; Winata, L.; Hooi, G. The influence of sustainability performance management practices on organizational sustainability performance. J. Account. Organ. Chang. 2012, 8, 210–235. [Google Scholar] [CrossRef]
  17. Grosvold, J.; Hoejmose, S.U.; Roehrich, J.K. Squaring the circle: Management, measurement and performance of sustainability in supply chains. Supply Chain Manag. Int. J. 2014, 19, 292–305. [Google Scholar]
  18. Morioka, S.N.; Carvalho, M.M. A systematic review towards a conceptual framework for integrating sustainability performance in to business. J. Clean. Prod. 2016, in press. [Google Scholar]
  19. Yami, S.; Castaldo, S.; Dagnino, G.; Roy, F. Coopetition: Winning Strategies for the 21th Century; Edward Elgar Publishing Limited: Cheltenham, UK, 2010. [Google Scholar]
  20. Kaplan, R.; Norton, D. The Balanced Scorecard: Translating Strategy into Action; Harvard Business Press: Cambridge, MA, USA, 1996. [Google Scholar]
  21. Kaplan, R.; Norton, D. Why system, not structure, is the way toward strategic alignment: A historical perspective. Balanced Scorec. Rep. 2006, 8, 1–5. [Google Scholar]
  22. Agrawal, S.; Singh, R.K.; Murtaza, Q. Outsourcing decisions in reverse logistics: Sustainable balanced scorecard and graph theoretic approach. Resour. Conserv. Recycl. 2016, 108, 41–53. [Google Scholar] [CrossRef]
  23. Brunner, M. Strategisches Nachhaltigkeits-Management in der Automobilindustrie. Eine Empirische Untersuchung (Strategic Sustainability Management in the Automotive Industry. An Empirical Study); Deutscher Universitats-Verlag: Wiesbaden, Germany, 2006. (In Germany) [Google Scholar]
  24. Epstein, M.J.; Roy, M.J. Sustainability in Action: Identifying and measuring the key performance drivers. Long Range Plan. 2001, 34, 585–604. [Google Scholar] [CrossRef]
  25. Klettner, A.; Clarke, T.; Boersma, M. The governance of corporate sustainability: Empirical insights into the development, leadership and implementation of responsible business strategy. J. Bus. Ethics 2014, 122, 145–165. [Google Scholar] [CrossRef]
  26. Porter, M.E. Competitive Strategic: Techniques for Analyzing Industries and Competitors; Free Press: New York, NY, USA, 1980. [Google Scholar]
  27. Shen, K.Y.; Yan, M.R.; Tzeng, G.H. Combining VIKOR-DANP model for glamor stock selection and stock performance improvement. Knowl.-Based Syst. 2014, 58, 86–97. [Google Scholar] [CrossRef]
  28. Liu, C.H.; Tzeng, G.H.; Lee, M.H.; Lee, P.Y. Improving metro-airport connection service for tourism development: Using hybrid MCDM models. Tour. Manag. Perspect. 2013, 6, 95–107. [Google Scholar] [CrossRef]
  29. Liou, J.H.; Tsai, C.Y.; Lin, R.H.; Tzeng, G.H. A modified VIKOR multiple-criteria decision method for improving domestic airlines service quality. J. Air Transp. Manag. 2011, 17, 57–61. [Google Scholar] [CrossRef]
  30. Liou, J.H.; Tzeng, G.H. Comments on “multiple criteria decision making (MCDM) methods in Economics: An overview”. Technol. Econ. Dev. Econ. 2012, 18, 672–695. [Google Scholar] [CrossRef]
  31. Chiu, W.Y.; Tzeng, G.H.; Li, H.L. Developing e-store marketing strategies to satisfy customers’ needs using a new hybrid gray relational model. Int. J. Inf. Technol. Decis. Mak. 2014, 13, 231–261. [Google Scholar] [CrossRef]
  32. Hu, K.H.; Chen, F.H.; Tzeng, G.H.; Lee, J.D. Improving corporate governance effects on an enterprise crisis based on a new hybrid DEMATEL with the MADM model. J. Test. Evaluation 2015, 43, 1394–1412. [Google Scholar] [CrossRef]
  33. Huang, K.W.; Huang, J.H.; Tzeng, G.H. New hybrid multiple attribute decision-making model for improving competence sets: Enhancing a company’s core competitiveness. Sustainability 2016, 8, 175–203. [Google Scholar]
  34. European Commission. The European Commission, 2010-14: Profiles and Priorities; Publications Office of the European Union: Luxembourg, Luxembourg, 2010. [Google Scholar]
  35. Kuo, N.W.; Hsiao, T.Y. An exploratory research of the application of natural capitalism to sustainable tourism management in Taiwan. J. Clean. Prod. 2008, 16, 116–124. [Google Scholar] [CrossRef]
  36. Werner, T.; Weckenmann, A. Sustainable quality assurance by assuring competence of employees. Measurement 2012, 45, 1534–1539. [Google Scholar] [CrossRef]
  37. Bai, C.; Sarkis, J. Green supply chain technology: A comprehensive evaluation and justification multi-attribute decision modeling approach. Stud. Fuzziness Soft Comput. 2014, 313, 655–679. [Google Scholar]
  38. Sharma, V.; Garg, S.K.; Sharma, P.B. Identification of major drivers and road blocks for remanufacturing in India. J. Clean. Prod. 2014, 112, 1882–1892. [Google Scholar] [CrossRef]
  39. Drakaki, M. The role of the professional culture manager in the creation, development and sustainability of a museum: The case of the museum of school life of the municipality of Chania. Procedia Soc. Behav. Sci. 2014, 147, 327–331. [Google Scholar] [CrossRef]
  40. Teece, D. Strategies for managing knowledge assets: The role of firm structure and industrial context. Long Range Plan. 2000, 33, 35–54. [Google Scholar] [CrossRef]
  41. González-Torre, P.; A’lvarez, M.; Sarkis, J.; Adenso-Díaz, B. Barriers to the implementation of environmentally oriented reverse logistics: Evidence from the automotive industry sector. Br. J. Manag. 2010, 21, 889–904. [Google Scholar] [CrossRef]
  42. Pozas, O.H.; Jauregui, K.L. A snapshot of training practices in Peru. Estud. Gerenc. 2012, 28, 67–85. [Google Scholar] [CrossRef]
  43. Nikolaou, I.E.; Tsalis, T.A. Development of a sustainable, balanced scorecard framework. Ecol. Indic. 2013, 34, 76–86. [Google Scholar] [CrossRef]
  44. Govindan, K.; Khodaverdi, R.; Jafarian, A. A fuzzy multi criteria approach for measuring sustainability performance of a supplier based on triple bottom line approach. J. Clean. Prod. 2013, 47, 345–354. [Google Scholar] [CrossRef]
  45. González-Torre, P.; A’lvarez, M.; Sarkis, J.; Adenso-Díaz, B. Barriers to the implementation of environmentally oriented reverse logistics: Evidence from the automotive industry sector. Br. J. Manag. 2010, 21, 889–904. [Google Scholar] [CrossRef]
  46. Pozas, O.H.; Jauregui, K.L. A snapshot of training practices in Peru. Estud. Gerenc. 2012, 28, 67–85. [Google Scholar] [CrossRef]
  47. Knemeyer, M.; Ponzurick, T.G.; Logar, C.M. A qualitative examination of factors affecting reverse logistics systems for end-of-life computers. Int. J. Phys. Distrib. Logist. Manag. 2002, 32, 455–479. [Google Scholar] [CrossRef]
  48. Presley, A.; Meade, L.; Sarkis, J. A strategic sustainability justification methodology for organizational decisions: A reverse logistics illustration. Int. J. Prod. Res. 2007, 45, 4595–4620. [Google Scholar] [CrossRef]
  49. Lai, K.; Wu, S.J.; Wong, C.W.Y. Did a reverse logistics practices hit the triple bottom line of Chinese manufacturers? Int. J. Prod. Econ. 2013, 146, 106–117. [Google Scholar] [CrossRef]
  50. EUROMAP Injection Moulding. Machines Determination of Machine Related Energy Efficiency Class-Part I, 3rd ed.; VDMA Verlag: Frankfurt, Germany, 2013; Volume 60, pp. 1–12. [Google Scholar]
  51. EUROMAP Injection Moulding. Machines Determination of Machine Related Energy Efficiency Class-Part II, 3rd ed.; VDMA Verlag: Frankfurt, Germany, 2013; Volume 60, pp. 1–7. [Google Scholar]
  52. Chen, Y.J. Structured methodology for supplier selection and evaluation in a supply chain. Inf. Sci. 2011, 181, 1651–1670. [Google Scholar] [CrossRef]
  53. Kuo, R.J.; Wang, Y.C.; Tien, F.C. Integration of artificial neural network and MADA methods for green supplier selection. J. Clean. Prod. 2010, 18, 1161–1170. [Google Scholar] [CrossRef]
  54. Büyüközkan, G.; Berkol, C. Designing a sustainable supply chain using an integrated analytic network process and goal programming approach in quality function deployment. Expert Syst. Appl. 2011, 38, 13731–13748. [Google Scholar] [CrossRef]
  55. Dirckinck-Holmfeld, K. The options of local authorities for addressing climate change and energy efficiency through environmental regulation of companies. J. Clean. Prod. 2015, 98, 175–184. [Google Scholar] [CrossRef]
  56. Liu, H.T.; Wang, W.K. An integrated fuzzy approach for provider evaluation and selection in third party logistics. Expert Syst. Appl. 2009, 36, 4387–4398. [Google Scholar] [CrossRef]
  57. Tseng, M.L.; Chiu, A.S.F. Evaluating firm’s green supply chain management in linguistic preferences. J. Clean. Prod. 2013, 40, 22–31. [Google Scholar] [CrossRef]
  58. Rusko, M.; Sablik, J.; Markova, P.; Lach, M.; Friedrich, S. Sustainable development, quality management system and environmental management system in Slovak Republic. Procedia Eng. 2014, 69, 486–491. [Google Scholar] [CrossRef]
  59. Govindan, K.; Khodaverdi, R.; Jafarian, A. A fuzzy multi criteria approach for measuring sustainability performance of a supplier based on triple bottom line approach. J. Clean. Prod. 2013, 47, 345–354. [Google Scholar] [CrossRef]
  60. Ravi, V.; Shankar, R.; Tiwari, M.K. Analyzing alternatives in reverse logistics for end-of-life computers: ANP and balanced scorecard approach. Comput. Ind. Eng. 2005, 48, 327–356. [Google Scholar] [CrossRef]
  61. Muller, A.; Kolk, A. CSR performance in emerging markets evidences from Mexico. J. Bus. Ethics 2009, 85, 325–337. [Google Scholar] [CrossRef]
  62. Parast, M.M.; Adams, S.G. Corporate social responsibility, benchmarking, and organizational performance in the petroleum industry: A quality management perspective. Int. J. Prod. Econ. 2012, 139, 447–458. [Google Scholar] [CrossRef]
  63. Boone, T.; Jayaraman, V.; Ganeshan, R. Sustainable Supply Chains: Models, Methods, and Public Policy Implications; Springer: New York, NY, USA; London, UK, 2012. [Google Scholar]
  64. Boztepe, A. Green marketing and its impact on consumer buying behavior. Eur. J. Econ. Political Stud. 2012, 5, 5–21. [Google Scholar]
  65. Thogersen, J.; Jorgensen, A.; Sandager, S. Consumer decision-making regarding a “green” everyday product. Psychol. Mark. 2012, 29, 187–197. [Google Scholar] [CrossRef]
  66. Kikuchi-Uehara, E.; Nakatani, J.; Hirao, M. Analysis of factors influencing consumers’ pro-environmental behavior based on life cycle thinking. Part I: Effect of environmental awareness and trust in environmental information on product choice. J. Clean. Prod. 2016, 117, 10–18. [Google Scholar] [CrossRef]
  67. Warnock, D. The International Business Environment: A Handbook for Managers and Executives; CRC Press: Boca Raton, FL, USA, 2015. [Google Scholar]
  68. Kaplan, R.S. Measuring manufacturing performance: A new challenge for managerial accounting research. Account. Rev. 1983, 58, 686–705. [Google Scholar]
  69. Jacobs, B.W.; Singhal, V.R.; Subramanian, R. An empirical investigation of environmental performance and the market value of the firm. J. Oper. Manag. 2010, 28, 430–441. [Google Scholar] [CrossRef]
  70. Senthil, S.; Srirangacharyulu, B.; Ramesh, A. A robust hybrid multi-criteria decision making methodology for contractor evaluation and selection in third-party reverse logistics. Expert Syst. Appl. 2014, 41, 50–58. [Google Scholar] [CrossRef]
  71. Woo, C.; Chung, Y.; Chun, D.; Seo, H.; Hong, S. The static and dynamic environmental efficiency of renewable energy: A Malmquist in index analysis of OECD countries. Renew. Sustain. Energy Rev. 2015, 47, 367–376. [Google Scholar] [CrossRef]
  72. Meade, L.; Sarkis, J. A conceptual model for selecting and evaluating third party reverse logistics providers. Supply Chain Manag. 2002, 7, 283–295. [Google Scholar] [CrossRef]
  73. Kannan, G.; Pokharel, S.; Kumar, P.S. A hybrid approach using ISM and fuzzy TOPSIS for the selection of reverse logistics provider. Resour. Conserv. Recycl. 2009, 54, 28–36. [Google Scholar] [CrossRef]
  74. Nagalingam, S.V.; Kuik, S.S.; Amer, Y. Performance measurement of product returns with recovery for sustainable manufacturing. Robot. Comput.-Integr. Manuf. 2013, 29, 473–483. [Google Scholar]
  75. Madaan, J.; Chan, F.T.S.; Niu, B. Strategies for evaluating performance of flexibility in product recovery system. Int. J. Prod. Res. 2015, 7, 1–12. [Google Scholar] [CrossRef]
  76. Otegbeye, M.; Abdel-Malek, L.; Hsieh, H.N.; Meegoda, J.N. On achieving the state’s household recycling target: A case of northern New Jersey, USA. Waste Manag. 2009, 29, 647–654. [Google Scholar] [CrossRef] [PubMed]
  77. Gunasekaran, A.; McGaughey, R.E.; Ngai, E.W.T.; Rai, B. E-procurement adoption in the south coast SMEs. Int. J. Prod. Econ. 2009, 122, 161–175. [Google Scholar] [CrossRef]
  78. Cherington, P.T. Advertising as a business force. In Doubleday, Page for the Associated Advertising Clubs of America; Doubleday: New York, NY, USA, 1913. [Google Scholar]
  79. Bai, C.; Sarkis, J. Flexibility in reverse logistics: A framework and evaluation approach. J. Clean Prod. 2013, 47, 306–318. [Google Scholar] [CrossRef]
  80. Tan, A.W.K.; Yu, W.S.; Kumar, A. Improving the performance of a computer company in supporting its reverse logistics operations in the Asia-Pacific region. Int. J. Phys. Distrib. Logist. Manag. 2003, 33, 59–74. [Google Scholar]
  81. Mathiyazhagan, K.; Diabat, A.; Al-Refaie, A.; Xu, L. Application of analytical hierarchy process to evaluate pressures to implement green supply chain management. J. Clean. Prod. 2015, 107, 229–236. [Google Scholar] [CrossRef]
  82. Pick, D.; Zielke, S. How electricity providers communicate price increases-a qualitative analysis of notification letter. Energy Policy 2015, 86, 303–314. [Google Scholar] [CrossRef]
  83. Mazzanti, M.; Zoboli, R. Economic instruments and induced innovation: The European policies on end-of-life vehicles. Ecol. Econ. 2006, 58, 318–337. [Google Scholar] [CrossRef]
  84. Lebreton, B.; Tuma, A. A quantitative approach to assessing the profitability of car and truck tire remanufacturing. Int. J. Prod. Econ. 2006, 104, 639–652. [Google Scholar] [CrossRef]
  85. Holm, M.; Kumar, V.; Plenborg, T. An investigation of customer accounting systems as a source of sustainable competitive advantage. Adv. Account. 2016, in press. [Google Scholar]
  86. Miller, D; Breton-Miller, I.L. Why do some family businesses, out-compete? Governance, long-term orientations, and sustainable capability. Entrep. Theory Pract. 2006, 30, 731–746. [Google Scholar]
  87. Luthra, S.; Garg, D.; Haleem, A. An analysis of interactions among critical success factors to implement green supply chain management towards sustainability: An Indian perspective. Resour. Policy 2015, 46, 37–50. [Google Scholar] [CrossRef]
  88. Diabat, A.; Kannan, D.; Mathiyazhagan, K. Analysis of enablers for implementation of sustainable supply chain management—A textile case. J. Clean. Prod. 2014, 83, 391–403. [Google Scholar] [CrossRef]
  89. Mathiyazhagan, K.; Haq, A.N. Analysis of the influential pressures for green supply chain management adoption an Indian perspective using interpretive structural modeling. Int. J. Adv. Manuf. Technol. 2013, 68, 817–833. [Google Scholar] [CrossRef]
  90. Lee, A.H.I.; Kang, H.Y.; Hsu, C.F.; Hung, H.C. A green supplier selection model for high-tech industry. Expert Syst. Appl. 2009, 36, 7917–7927. [Google Scholar] [CrossRef]
  91. Ramkumar, M.; Jenamani, M. Sustainability in supply chain through E-procurement-An assessment framework based on DANP and liberatore score. IEEE Syst. J. 2015, 9, 1554–1564. [Google Scholar] [CrossRef]
  92. Chen, F.H.; Tzeng, G.H. Probing organization performance using a new hybrid dynamic MCDM method based on the balanced scorecard approach. J. Test. Evaluation 2015, 43, 1–14. [Google Scholar] [CrossRef]
  93. Liou, J.J.H.; Tamosaitiene, J.; Zavadskas, E.; Tzeng, G.H. A new hybrid COPRAS-G MADM model for improving and selecting suppliers in green supply chain management. Int. J. Prod. Res. 2016, 54, 114–134. [Google Scholar] [CrossRef]
  94. Hu, K.H.; Wei, J.; Tzeng, G.H. Improving China’s regional financial center modernization development using new hybrid MADM model. Tech. Econ. Dev. Econ. 2016, in press. [Google Scholar]
  95. Chou, S.Y.; Yu, C.C.; Tzeng, G.H. A Novel Hybrid MCDM Procedure for Achieving Aspired Earned Value Management Applications. Math. Probl. Eng. 2016, in press. [Google Scholar]
  96. Huang, J.J.; Tzeng, G.H. Generalized DEMATEL technique with centrality measurements. Technol. Econ. Dev. Econ 2016, in press. [Google Scholar]
  97. AUO Optronics Corp. CSR report. Hsinchu, Taiwan, 2016. Available online: http://www.auo.com.tw/?sn=101&lang=en-US (accessed on 4 July 2016).
  98. Innolux Optronics Corp. CSR report. Hsinchu, Taiwan, 2016. Available online: http://www.innolux.com/Pages/TW/CSR_TW.htm (accessed on 4 July 2016).
  99. Tzeng, G.H.; Huang, K.W.; Lin, C.W.; Yuan, B.J.C. New idea of multi-objective programming with changeable spaces for improving the unmanned factory planning. In Proceedings of the 2014 PICMET’14: Portland International Center for Management of Engineering and Technology, Infrastructure and Service Integration, Kanazawa, Japan, 27–31 July 2014; pp. 564–570.
  100. Tzeng, G.H.; Huang, J.J. Multiple Attribute Decision Making: Methods and Applications; CRC Press, Taylor & Francis Group: Boca Raton, FL, USA, 2011; p. 349. [Google Scholar]
  101. Tzeng, G.H.; Huang, J.J. Fuzzy Multiple Objective Decision Making; CRC Press, Taylor & Francis Group: Boca Raton, FL, USA, 2013. [Google Scholar]
  102. Tzeng, G.H.; Kao-Yi Shen, K.Y. New Concepts and Trends of Hybrid Multiple Criteria Decision Making; CRC Press, Taylor & Francis Group: Boca Raton, FL, USA, 2016; in press. [Google Scholar]
  103. Saaty, T.L. What is the analytic hierarchy process? Math. Models Decis. Support 1988, 48, 109–121. [Google Scholar]
  104. Saaty, T.L. Decision Making with Dependence and Feedback: Analytic Network Process; RWS Publications: Pittsburgh, PA, USA, 1996. [Google Scholar]
Figure 1. Linguistic and range of importance level.
Sustainability 08 00646 g001
Figure 2. Procedures of the new MADM model for achieving the best effectiveness of sustainable improvement strategies.
Sustainability 08 00646 g002
Figure 3. Procedures of the new hybrid MADM (multiple attribute decision-making) for effective sustainable improvement strategies that enhance competitive advantages (in the TFT-LCD industry).
Sustainability 08 00646 g003
Figure 4. The INRM (influential network relation map) of total influence relationships.
Sustainability 08 00646 g004
Table 1. The performance evaluation factors (criteria) for the pre-test questionnaire.
Perspectives (Dimensions)/Factors (Criteria)
Learning and GrowthInternal Business ProcessesCustomerFinancial
Sustainable Employees EducationResource Material ConsumptionCorporation Green ImageSustainable Capital Input
Employee Professional SustainabilityPollution Production ControlGreen Logistic ManagementRecycling Cost
Sustainable Management Know-howWaste Disposal CapabilityConsumers’ Environmental AwarenessRecovery and Reuse Value
Employee Reaction CompetencyEnvironmental Management SystemLocal Market RegulationsNet Profit Ratio (NPR)
Note: The shade is to distinguish the Dimensions, criteria for reader easier to read. Resource: [10,11,33,34,35,36,37,38,39,40,41,42,43,44,45,46,47,48,49,50,51,52,53,54,55,56,57,58,59,60,61,62,63,64,65,66,67,68,69,70,71,72,73,74,75,76,77,78].
Table 2. Descriptions of dimensions and criteria.
DimensionCriteriaDescriptionsAuthors
Learning and growthSustainable Employees EducationCarry out employees’ environment, protect training and education embedded in their domain knowledge[1,35,36,37,38]
Employee Professional SustainabilityEmployees’ professional skills and ability in running the environment protect workflow[1,37,39]
Sustainable Management Know-howThe management expertise and other know-how we need to facilitate employees’ research and development to effect a sustainable solution[38,40,41,42]
Employee Reaction CompetencyThe competence of the employees pertaining to dealing with pollution emergencies occurs[1,37,43,79]
Internal business processesResource Material ConsumptionResource and raw material consumption in terms of ecology protection consideration during the purchasing processes[1,10,41,47,48,49,50,51,52]
Pollution Production ControlThe average volume of air emission pollutant, waste liquid, solid wastes and harmful materials released per day during manufacturing processes[1,10,53,54,55]
Waste Disposal CapabilityCapability of ensuring safety and protecting the environment through proper disposal of wastes[10,47,48,49,80]
Environmental Management SystemEnvironmental certifications like ISO 14000 and EMAS, environmental policies, planning of environmental objectives, checking and control of environmental activities[1,10,56,57,58]
CustomerCorporation Green ImageMarket reputation of the enterprise and environmentalprotection image among the public[59,60,61,62,81]
Green Logistic ManagementGreen vehicles and packaging used to transport the products to customers[1,47,54,59,63]
Consumer Environmental AwarenessGreen promotions, green features of the product, and environmental awareness related to the particular environmentally-friendly products purchase preference[1,59,64,65,66]
Local Market RegulationsConsumers’ choice is given local market regulations restriction[59,67,82]
FinancialSustainable Capital InputThe capital investment requirement for inspection/remanufacturing/recycling equipment, transport facility and infrastructure, includes IT infrastructure related to sustainable development[1,48,69,70,71,78]
Recycling CostCosts related to recycling of resources[1,70,76,77]
Recovery and Reuse ValueReuse value from plant’s waste recovery resource[1,60,72,73,74,75]
Net Profit Ratio (NPR)Current period, net profit/revenue income[11,68]
Note: The shade is to distinguish the Dimensions, criteria for reader easier to read. Resource: The results of the literature review.
Table 3. The action of sustainable advantage comparison of Co. A and I.
Pers.CriteriaCo. ACo. I
Learning and GrowthSustainable Employees EducationCreating Sustainable Schools, Occupational Health and Safety, Community Participation and Charity, Talent Cultivation, Healthy WorkplaceRecruiting and Retaining Talent, Employing Staff with Physical Disabilities, Wages and Benefits
Employee Professional SustainabilityESH training, Occupational Health and Safety Management, Promoting the Green Education and Training of Employees and Suppliers, Occupational Hazard ManagementLean Green Production, Material Flow Cost Accounting, ESH training, Occupational Health and Safety Management, Occupational Hazard Management
Sustainable Management Know-howNontoxic Product Designs, QC080000 Certification, Mercury Management EffectivenessEnergy-saving Design, Product Material Reduction Design
Employee Reaction CompetencyA real-time, active warning systemA real-time, active warning system, Ergonomic Risk Prevention and Management
Internal Business ProcessesResource Material ConsumptionEnergy (Electricity, Solar Power, Natural Gas, Diesel)Green Material (Glass Substrate, Liquid Crystal, Aluminum Etch, Developer, Diluents, Photo Resists, Stripper) Water(Municipal Water, Rainwater)
Pollution Production ControlAir Pollution Emission (GHG emission, VOCs, SOx) 1Waste Liquid Purify (Waste Water, COD, BOD, SS) 1
Waste Disposal CapabilityHazardous Waste TreatmentNon-Hazardous Waste Disposal
Environmental Management SystemISO 14001, LEED, Rohs, EC, certifications.ISO 14001, LEED, Rohs, EC, certifications, EMAS environmental management system
CustomerCorporation Green ImageMarket reputation, Culture and art activity promotion, Scholarships, supplier response rate exceeded 98%, Energy Management ConstructionsSponsoring Environmental activity, Energy Management Constructions
Green Logistic ManagementPackaging Material ReductionGreen Vehicles, Reverse Logistic Management
Consumer Environmental AwarenessZero Distance CommunicationEnvironmentally-friendly product purchase preference, Electronic Media, Visual Management
Local Market RegulationsInternational Conventions, Local Regulations, etc.International Conventions, Local Regulations, etc.
FinanceSustainable Capital InputEnvironment, Society and Governance (ESG) balance with production, Prevention Equipment
Recycling CostIncineration, Landfill, Recycling
Recovery and Reuse ValueStripper Recycling RateN-Methyl-2-Pyrrolidone, PGMEA Recycling Rate, TMAH Recycling Rate.
Net Profit Ratio (NPR) Current period, net profit, revenue income
Resource: The authors extract from CSR report of Co. A. and Co. I. with Table A1 and Table A2. [97,98]; 1: VOCs denotes “Volatile Organic Compounds”; COD denotes “Chemical Oxygen Demand”; SS denotes “Suspended Solids”.
Table 4. Total influence matrix T (i.e., T C ): sixteen criteria.
CriteriaC11C12C13C14C21C22C23C24C31C32C33C34C41C42C43C44
C110.320.400.410.420.450.470.430.420.450.420.330.340.390.370.370.27
C120.390.330.400.420.430.460.440.430.440.420.330.330.380.370.350.26
C130.400.410.360.430.450.470.450.440.460.430.360.360.430.420.400.28
C140.400.420.440.380.470.500.490.460.470.450.370.380.450.450.410.30
C210.360.370.380.400.380.460.450.420.430.420.340.350.420.410.380.29
C220.380.400.420.430.460.420.470.450.460.440.350.360.450.430.410.31
C230.390.400.410.420.450.480.390.430.440.430.340.360.430.420.400.30
C240.410.420.430.460.490.490.470.400.470.460.370.380.470.440.420.31
C310.420.410.420.430.460.490.460.450.400.450.370.370.450.430.410.31
C320.400.410.420.430.460.480.460.450.470.390.370.380.440.430.410.32
C330.390.390.400.400.450.460.450.430.460.430.300.370.450.420.400.31
C340.420.420.440.440.490.510.480.480.480.470.400.340.480.460.430.34
C410.370.380.410.420.470.470.450.440.450.430.340.370.380.440.410.32
C420.360.370.400.410.440.460.430.420.430.420.330.360.430.360.410.31
C430.330.340.360.360.410.420.410.400.390.390.320.330.390.400.310.29
C440.260.290.300.300.320.350.320.310.320.310.260.270.330.320.300.19
Table 5. Total influence matrix TD: four Dimensions.
DimensionsD1D2D3D4 d i r i d i + r i d i r i
D1 Learning and Growth0.3950.4530.3970.371.6151.5693.1850.046
D2 Internal Business Processes0.4040.4440.4010.3931.6421.7713.414−0.129
D3 Customer0.4150.4670.4040.4051.6911.5593.250.132
D4 Financial0.3550.4070.3580.3491.4691.5182.986−0.049
Table 6. The sum of the influences given and received on the dimensions and criteria.
Dimensions/Criteria d i r i d i + r i d i r i
Learning and growth (D1)1.6151.5693.185 (3)0.046
Employees Sustainable Education (C11)1.5551.5083.0630.047
Employees Professional Sustainability (C12)1.5301.5653.095−0.035
Sustainable Management Knowhow (C13)1.5971.6053.203−0.008
Employee Reaction Competency (C14)1.6441.6483.291−0.004
Internal business processes (D2)1.6421.7713.414 (1)−0.129
Resource Material Consumption (C21)1.7111.7763.486−0.065
Pollution Production Control (C22)1.7941.8473.641−0.053
Waste Disposal Capability (C23)1.7501.7823.533−0.032
Environmental Management System (C24)1.8541.7033.5570.150
Customer (D3)1.6911.5593.250 (2)0.132
Corporation’s Green Image (C31)0.4001.8182.218−1.418
Green Logistic Management (C32)0.4021.7422.144−1.340
Consumers’ Environmental Awareness (C33)0.3911.4391.830−1.048
Local Market Regulations (C34)0.4221.4611.883−1.039
Financial (D4)1.4691.5182.986−0.049
Sustainable Capital Input (C41)0.3880.3820.7700.006
Recycling Cost (C42)0.3750.3790.754−0.003
Recovery, Reuse Value (C43)0.3480.3570.705−0.009
Net Profit Ratio (C44)0.2840.2780.5620.006
Note: The bold figures is to easily distinguish the “Dimensions” with “criteria” for readers shown as Table 6.
Table 7. Unweighted super-matrix W based on DANP for corporate governance elements.
CriteriaC11C12C13C14C21C22C23C24C31C32C33C34C41C42C43C44
C110.2070.2530.2490.2440.2360.2310.2390.2380.2480.2400.2450.2440.2360.2330.2390.228
C120.2600.2130.2580.2570.2470.2480.2460.2440.2440.2460.2490.2420.2400.2420.2450.250
C130.2650.2620.2240.2650.2530.2580.2540.2500.2510.2540.2520.2560.2590.2590.2560.258
C140.2690.2720.2690.2330.2640.2640.2620.2680.2570.2600.2540.2580.2650.2650.2600.264
C210.2520.2430.2490.2440.2200.2570.2560.2640.2480.2480.2500.2520.2570.2500.2500.246
C220.2640.2610.2590.2620.2710.2320.2740.2640.2610.2590.2590.2580.2560.2610.2570.269
C230.2450.2520.2490.2530.2610.2630.2220.2560.2490.2500.2490.2470.2470.2460.2500.246
C240.2380.2440.2420.2410.2480.2480.2470.2170.2420.2430.2420.2430.2400.2430.2430.239
C310.2930.2890.2870.2830.2800.2850.2830.2800.2530.2930.2940.2860.2810.2810.2740.278
C320.2710.2740.2680.2710.2710.2740.2730.2730.2840.2410.2750.2780.2710.2710.2750.268
C330.2160.2180.2240.2200.2220.2180.2190.2200.2290.2310.1950.2350.2160.2160.2230.224
C340.2200.2200.2200.2250.2270.2230.2260.2270.2340.2360.2360.2010.2320.2320.2280.229
C410.2810.2800.2810.2820.2820.2790.2780.2860.2810.2760.2820.2810.2440.2860.2820.288
C420.2660.2690.2740.2790.2750.2720.2710.2680.2710.2680.2670.2670.2840.2370.2860.281
C430.2620.2580.2620.2550.2530.2550.2590.2560.2550.2560.2570.2530.2670.2710.2230.262
C440.1910.1930.1830.1840.1900.1940.1920.1900.1930.2000.1940.1990.2060.2070.2090.169
Note: The shade is to distinguish the Dimensions, criteria for reader easier to read.
Table 8. Weighted super-matrix W α based on DANP for corporate governance elements.
CriteriaC11C12C13C14C21C22C23C24C31C32C33C34C41C42C43C44
C110.0510.0620.0610.0600.0580.0570.0590.0590.0610.0590.0600.0600.0570.0560.0580.055
C120.0640.0520.0630.0630.0610.0610.0600.0600.0600.0600.0610.0590.0580.0580.0590.060
C130.0650.0640.0550.0650.0620.0630.0620.0610.0620.0620.0620.0630.0630.0630.0620.062
C140.0660.0670.0660.0570.0650.0650.0640.0660.0630.0640.0620.0630.0640.0640.0630.064
C210.0710.0680.0700.0680.0600.0700.0690.0710.0680.0690.0690.0700.0710.0690.0690.068
C220.0740.0730.0730.0740.0730.0630.0740.0710.0720.0720.0710.0710.0710.0720.0710.074
C230.0690.0710.0700.0710.0710.0710.0600.0690.0690.0690.0690.0680.0680.0680.0690.068
C240.0670.0690.0680.0680.0670.0670.0670.0590.0670.0670.0670.0670.0660.0670.0670.066
C310.0720.0710.0700.0700.0680.0700.0690.0680.0600.0700.0700.0680.0680.0680.0670.068
C320.0670.0670.0660.0670.0660.0670.0670.0670.0680.0580.0660.0660.0660.0660.0670.065
C330.0530.0530.0550.0540.0540.0530.0530.0540.0550.0550.0460.0560.0530.0530.0540.055
C340.0540.0540.0540.0550.0550.0540.0550.0550.0560.0560.0560.0480.0570.0570.0560.056
C410.0640.0640.0640.0650.0680.0670.0670.0680.0670.0660.0680.0670.0580.0680.0670.068
C420.0610.0620.0630.0640.0660.0650.0650.0640.0650.0640.0640.0640.0680.0560.0680.067
C430.0600.0590.0600.0590.0610.0610.0620.0610.0610.0610.0610.0610.0630.0640.0530.062
C440.0440.0440.0420.0420.0450.0470.0460.0460.0460.0480.0470.0480.0490.0490.0500.040
Note: The shade is to distinguish the Dimensions, criteria for reader easier to read.
Table 9. The stable matrix lim z ( W α ) z of DANP for total factors.
CriteriaC11C12C13C14C21C22C23C24C31C32C33C34C41C42C43C44
C110.0580.0580.0580.0580.0580.0580.0580.0580.0580.0580.0580.0580.0580.0580.0580.058
C120.0600.0600.0600.0600.0600.0600.0600.0600.0600.0600.0600.0600.0600.0600.0600.060
C130.0620.0620.0620.0620.0620.0620.0620.0620.0620.0620.0620.0620.0620.0620.0620.062
C140.0640.0640.0640.0640.0640.0640.0640.0640.0640.0640.0640.0640.0640.0640.0640.064
C210.0690.0690.0690.0690.0690.0690.0690.0690.0690.0690.0690.0690.0690.0690.0690.069
C220.0720.0720.0720.0720.0720.0720.0720.0720.0720.0720.0720.0720.0720.0720.0720.072
C230.0690.0690.0690.0690.0690.0690.0690.0690.0690.0690.0690.0690.0690.0690.0690.069
C240.0670.0670.0670.0670.0670.0670.0670.0670.0670.0670.0670.0670.0670.0670.0670.067
C310.0690.0690.0690.0690.0690.0690.0690.0690.0690.0690.0690.0690.0690.0690.0690.069
C320.0660.0660.0660.0660.0660.0660.0660.0660.0660.0660.0660.0660.0660.0660.0660.066
C330.0540.0540.0540.0540.0540.0540.0540.0540.0540.0540.0540.0540.0540.0540.0540.054
C340.0550.0550.0550.0550.0550.0550.0550.0550.0550.0550.0550.0550.0550.0550.0550.055
C410.0660.0660.0660.0660.0660.0660.0660.0660.0660.0660.0660.0660.0660.0660.0660.066
C420.0640.0640.0640.0640.0640.0640.0640.0640.0640.0640.0640.0640.0640.0640.0640.064
C430.0610.0610.0610.0610.0610.0610.0610.0610.0610.0610.0610.0610.0610.0610.0610.061
C440.0460.0460.0460.0460.0460.0460.0460.0460.0460.0460.0460.0460.0460.0460.0460.046
Note: The shade is to distinguish the Dimensions, criteria for reader easier to read.
Table 10. Integrated index of corporate governance dimensions and criteria.
Dimensions/CriteriaInfluential Weights (IWs)PerformanceGap
Local WeightGlobal WeightCo. ACo. ICo. ACo. I
Learning and Growth (D1)0.245 (2) 79.4880.96 *0.21 (2)0.19 (3)
Employees Sustainable Education (C11)0.2380.05886.6084.000.130.16
Employees Professional Sustainability (C12)0.2460.06081.0081.000.190.19
Sustainable Management Know-how (C13)0.2550.06277.4077.000.230.23
Employee Reaction Competency (C14)0.2610.06473.6082.000.260.18
Internal business processes (D2)0.276 (1) 79.2879.90 *0.21 (2)0.20 (2)
Resource Material Consumption (C21)0.2490.06979.0082.000.210.18
Pollution Production Control (C22)0.2600.07280.0079.600.200.20
Waste Disposal Capability (C23)0.2490.06981.0079.000.190.21
Environmental Management System (C24)0.2410.06777.0079.000.230.21
Customer (D3)0.243 (3) 82.61 *82.380.17 (4)0.18 (4)
Corporation’s Green Image (C31)0.2820.06986.0079.000.140.21
Green Logistic Management (C32)0.2710.06685.0089.000.150.11
Consumers’ Environmental Awareness (C33)0.2210.05478.0081.000.220.19
Local Market Regulations (C34)0.2260.05580.0080.000.200.20
Financial (D4)0.237 (4) 74.7075.25 *0.25 (1)0.25 (1)
Sustainable Capital Input (C41)0.2790.06678.0074.000.220.26
Recycling Cost (C42)0.2710.06479.0076.000.210.24
Recovery, Reuse Value (C43)0.2560.06173.0076.000.270.24
Net Profit Ratio (C44)0.1940.04666.2075.000.340.25
Total 79.05 (2)79.66 (1)4.124.03
Note: * represents the advantage item and parentheses ( ) denotes the priority ranking. The bold figures is to easily distinguish the “Dimensions” with “criteria” for readers shown as Table 10.

