
Analysis of the Driving Factors and Contributions to Carbon Emissions of Energy Consumption from the Perspective of the Peak Volume and Time Based on LEAP

Abstract
:1. Introduction
- (1)
- According to the data of industrial terminal and energy consumption terminal, the carbon emission peak volume and time was forecasted based on the down-top framework by using LEAP system;
- (2)
- According to the prediction, the driving factors and the contribution were analyzed for controlling the peak volume and time.
2. Study Method and Data
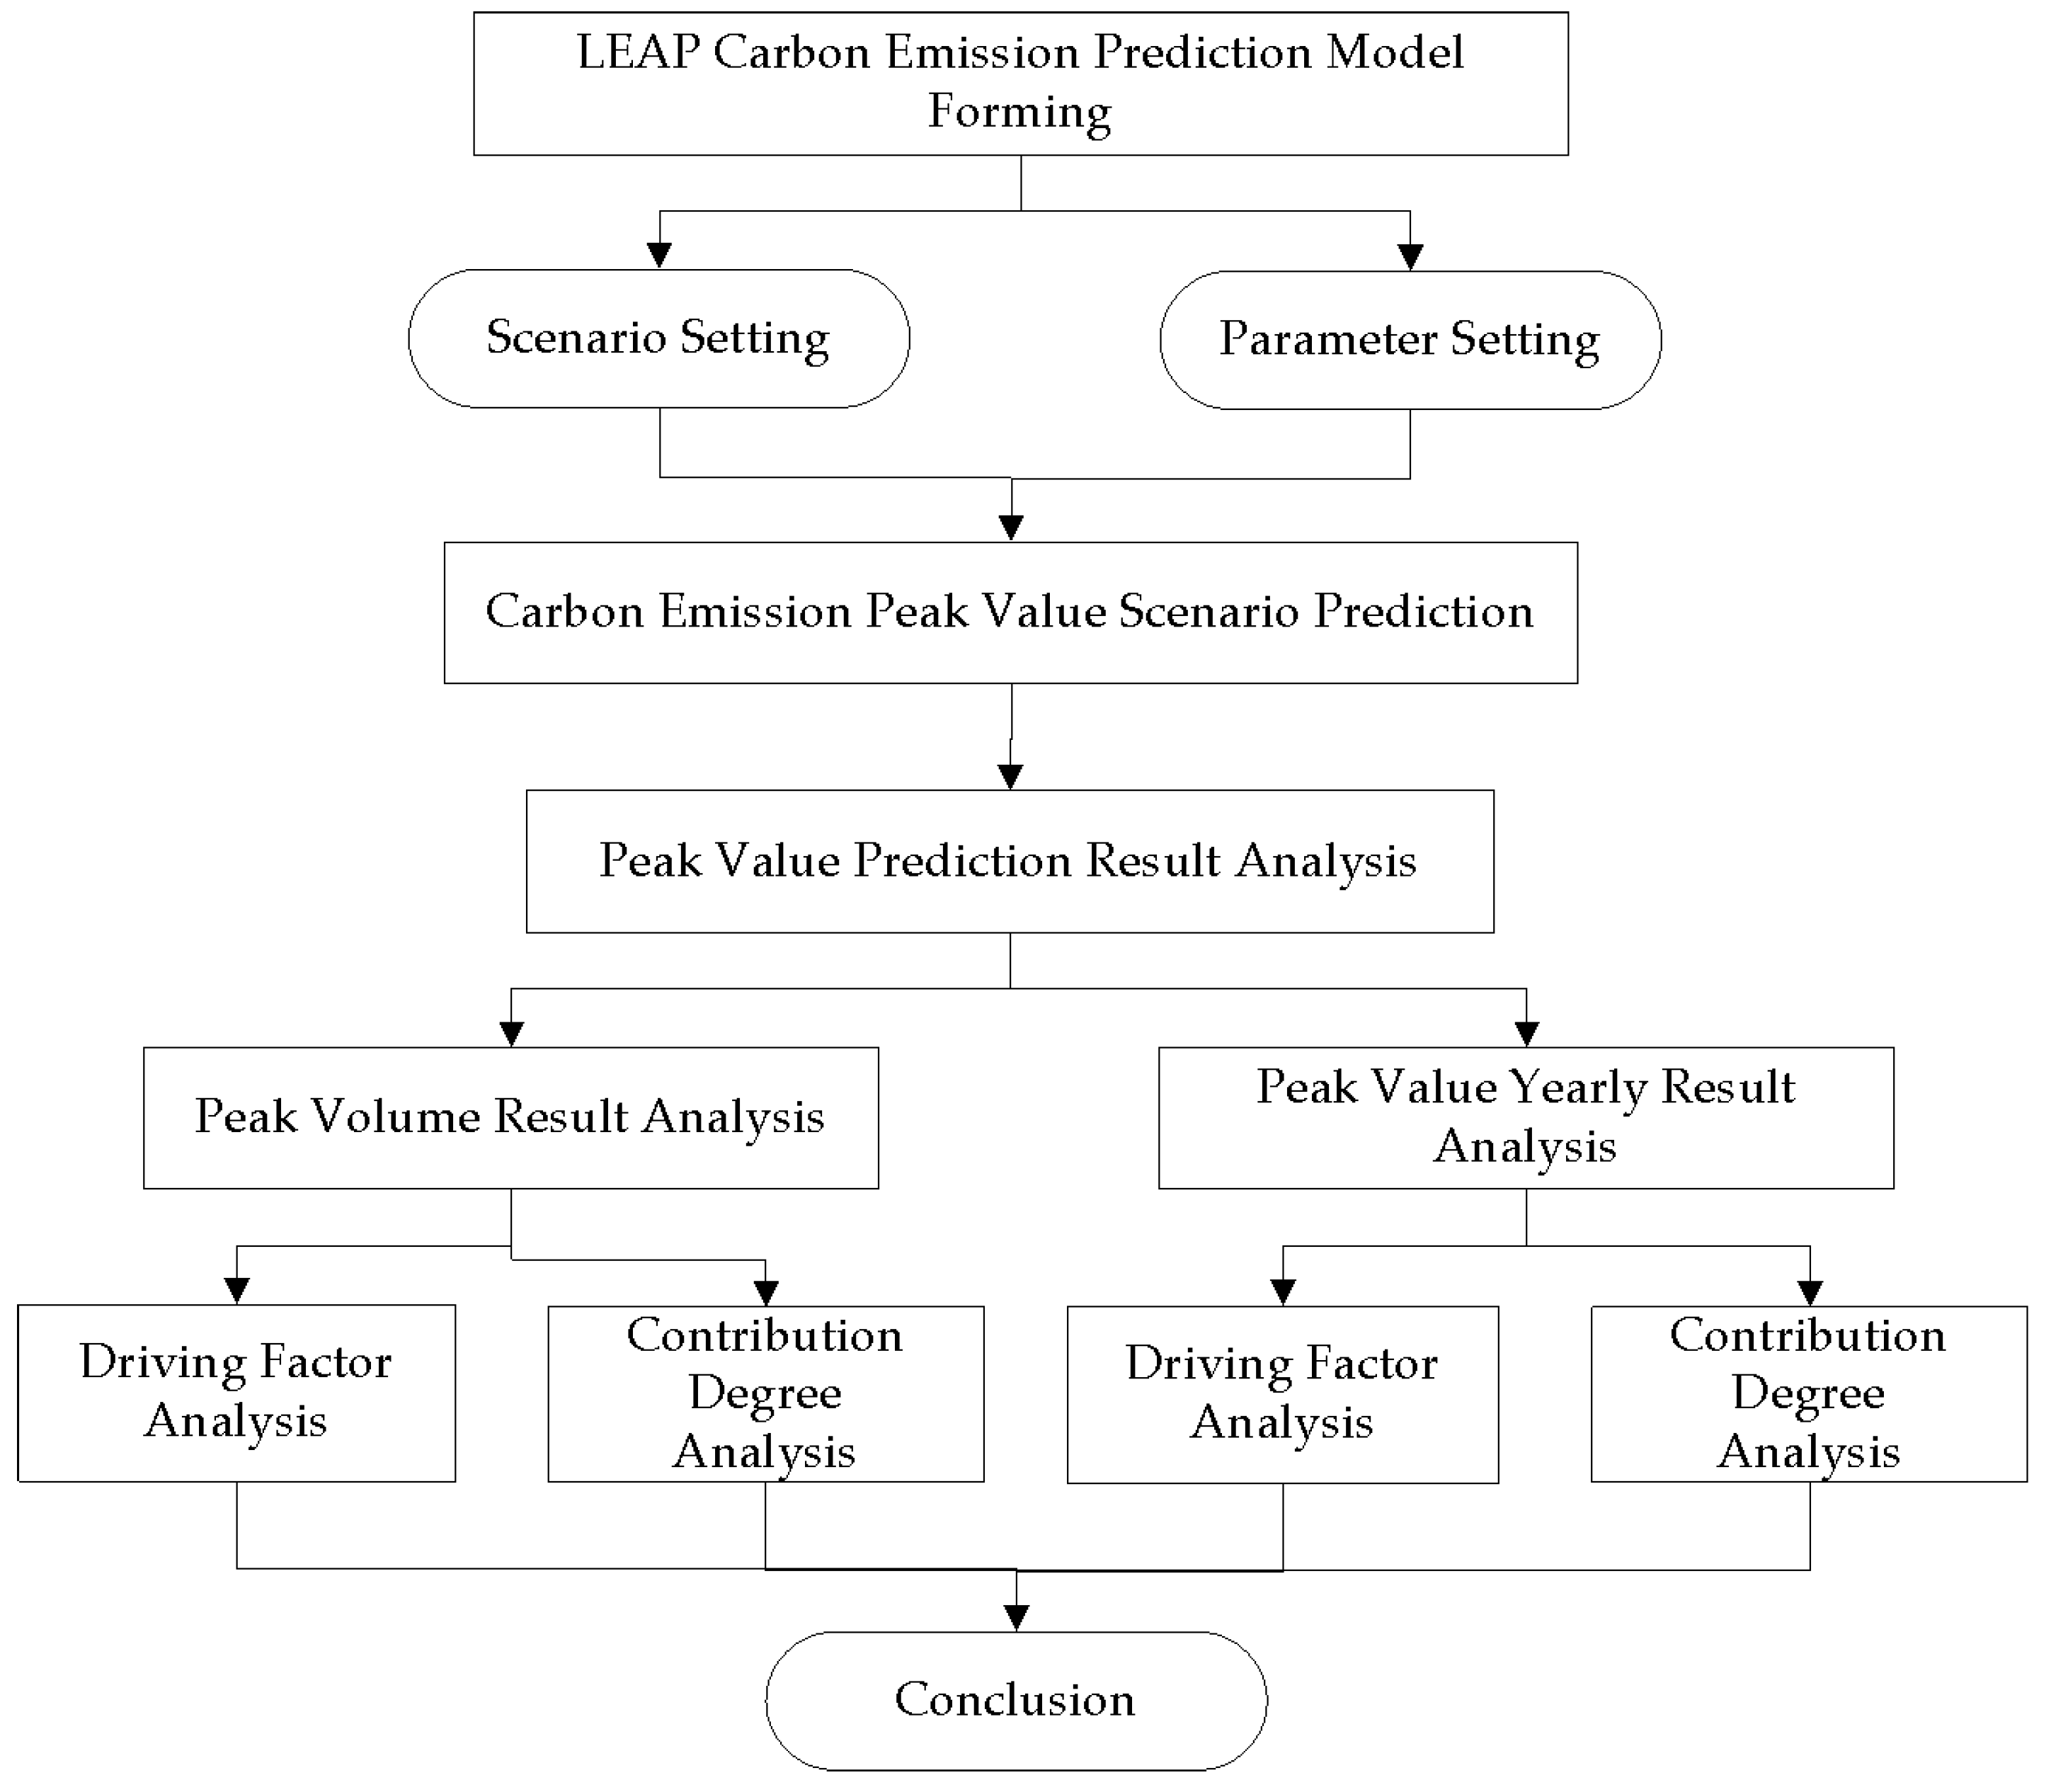
2.1. Overview of LEAP System
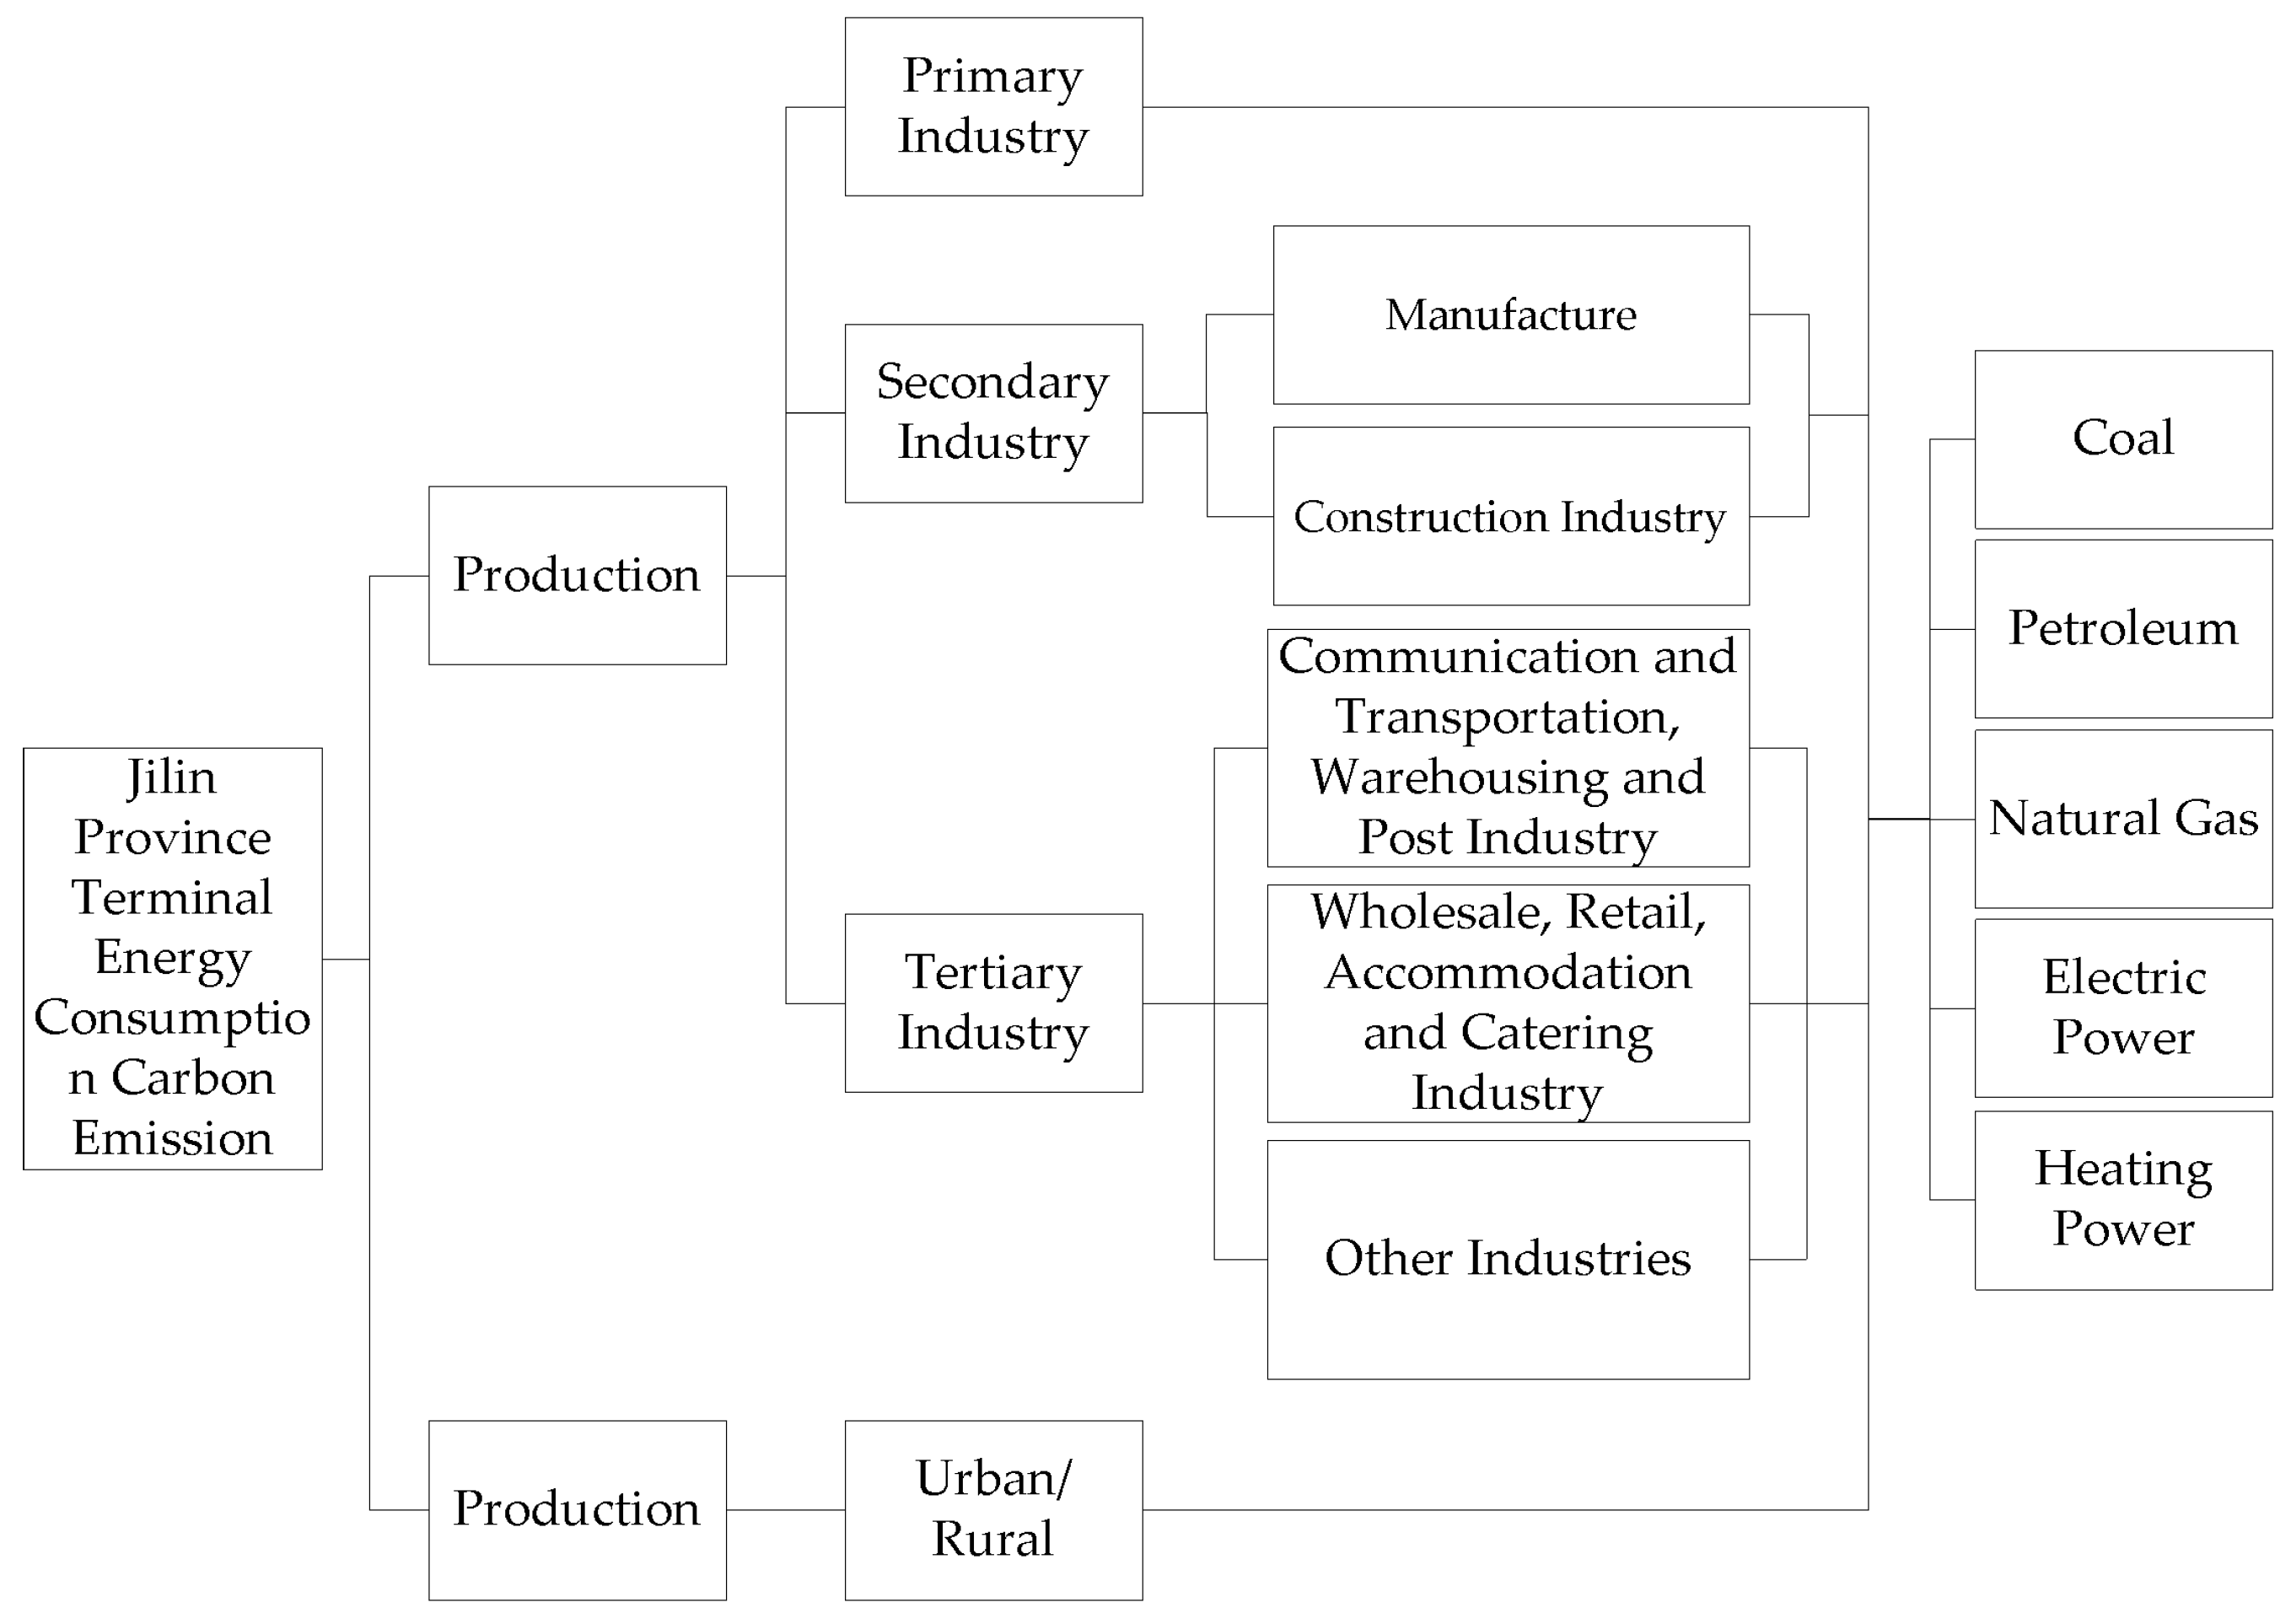
2.2. Structure of LEAP System
2.3. LEAP Calculation
3. Empirical Study
3.1. Study Area Survey
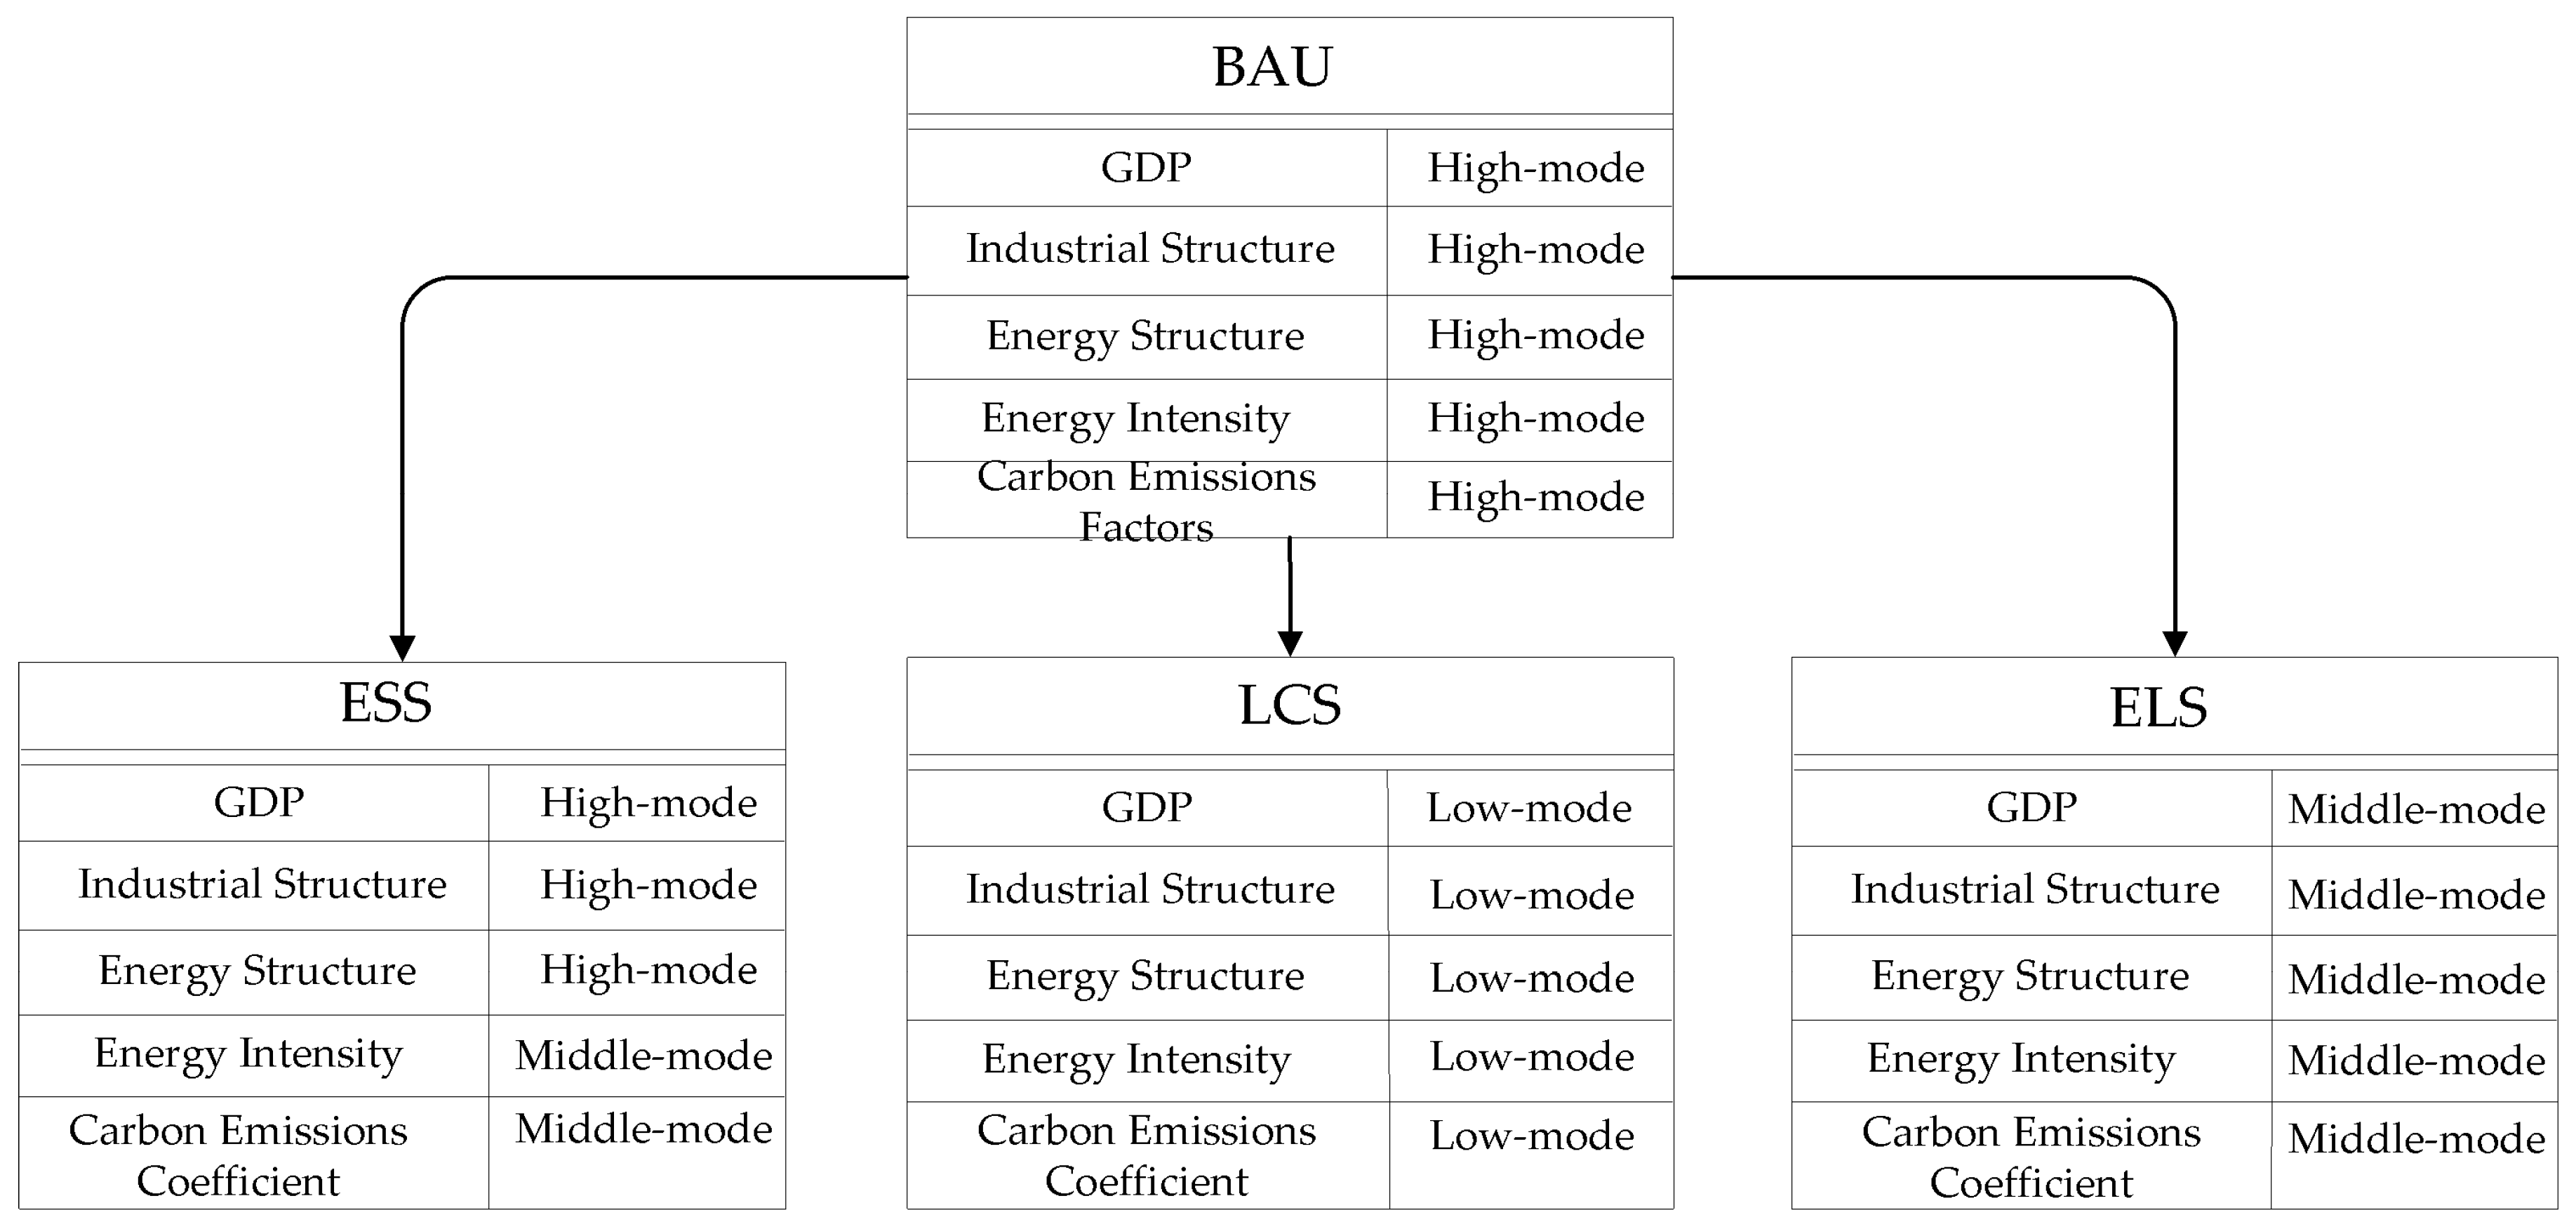
3.2. Setting of Scenario
3.2.1. Business as Usual Scenario (BAU)
3.2.2. Energy-Saving Scenario (ESS)
3.2.3. Energy-Saving and Low-Carbon Scenario (ELS)
3.2.4. Low-Carbon Scenario (LCS)
3.3. Scenario Parameter Setting
3.3.1. Population
3.3.2. Gross Regional Domestic Product
3.3.3. Urbanization Rate
3.3.4. Industrial Structure
3.3.5. Business Structure
3.3.6. Energy Structure
3.3.7. Energy Intensity
3.3.8. Carbon Emission Coefficient
4. Results and Discussion
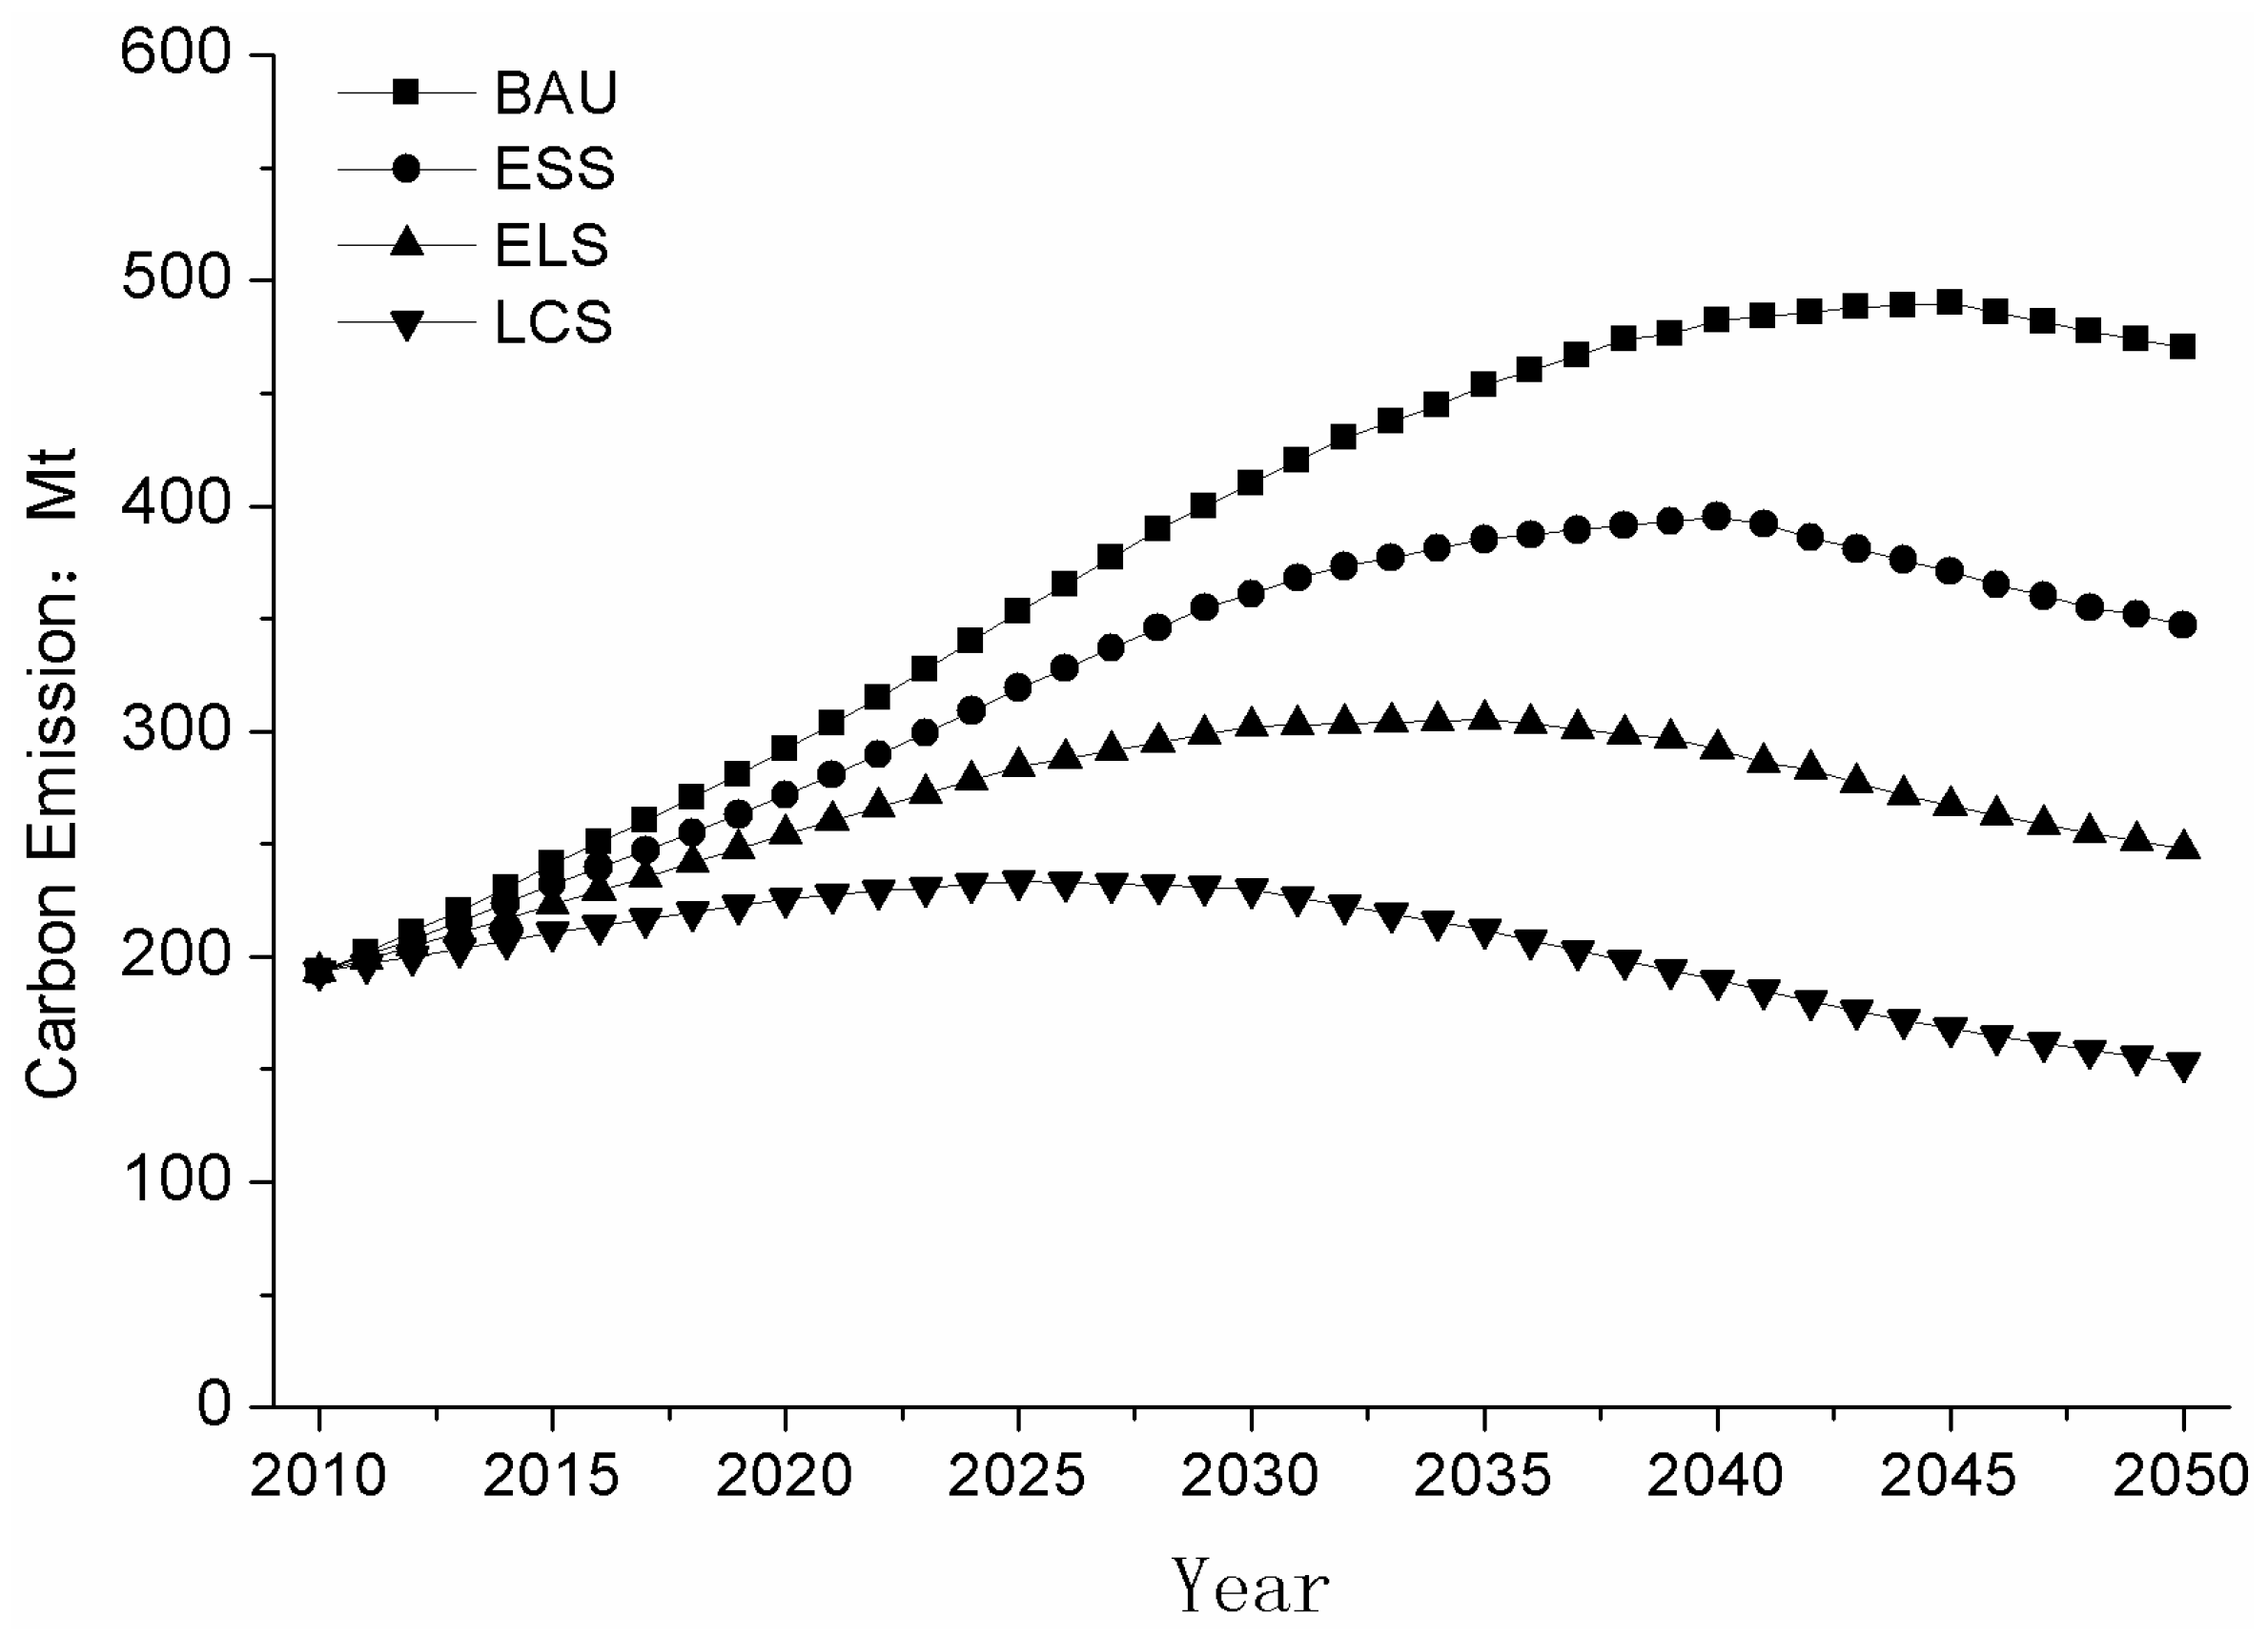
4.1. Prediction of Peak Amount of Carbon Emission
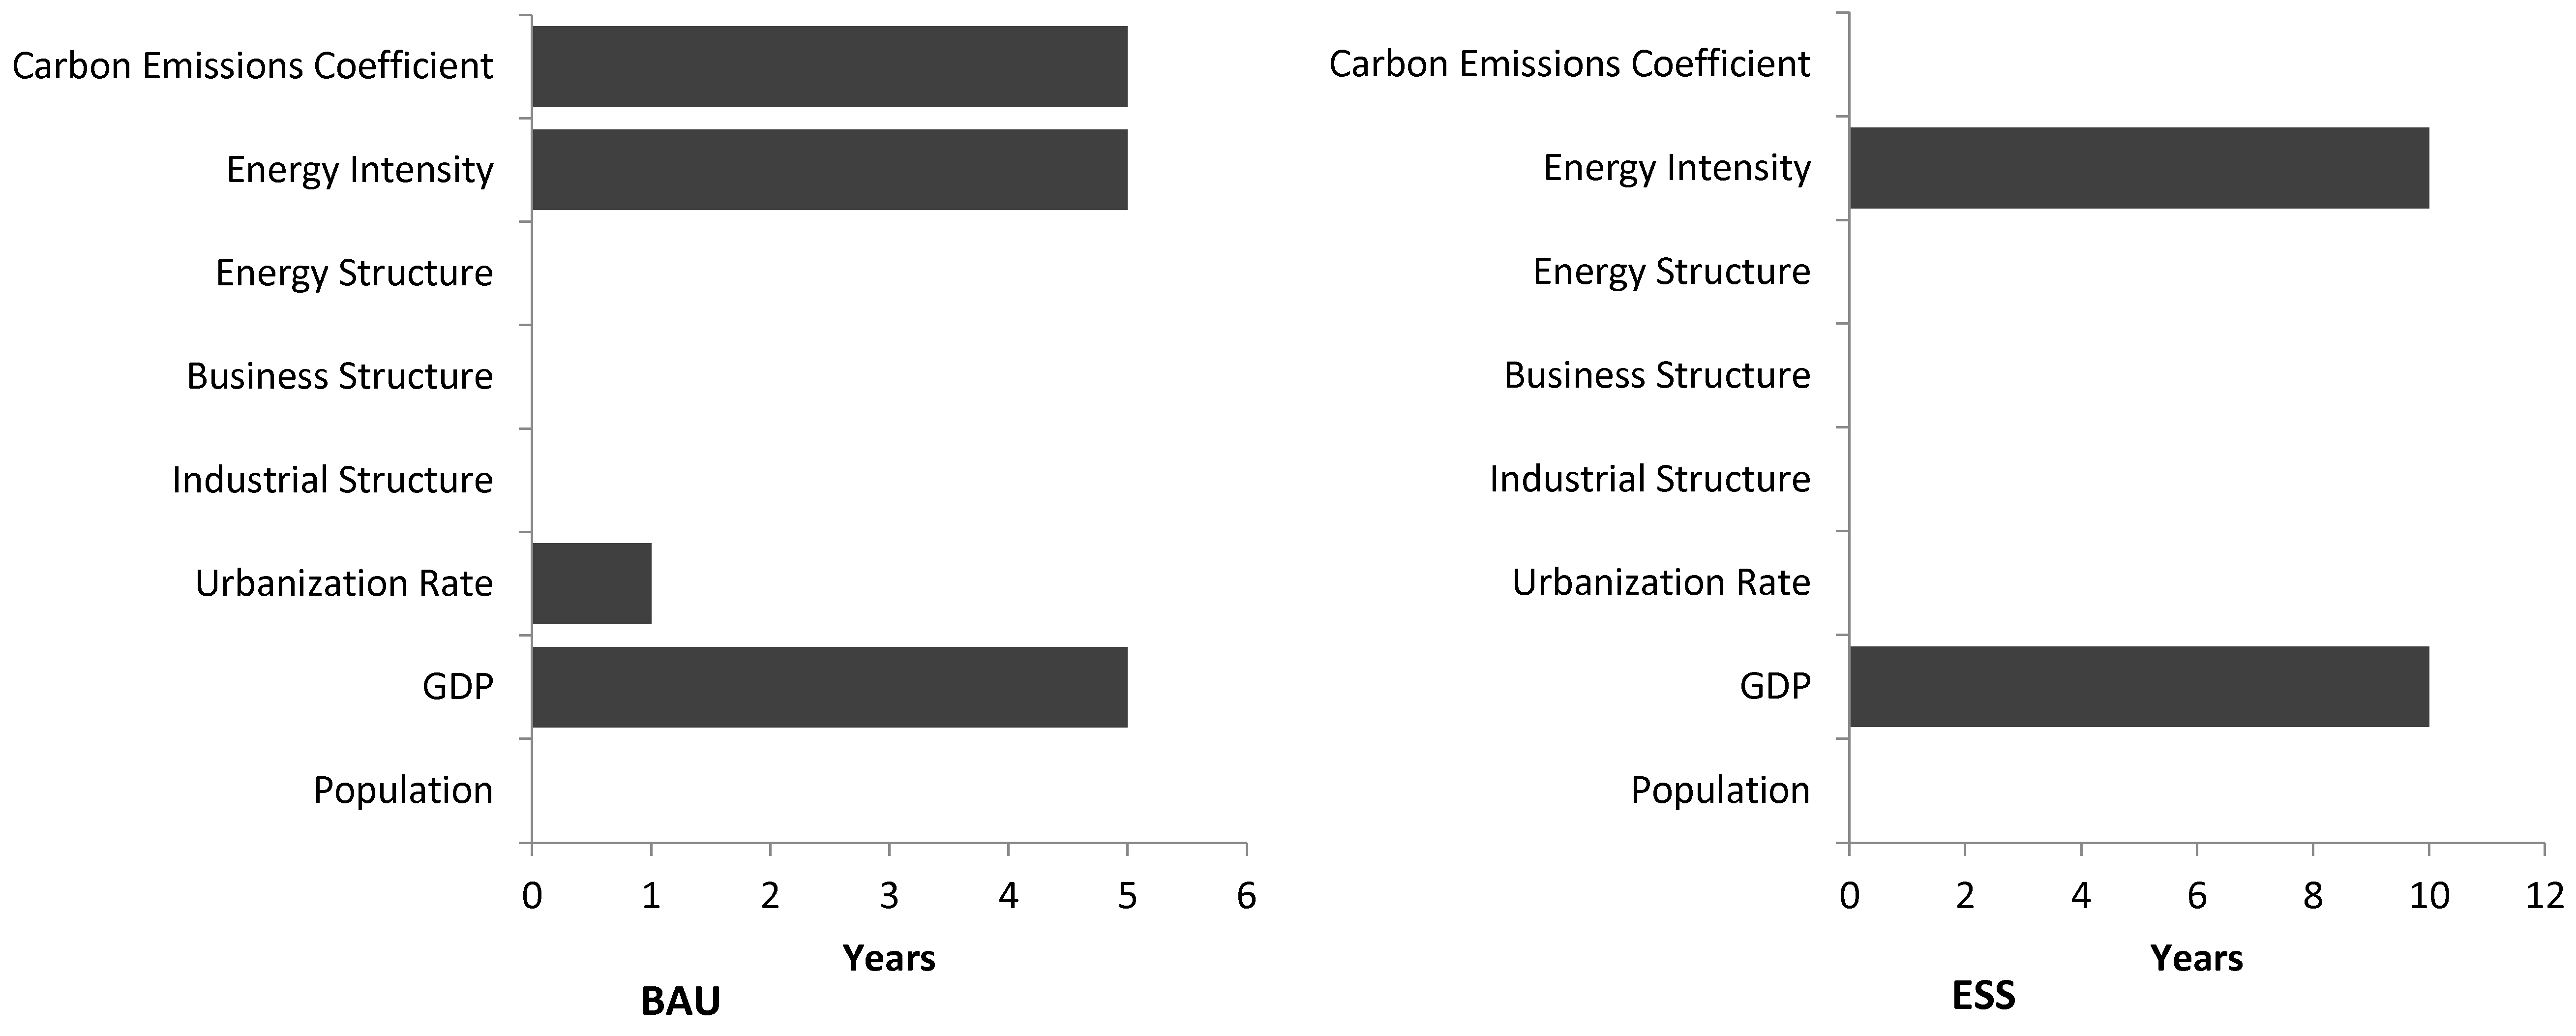
4.2. Analysis of the Driving Factors and Contributions
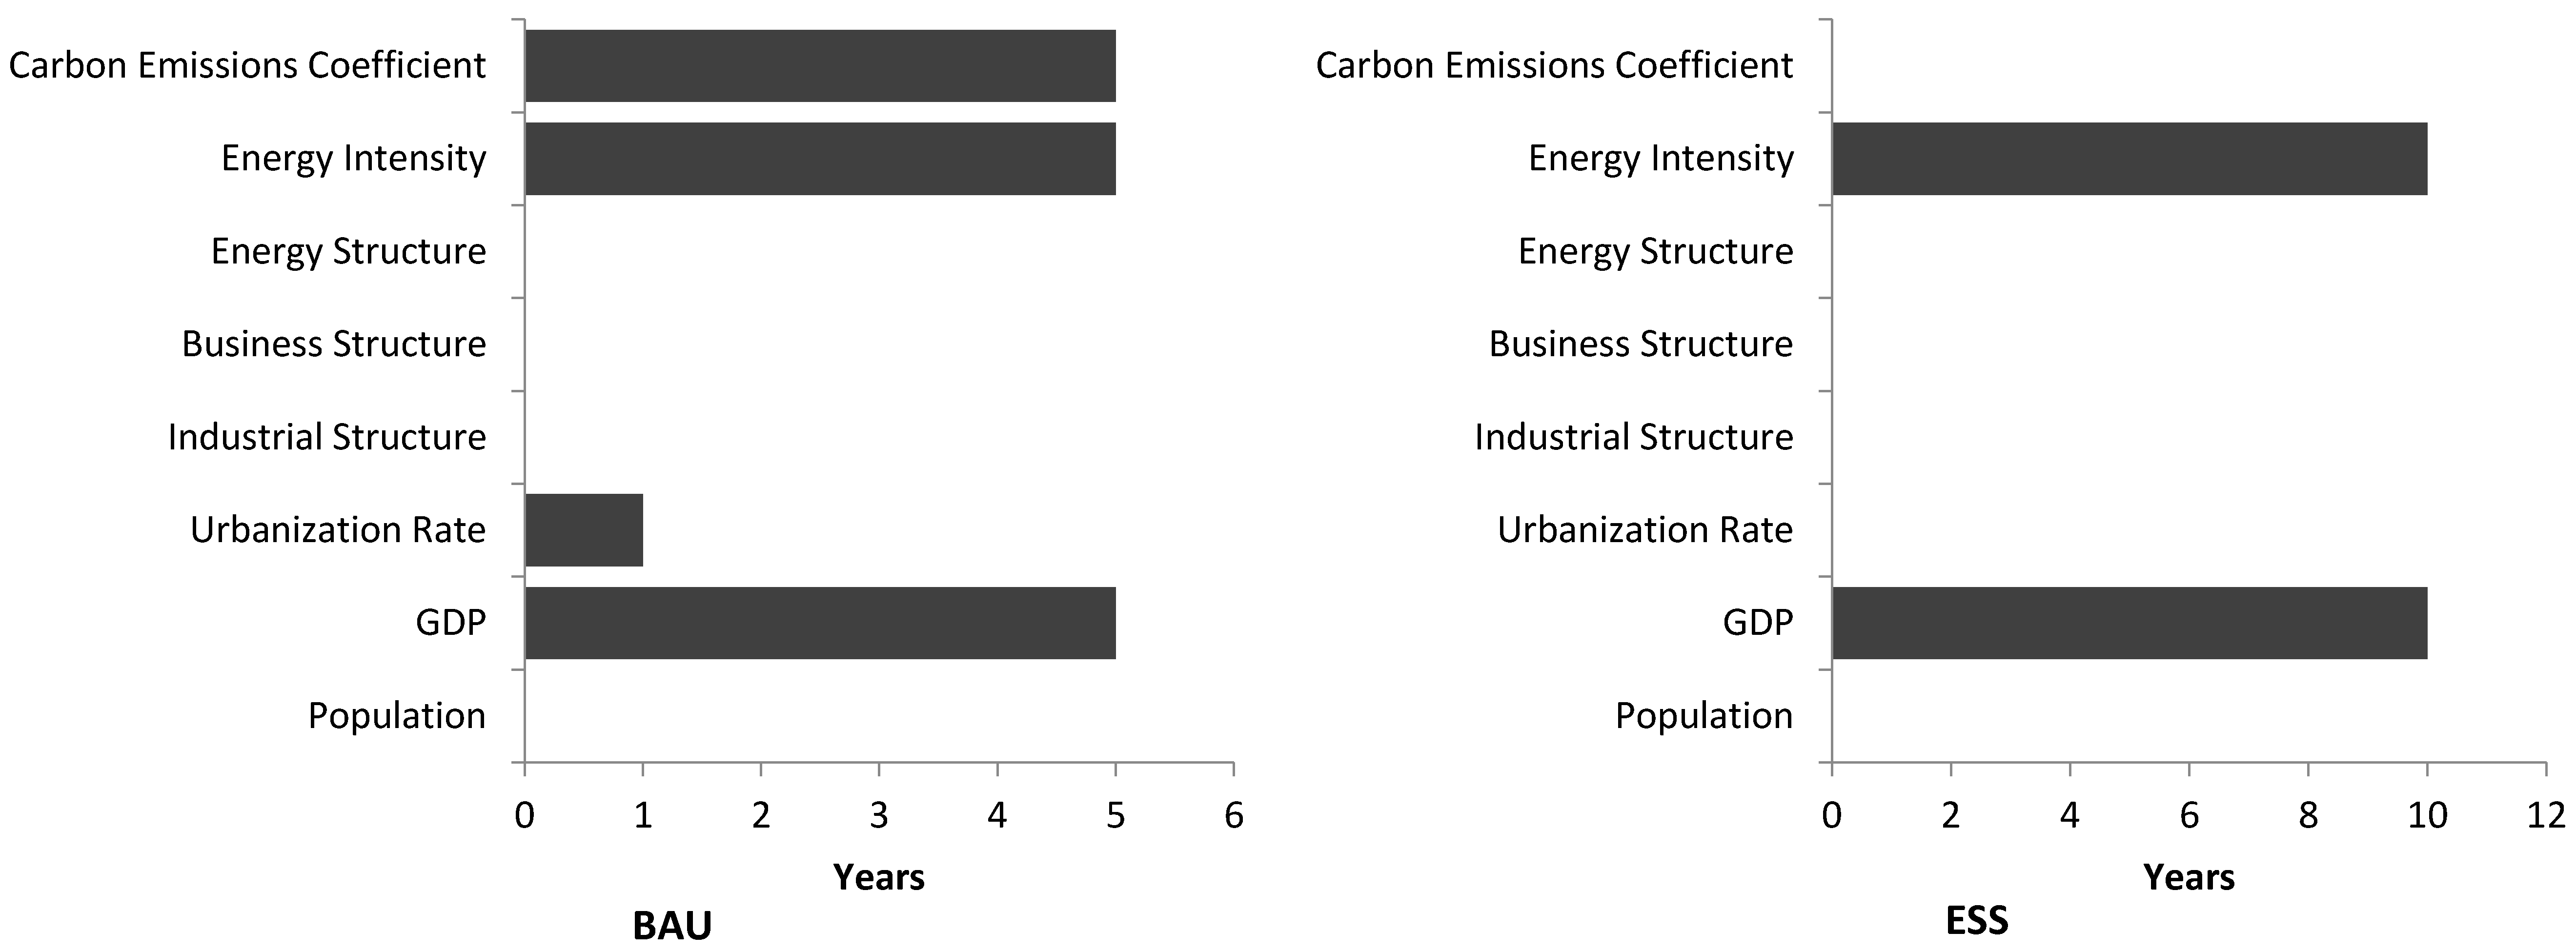
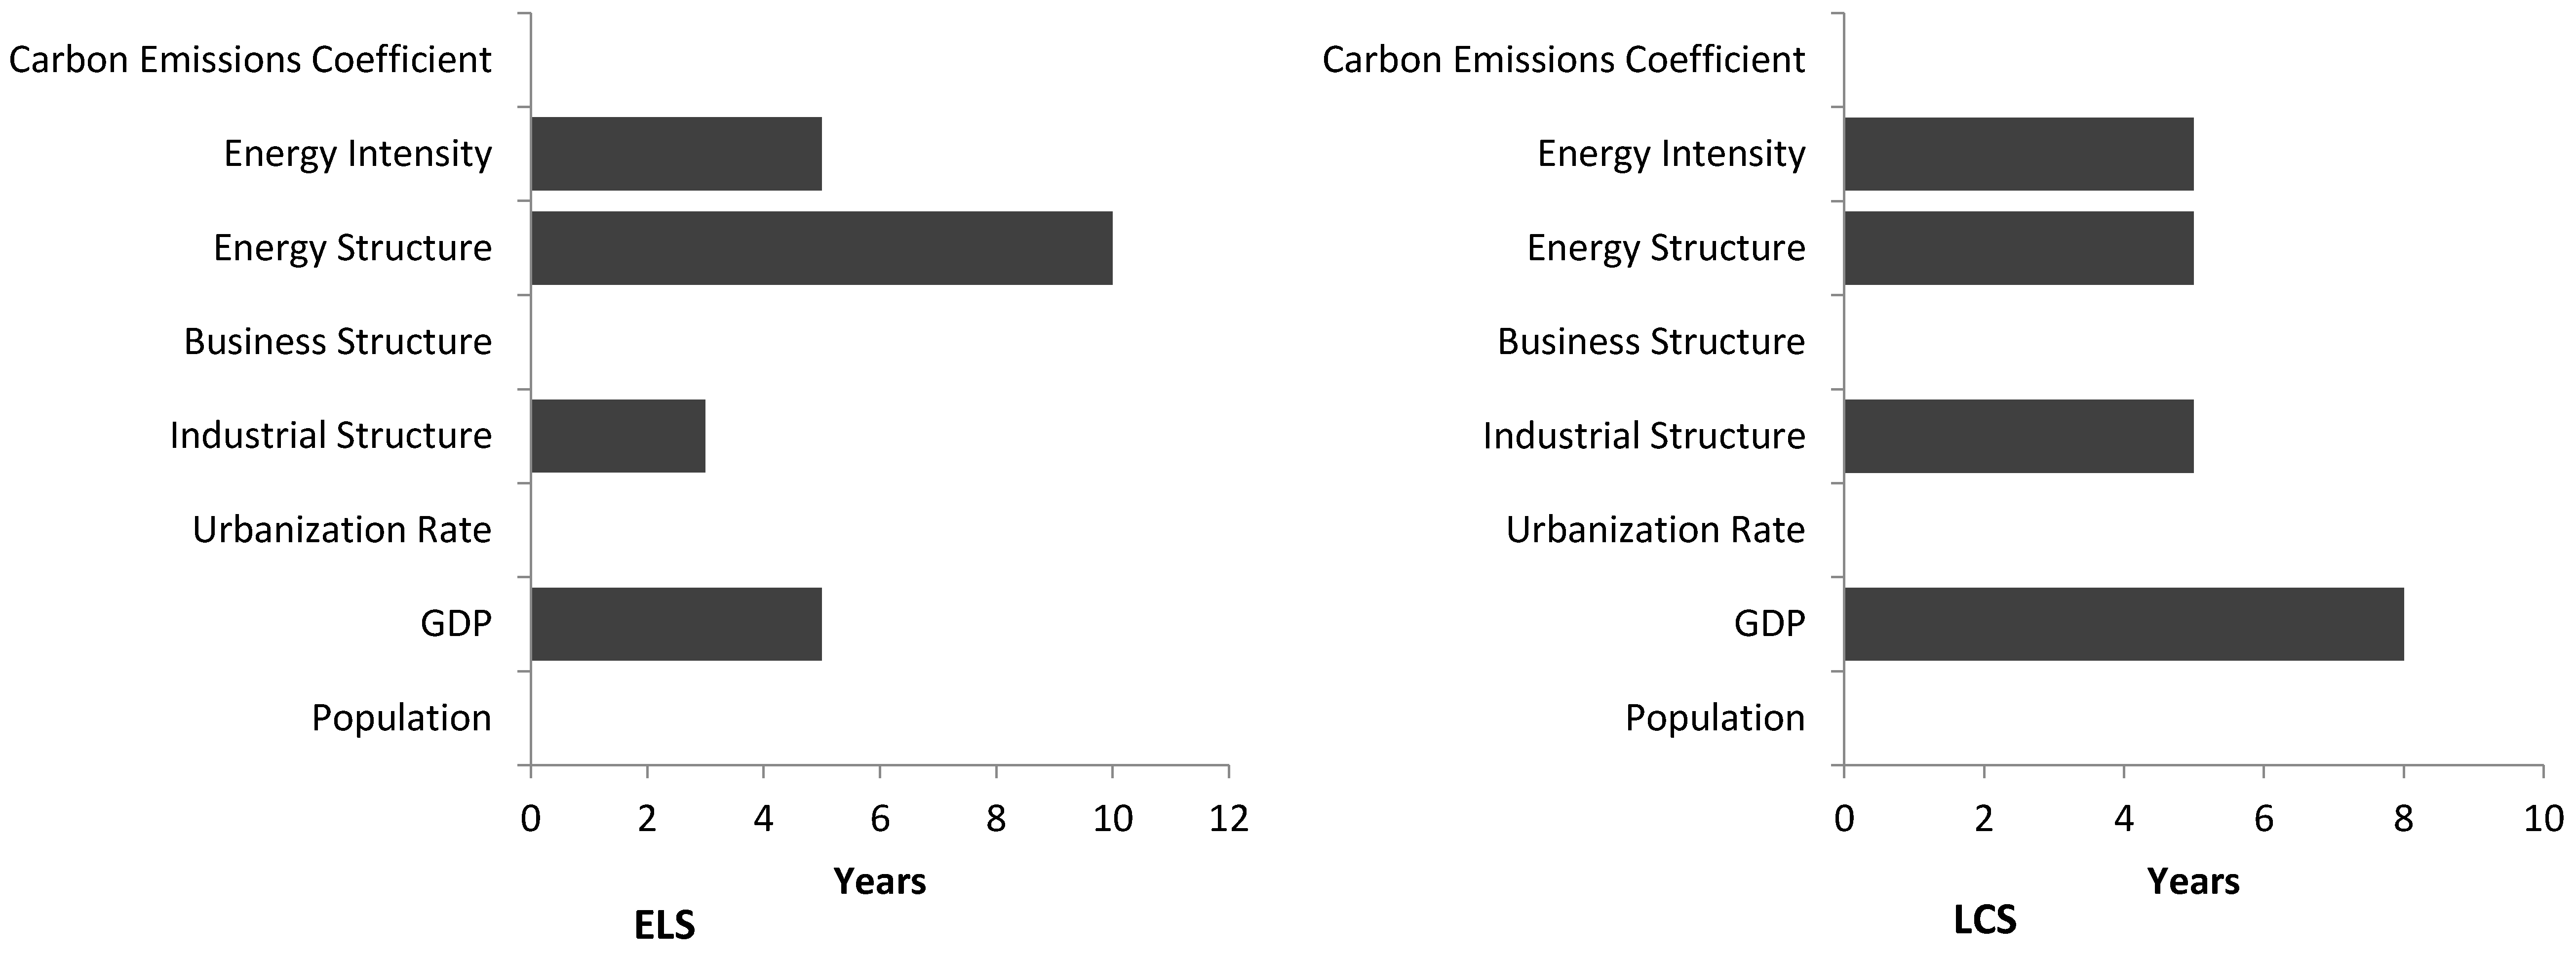
4.2.1. Analysis of the Driving Factors
4.2.2. Analysis on the Contributions
4.3. Analysis on the Driving Factors and Contributions of the Peak Time
4.3.1. Analysis Impact of the Driving Factors on Peak Time
4.3.2. Analysis on the Contributions of Driving Factors to Peak Time
5. Conclusions
Acknowledgments
Author Contributions
Conflicts of Interest
References
- Crowley, T.J. Causes of climate change over the past 1000 years. Science 2000, 289, 270–277. [Google Scholar] [CrossRef] [PubMed]
- Walther, G.-R.; Post, E.; Convey, P.; Menze, A.; Parmesan, C.; Beebee, T.J.C.; Fromentin, J.-M.; Hoegh-Guldberg, O.; Bairlein, F. Ecological responses to recent climate change. Nature 2002, 416, 389–395. [Google Scholar] [CrossRef] [PubMed]
- UNFCCC. Adoption of the Paris Agreement. Available online: http://unfccc.int/resource/docs/2015/cop21/eng/l09r01.pdf (accessed on 26 May 2016).
- 2050 China Energy and CO2 Emission Research Group. 2050 China Energy and CO2 Emission Report; Science Press: Beijing, China, 2009; p. 767. [Google Scholar]
- IPCC. Contribution of Working Group II to the Fourth Assessment Report of the Intergovernmental Panel on Climate Change; Cambridge University Press: Cambridge, Britain; New York, NY, USA, 2007. [Google Scholar]
- Meinshausen, M.; Meishausen, N.; Hare, W.; Raper, S.C.B.; Frieler, K.; Knutti, R.; Frame, D.J.; Allen, M.R. Greenhouse-gas emission targets for limiting global warming to 2 °C. Nature 2009, 458, 1158–1196. [Google Scholar] [CrossRef] [PubMed]
- Zhou, G.; Ou, X.; Zhang, X. Development of electric vehicles use in China: A study from the perspective of life-cycle energy consumption and greenhouse gas emissions. Energy Policy 2013, 59, 875–884. [Google Scholar] [CrossRef]
- Wen, Z.; Meng, F.; Chen, M. Estimates of the potential for energy conservation and CO2 emissions mitigation based on Asian-Pacific Integrated Model (AIM): The case of the iron and steel industry in China. J. Clean. Prod. 2014, 65, 120–130. [Google Scholar] [CrossRef]
- Huang, Y.; Bor, Y.J.; Peng, C.-Y. The long-term forecast of Taiwan’s energy supply and demand: LEAP model application. Energy Policy 2011, 39, 6790–6803. [Google Scholar] [CrossRef]
- Lantz, V.; Feng, Q. Assessing Income, Population, and Technology Impacts on CO2 Emissions in Canada: Where’s the EKC? Ecol. Econ. 2006, 57, 229–238. [Google Scholar] [CrossRef]
- Fan, Y.; Liu, L.; Wu, G.; Wei, Y. Analyzing impact factors of CO2 emissions using the STIRPAT model. Environ. Impact Assess. Rev. 2006, 26, 377–395. [Google Scholar] [CrossRef]
- Zhu, Q.; Peng, X.; Lu, Z.; Yu, J. Analysis Model and Empirical Study of Impacts from Population and Consumption on Carbon Emissions. China Popul. Resour. Environ. 2010, 20, 98–102. [Google Scholar]
- Guo, C. Effect of Industrial Structure Change on Carbon Emission in China. China Popul. Resour. Environ. 2012, 22, 15–20. [Google Scholar]
- Zhou, X.; Zhang, J.; Li, J. Industrial structural transformation and carbon dioxide emissions in China. Energy Policy 2013, 57, 43–51. [Google Scholar] [CrossRef]
- Mi, Z.-F.; Pan, S.-Y.; Yu, H.; Wei, Y.-M. Potential impacts of industrial structure on energy consumption and CO2 emission: A case study of Beijing. J. Clean. Prod. 2014. [Google Scholar] [CrossRef]
- Shao, C.; Guan, Y.; Wan, Z.; Guo, C.; Chu, C.; Ju, M. Performance and decomposition analyses of carbon emissions from industrial energy consumption in Tianjin, China. J. Clean. Prod. 2014, 64, 590–601. [Google Scholar] [CrossRef]
- Zhang, B.; Wang, Z.; Yin, J.; Su, L. CO2 emission reduction within Chinese iron & steel industry: Practices, determinants and performance. J. Clean. Prod. 2012, 33, 167–178. [Google Scholar]
- Benhelal, E.; Zahedi, G.; Shamsaei, E.; Bahadori, A. Global strategies and potentials to curb CO2 emissions in cement industry. J. Clean. Prod. 2013, 51, 142–161. [Google Scholar] [CrossRef]
- Qu, S.; Guo, C. Forecast of China’s carbon emission based on STIRPAT model. China Popul. Resour. Environ. 2010, 20, 10–15. [Google Scholar]
- Zhai, S.; Wang, Z. The Prediction of Carbon Emissions Demands in India under the Balance Economic Growth Path. Smart Grid Renew. Energy 2012, 3, 186–193. [Google Scholar]
- Zhang, W.; Duan, X. The Research Progress in the Relationship among Economic Growth, Industrial Structure, and Carbon Emissions. Prog. Geogr. 2012, 31, 442–450. [Google Scholar]
- Zhu, Y.; Wang, Z.; Pang, L.; Wang, L.; Zou, X. Simulation on China’s Economy and Prediction on Energy Consumption and Carbon Emission under Optimal Growth Path. Acta Geogr. Sinca 2009, 64, 935–944. [Google Scholar]
- Wang, X.; Wang, Y.; Duan, H. Forecasting Area s Carbon Emissions of Energy Consumption and Controllability Study. China Popul. Resour. Environ. 2014, 24, 9–16. [Google Scholar] [CrossRef] [PubMed]
- Ehrlich, P.R.; Holdren, J.P. Impacts of population growth. Science 1971, 171, 1212–1217. [Google Scholar] [CrossRef] [PubMed]
- Dietz, T.; Rosa, E.A. Rethinking the environmental impact of population, affluence and technology. Hum. Ecol. Rev. 1994, 1, 277–300. [Google Scholar]
- Dietz, T.; Rosa, E.A. Effects of population and affluence on CO2 emissions. Proc. Natl. Acad. Sci. USA 1997, 94, 175–179. [Google Scholar] [CrossRef] [PubMed]
- York, R.; Rosa, E.A.; Dietz, T. Footprints on the earth: The environmental consequences of modernity. Am. Sociol. Rev. 2003, 68, 279–300. [Google Scholar] [CrossRef]
- Moss, R.H.; Edmonds, J.A.; Hibbard, K.A.; Manning, M.R.; Rose, S.K.; van Vuuren, D.P.; Carter, T.R.; Emori, S.; Kainuma, M.; Kram, T.; et al. The next generation of scenario for climate change research and assessment. Nature 2010, 463, 747–756. [Google Scholar] [CrossRef] [PubMed]
- Hong, S.; Chung, Y.; Kim, J.; Chun, D. Analysis on the level of contribution to the national greenhouse gas reduction target in Korean transportation sector using LEAP model. Renew. Sustain. Energy Rev. 2016, 60, 549–559. [Google Scholar] [CrossRef]
- Park, N.-B.; Yun, S.-J.; Jeon, E.-C. An analysis of long-term scenarios for the transition to renewable energy in the Korean electricity sector. Energy Policy 2013, 52, 288–296. [Google Scholar] [CrossRef]
- Connolly, D.; Lund, H.; Mathiesen, B.V.; Leahy, M. A review of computer tools for analysing the integration of renewable energy into various energy systems. Appl. Energy 2010, 87, 1059–1082. [Google Scholar] [CrossRef]
- Shabbir, R.; Ahmad, S.S. Monitoring urban transport air pollution and energy demand in Rawalpindi and Islamabad using leap model. Energy 2010, 35, 2323–2332. [Google Scholar] [CrossRef]
- Letschert, V.; Desroches, L.-B.; Ke, J.; McNeil, M. Energy efficiency—How far can we raise the bar? Revealing the potential of best available technologies. Energy 2013, 59, 72–82. [Google Scholar] [CrossRef]
- IPCC. IPCC Second Assessment Report: Climate Change. 1995. Available online: https://www.ipcc.ch/pdf/climate-changes-1995/ipcc-2nd-assessment/2nd-assessment-en.pdf (accessed on 26 May 2016).
- Du Can, S.D.R.; Price, L. Sectorial trends in global energy use and greenhouse gas emissions. Energy Policy 2008, 36, 1386–1403. [Google Scholar] [CrossRef]
- Zhou, D.; Dai, Y.; Yi, C.; Guo, Y.; Zhu, Y. China’s Sustainable Energy Scenarios in 2020; Environmental Science Press: Beijing, China, 2003. [Google Scholar]
- The People’s Government of Jilin Province. Development Plan of Jilin Province in 12th Five-Year; The People’s Government of Jilin Province: Changchun, China, 2010. (In Chinese)
- Lin, F.; Liu, J. The Development Prospect of Population in Jilin Province. Popul. J. 1995, 10, 44–56. [Google Scholar]
- Song, L. An Analysis of the Level of China’s Urbanization. J. Liaoning Univ. 2007, 35, 115–119. [Google Scholar]
- Ding, H. Urban Energy System Analysis Model Based on the Case Study of Beijing; Science Press: Beijing, China, 2012. (In Chinese) [Google Scholar]
- Zhao, L.; Tao, Z. Influencing Factors and Scenario Forecasting of China’s Low-Carbon Economy. Resour. Sci. 2011, 33, 844–850. [Google Scholar]
- Xinhuanet. State Council of People’s Republic of China: In 2020, Non-Fossil Energy will Reach 15% of the Total Energy Consumption. Available online: http://news.xinhuanet.com/energy/2014-11/19/c_1113317687.htm (accessed on 26 May 2016). (In Chinese)


| Impact Factor | Low-Carbon Scenario | Energy-Saving and Low-Carbon Scenario | Energy-Saving Scenario | Baseline Scenario |
|---|---|---|---|---|
| Population | Low | Medium | High | High |
| Gross regional domestic product | Medium | Medium | High | High |
| Urbanization rate | Medium | Medium | Medium | High |
| Industrial Structure | Low | Medium | High | High |
| Business structure | Low | Medium | High | High |
| Energy structure | Low | Medium | High | High |
| Energy intensity | Low | Medium | Medium | High |
| Carbon emission coefficient | Low | Medium | Medium | High |
| Parameters | Mode | 2010 | 2020 | 2030 | 2040 | 2050 |
|---|---|---|---|---|---|---|
| Population (Mt) | Low-mode | 2723.8 | 2764.00 | 2748.39 | 2711.51 | 2651.11 |
| Middle-mode | 2723.8 | 2792.66 | 2799.64 | 2775.94 | 2729.11 | |
| High-mode | 2723.8 | 2820.65 | 2856.1 | 2836.17 | 2799.51 | |
| GDP (108 Yuan) | Low-mode | 648.17 | 1318.14 | 1996.88 | 2789.36 | 3211.68 |
| Middle-mode | 648.17 | 1631.57 | 3028.14 | 5147.57 | 6798.79 | |
| High-mode | 648.17 | 1740.22 | 3631.36 | 6306.96 | 8565.51 | |
| Urbanization rate (%) | Low-mode | 53.36 | 56.82 | 60.07 | 62.77 | 64.55 |
| Middle-mode | 53.36 | 57.99 | 62.45 | 66.63 | 69.67 | |
| High-mode | 53.36 | 59.53 | 65.76 | 71.21 | 75.00 | |
| The primary industry (%) | Low-mode | 11 | 7 | 6 | 5 | 4 |
| Middle-mode | 11 | 7 | 6 | 5 | 4 | |
| High-mode | 11 | 7 | 6 | 5 | 4 | |
| The secondary industry (%) | Low-mode | 52 | 52 | 47 | 41 | 40 |
| Middle-mode | 52 | 55 | 55 | 51 | 45 | |
| High-mode | 52 | 56 | 58 | 55 | 49 | |
| The tertiary industry (%) | Low-mode | 37 | 39 | 43 | 50 | 56 |
| Middle-mode | 37 | 28 | 39 | 44 | 50 | |
| High-mode | 37 | 37 | 36 | 40 | 47 | |
| Electric power carbon emission coefficient (tCO2/tec) | Low-mode | 6.65 | 5.26 | 4.96 | 4.51 | 3.32 |
| Middle-mode | 6.65 | 5.40 | 5.09 | 4.73 | 3.78 | |
| High-mode | 6.65 | 5.51 | 5.25 | 5.02 | 4.37 |
| Scenario | Peak Amount/(Million ton) | Peak Time | Peak Ratio | Cumulative Amount during 2010 to 2050/(100 Million ton) |
|---|---|---|---|---|
| BAU | 489.83 | 2045 | 2.53 | 156.32 |
| ESS | 395.17 | 2040 | 2.04 | 133.21 |
| ELS | 305.25 | 2035 | 1.58 | 109.71 |
| LCS | 233.57 | 2025 | 1.21 | 83.79 |
© 2016 by the authors; licensee MDPI, Basel, Switzerland. This article is an open access article distributed under the terms and conditions of the Creative Commons Attribution (CC-BY) license (http://creativecommons.org/licenses/by/4.0/).
Share and Cite
Tian, L.; Ding, Z.; Wang, Y.; Duan, H.; Wang, S.; Tang, J.; Wang, X. Analysis of the Driving Factors and Contributions to Carbon Emissions of Energy Consumption from the Perspective of the Peak Volume and Time Based on LEAP. Sustainability 2016, 8, 513. https://doi.org/10.3390/su8060513
Tian L, Ding Z, Wang Y, Duan H, Wang S, Tang J, Wang X. Analysis of the Driving Factors and Contributions to Carbon Emissions of Energy Consumption from the Perspective of the Peak Volume and Time Based on LEAP. Sustainability. 2016; 8(6):513. https://doi.org/10.3390/su8060513
Chicago/Turabian StyleTian, Lei, Zhe Ding, Yongxuan Wang, Haiyan Duan, Shuo Wang, Jie Tang, and Xian’en Wang. 2016. "Analysis of the Driving Factors and Contributions to Carbon Emissions of Energy Consumption from the Perspective of the Peak Volume and Time Based on LEAP" Sustainability 8, no. 6: 513. https://doi.org/10.3390/su8060513