Article

Analysis of the Driving Factors and Contributions to Carbon Emissions of Energy Consumption from the Perspective of the Peak Volume and Time Based on LEAP

Key Laboratory of Groundwater Resources and Environment of Ministry of Education, College of Environment and Resources, Jilin University, Changchun 130012, China
*
Author to whom correspondence should be addressed.
Sustainability 2016, 8(6), 513; https://doi.org/10.3390/su8060513
Submission received: 28 January 2016 / Revised: 12 May 2016 / Accepted: 17 May 2016 / Published: 27 May 2016

Abstract

:
Studying the driving factors and contributions of carbon emissions peak volume and time is essential for reducing the cumulative carbon emissions in developing countries with rapid economic development and increasing carbon emissions. Taking Jilin Province as a case study, four scenarios were set in this paper respectively: Business as Usual Scenario (BAU), Energy-Saving Scenario (ESS), Energy-Saving and Low-Carbon Scenario (ELS), and Low-Carbon Scenario (LCS). Furthermore, the carbon emissions were predicted according to the energy consumption based on the application of LEAP system. The research result showed that the peak time of carbon emissions would appear in 2045, 2040, 2035 and 2025 under the four different scenarios, respectively. The peak volumes would be 489.8 Mt, 395.2 Mt, 305.3 Mt and 233.6 Mt, respectively. The cumulative emissions by 2050 are respectively 15.632 Bt, 13.321 Bt, 10.971 Bt and 8.379 Bt. According to the forecasting, we analyzed the driving factors of and contributions to carbon emissions peak volume and time. On the premise of moderate economic growth, the “structural emission reduction”, namely the adjustment of industrial structure and energy structure, and “technology emission reduction”, namely the reduction of energy intensity and carbon emission coefficient could make the peak volume reduced by 20%–52% and cumulative carbon emissions (2050) reduced by 15%–46% on the basis of BAU. Meanwhile, controlling the industrial structure, energy structure and energy intensity could make carbon emissions reach the peak 5–20 years ahead of the time on the basis of BAU. Controlling GDP, industrial structure, energy structure, energy intensity and coefficient of carbon emissions is the feasible method to adjust the carbon emissions peak volume and time in order to reduce the cumulative emissions.

1. Introduction

A 21st-century global warming process exceeds the natural variability in the past 1000 years [1]. There is the ample evidence to prove the ecological impacts of recent climate change, from polar terrestrial to tropical marine environments [2]. The temperature increase should be limited to 1.5 °C on the premise of the pre-industry level by 2020, meanwhile, the accumulative emission should reach the peak value according to the United Nations Framework Convention on Climate Change’s 21st Conference of the Parties (COP21) [3]. Similarly, researches showed that the temperature rise would be limited to 2 °C on the premise of less than 400 ppm CO2 in 2050 [4]. According to the Fourth Assessment Report of the Intergovernmental Panel on Climate Change [5], increase in carbon dioxide (CO2) emissions due to energy consumption is a key impact factor for climate change. More than 100 countries have adopted a global warming limit of 2 °C or less (relative to pre-industrial levels) as a guiding principle for reducing climate change risks, impacts and damages [6]. The emissions reductions of carbon dioxide and cumulative carbon emissions from energy consumption in 2050 have arisen widespread concern of various government agencies, scientific circle, and the general public [7,8]. According to the data presented by the United Nations [9] CO2 emissions of China have surpassed those of the United States and became the highest in the world in 2006.
Currently, the analysis of carbon emissions focuses mainly on impact factors of carbon emissions, reduction potential, prediction and so on. Impact factors of carbon emissions mainly included indexes of the population, economic development, structure and technology. The driving impacts of the population scale, resident consumption, urbanization rate, economic development on the carbon emissions and the emissions reduction caused by the adjustment of the industrial structure, energy structure, improvement energy efficiency and low-carbon technology were analyzed in some certain researches [10,11,12,13,14,15,16]. The research on the potential of the emissions reduction was mainly emphasized to analyze the driving impacts of the adjustment of industrial structure and improvement of the energy efficiency on emissions reduction based on the industries study such as iron [8,17], cement [18] and so on. Meanwhile, in the field about forecasting the carbon emissions, Qu [19] and Guo [13] (2010) applied STIRPAT model to predict the carbon emissions peak in China; Zhai [20] and Wang [21] (2012) predicted the carbon emissions peak volume in India based on energy consumption; Zhu et al. [22] (2009) predicted the carbon emissions peak volume of China in 2040 based on energy consumption. The aforementioned researches provided the basis for setting low-carbon development policy to control carbon emissions. However, the analysis of impact factors and emission reduction potential have been used to explained carbon increase factors, carbon reduction factors and emissions reduction potential for discussing low-carbon development of economic society. In contrast, the impact of controlling the cumulative carbon emissions on the low carbon development was neglected in these researches. The developing countries with the faster economic development and larger carbon emissions, such as China, should achieve the low-carbon development of the economic society and the control of the cumulative carbon emissions in 2050 at the same time. It is necessary to reach the carbon emissions peak as early as possible and reduce the peak value as much as possible for limiting the concentration of carbon dioxide in the atmosphere to less than 400 ppm by 2050 in developing country. The research on prediction of carbon emission focused on the carbon emission peak volume and peak time but not the controlling of carbon emission itself. In our previous research, the controlling of carbon emissions peak was analyzed based on the prediction of carbon emissions of energy consumption by using the extended-STIRPAT model [23]. The IPAT model was first developed for calculating the impact of the driving factors on the environment by Ehrlich and Holdren in the 1970s [24]. Based on the IPAT model, the STIRPAT model with the top-down framework was developed to analyze the relationship between the energy consumption and carbon emission [25,26,27]. However, based on the top-down framework of macro-scale, STIRPAT model cannot predict the peak of carbon emissions according to the micro-scale framework, such as industrial sections, business sections and energy type and so on. Thus, the driving factors and the contributions of themselves of the carbon emissions cannot be analyzed based on the STIRPAT model.
The LEAP is a main model based on the down-top framework for simulating energy and carbon emissions. For the convenience of setting the components and variables for simulating the emissions among the different scenarios in LEAP system, the application of the model advantages to simulated the extensive uncertainties for exploring the potential consequences of the different scenarios [28,29,30,31]. Thus, LEAP has a significant impact on energy and environmental polices making worldwide. Up until now, LEAP has been successfully used in more than 150 countries worldwide for various purposes. For example, LEAP was used for energy forecasting and identifying alternative fuels in California. In Mexico, it was used to determine the feasibility of future scenarios based on moderate and high use of bio fuels in the transportation and electricity generation sectors. Similarly, LEAP system was used to estimate total energy demand and the vehicular emissions for passenger transport in the city of Delhi [32].
Therefore, the prediction and controlling of emissions peak was researched based on the LEAP model according to the four scenarios as follow: Low-carbon Scenario, Energy-saving Scenario, Energy-saving to Low-carbon Scenario and Business as Usual Scenario. According to the different coefficient setting in aforementioned scenarios respectively, the carbon emission peak volume and peak time can be forecasted by using LEAP system under the different scenarios. Controlling the peak volume and time for reducing the cumulative carbon emissions in developing regions can be supported based on the forecasting aforementioned. The innovations of this paper are as follows:
(1)
According to the data of industrial terminal and energy consumption terminal, the carbon emission peak volume and time was forecasted based on the down-top framework by using LEAP system;
(2)
According to the prediction, the driving factors and the contribution were analyzed for controlling the peak volume and time.

2. Study Method and Data

Technology route map of this study is showed as Figure 1.

2.1. Overview of LEAP System

LEAP (Long-range Energy Alternatives Planning System) model, an energy-environment system based on scenario analysis was developed by Sweden Stockholm Environment Institute. The LEAP system proceeded comprehensive analysis by considering factors such as demand, transformation, resources, and the environment. The data inputs into the LEAP system according to a hierarchical form and composition of the key assumptions module for entering socio-economic variables [33]. Major factors, such as GDP, population, industry structure, and industry-specific added value, are entered into the LEAP system through the key assumptions module. The total energy demand by sector is forecast through the use of certain data points, such as the activity parameters of the demand sector. The LEAP system can be used to calculate the environmental impact of the demand sector and the transformation sector, because the model is equipped with features such as the IPCC Tier 1 GHG emission factor, the Global Warming Potential [34]. For this purpose, LEAP system is used to calculate the emission of air pollutants and GHGs based on the Technology & Environmental Database (TED) by energy source. TED contains hundreds of emission factor values with regard to energy consumption and production technologies, by virtue of including the default emission factors proposed by the IPCC for estimating GHG emissions and calculating environmental load data [29].
LEAP is a tool to analyze the energy utilization and CO2 emission by considering the different sets of scenarios. The prediction systems of energy utilization and CO2 emission can be built based on the historical data by application of LEAP. According to the different long-run predictions under the different scenarios, the prediction results is input into the hierarchical form of LEAP and linked to the emissions factors of TED for comparing the results under the different scenarios. The comparison provides the support to identify those energy policies and CO2 emission control policies that have better effects on energy conservation, greenhouse gas abatement, or other attributes [9]. Scenario analysis is regarded as the core of LEAP for offering a tools for analyzing, updating and comparing different energy management and CO2 emission control activities [32,35,36].

2.2. Structure of LEAP System

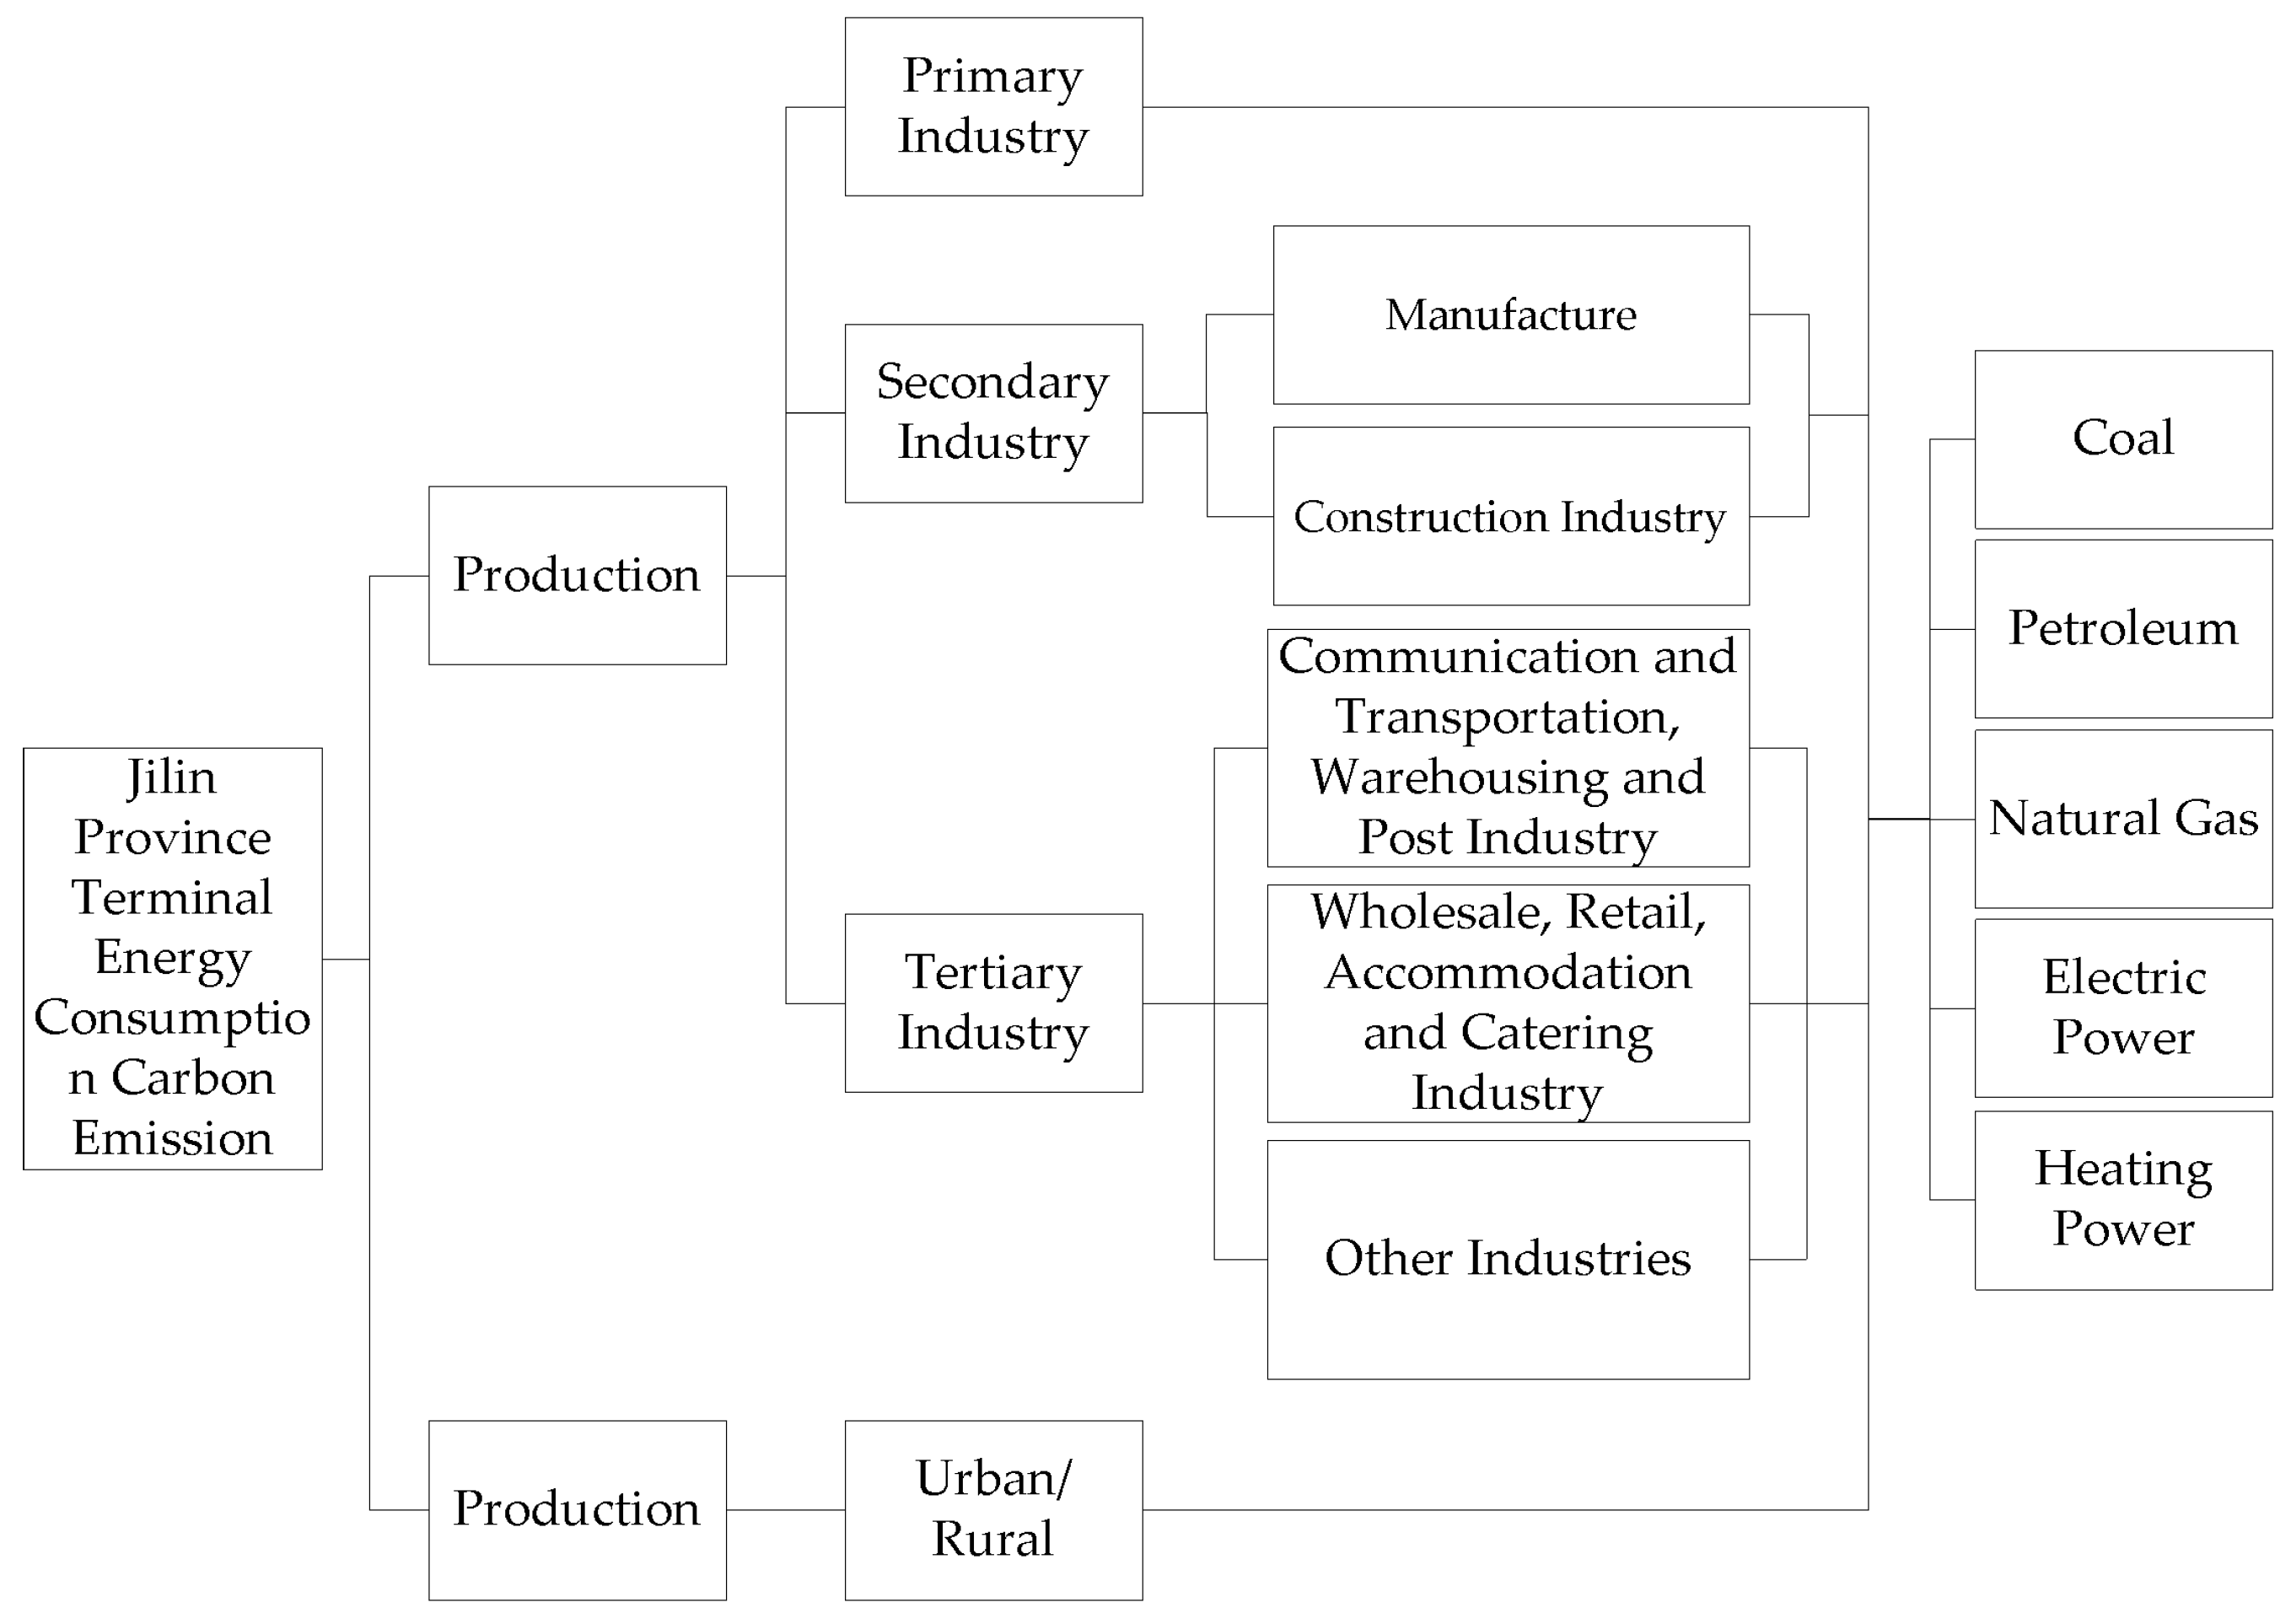
This study takes 2010 as the reference year and 2050 as the target year. The prediction was divided into four activity levels as Figure 2. In the first level, the carbon emission of terminal energy consumption fallen into two departments, namely production and livelihood. The settings of gross regional domestic product and population parameters were included. In the second level, production department is divided into the primary industry, secondary industry and tertiary industry, and livelihood department is divided into urban and rural sectors. The settings of the parameters of industrial structure and urbanization rate are contained. In the third level, the secondary industry is subdivided into manufacture industry and construction industry, and the tertiary industry is subdivided into communication and transportation, warehousing and post industry, wholesale and retail industry, accommodation and catering industry, and so on. The parameter settings of business structure and energy intensity are included. In the last level, five energy types are set for each terminal—coal, petroleum, natural gas, electric power and heating power respectively. The settings of energy structure and carbon emission coefficient parameters are included.

2.3. LEAP Calculation

The carbon emission of energy consumption can be calculated by formula as follow:
C = C 1 + C 2
where C is the carbon emission generated by the terminal energy consumption of Jilin Province; C1 is the carbon emission of the terminal energy consumption in production department, C2 is the carbon emission of the terminal energy consumption in livelihood department.
C 1 = i j n G × A L i , j , n × G E I i , j , n × f i , j , n
where G is gross regional domestic product; ALi,j,n is the proportion taken by the gross value of production of energy consumption n in the gross regional production in industry activity level j under industry i; GEIi,j,n is to the consumption intensity of energy n in industry activity level j under industry i; fi,j,n is the carbon emission factor of energy consumption n in industry activity level j under industry i.
C 2 = i n P × A L i × P E I i , n × f i , n
where P is the population gross of whole province; ALi is the proportion taken by the population of Jilin Province in national total population under living standard i; PEIi,n is to consumption intensity of energy n under living standard i—per capita energy consumption; fi,n is the carbon emission factor of energy consumption n under living level i.

3. Empirical Study

3.1. Study Area Survey

As one of the old industrial bases in northeast China, the greenhouse gases emission reduction target for the following five years of Jilin Province was explicated in the 12th Five-Year Plan [37]: CO2 emission of unit regional Gross Domestic Product (GDP) should be lowered than that of 2010 by 17%. In the coal impoverishing, petroleum lacking and gas defaulting energy context of Jilin Province, predicting and controlling the carbon emission peak of the value terminal energy consumption and analyzing the driving effects conducted by each factor to regional carbon emission peak value year and peak volume, and realizing the sharp cut to the carbon emission of the future years have significant practical meaning for implementing national emission reduction obligation and regional low-carbon development [17].

3.2. Setting of Scenario

Scenario analysis supplied the various possible programs according to the detailed and strict ratiocination and description on the basis of the crucial assumptions on the development of society, economy, industry and technology. According to each phase of the economic development features and low-carbon society development of Jilin Province, this study sets four scenario projects: low-carbon scenario, energy-saving low-carbon scenario, low-carbon scenario and business as usual scenario.

3.2.1. Business as Usual Scenario (BAU)

BAU was set according to the status of social-economy before 2005. In this scenario, economic development was emphasized: meanwhile, the energy conservation and emission reduction was neglected. Thus, the values of the population, growth rates of gross regional domestic product, urbanization were relatively high, the dependency degree on the secondary industry in industry and business structure was still high, and the proportions of traditional energy in energy structure, such as coal and petroleum, were quite high. The settings of energy structure, industrial structure, energy intensity, carbon emission factors, and so on were based on the level before the implementation of the energy conservation and emission reduction policy, which reflects the economic development and carbon emission conditions of the natural guide type.

3.2.2. Energy-Saving Scenario (ESS)

ESS was set based on the social development status of “the 11th Five-Year Plan”. In this scenario, energy saving scheme was taken into account, meanwhile the population and industrial structure kept the same developing level with that of BAU. The setting of future developing situation, such as, energy intensity, carbon emission coefficient and so on, is on the basis of the implementing level of the energy conservation and emission reduction policy to improve energy efficiency and the application of low-carbon technology. Based on the existing energy saving policy to promote the implement of carbon emission reduction, this scenario basically reflects the conditions of economic development and carbon emission status under the guidance of energy saving policy.

3.2.3. Energy-Saving and Low-Carbon Scenario (ELS)

Based on the process of implementing the energy conservation and emission reduction policy, ELS was set to carry out the low-carbon social construction and slow down the growth rates of economic development, population and urbanization, and reduces the dependence on manufacture and traditional primary energy. The setting of the future developing status, such as, energy structure, energy intensity, and emission factors, etc. is to gradually deepen the low-carbon development, e.g., increasing the proportion taken by non-fossil energy and further improving the energy-saving and low-carbon technical level, and so on. This scenario pays attention to the coordinated development of economy and environment and fundamentally reflects the state of economic development and carbon emission accomplished through one’s own effects on the basis of energy saving.

3.2.4. Low-Carbon Scenario (LCS)

LCS was set in expanding the overall low-carbon society construction, comprehensively considering the sustainable development of the social economy and environment. The pattern of society was changed positively on the premise of stable economic development through improving the technology and controlling the population, energy consumption and so on. According to the aforementioned pathway, there was an obvious impact on the economy, technology, energy and so on. LS mainly indicated the status of economic development and carbon emission that can be accomplished.

3.3. Scenario Parameter Setting

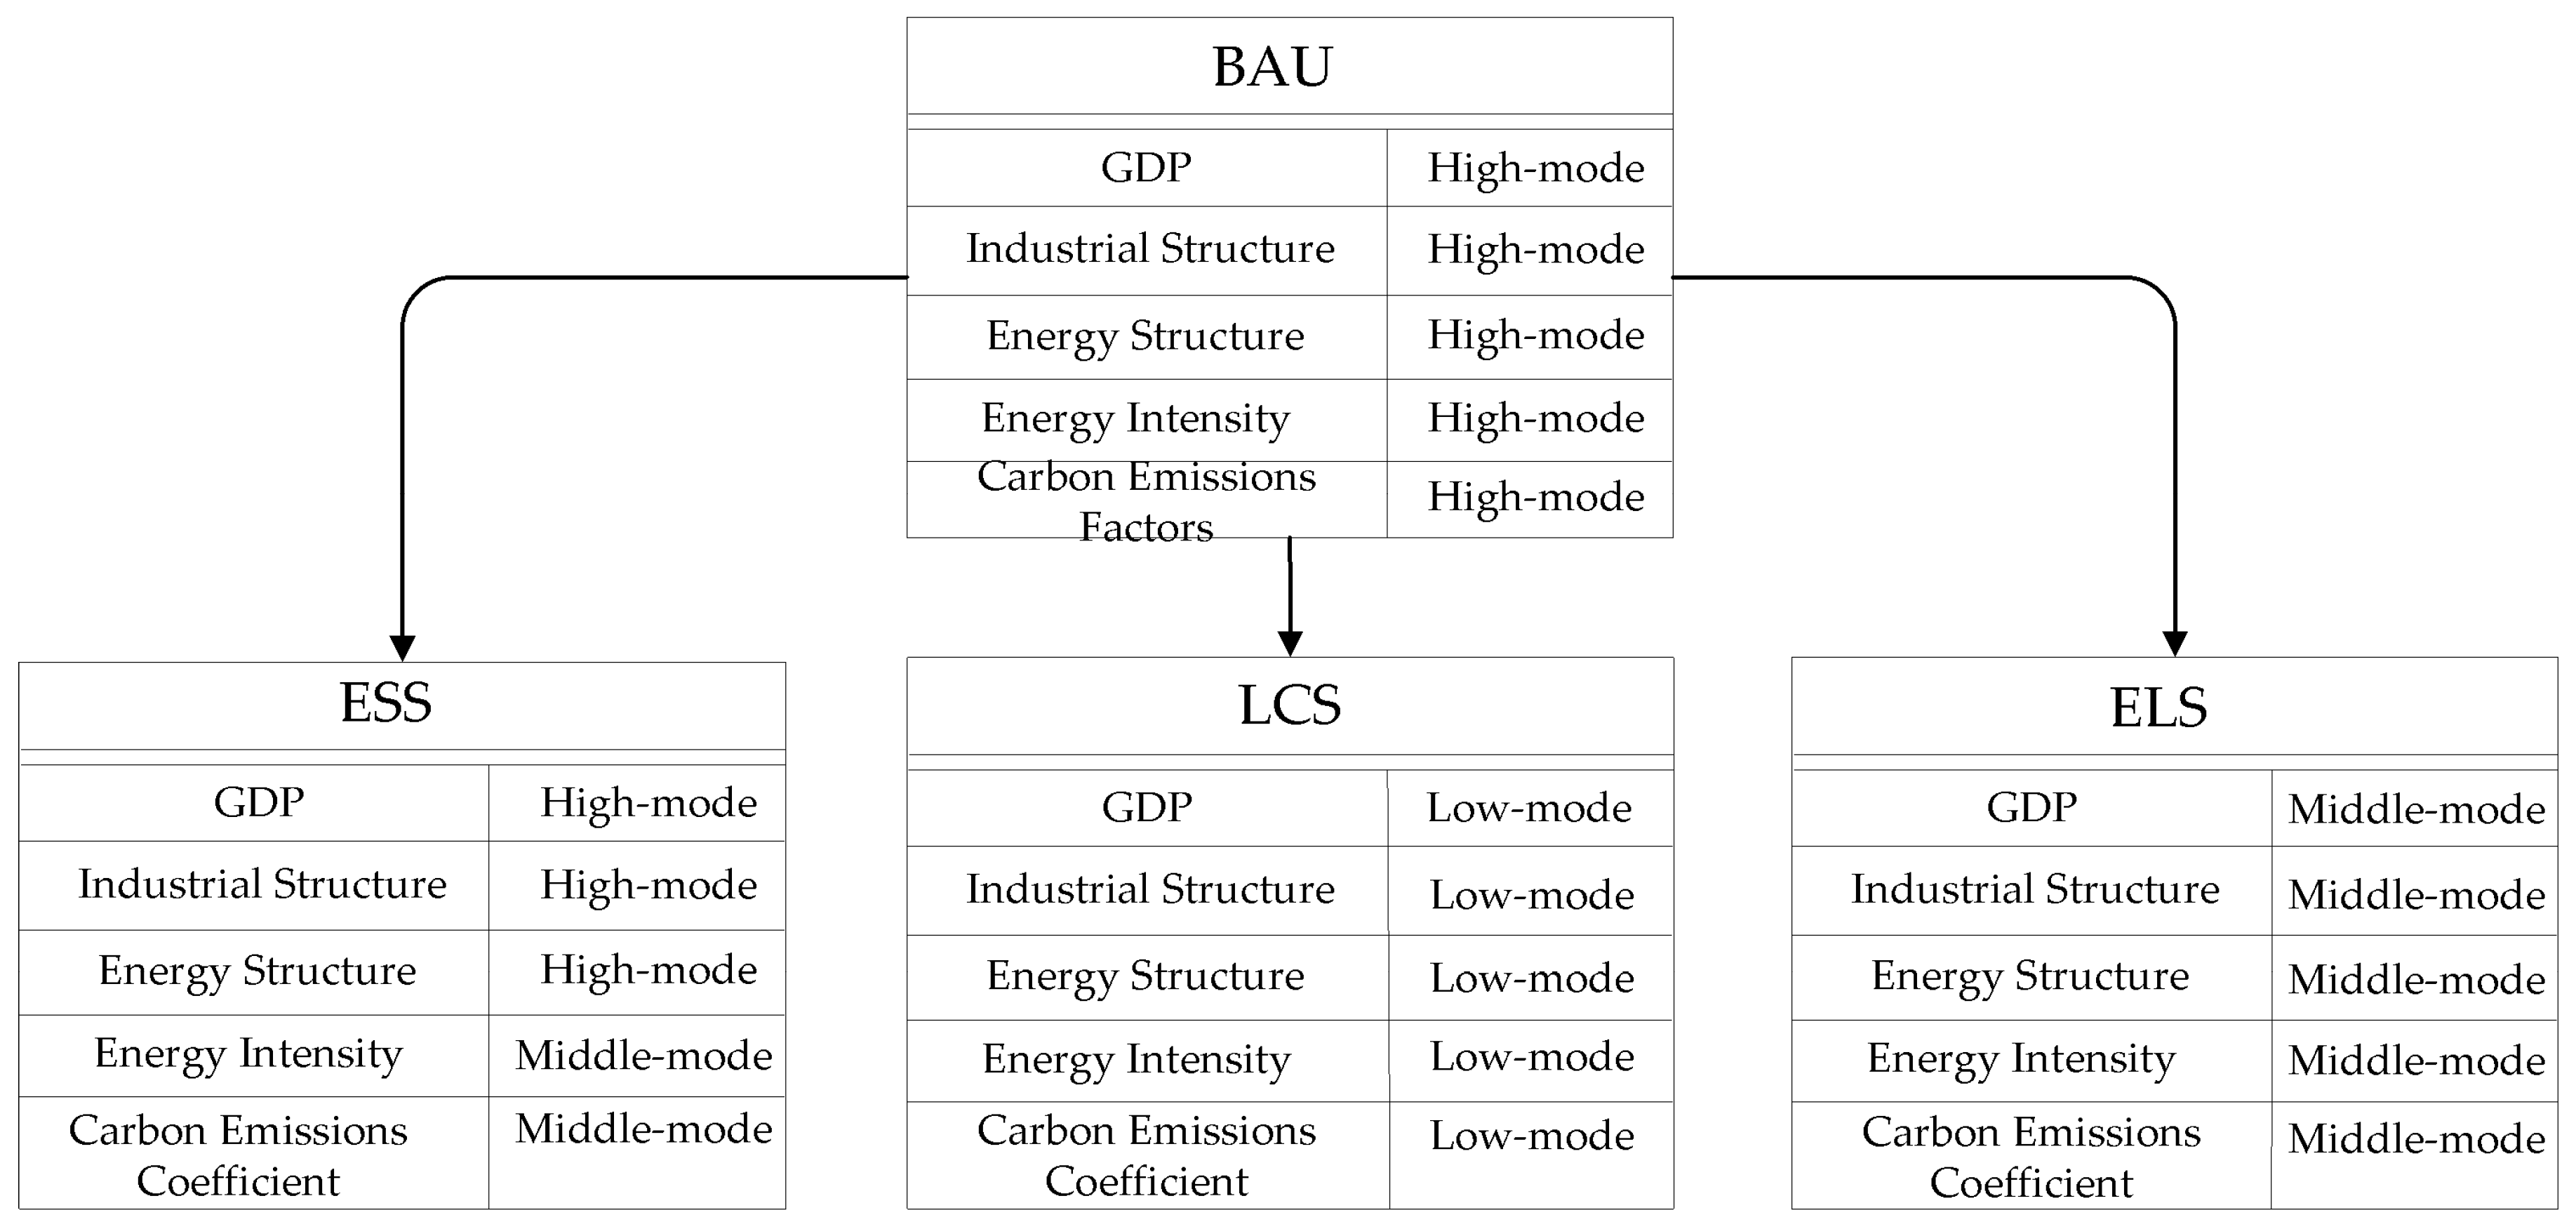
For the eight carbon increasing factors, including population, gross regional domestic product, urbanization rate, industrial structure, business structure, energy structure, energy intensity and carbon emission coefficient, from the perspective of emission reduction, the lower the value of each factor is, the smaller regional carbon emission becomes. Therefore, we should set three modes of low, medium and high for various factor values. The reason of setting the parameter is the correspondence of the main factors to a data set, but not a data point. For example, industry structure factors correspond to the data sets of proportions taken by the primary industry, secondary industry and tertiary industry respectively in GDP. Since the settings are rather complex, each factor’s rates of change were set into high, medium and low changing modes. According to the suitable changing patterns of each factor (i.e., high-mode, medium mode, or low mode), the four scenarios were composed. As is shown in Table 1.

3.3.1. Population

According to the prediction of United Nations, China’s population will reach its peak value in the 2030s; Lin and Liu [38] (1995) estimated that the population of Jilin Province could reach its peak value in the year 2028 or so. Based on this, it can be set that high mode population will reach its peak value in the year 2030, which will be 28,560,000 or so. The average annual population growth in Jilin province from 2000 to 2010 was 0.36%. In the 12th Five-Year Plan of Jilin Province, the annual average growth rate of population needs to be controlled to within 3‰. 3‰ can be considered as the basis to set the medium mode population peak value in 2025. The low mode population peak value would appear in 2020, which will be 27,640,000 (in Table 2).

3.3.2. Gross Regional Domestic Product

The annual average GDP growth rate of Jilin Province from 2001 to 2010 is 12.4%, which is higher than that of the national average level. In the 12th Five-Year Plan of Jilin Province [37], the expected growth rate of GDP is 12%. According to the target, the gross regional domestics product of high mode was set to be 363.136 billion Yuan by the year 2030. The economy growth rate of China from the year 2010 to 2020 was set to be 8.3% in 2050 China Energy and CO2 Emission Report [4]. Based on this, the gross regional domestic product of the medium and low modes in the year 2030 can be set to be 302.814 billion and 199.688 billion Yuan respectively (in Table 2).

3.3.3. Urbanization Rate

Referring to 2050 China Energy and CO2 Emission Report [4], the urbanization rate in China will reach 63% by 2020. Song [39] (2007) predicted that, by the year 2030, the national urbanization rate will amount to or be higher than 60 %. Based on the aforementioned researches, the urbanization rate of high model was set to reach 60% by 2030. After the 18th National Congress of Communist Party of China, China has proposed to accelerate urbanization process [40]. Based on this, it can be set that the urbanization rates of the medium and low modes will achieve 62.45% and 60.07% by 2030, as is shown in Table 2.

3.3.4. Industrial Structure

Jilin Province is still in the process of industrialization. Stabilizing the primary industry, controlling the secondary industry and developing the tertiary industry will be the main target for the future optimization of industrial structure. The proportion of secondary industry increased from 40.05% to 51.99% in 2000–2010, and the proportion of tertiary industry was stable around 40%. The proportion of secondary industry of China was to be forecast to be 48.7% by 2050 [41]. Based on this, by 2050, it can be set that the proportion taken by the secondary industry in high mode is to be about 49%. In the 2050 China Energy and CO2 Emission Report [4], the proportion taken by the secondary industry of the year 2050 was set as 39.6%. Based on this, it can be set that, by 2050, the proportions taken by the secondary industry under medium and low modes will be 45% and 40% respectively. The setting value is listed in Table 2.

3.3.5. Business Structure

According to LEAP framework, division of inner structure in the primary industry was not required. The secondary industry mainly includes manufacture and construction industry, and the tertiary industry is subdivided into communication and transportation, warehousing and post industry, wholesale and retail industry, accommodation, catering industry and so on.
In the last decade, the inner structure of secondary industry in Jilin Province stayed relatively stable. From 2000–2010, the average annual growth rate of manufacture in Jilin province was about 1.5‰, and the average annual growth rate of construction industry reduced by 9.6‰. 2050 China Energy and CO2 Emission Report [4] presented that the construction industry’s proportion would show a slow descent tendency with a −0.01% annual average rate. The 12th Five-Year Industrial Developing Plan [37] indicates that the gross industrial production rate in 2015 would remain at 15% or so. Based on this, high mode of manufactory industry proportion was set to be controlled at about 89.8% in 2030 while the medium mode and the low mode proportions slightly reduce to 86.8% and 84.9% respectively (in Table 2).

3.3.6. Energy Structure

The types of terminal energy refer to the division of regional energy balance sheet in the statistical system, mainly including coal, oil, gas, heat, and electric power. The setting of sector energy structure particularly focuses on electric power, reduces the use of coal, oil, and to a certain extent, enlarges the using range of natural gas. The non-fossil energy proportion in 2015 was identified to be 9.8% or so according to the 12th Five-Year Plan of Jilin Province [37]. Based on the aforementioned plan, the high mode fossil energy proportion in 2050 could be set to be controlled at about 75%. The proportion of non-fossil energy consumption to primary energy consumption in 2020 was identified to be 15% or so according to the State Council of People’s Republic of China indicates [42]. Based on this, it can be set that the fossil energy portions of medium and low modes in 2050 will be controlled at 65% and 55% respectively. In this article, we set the parameter changes of energy structure respectively in primary industry, secondary industry, Tertiary industry, Urban livelihood, Rural livelihood.

3.3.7. Energy Intensity

Energy Intensity is the index of energy consumption per unit GDP. Energy intensity should be reduced by 16% as an obligatory target presented in the 12th Five-Year Plan of Jilin Province [37], namely 1.07 t/10,000 RMB in 2015. The annual average rate from 2011 to 2015 is −3.427%. Based on this, it can be set that the high mode energy intensity in 2030 should be controlled at about 0.75 tec/10,000 RMB. The annual average rate of energy intensity in Jilin Province from 2006 to 2010 is in the interval from −4.09% to −6.35%. Based on this, it can be set that the Energy Intensities in the medium mode and low mode will be controlled around 0.61 tec/10,000 RMB and 0.48 tec/10,000 RMB respectively by 2030. Terminal energy intensity includes two departments, the production section and the livelihood section, the parameter changes of energy intensity were set respectively. The value above is the comprehensive calculation of the combination of the energy intensity of production department and livelihood department, industrial structure and business Structure.

3.3.8. Carbon Emission Coefficient

According to the LEAP system, the carbon emission coefficient was set in a default thermal power carbon emission coefficient. In the project of the low-carbon development path of Jilin Province, the carbon emission coefficient of thermal power in 2050 would be reduced by 16% to 18% comparing to the coefficient of 2010. Considering both the history and the prediction, it can be set that the high mode electrical carbon emission coefficient will be about 4.29 tCO2/tec in 2050, while the medium mode and the low mode coefficients slightly reduce to 3.77 tCO2/tec and 3.32 tCO2/tec respectively. As is shown in Table 2.
As the Table 1 showed that combined with scenario description and parameters setting, we determined the mode selection of factors under the various scenarios.

4. Results and Discussion

4.1. Prediction of Peak Amount of Carbon Emission

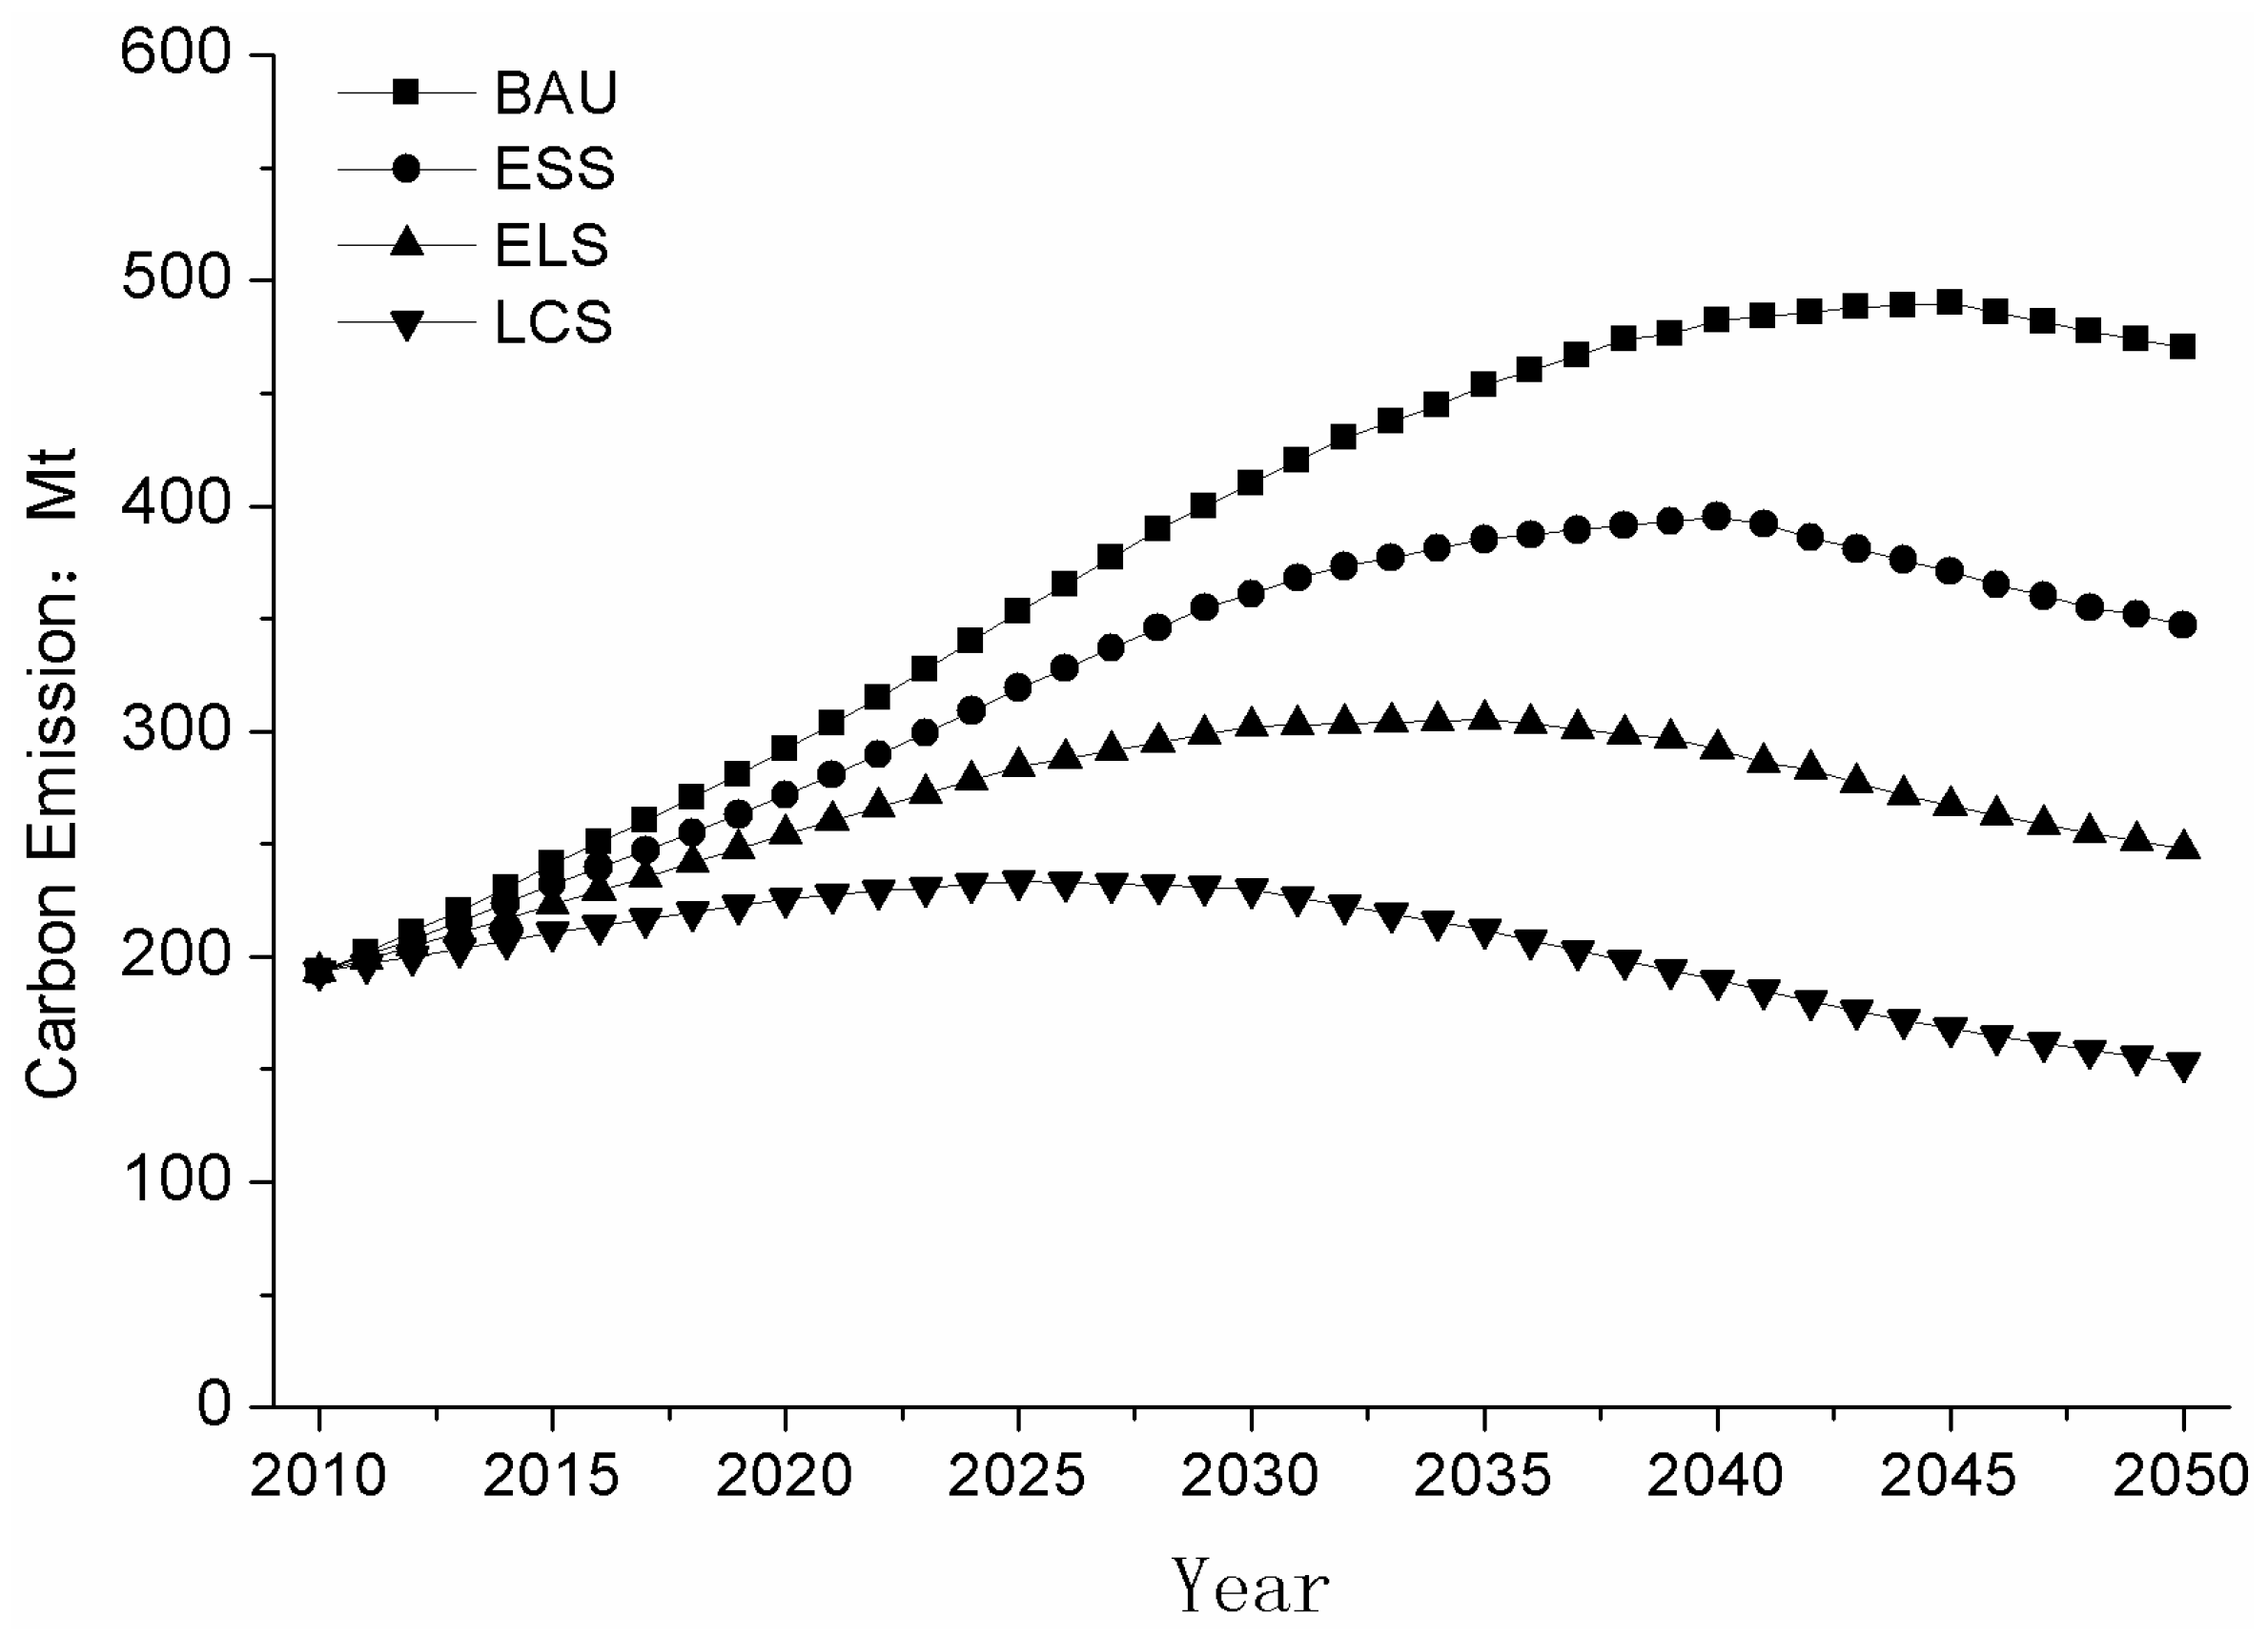
According to the modeling results, the tendencies of carbon emissions under the different scenarios showed the same status as Figure 3 and Table 3 showed. The peak volume all appeared during 2025 to 2045. According the tendency under the BAU, the peak volume would appear in 2045 and the value is 489.93 million tons. Meanwhile, there is the peak of curve at 2040 under the ESS and the value is 395.17 million tons. The same phenomenon appears at 2035 under the saving energy-LCS, the max value of carbon emissions is 305.25 million tons. Contrasting with the scenario above, the peak volume under the LCS would appear earlier and the value would be lower. The max value of carbon emission is 233.57 million tons by 2025. Based on the calculation results, we explored the accumulative value of the carbon emissions under different scenarios. Under the BAU, the value is 15.632 billion tons during the period from 2010 to 2050. The same value is 13.321 billion tons under the ESS. Meanwhile, the accumulation carbon emission from 2010 to 2050 is 10.971 billion tons under the saving energy-LCS. The lowest value among the scenarios is 8.379 billion tons under the LCS. By comparing the peak volume and the peak time under the different scenarios, the value of accumulative carbon emission during the period from 2010 to 2050 was lower in the case of the lower peak volume and earlier peak time.

4.2. Analysis of the Driving Factors and Contributions

The simulation showed that the peak volume under the BAU is 489.83 million tons and 2.53 times of the value in 2010. The value of peak volume is 2.04 times of the value in 2010 under the ELS. Meanwhile, the maximum value is 1.58 times of that in 2010 under the ELS. In addition, the same value is 1.21 times higher than the value in 2010 under the LCS.

4.2.1. Analysis of the Driving Factors

We assessed the impact of the carbon emission peak by changing the values of factors including the population, GDP, urbanization, industrial structure, business structure, energy structure, energy intensity and carbon emission coefficient in sequence from the high-speed development to the low-speed development. The calculation results showed that GDP, business structure, energy intensity and carbon emissions coefficient respectively led to the 32.28%, 10.63%, 14.6% and 24.77% drop in the value of the carbon emissions under the BAU. Thus, the four factors above are the main driving forces to reducing the carbon emissions according to the BAU. The calculation under the ESS showed the same results. The drops of 29.48%, 13.38%, 17.2% and 21.34% in the carbon emission are respectively contributed by the GDP, business structure, energy intensity and carbon emission coefficient. The same phenomenon also appeared under the ELS. The drop values of the carbon emission due to the GDP, the business structure, the energy intensity and the carbon emission coefficient are respectively 28.32%, 10.76%, 14.7%, and 14.32%. The consistent results indicated that same four main driving factors, namely GDP, business structure, energy intensity and carbon emission coefficient under the LCS. The values of carbon emissions fell by 20.82%, 8.05%, 11.7% and 11.57% respectively under the different scenarios.
According to the analysis aforementioned, the main driving factors to control peak volume of carbon emissions were GDP, business structure, energy intensity and carbon emissions coefficient under every scenario (see Figure 4). GDP is the economic growth factor, business structure and energy structure are the structure factors, and the energy intensity and the carbon emission coefficient are the main technical factors. Comparing the values of the four driving factors under every scenario, the impact of GDP on carbon emission was most obvious among the factors. The energy intensity was the secondarily obvious factor as well as the business structure, and the energy structure was the third.

4.2.2. Analysis on the Contributions

The peak value of the carbon emission would be 489.83 million tons under the BAU because of the higher speed economic growth, higher secondary industry rate, higher fuel occupation, higher energy intensity and higher carbon emission coefficient according to the reality in the 11th five years plan.
As the result list in the above table showed, the values of the GDP, business structure and energy structure under ESS were set as same as the values under the BAU. Relatively, the values of the energy intensity and carbon emission coefficient were descent from high-mode to middle-mode for discussing the impact of technical development on the peak volume and accumulative value of carbon emission (see Figure 5). The results indicated that the peak volume would appear in 2040 and the value would be 395.17 million tons. Definite value changes of the energy intensity and carbon emission coefficient from high-mode to middle-mode under the ESS were as follow. During 2011 to 2040, the rate of change of energy intensity is −4% to −2.7% in middle-mode instead of −3.4% to −1.2% in high-mode. The value of the energy intensity should be 0.029, which was 27.3% lower than that of high-mode. Meanwhile, the change rate of the carbon emission coefficient is −0.025% to −0.01% in middle-mode instead of −0.02% to −0.008% in high-mode. The value of the carbon emission coefficient would be 3.99 and was 9.7% lower than the value in high-mode. Thus, the driving impact of the technical improvement on the peak volume was as followed. The peak volume is decreased by 94.66 million tons and almost 20% to the value under the BAU. By 2050, the accumulative value of the carbon emission would be 2.311 billion tons and was 15% lower than the value under the BAU.
For discussing the impacts of the economic growth, business structure, energy structure and technical level on the peak volume and accumulative carbon emission, we assumed that the main five driving factors in ELS were set in the middle-mode. The peak volume of carbon emissions would be 305.25 million tons at 2035. The values of technical factors were set as same as the values under the ESS. Meanwhile, the change rate of the GDP is from 9% to 4.5% in middle-mode instead of 10% to 5.5% in high-mode, the value of GDP would be descent from 42.27 million Yuan to 33.47 million Yuan in 2035. The change rate of the secondary industrial occupation is from 8% to −0.5% in middle-mode instead of 9% to 0.2% in high-mode. The value of secondary industrial occupation would be descent from 57.04% to 53.67% in 2035. The change rate of the non-fossil energy occupation is from 10% to 3% in middle-mode instead of 8% to 2.5% in high-mode, the value of non-fossil energy would be ascent from 20% to 26.8% in 2035. The analysis showed that the peak amount of carbon emissions under the ELS is decreased by 176.17 million tons and almost 38% to the value under the BAU. Meanwhile, the accumulative value of carbon emission by 2050 would be 4.661 billion tons and would be 70% of the value under the BAU.
For explaining the mechanism of reducing the peak volume and accumulative value of carbon emissions, the LCS was assumed that the economic growth factors were set in middle-mode, the structure factors and technical factors were set in low-mode according to the sustainable development. The peak volume under the LCS would be 233.57 million tons in 2025. During 2011 to 2035, the definite rates of change of the driving factors were as followed. The change rate of the secondary industrial proportion was from 4% to −0.7% in low-mode instead of 9% to −0.5% in high-mode, the value of secondary industrial proportion was descent from 57.98% to 49.7%, namely million Yuan at 2025. The change rate of the non-fossil energy proportion was 12% to 6% in low-mode instead of 8% to 2.5% in high-mode, the value of non-fossil energy was ascent from 15.1% to 22.9% at 2025. The value of energy intensity was 0.0375 in low-mode and was 66.7% of the value in high-mode. Meanwhile, the change rate of the carbon emission coefficient was −0.03% to −0.02% in low-mode instead of −0.02% to −0.015% in high-mode, the value of carbon emission coefficient was descent from 5.04 to 4.49 and was 11.5% of the value in high-mode at 2025. The analysis showed that the peak volume under the LCS was decreased by 256.26 million tons and almost 52% to the value under the BAU. Meanwhile, the accumulative value of reducing carbon emission was 7.253 billion tons and was 54% of the value under the BAU by 2050.
Based on the scenario analysis aforementioned, the maximum value of carbon emission could be reduced by 20% to 52% and the accumulative value could be reduced by 15% to 46% on the premise of keeping economic development by adjusting the business structure and energy structure and improving the technical level.

4.3. Analysis on the Driving Factors and Contributions of the Peak Time

Comparing with the peak volume and time under the four scenarios, an interesting phenomenon could be found that the less peak volume and the earlier peak time could cause the less accumulative carbon emission at 2050. Namely, the accumulative carbon emissions could be reduced by controlling the peak volume and time. The simulation results showed that the peak time was 2045 under the BAU. Contrasting with the BAU, the peak time brought forward five years, ten years and fifteen years respectively under the other three scenarios by improving the technical level and controlling the economic growth and adjusting the industrial and energy structure.

4.3.1. Analysis Impact of the Driving Factors on Peak Time

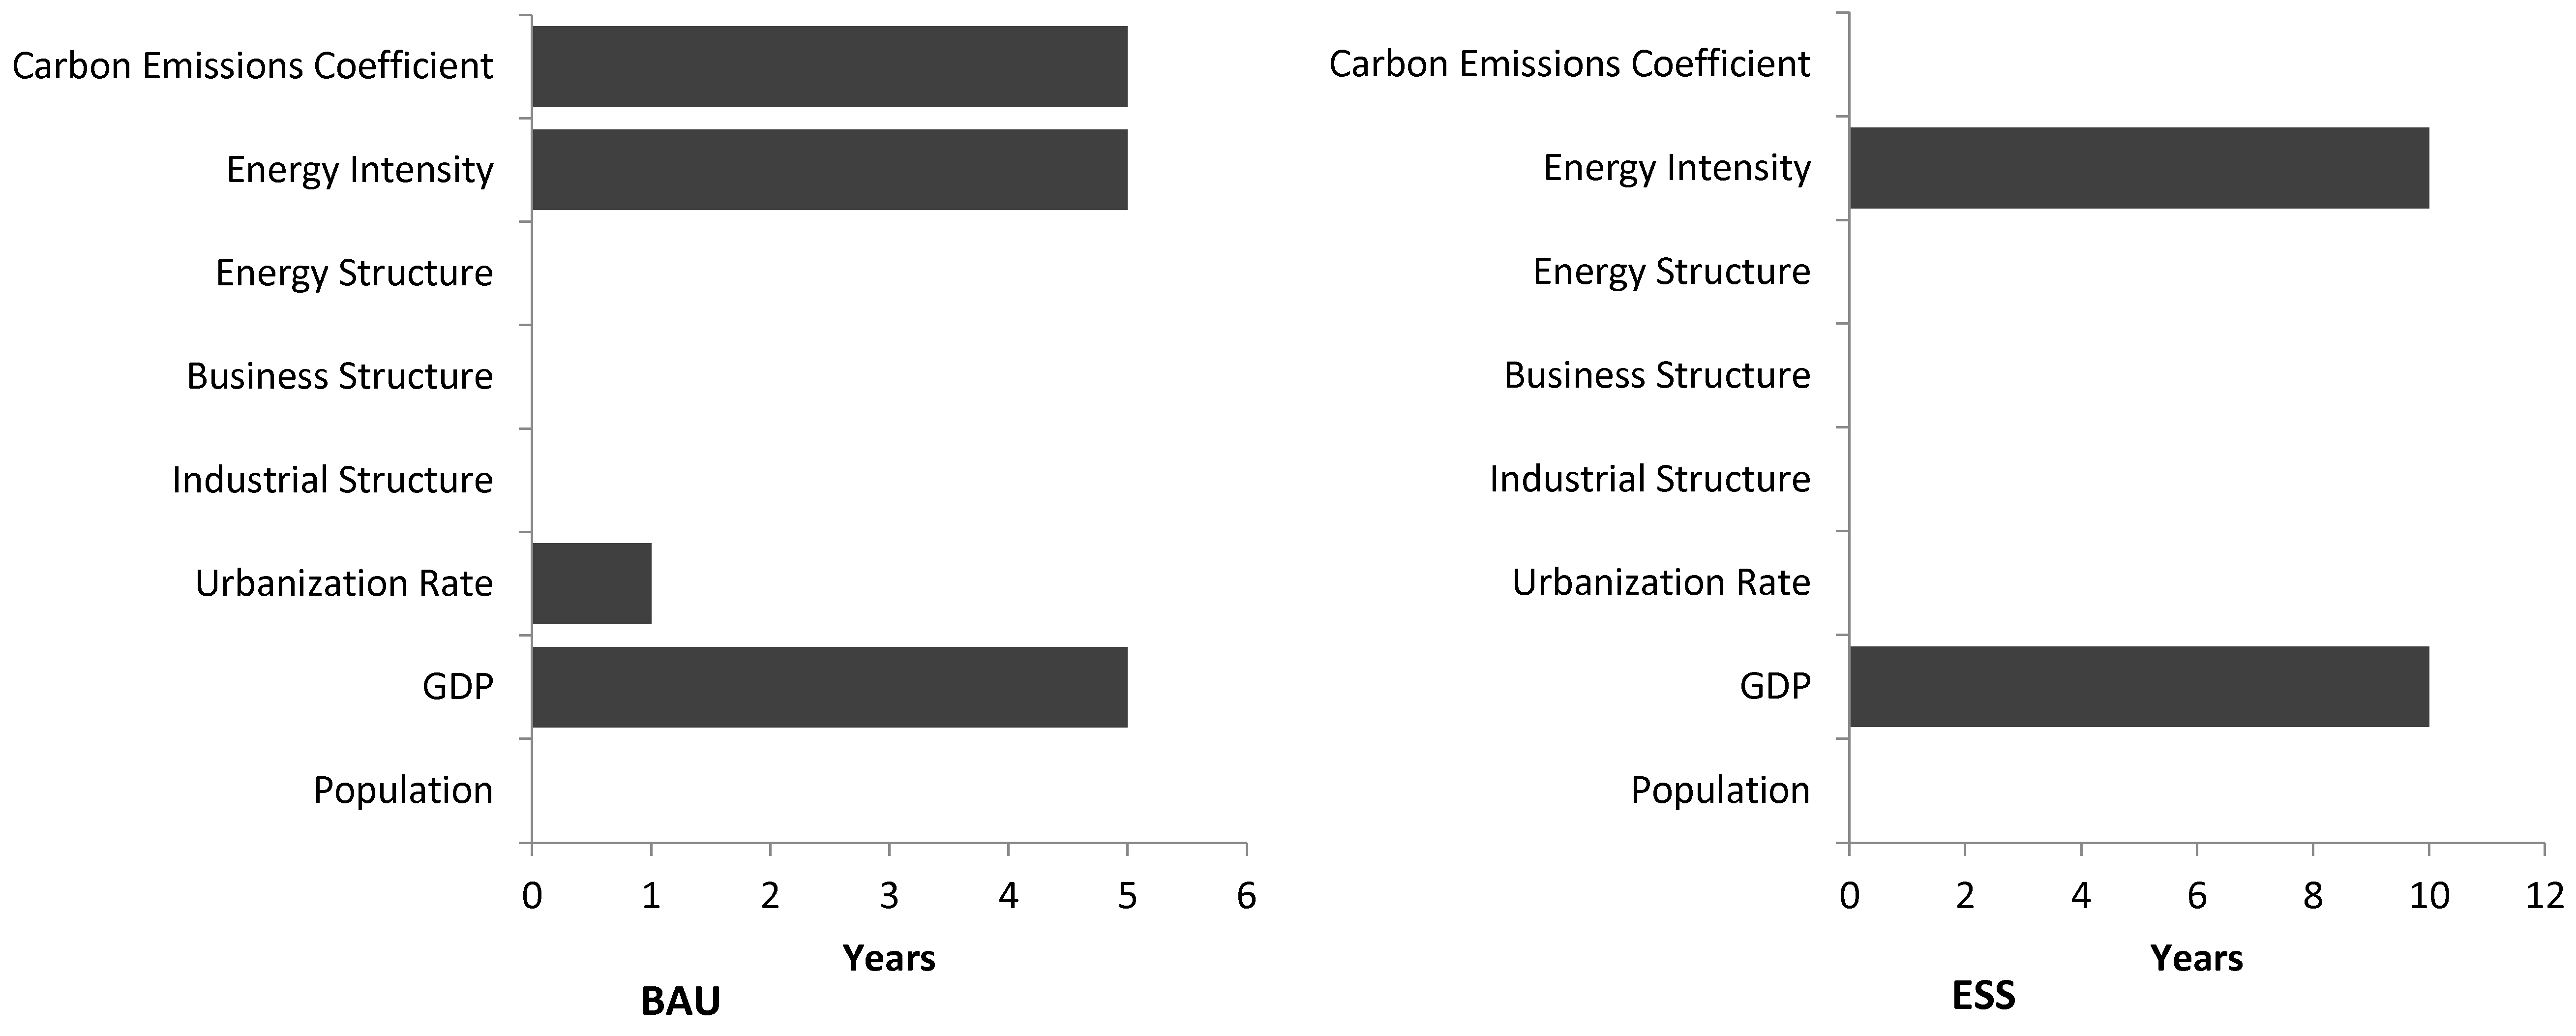
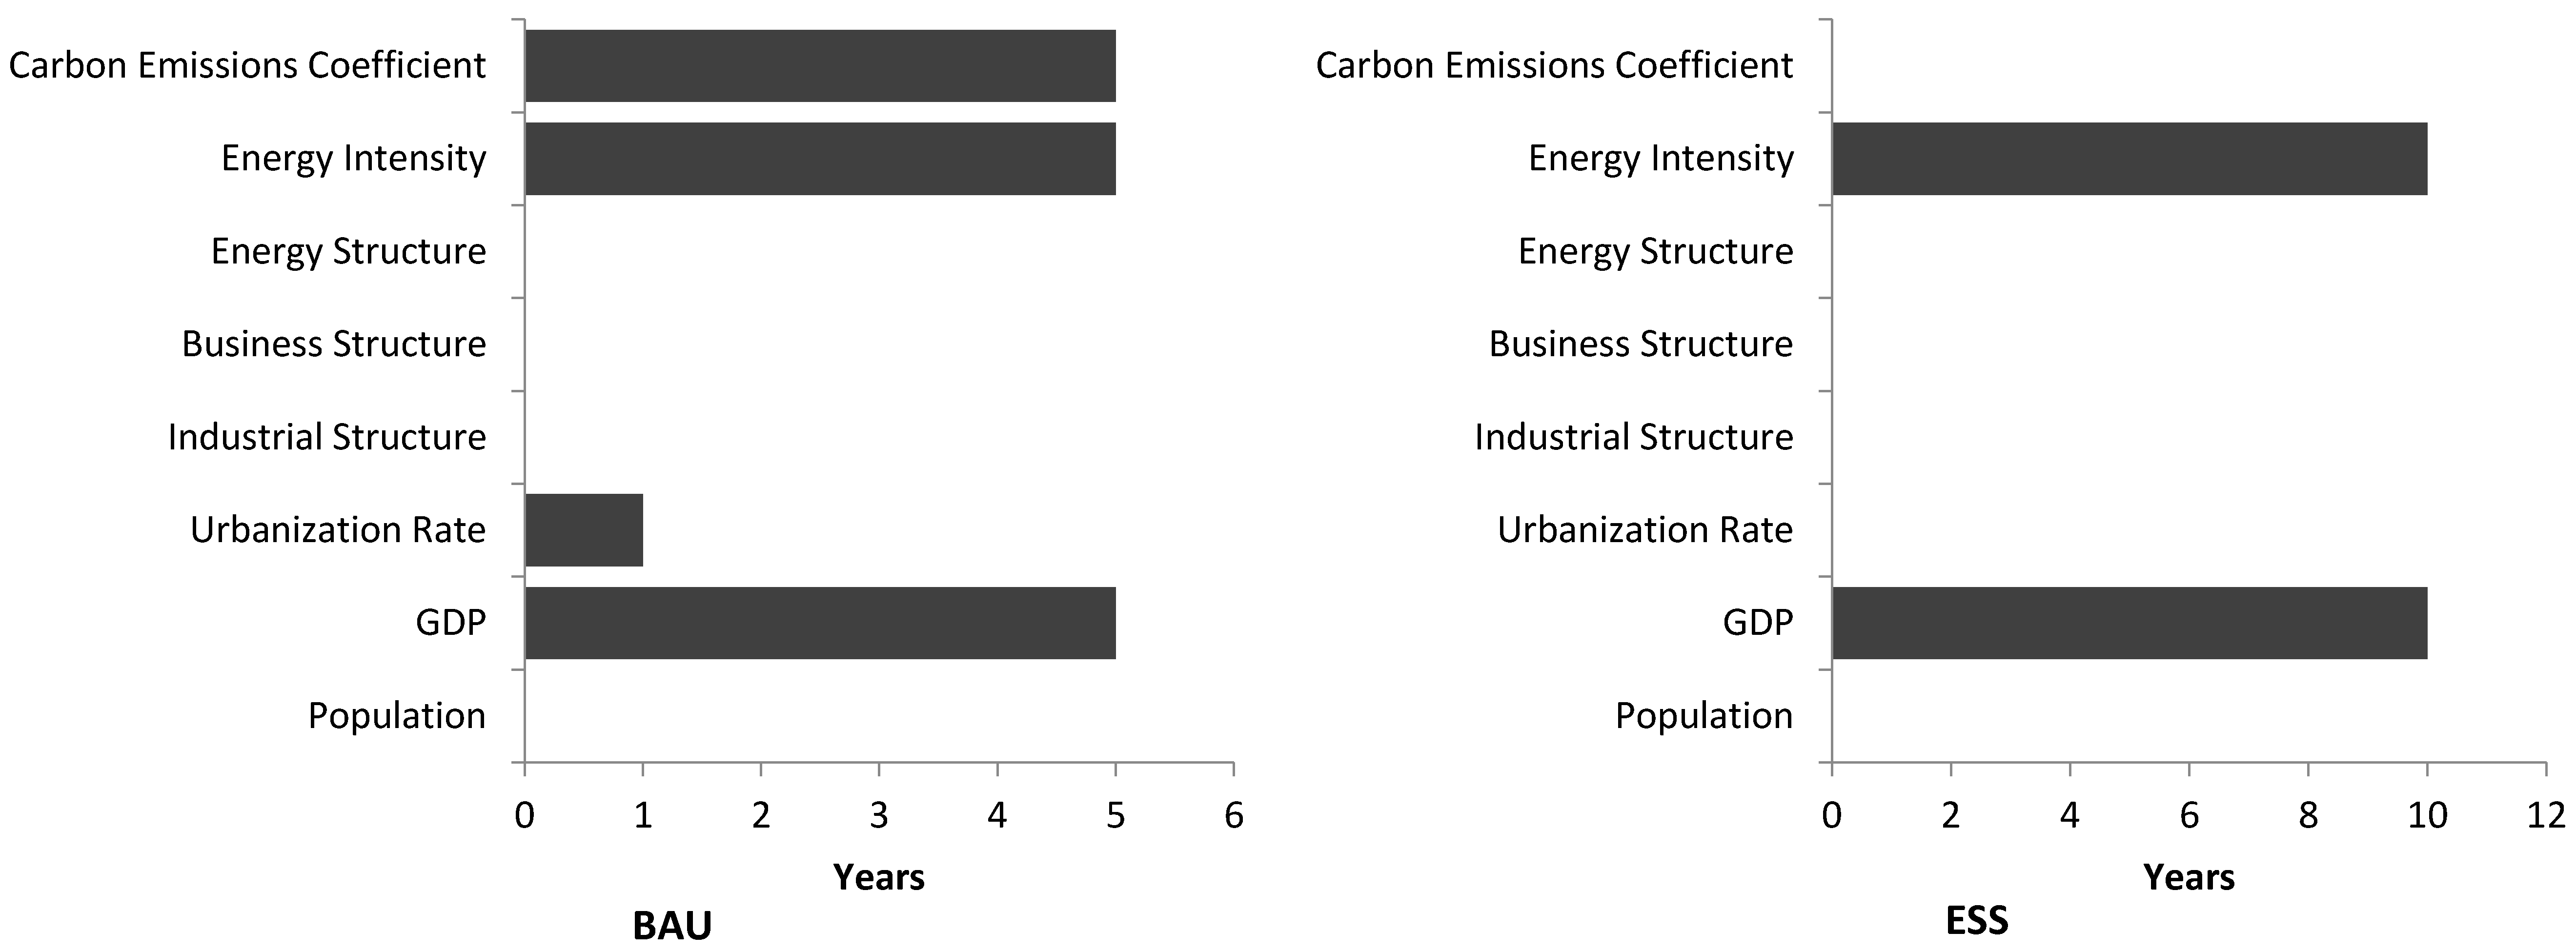
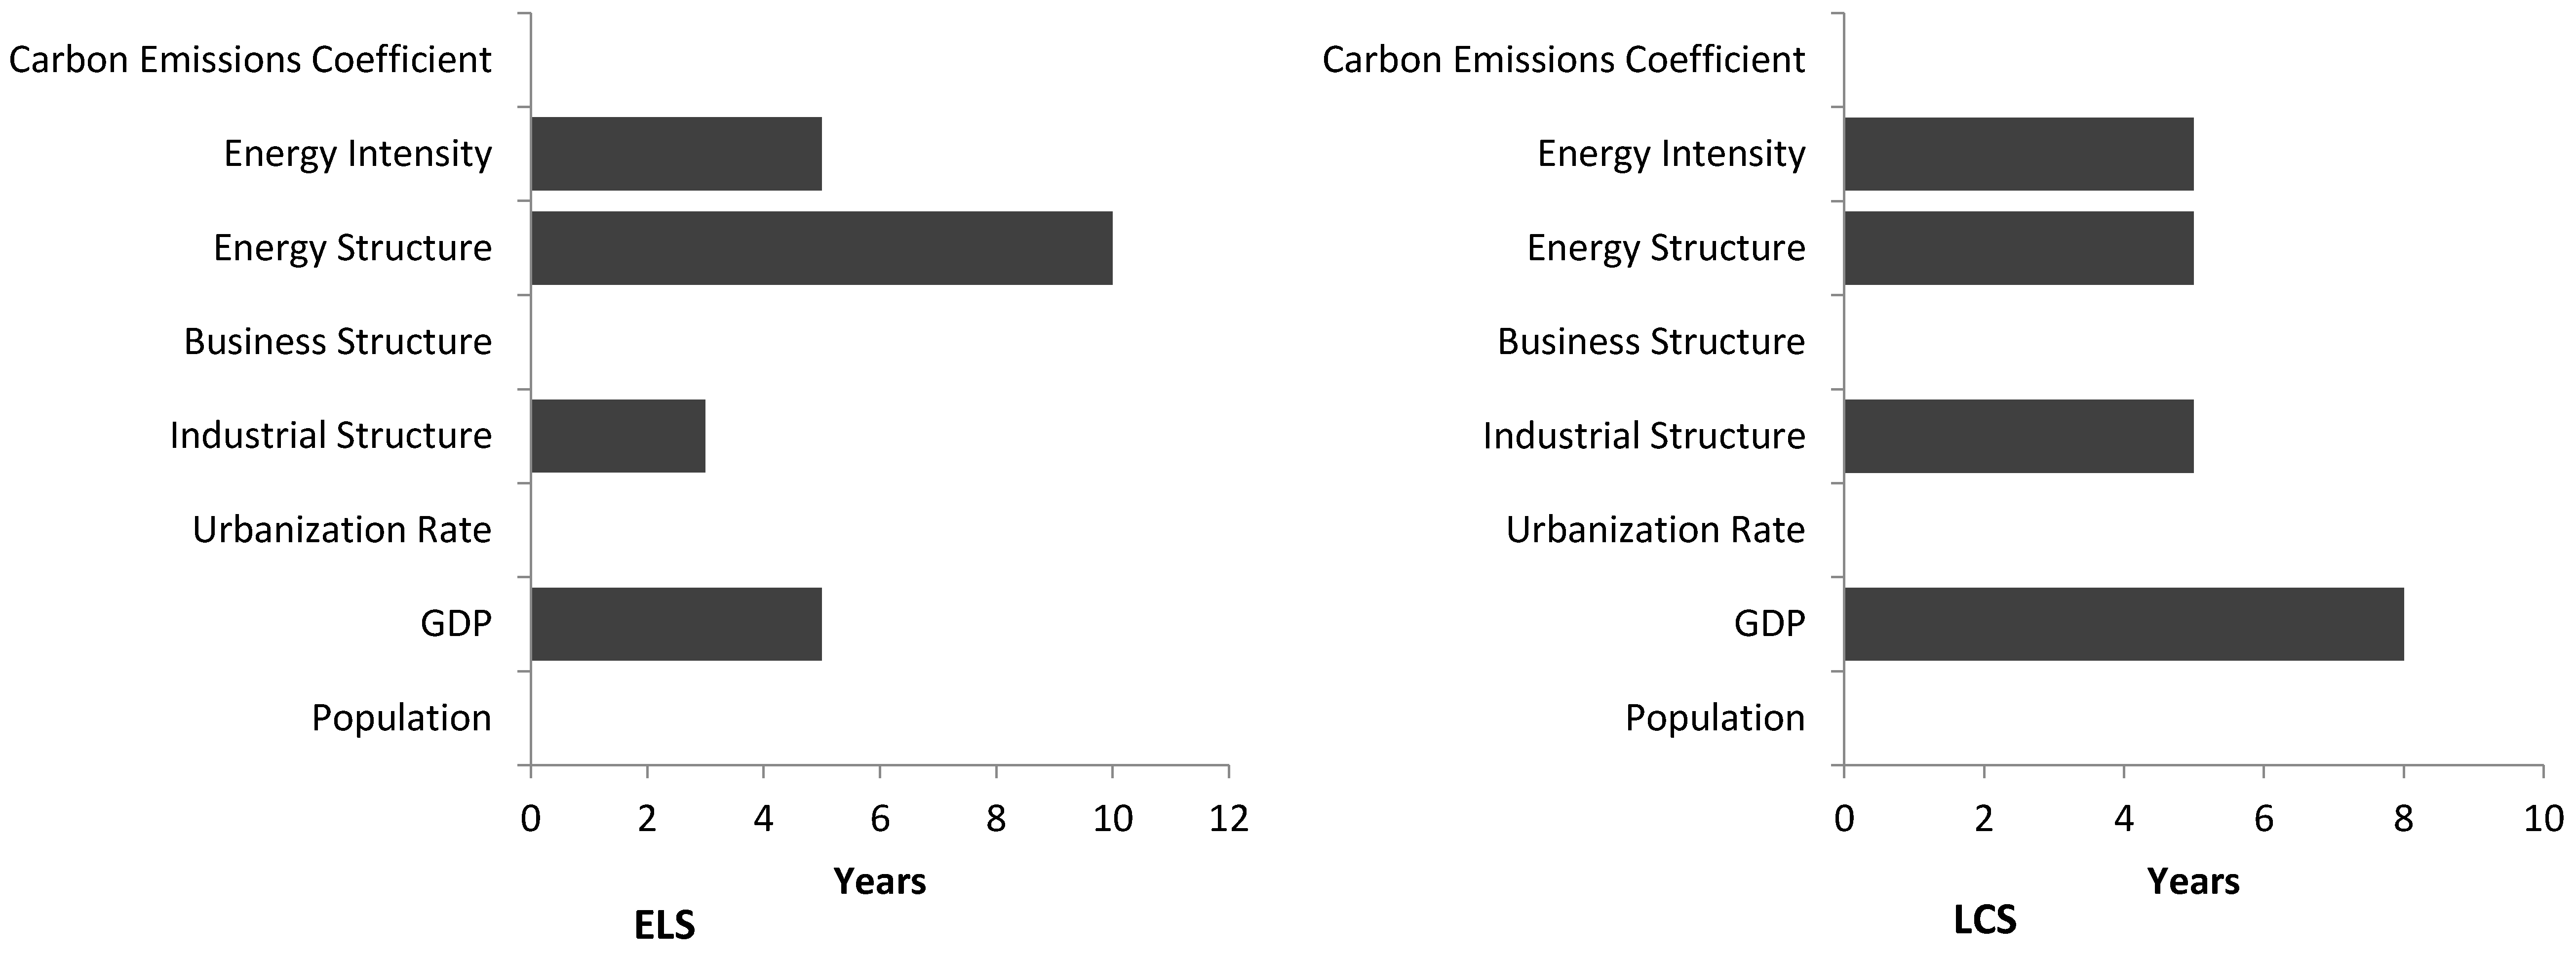
We assessed the impact of driving factors on the peak time of carbon emission by changing the values of the population, the GDP, the urbanization, the industrial structure, the business structure, the energy structure, the energy intensity and the carbon emission coefficient in sequence from high-mode to middle-mode and low-mode. The results in Figure 4 showed that the peak time was brought forward five years, one year, five years and five years caused by changing the GDP, the urbanization, the energy intensity, the carbon emission coefficient respectively. Oppositely, there was no obvious impact of the population, industrial structure, business structure, energy structure and mode change on the peak time. The peak time could be brought forward ten years by changing the values of the GDP and energy intensity respectively under the ES. However, the population, the urbanization, the industrial structure, the business structure, energy structure caused no obvious change on the same issue. The peak time could be brought forward five years, three years, ten years and five years respectively when the GDP, the industrial structure, the energy structure and the energy intensity were changed from high-mode to low-mode in sequence under the ELS. Meanwhile, the population, urbanization, business structure and carbon emission coefficient had no obvious impact on the peak time. Under the LCS, the peak time would be brought forward eight years, five years, five years and five years by changing the values of the GDP, industrial structure, energy intensity, energy structure respectively. However, there was no obvious impact of the population, urbanization, and business structure and carbon emission coefficient on the same issue.
According to the analysis above, the mainly driving factors that affect the peak time obviously were GDP, industrial structure, energy structure and energy intensity (seen in Figure 6).

4.3.2. Analysis on the Contributions of Driving Factors to Peak Time

BAU included the social condition of “the 11th five years plan” except energy conservation and emissions reduction measures. The growth rate level of GDP was high. It is a big value of energy intensity and carbon emission coefficient. Therefore, in this social condition, the peak time was delayed to 2045.
We set the ESS in order to research the impact of technological improvement on peak time. GDP, industrial structure and energy structure were same with the BAU, while the high-mode of energy intensity turns into middle-model in Business as Usual Scenario (seen in Figure 7). For the driving impact of the variation of energy intensity change rate caused by technological progress in peak time, peak time under the Energy-saving Scenario was brought forward 5 years based on the BAU. The peak time was 2040 under the ESS.
In order to research the synchronous impact of economic growth rate controlling, structural emission reduction and technical progress on the driving of peak time, the high-mode of economic growth factor, structural emission reduction factor and technical progress factor turn into middle-mode in ELS. Because of the driving impact of the change from high-mode of GDP, industrial structure, energy structure and energy intensity to middle-mode, the peak time was brought forward 10 years based on BAU. The peak time of Energy-saving and Low-carbon Scenario was 2035. Compared with ESS, it is shown that the contribution of technical progress is 5 years, and the contribution of economic growth rate controlling and structural emission reduction is 5 years. Therefore, technological progress is more advantageous to peak time advance.
Low-carbon Scenario is a relatively ideal scenario including the mid-mode economic development rate in energy-saving to low-carbon Scenario, energy high-efficiency and the development of low-carbon technology. Besides, industry structure, energy structure and energy intensity transformed high mode of BAU into low mode in LCS. The peak time under LCS was in 2025, ahead of 20 years based on BAU. Therefore, on the premise of appropriate economic development, the emission peak would be brought forward based on technology development and structure reduction.
According to the contrastive analysis of the change of above four scenarios parameters, it can be seen that controlling the GDP, industrial structure, energy structure and energy intensity would promote carbon emissions peak time 5 to 20 years in advance. Therefore, the control impact would be better.

5. Conclusions

From the perspective of peak value, we study the regional carbon emissions driving factors and contribution and analyzed the peak time and the controllability of peak volume. Our study supports to reduce cumulative carbon emissions in the rapid economic development areas by 2050. By application of the LEAP system, we predict the carbon emissions peak volume of the terminal energy consumption under the BAU, ESS, ESL and LCS in Jilin Province, China. Meantime, we analyzed the driving factors of peak time and peak volume and presented the following conclusions: in the situation of ensuring moderate economic growth (GDP in the medium model), (1) the “structural reduction” of industrial structure adjustment and energy structure adjustment, the “technical reduction” of reducing energy intensity and carbon emissions coefficient can make carbon emissions peak to be reduced by 20%−52% and accumulative carbon emissions to be reduced by approximately 15%–46% by 2050 based on BAU; (2) the control of industrial structure, energy structure and energy intensity can make carbon emissions peak time to advance by approximately 5–20 years on the basis of BAU. In the case of steady economic growth, adjusting the industrial structure, energy structure and reducing energy intensity and carbon emissions coefficient can achieve the bi-directional control of the peak time and the peak volume of carbon emissions for the lower carbon emissions peak volume and an earlier peak time. It is feasible to control the peak time and the peak volume of carbon emissions by the GDP, industrial structure, energy structure, energy intensity and carbon emission coefficient from the perspective of controlling carbon emissions peak volume.

Acknowledgments

This research is supported by the National Natural Science Foundation of China (Grant No. 70941036) and the China Clean Development Mechanism Foundation Grants (Grant No. 2014031).

Author Contributions

Lei Tian designed the research work, carried out the date collection and wrote the paper. Zhe Ding preformed the data checking, results analysis. Yongxuan Wang preformed the results analysis. Haiyan Duan and Shuo Wang did the language modification. Jie Tang and Xian’en Wang provided academic advice throughout the process. All seven authors revised, read and approved the final manuscript.

Conflicts of Interest

The authors declare no conflict of interest.

References

  1. Crowley, T.J. Causes of climate change over the past 1000 years. Science 2000, 289, 270–277. [Google Scholar] [CrossRef] [PubMed]
  2. Walther, G.-R.; Post, E.; Convey, P.; Menze, A.; Parmesan, C.; Beebee, T.J.C.; Fromentin, J.-M.; Hoegh-Guldberg, O.; Bairlein, F. Ecological responses to recent climate change. Nature 2002, 416, 389–395. [Google Scholar] [CrossRef] [PubMed]
  3. UNFCCC. Adoption of the Paris Agreement. Available online: http://unfccc.int/resource/docs/2015/cop21/eng/l09r01.pdf (accessed on 26 May 2016).
  4. 2050 China Energy and CO2 Emission Research Group. 2050 China Energy and CO2 Emission Report; Science Press: Beijing, China, 2009; p. 767. [Google Scholar]
  5. IPCC. Contribution of Working Group II to the Fourth Assessment Report of the Intergovernmental Panel on Climate Change; Cambridge University Press: Cambridge, Britain; New York, NY, USA, 2007. [Google Scholar]
  6. Meinshausen, M.; Meishausen, N.; Hare, W.; Raper, S.C.B.; Frieler, K.; Knutti, R.; Frame, D.J.; Allen, M.R. Greenhouse-gas emission targets for limiting global warming to 2 °C. Nature 2009, 458, 1158–1196. [Google Scholar] [CrossRef] [PubMed]
  7. Zhou, G.; Ou, X.; Zhang, X. Development of electric vehicles use in China: A study from the perspective of life-cycle energy consumption and greenhouse gas emissions. Energy Policy 2013, 59, 875–884. [Google Scholar] [CrossRef]
  8. Wen, Z.; Meng, F.; Chen, M. Estimates of the potential for energy conservation and CO2 emissions mitigation based on Asian-Pacific Integrated Model (AIM): The case of the iron and steel industry in China. J. Clean. Prod. 2014, 65, 120–130. [Google Scholar] [CrossRef]
  9. Huang, Y.; Bor, Y.J.; Peng, C.-Y. The long-term forecast of Taiwan’s energy supply and demand: LEAP model application. Energy Policy 2011, 39, 6790–6803. [Google Scholar] [CrossRef]
  10. Lantz, V.; Feng, Q. Assessing Income, Population, and Technology Impacts on CO2 Emissions in Canada: Where’s the EKC? Ecol. Econ. 2006, 57, 229–238. [Google Scholar] [CrossRef]
  11. Fan, Y.; Liu, L.; Wu, G.; Wei, Y. Analyzing impact factors of CO2 emissions using the STIRPAT model. Environ. Impact Assess. Rev. 2006, 26, 377–395. [Google Scholar] [CrossRef]
  12. Zhu, Q.; Peng, X.; Lu, Z.; Yu, J. Analysis Model and Empirical Study of Impacts from Population and Consumption on Carbon Emissions. China Popul. Resour. Environ. 2010, 20, 98–102. [Google Scholar]
  13. Guo, C. Effect of Industrial Structure Change on Carbon Emission in China. China Popul. Resour. Environ. 2012, 22, 15–20. [Google Scholar]
  14. Zhou, X.; Zhang, J.; Li, J. Industrial structural transformation and carbon dioxide emissions in China. Energy Policy 2013, 57, 43–51. [Google Scholar] [CrossRef]
  15. Mi, Z.-F.; Pan, S.-Y.; Yu, H.; Wei, Y.-M. Potential impacts of industrial structure on energy consumption and CO2 emission: A case study of Beijing. J. Clean. Prod. 2014. [Google Scholar] [CrossRef]
  16. Shao, C.; Guan, Y.; Wan, Z.; Guo, C.; Chu, C.; Ju, M. Performance and decomposition analyses of carbon emissions from industrial energy consumption in Tianjin, China. J. Clean. Prod. 2014, 64, 590–601. [Google Scholar] [CrossRef]
  17. Zhang, B.; Wang, Z.; Yin, J.; Su, L. CO2 emission reduction within Chinese iron & steel industry: Practices, determinants and performance. J. Clean. Prod. 2012, 33, 167–178. [Google Scholar]
  18. Benhelal, E.; Zahedi, G.; Shamsaei, E.; Bahadori, A. Global strategies and potentials to curb CO2 emissions in cement industry. J. Clean. Prod. 2013, 51, 142–161. [Google Scholar] [CrossRef]
  19. Qu, S.; Guo, C. Forecast of China’s carbon emission based on STIRPAT model. China Popul. Resour. Environ. 2010, 20, 10–15. [Google Scholar]
  20. Zhai, S.; Wang, Z. The Prediction of Carbon Emissions Demands in India under the Balance Economic Growth Path. Smart Grid Renew. Energy 2012, 3, 186–193. [Google Scholar]
  21. Zhang, W.; Duan, X. The Research Progress in the Relationship among Economic Growth, Industrial Structure, and Carbon Emissions. Prog. Geogr. 2012, 31, 442–450. [Google Scholar]
  22. Zhu, Y.; Wang, Z.; Pang, L.; Wang, L.; Zou, X. Simulation on China’s Economy and Prediction on Energy Consumption and Carbon Emission under Optimal Growth Path. Acta Geogr. Sinca 2009, 64, 935–944. [Google Scholar]
  23. Wang, X.; Wang, Y.; Duan, H. Forecasting Area s Carbon Emissions of Energy Consumption and Controllability Study. China Popul. Resour. Environ. 2014, 24, 9–16. [Google Scholar] [CrossRef] [PubMed]
  24. Ehrlich, P.R.; Holdren, J.P. Impacts of population growth. Science 1971, 171, 1212–1217. [Google Scholar] [CrossRef] [PubMed]
  25. Dietz, T.; Rosa, E.A. Rethinking the environmental impact of population, affluence and technology. Hum. Ecol. Rev. 1994, 1, 277–300. [Google Scholar]
  26. Dietz, T.; Rosa, E.A. Effects of population and affluence on CO2 emissions. Proc. Natl. Acad. Sci. USA 1997, 94, 175–179. [Google Scholar] [CrossRef] [PubMed]
  27. York, R.; Rosa, E.A.; Dietz, T. Footprints on the earth: The environmental consequences of modernity. Am. Sociol. Rev. 2003, 68, 279–300. [Google Scholar] [CrossRef]
  28. Moss, R.H.; Edmonds, J.A.; Hibbard, K.A.; Manning, M.R.; Rose, S.K.; van Vuuren, D.P.; Carter, T.R.; Emori, S.; Kainuma, M.; Kram, T.; et al. The next generation of scenario for climate change research and assessment. Nature 2010, 463, 747–756. [Google Scholar] [CrossRef] [PubMed]
  29. Hong, S.; Chung, Y.; Kim, J.; Chun, D. Analysis on the level of contribution to the national greenhouse gas reduction target in Korean transportation sector using LEAP model. Renew. Sustain. Energy Rev. 2016, 60, 549–559. [Google Scholar] [CrossRef]
  30. Park, N.-B.; Yun, S.-J.; Jeon, E.-C. An analysis of long-term scenarios for the transition to renewable energy in the Korean electricity sector. Energy Policy 2013, 52, 288–296. [Google Scholar] [CrossRef]
  31. Connolly, D.; Lund, H.; Mathiesen, B.V.; Leahy, M. A review of computer tools for analysing the integration of renewable energy into various energy systems. Appl. Energy 2010, 87, 1059–1082. [Google Scholar] [CrossRef]
  32. Shabbir, R.; Ahmad, S.S. Monitoring urban transport air pollution and energy demand in Rawalpindi and Islamabad using leap model. Energy 2010, 35, 2323–2332. [Google Scholar] [CrossRef]
  33. Letschert, V.; Desroches, L.-B.; Ke, J.; McNeil, M. Energy efficiency—How far can we raise the bar? Revealing the potential of best available technologies. Energy 2013, 59, 72–82. [Google Scholar] [CrossRef]
  34. IPCC. IPCC Second Assessment Report: Climate Change. 1995. Available online: https://www.ipcc.ch/pdf/climate-changes-1995/ipcc-2nd-assessment/2nd-assessment-en.pdf (accessed on 26 May 2016).
  35. Du Can, S.D.R.; Price, L. Sectorial trends in global energy use and greenhouse gas emissions. Energy Policy 2008, 36, 1386–1403. [Google Scholar] [CrossRef]
  36. Zhou, D.; Dai, Y.; Yi, C.; Guo, Y.; Zhu, Y. China’s Sustainable Energy Scenarios in 2020; Environmental Science Press: Beijing, China, 2003. [Google Scholar]
  37. The People’s Government of Jilin Province. Development Plan of Jilin Province in 12th Five-Year; The People’s Government of Jilin Province: Changchun, China, 2010. (In Chinese)
  38. Lin, F.; Liu, J. The Development Prospect of Population in Jilin Province. Popul. J. 1995, 10, 44–56. [Google Scholar]
  39. Song, L. An Analysis of the Level of China’s Urbanization. J. Liaoning Univ. 2007, 35, 115–119. [Google Scholar]
  40. Ding, H. Urban Energy System Analysis Model Based on the Case Study of Beijing; Science Press: Beijing, China, 2012. (In Chinese) [Google Scholar]
  41. Zhao, L.; Tao, Z. Influencing Factors and Scenario Forecasting of China’s Low-Carbon Economy. Resour. Sci. 2011, 33, 844–850. [Google Scholar]
  42. Xinhuanet. State Council of People’s Republic of China: In 2020, Non-Fossil Energy will Reach 15% of the Total Energy Consumption. Available online: http://news.xinhuanet.com/energy/2014-11/19/c_1113317687.htm (accessed on 26 May 2016). (In Chinese)
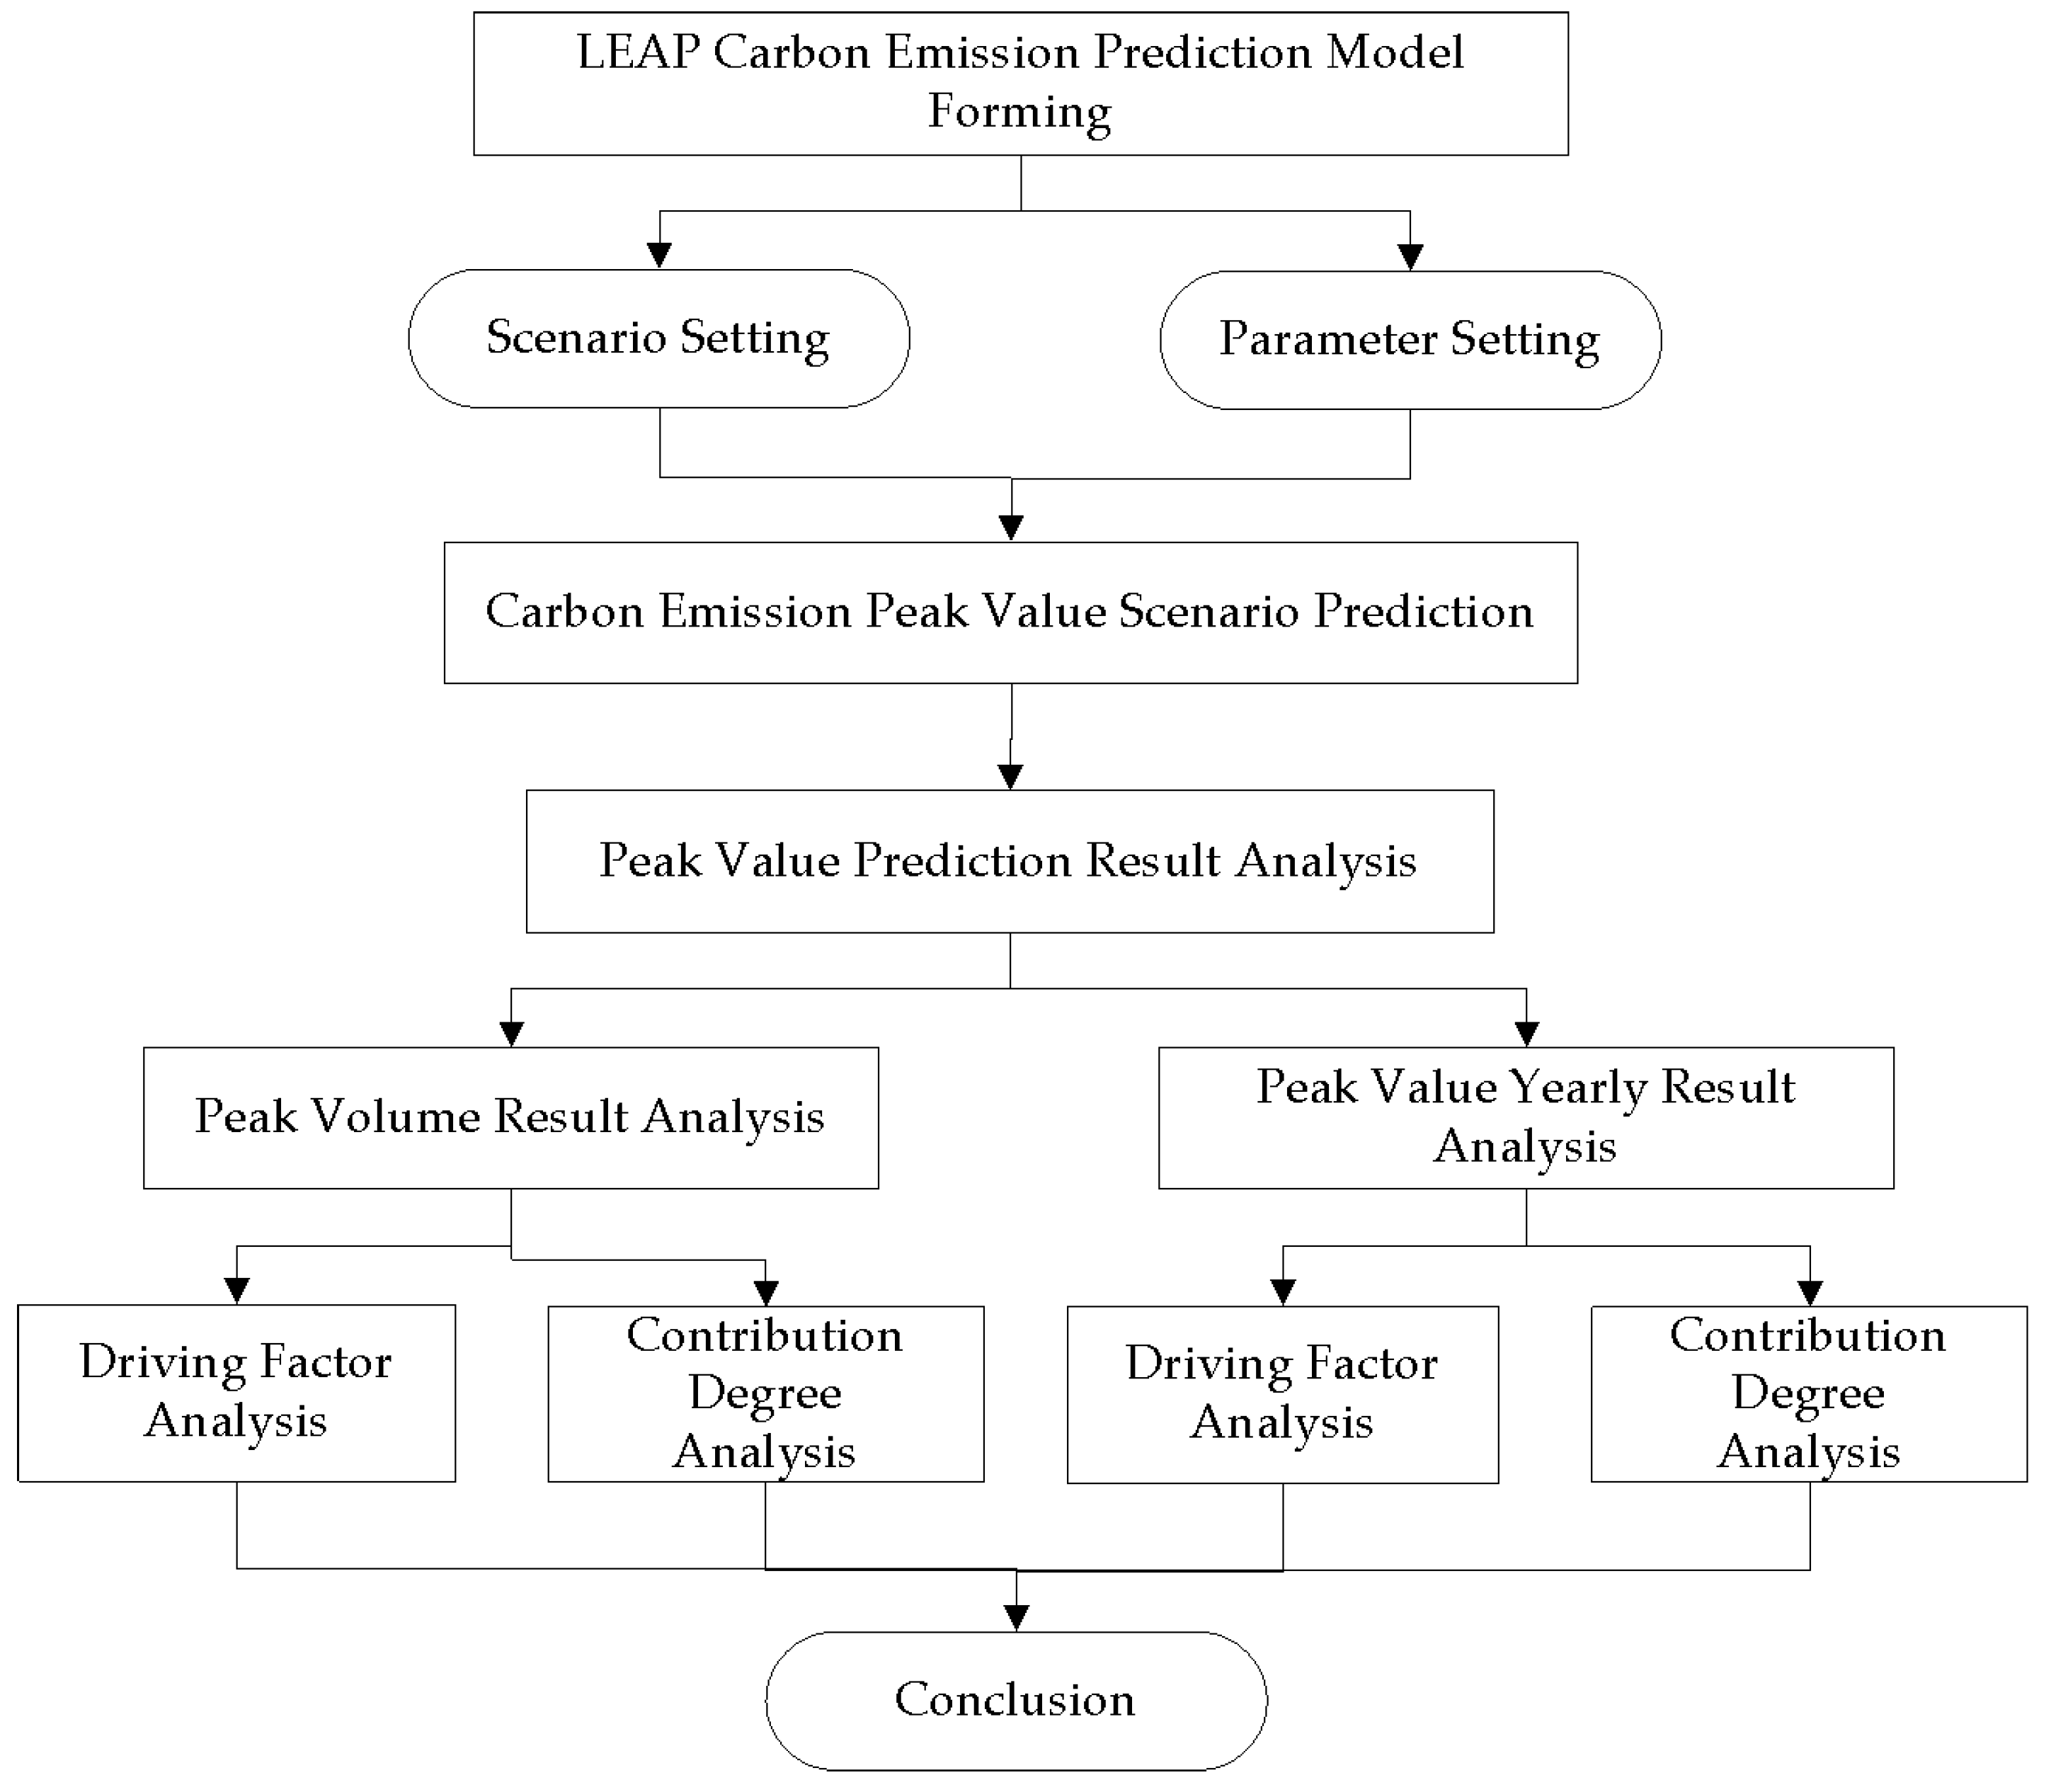
Figure 1. Study technology roadmap.
Sustainability 08 00513 g001
Figure 2. The structure of LEAP to predict carbon emission.
Sustainability 08 00513 g002
Figure 3. The predictions of carbon emission trend in Jilin.
Sustainability 08 00513 g003
Figure 4. Reducing value from high-mode to low-mode.
Sustainability 08 00513 g004aSustainability 08 00513 g004b
Figure 5. The comparison of driving factors for carbon emissions peak time in different scenarios.
Sustainability 08 00513 g005
Figure 6. Change on the peak time between the low-mode and the high-mode.
Sustainability 08 00513 g006aSustainability 08 00513 g006b
Figure 7. The comparison of driving factors for carbon emissions peak volume in different scenarios.
Sustainability 08 00513 g007
Table 1. The options of Scenario’s parameters.
Impact FactorLow-Carbon ScenarioEnergy-Saving and Low-Carbon ScenarioEnergy-Saving ScenarioBaseline Scenario
PopulationLowMediumHighHigh
Gross regional domestic productMediumMediumHighHigh
Urbanization rateMediumMediumMediumHigh
Industrial StructureLowMediumHighHigh
Business structureLowMediumHighHigh
Energy structureLowMediumHighHigh
Energy intensityLowMediumMediumHigh
Carbon emission coefficientLowMediumMediumHigh
Table 2. The change rate of parameters.
ParametersMode20102020203020402050
Population (Mt)Low-mode2723.82764.002748.392711.512651.11
Middle-mode2723.82792.662799.642775.942729.11
High-mode2723.82820.652856.12836.172799.51
GDP (108 Yuan)Low-mode648.171318.141996.882789.363211.68
Middle-mode648.171631.573028.145147.576798.79
High-mode648.171740.223631.366306.968565.51
Urbanization rate (%)Low-mode53.3656.8260.0762.7764.55
Middle-mode53.3657.9962.4566.6369.67
High-mode53.3659.5365.7671.2175.00
The primary industry (%)Low-mode117654
Middle-mode117654
High-mode117654
The secondary industry (%)Low-mode5252474140
Middle-mode5255555145
High-mode5256585549
The tertiary industry (%)Low-mode3739435056
Middle-mode3728394450
High-mode3737364047
Electric power carbon emission coefficient (tCO2/tec)Low-mode6.655.264.964.513.32
Middle-mode6.655.405.094.733.78
High-mode6.655.515.255.024.37
Table 3. Carbon Emission in different Scenarios.
ScenarioPeak Amount/(Million ton)Peak TimePeak RatioCumulative Amount during 2010 to 2050/(100 Million ton)
BAU489.8320452.53156.32
ESS395.1720402.04133.21
ELS305.2520351.58109.71
LCS233.5720251.2183.79