Article

Spatial Assessment of Cancer Incidences and the Risks of Industrial Wastewater Emission in China

1
Department of Sociology, University of Central Florida, Orlando, FL 32816, USA
2
Department of Geography, University of South Carolina, Columbia, SC 29208, USA
3
Department of Geography and Regional Planning, Indiana University of Pennsylvania, Indiana, PA 15705, USA
4
Key Research Institute of Yellow River Civilization and Sustainable Development & Collaborative Innovation Center on Yellow River Civilization of Henan Province, Henan University, Kaifeng 475004, China
*
Authors to whom correspondence should be addressed.
Sustainability 2016, 8(5), 480; https://doi.org/10.3390/su8050480
Submission received: 1 February 2016 / Revised: 30 April 2016 / Accepted: 5 May 2016 / Published: 14 May 2016

Abstract

:
China’s rapid economic growth and social transitions have deteriorated environmental conditions and caused further public health issues in last three decades. This study examines the complex mechanisms of how socioeconomic transitions and physical environmental conditions impact public health, especially with respect to increasing cancer incidences in mainland China from a spatial-temporal perspective. Specifically, (1) spatial variations of seven types of cancer incidences were analyzed in relation to heavy metal emissions from industrial wastewater at the prefecture-level city scale from 2004 to 2009. Additionally; (2) spatial statistical methods were employed to explore the associations between health outcome, heavy metal emissions from industrial wastewater (arsenic, chromium, cadmium, mercury, lead), as well as socioeconomic transitions (industrialization, urbanization, globalization) and physical environmental factors (hydrology and vegetation coverage). Results showed a significant increase of cancer incidences between 2004 and 2009. Consistent with the spatial pattern of heavy metal emissions, cancer patient clusters were identified in both traditional industrial bases and newly industrialized economic zones, especially in major cities located at downstream watersheds, including Beijing, Shanghai, Guangzhou, Shenyang, and Wuhan. The results also revealed the double-edged effects of industrialization, economic growth, and urbanization on natural environment and human health. The findings provide informative knowledge of heavy metal pollution and cancer outbreaks in China and therefore offer valuable reference for authorities formulating regulations.

1. Introduction

Since the economic reform in 1978, China has experienced rapid economic growth. Industrialization, along with urbanization and globalization, have resulted in tremendous positive changes in China at the environment’s expense. Severe water pollution has been confirmed as one of the greatest threats and challenges to human health [1,2,3]. In recent years, more and more cancer villages with high concentrations of cancer incidences have appeared across China, and heavy metal contamination has been identified as the main cause [4]. Among heavy metals, arsenic (As), cadmium (Cd), chromium (Cr), mercury (Hg), and lead (Pb) are all categorized by the International Agency for Research on Cancer (IARC) as having high carcinogenic toxicities [5,6]. For example, excessive lead and mercury can permanently damage the nervous system and brain. Cadmium and arsenic accumulation has toxic effects on such important human organs as the liver, lung, kidney, skin, etc. [7,8,9]. Drinking water contaminated with arsenic has been known to cause of skin, bladder, and lung cancers; therefore it is classified as a Group 1 carcinogen by the International Agency for Research on Cancer [10,11,12].
Thus, scholars, policy makers, and the general public are increasingly aware of heavy metal pollution and public health issues in China [4,13,14,15,16,17,18,19,20]. In 2013, the emergence of cadmium poisoned rice in Hunan Province and Guangdong Province have brought unpredictable risks and influences on both public health and environment, which triggered a public crisis and caused tremendous political concerns [20,21]. Regarding heavy metal water pollution in China, industrial wastewater, municipal sewage, and the discharge of agricultural wastewater are considered the main pollution sources, especially with respect to industrial emissions [6,14,22,23,24]. For example, the leather industry merely contributed (less than 1%) to the total industrial output to Shandong Province in 2010 but produced over 40% of the total discharged Cr waste [6]. Industrial wastewater is conceived to be the main cause of high concentrations of cancer incidences along China’s major rivers and tributaries [4]. Rural areas are more vulnerable compared to urban areas in terms of pollution control, mitigation, and human health protection [6,14]. In addition, factories intentionally establish industrial bases in rural areas to take advantage of relatively low costs of labor, land, transportation, etc. as well as reduced central and local environmental supervision and monitoring. Although governments have implemented policies and required domestic industries to follow environmental protection regulations, the spatial disparity of heavy metal water pollution levels and cancer incidences is becoming more prominent among regions and between urban and rural areas.
Geographic Information System (GIS) and statistical methods have been previously applied to investigate heavy metal pollution’s impact on public health with commonly used models and indices, for example the Health Risk Assessment Model of the U.S. Environmental Protection Agency (USEPA) and geo-accumulation index (Igeo) [2,15,24,25,26]. However, studies concerning the spatial relationship between patterns of cancer incidences and industrial wastewater emissions are still lacking in China under the background of socioeconomic transitions [3]. As a continuation and an extension of our previous study on the patterns of heavy metal water pollution levels in China [2], this research aims to examine the spatial variations of cancer incidences and to analyze the associations of China’s socioeconomic transitions, industrial wastewater emission, and public health. Despite the challenge of a vast study area, as well as the complex and diverse data pool, not only the statistical results, but the visualized findings could further stress the urgency of controlling heavy metal pollution, as well as improving people’s living conditions by providing valuable information for authorities formulating regulations. This paper is organized into four sections. The next section outlines the conceptual framework, followed by a discussion of data and methodology. The results are explained before finally concluding with major findings and discussions.

2. Methodology

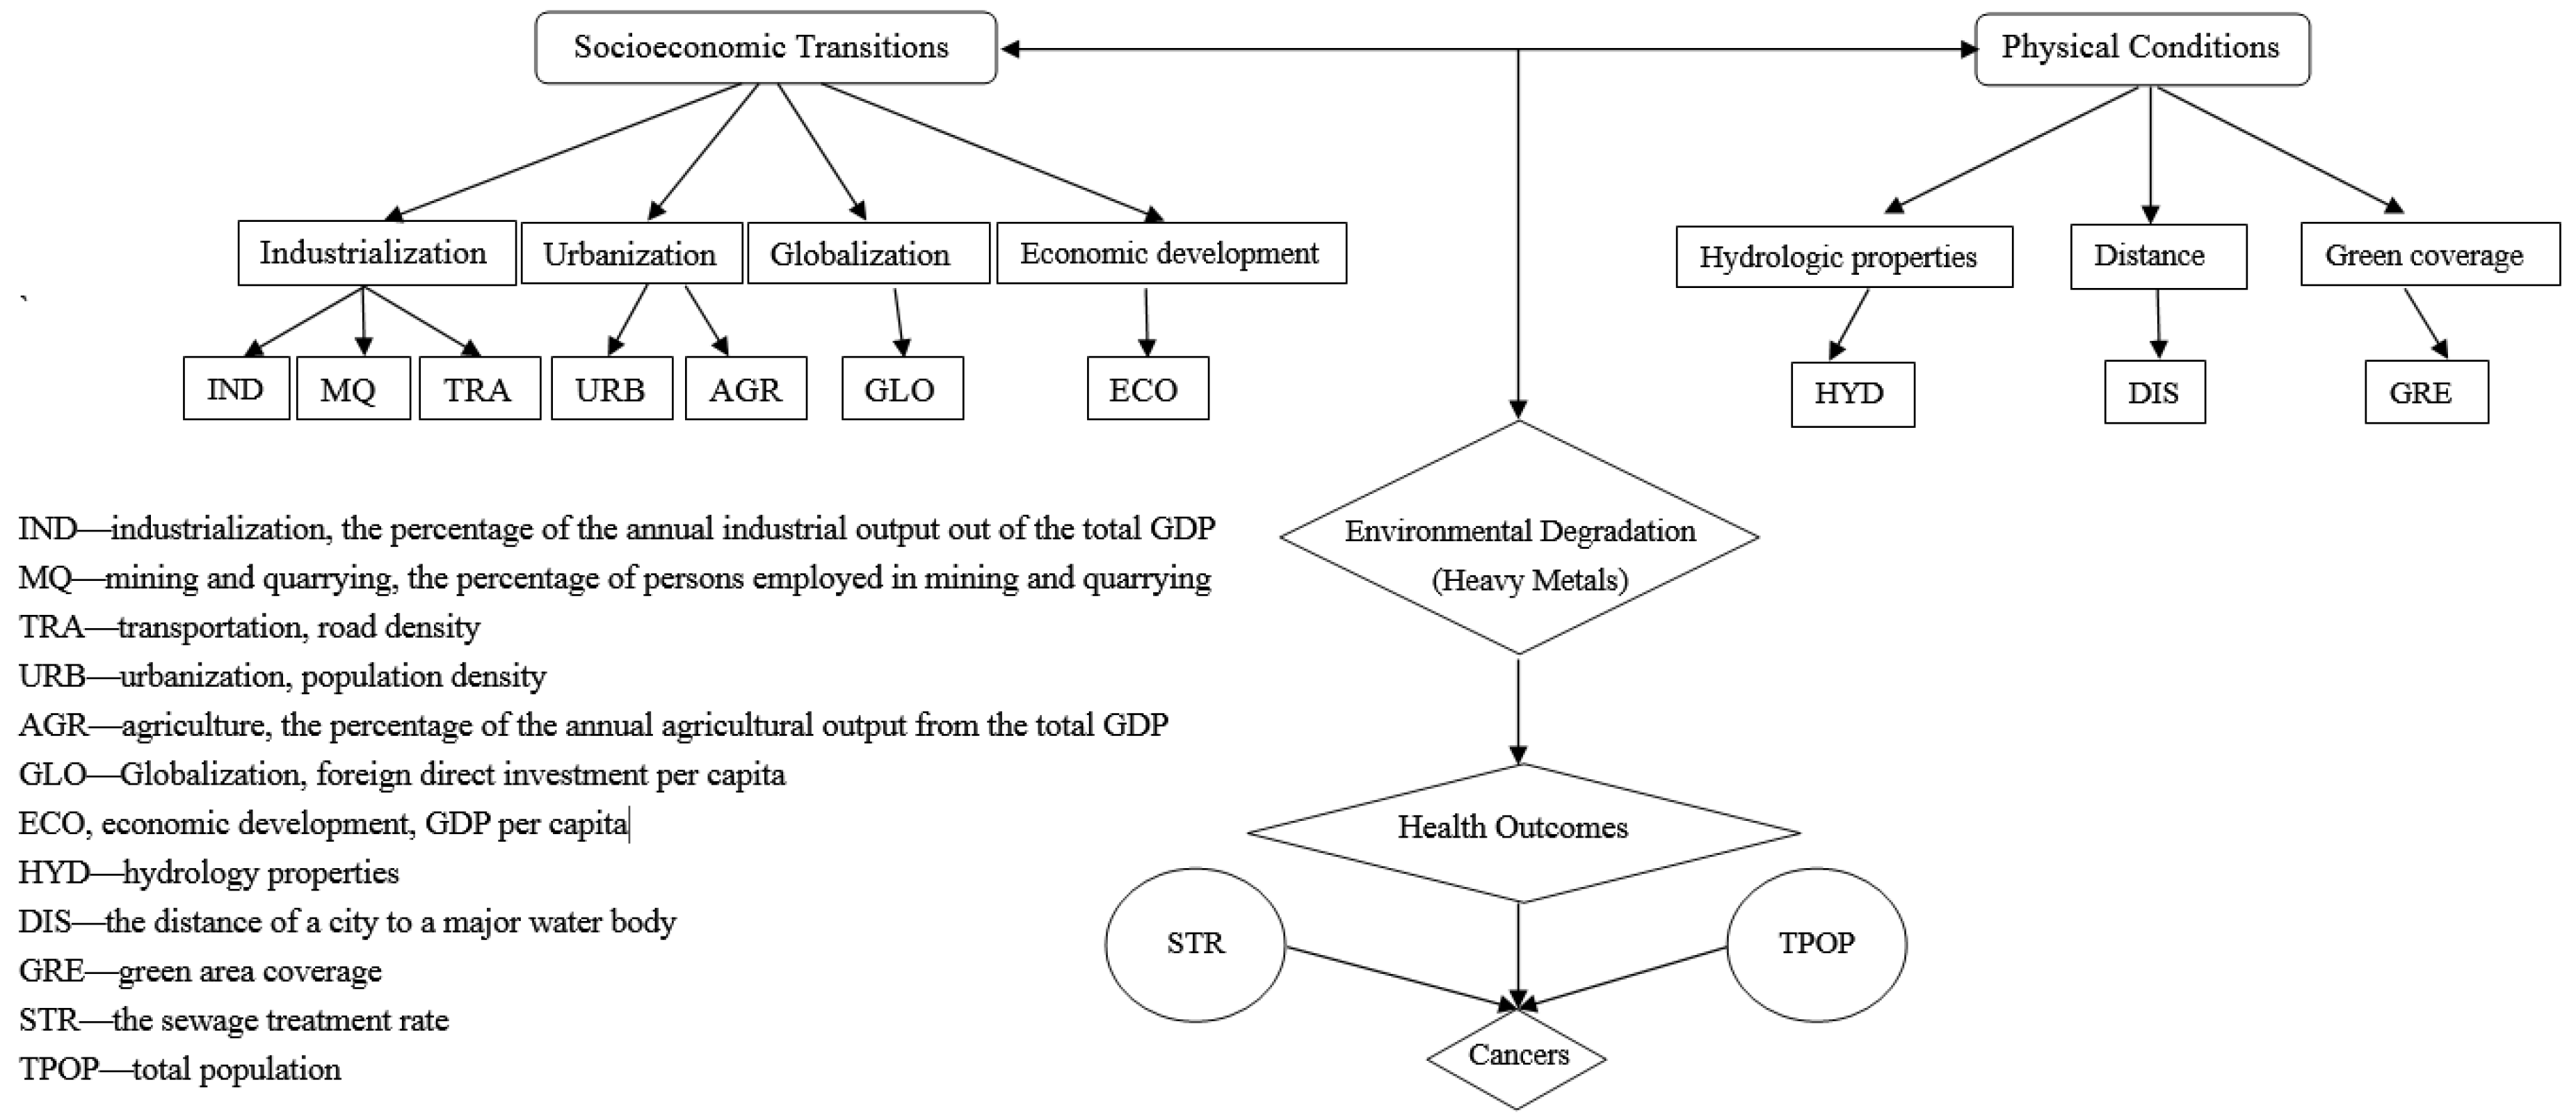
2.1. Analytical Framework
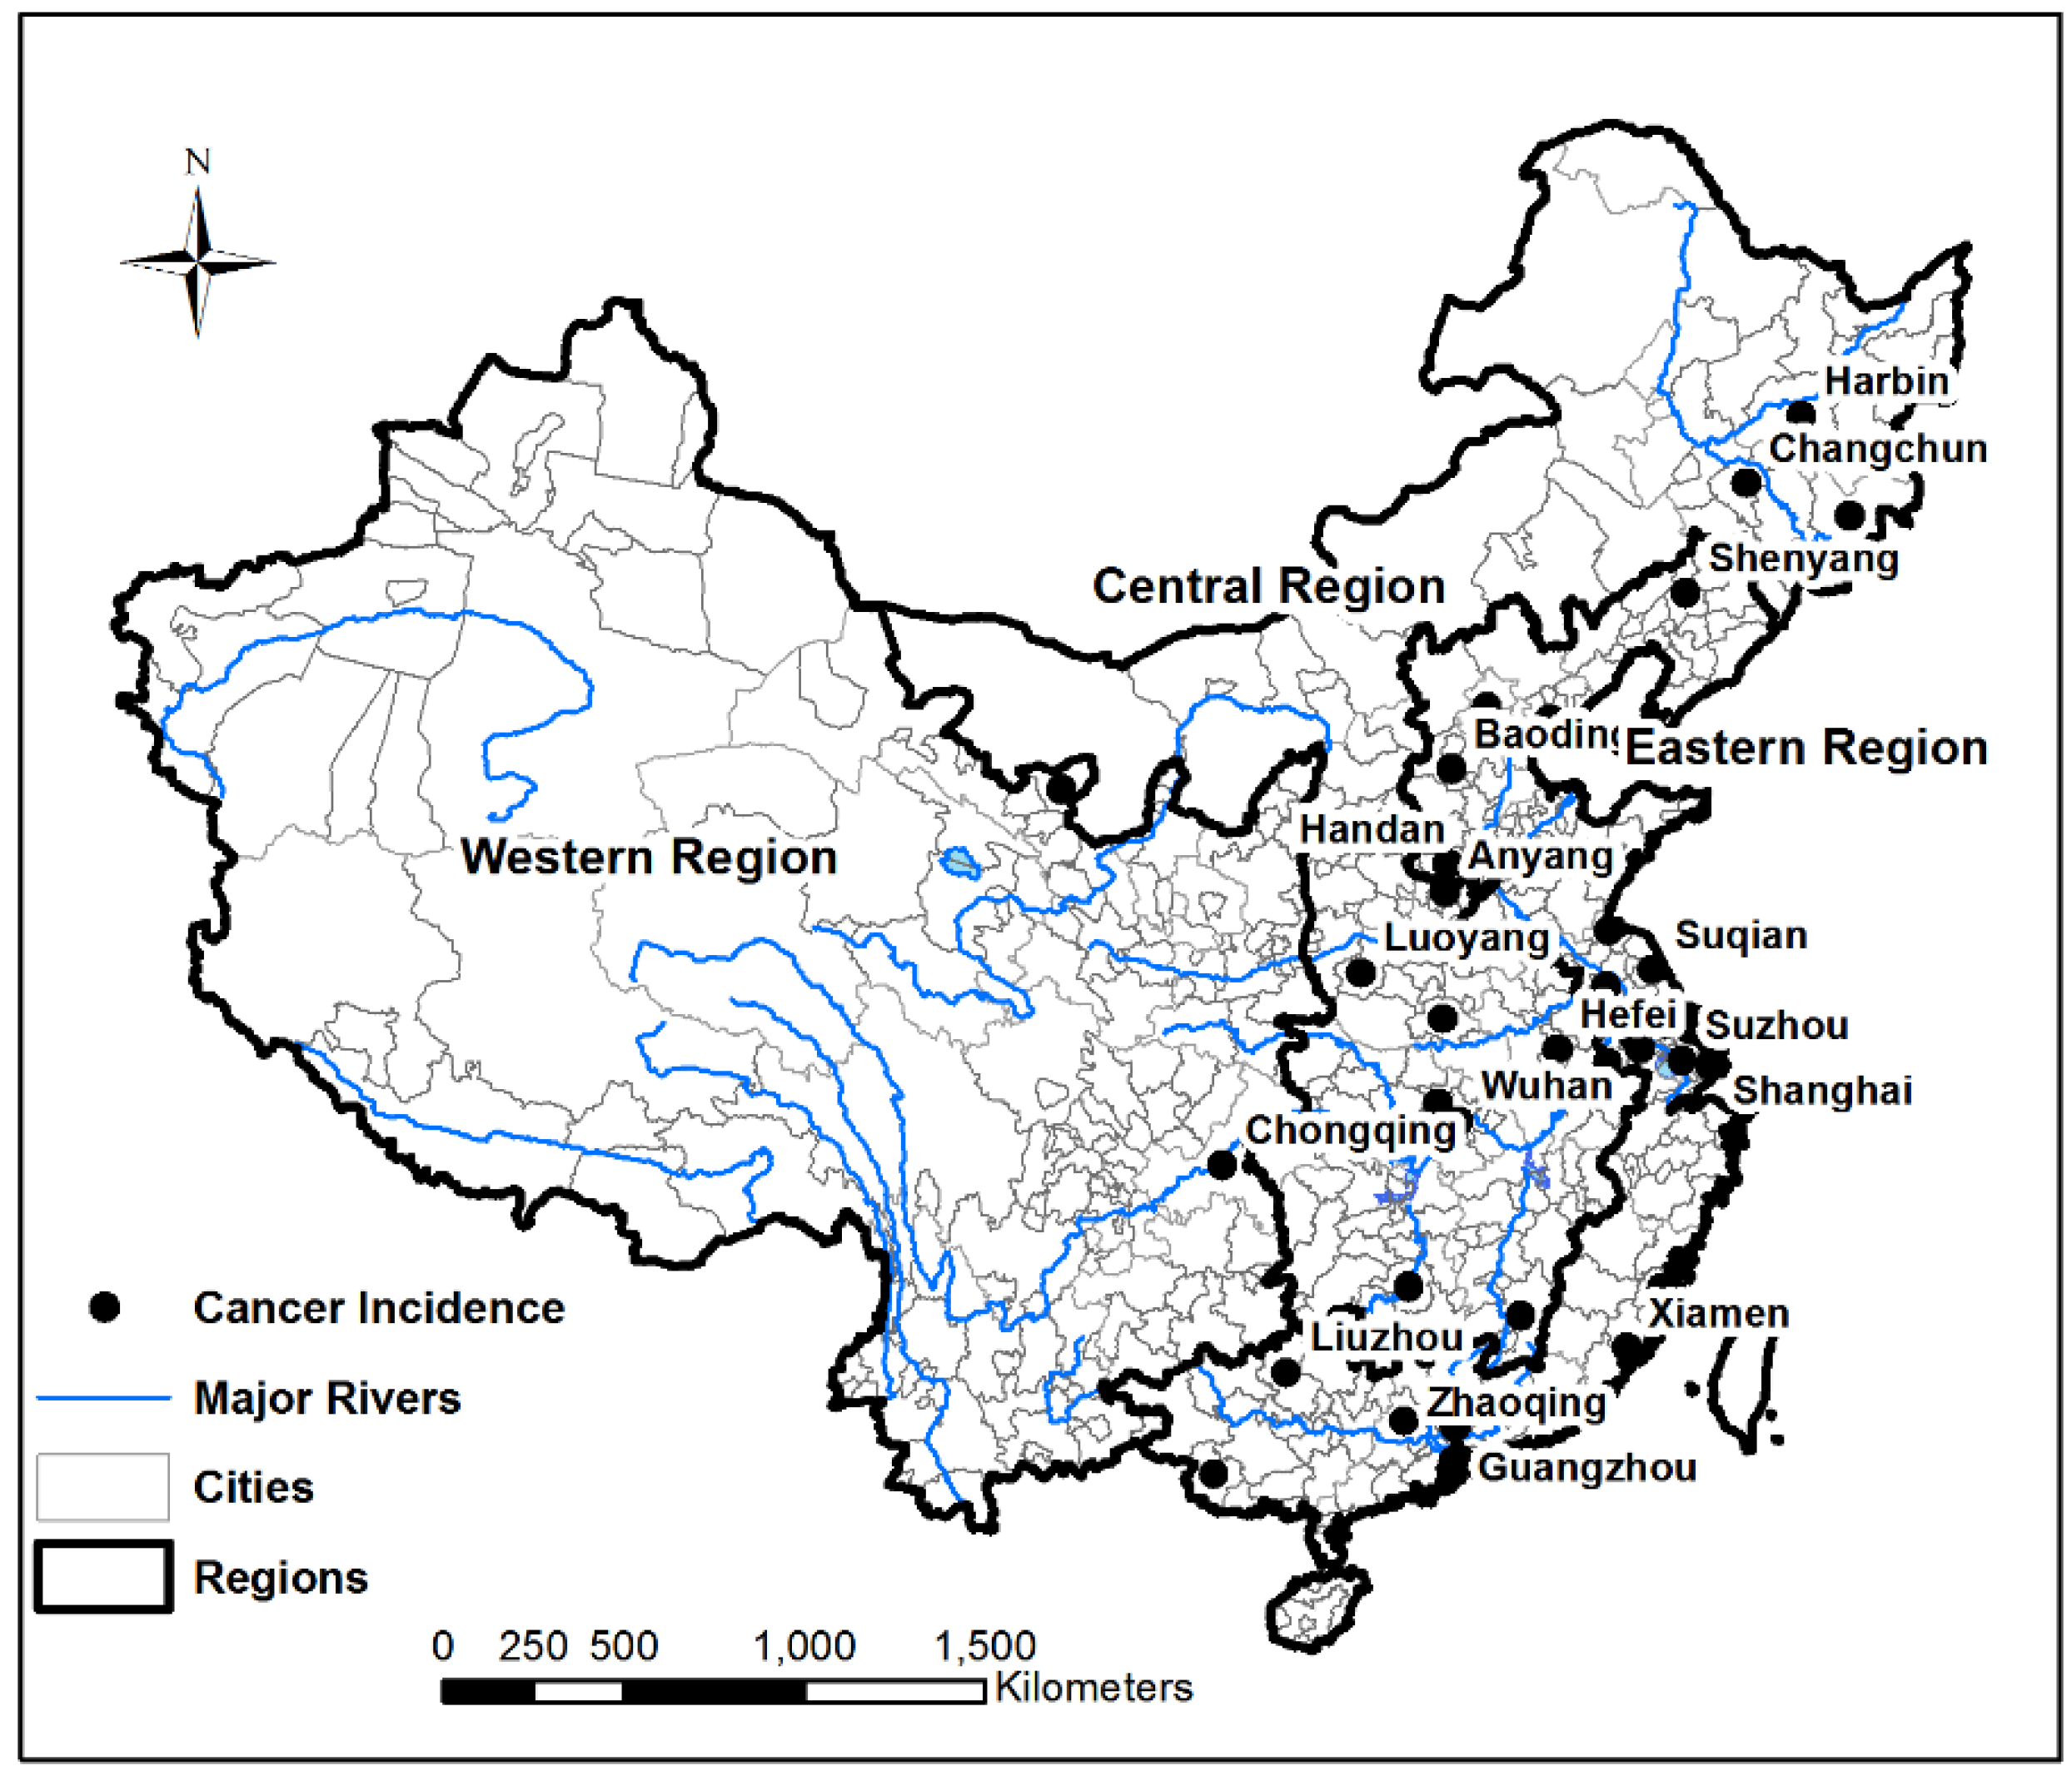
This study is established on the following analytical framework (Figure 1). In China, both surface and ground water are highly polluted, with about 70% of river water and 60% of ground water is unsafe for human consumption [27,28,29]. Due to water shortage problems and a huge population base, nearly 700 million Chinese people have to use water contaminated with chemicals and biological wastes [30]. Severe water pollution has caused long-term human health risks, including the outbreaks of cancers, namely “cancer villages” [3,22,31].
Both socioeconomic transitions and physical/natural conditions have influenced the spatial patterns of water pollution and cancer incidences in China. Rapid industrialization has greatly deteriorated water quality due to the great amounts of industrial wastewater emissions with toxic heavy metals [3]. Previous research has demonstrated that increasing industrial wastewater emission is the main culprit of this country’s water pollution [23,30,32]. In 2012, the total wastewater emission reached 68.5 billion tons, three times the amount documented in 1990 [30,33]. About two-thirds of the total waste discharged into surface water is from industry, mainly factories in rural areas [14]. At the same time, China has been experiencing the largest rural-to-urban migration in history, with an urban population accounting for 54.7% of the total population by the end of 2014 (compared to 26% in 1990) [34,35]. The development and prosperity of Township and Village Enterprises (TVEs) has been one of the major driving forces of China’s urbanization [36]. Small-scale TVEs have contributed most of the untreated industrial wastewater emissions due to the very limited treatment capacity and loose local environmental regulations [3,14]. According to a national survey conducted by the Ministry of Health, 16% of surveyed employees of TVEs had occupational diseases, and 83% had unsafe working conditions [34,37]. Populations in rural and newly-developed urban areas face higher carcinogenic risks due to the disparities of economic developments, living conditions, and medical services [4,6,14,38].
Furthermore, globalization has accelerated industrialization and urbanization processes and made China the biggest “world factory.” Globalization has both positive and negative environmental impacts. For example, China’s globalization and open door policy create a “pollution heaven” for attracting foreign investment and allowing multinational corporations (MNCs) to build pollution-intensive factories with lax environmental standards [39,40]. On the other hand, MNCs have transferred environmental technologies and advanced management systems from their home countries to China and improved self-regulation of environmental performances of both foreign and domestic firms [40,41,42].
Along with socioeconomic factors, physical conditions exhibit fundamental influences on heavy metal contamination levels in water and human health, including hydrologic conditions, natural mineral reserves, and greenery coverage [2,3,13,43]. Water pollution from heavy metals is more concentrated in mining areas and watersheds with natural ore deposits [7,44]. Contamination risks are higher when mining activities expose metal ores compared to natural exposure through erosion [7,45]. The metals are carried by water and run-off to rivers and streams, which then transport them to the sea [7]. Downstream areas tend to have higher pollution levels due to the accumulation effect of contaminants from river tributaries upstream [3]. Additionally, industrial emissions are released from highly industrialized coastal provinces located in downstream watersheds [46]. In contrast, green spaces and forested areas, such as forests and grassland, are considered a positive factor in reducing water pollution and improving human health. Consequently, socioeconomic transitions and physical conditions, along with heavy metal water pollution, further triggered the rise of cancer incidences. More details about specific indicators of each transition will be discussed in the following sections.

2.2. Study Area

This study aims to analyze the spatial patterns of cancer incidences and industrial wastewater emission throughout mainland China. The 31 provinces are grouped into three regions: eastern, central, and western [47]. The eastern is the most industrialized and wealthy region with favorable natural environments, advanced initial economic conditions, and extensive foreign investment. The highly populated central region is generally agriculture-oriented, but it is experiencing an industrialization process and transforming into a more pluralistic economy [48]. Rich in land and natural resources, the western region is relatively less developed with a sparse population distribution. Prefecture-level units rank as the second level in China’s governmental administrative system. Typically, one prefecture-level unit is formed by one or more central urban districts and several rural areas, such as surrounding counties and towns. In this paper, prefecture-level units were used to scale data processing and analysis (Figure 2).

2.3. Data and Data Sources

Four types of data were collected and analyzed, including heavy metal water pollution data, socioeconomic data, cancer data, and GIS shapefiles. GIS shapefiles were downloaded from the China Data Center [49]. Five types of heavy metal wastewater emission data, arsenic (As), cadmium (Cd), chromium (Cr), lead (Pb), and mercury (Hg) were provided by the Institution of Public & Environmental Affairs [50]. These five types of heavy metals were chosen because they are very toxic and commonly related to human health. They exist not only widely in the natural environment but they are tightly connected to industrial activities [5,6]. Health data, namely cancer incidences, were collected and compiled from the Chinese Cancer Registry Annual Reports. Data on China’s socioeconomic transitions were obtained from China City Statistical Yearbooks such as industrialization, indicated by annual gross industrial output, road density, and employment rate of mining and quarrying activities; urbanization, reflected by population density; and annual gross agricultural output, as well as globalization, indicated by foreign direct investment per capita. In addition, natural conditions influencing water quality and human health are indicated by distance from the prefecture-level city to the nearest major water body, hydrology feature, and green coverage rate.

2.4. Methods

Seven types of cancers were chosen, due to the highest diagnosed incidences and mortality rates in both male and female populations, as analytical objects to examine industrial water pollution impacts on human health, including esophageal, stomach, colon, rectum, liver, trachea/bronchus/lung (TBL), and brain/nervous system (BN). The total numbers of registered patients with these seven types of cancers were mapped with ArcGIS (ESRI Inc., Redlands, CA, USA) to illustrate the spatial distributions and temporal changes between 2004 and 2009, the earliest and most recent year with available cancer data. The adaptive spatial kernel function was then applied to identify high concentrations of cancer incidences. In order to examine the interaction between industrial wastewater emission and outbreaks of cancers, overall emission levels were further assessed of five types of heavy metals and compared to the spatial patterns of cancer clusters. Due to lacking pollution data for China, the 2011 heavy metal emissions from industrial wastewater were selected in this study since the data were best available of those near 2009. The industrial emission data were available for 159 of 284 prefecture-level cities. Kriging models in ArcGIS were used to estimate the levels of five types of heavy metals from industrial wastewater. Previous studies have shown kriging to be an accurate method for data estimation because of its low bias [3,51,52,53,54]. For each metal, at least 50 different scenarios with different parameters were tested, and the optimal model was identified by comparing root-mean-square deviation (RMSE) and paired t test results. RMSE is a frequently used to compare differences between the predicted and observed values, which provides a reliable indication of the fitness of the model [55]. To ensure the accuracy of model predicted heavy metal emission values, paired t test was applied to further validate model performance. The optimal model for each heavy metal was identified based on the results of paired t test (p-value > 0.05) and smallest RMSE. The selected model was used to create a relevant kriging surface and to extract the missing emission data. The emission level of the metal was standardized and ranked by calculating the z scores from the kriging predicted pollution data. z-score has been introduced by Agunwamba in comparing crops irrigation with wastewater and the health outcome [56]. For every city, a composite index indicating the overall heavy metal emissions from industrial wastewater (IWW index) was obtained by summing up z scores of five metals. The spatial distribution of each of the seven types of cancers was compared to the IWW index with GIS maps.
The impacts of heavy metal water pollution on human health were examined in conjunction with China’s socioeconomic transitions through seven multiple regression models (Table 1).
C = a + bSTR + cTRA + dURB + eIND + fGLO + gAGR + hECO + iDIS + jGRE + kHYD + lMQ + mHM + nTPOP
Numbers of registered cancer incidences of the esophagus, stomach, colon, rectum, liver, trachea/bronchus/lung (TBL), and brain/nervous system (BN) in 2009 were chosen as dependent variables to reflect the human health levels. There were three sets of independent variables. According to the recent literature [3,47,57], the first set of variables measured China’s socioeconomic transitions through a series of indicators in 2009. Industrialization was represented by the annual gross industrial output (IND), the percentage of persons employed in mining and quarrying (MQ), and road density (TRA). These factors were used to reflect the scales of the overall manufacturing industry as well as mining and transportation industries. Population density and the annual gross agricultural output (AGR) were chosen to represent urbanization (URB). Globalization (GLO) was reflected through actual foreign direct investment. Economic development (ECO), indicated by GDP per capita, also had influenced on environmental conditions. Positive causal relationships were expected between cancer incidences and all above independent variables except AGR since it was assumed that the rapid urbanization process had detrimental effects on the environment and human health.
The second set of variables reflects the impacts of the physical environment on pollution, which further impacts cancer incidences. Hydrological properties (HYD) were represented by the locations of the cities. Cities at upper, middle, and lower reaches of rivers were indicated by 1, 2, and 3, respectively. It was assumed that water was more polluted in the lower reaches than upper because of collective contaminants from upstream tributaries and pollutants from industrialized downstream watersheds. Since the majority of rivers and lakes have been polluted in China, the distance of a city to a major water body (DIS) was considered as a factor relating to higher cancer risk of local residents [15]. Distances between cities and major water bodies were indicated by binary parameters based on the official published China map. With 1 cm/76 km as the search radius scale, 0 represented cities out of radius, and 1 indicated cities within the radius. Cancer incidences were assumed to be higher with a major water body nearby. The percentage of green areas for each city (GRE) was assumed to contribute to better human health [43]. The third set of independent variables included emission levels (HM) of five heavy metals (As, Cd, Cr, Hg, and Pb) from industrial wastewater in 2011 due to the lacking of pollution data from 2004 to 2009. The sewage treatment rate (STR) was chosen as a control variables since it reflects the effectiveness of pollution water regulation in prefecture-level cities. Total population was added as another control variable to the model to indicate population size.

3. Results and Discussion

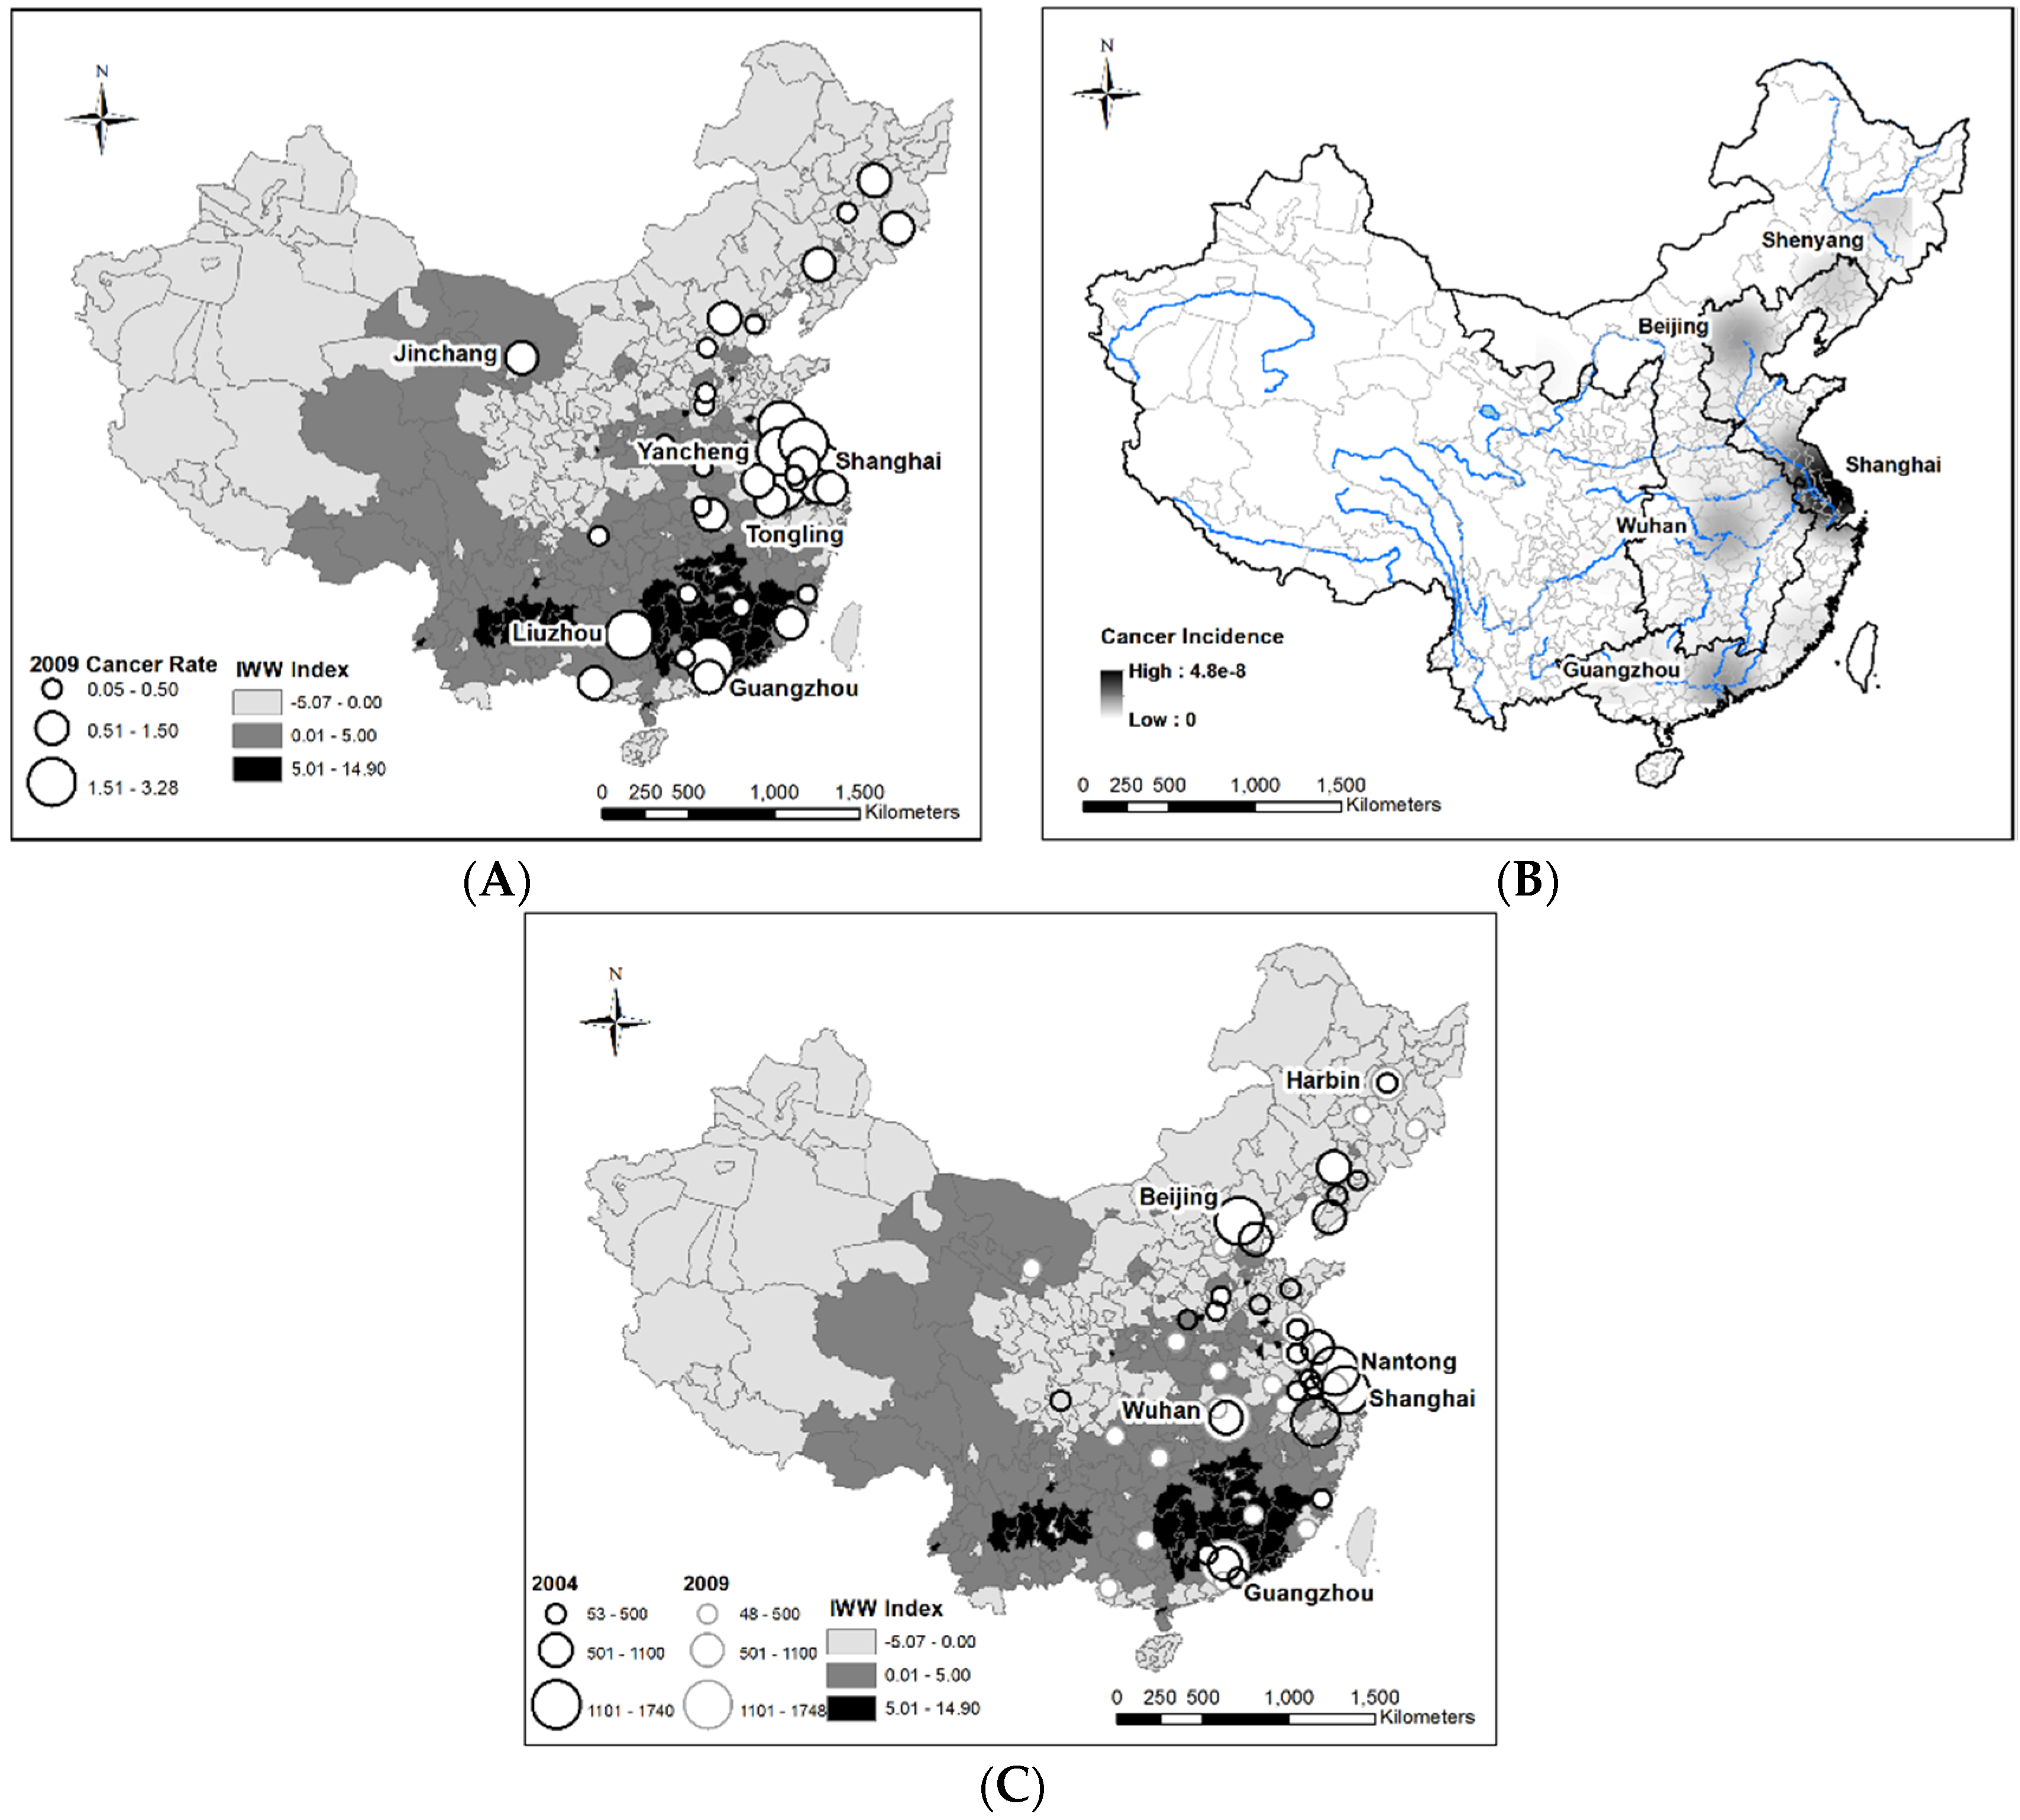
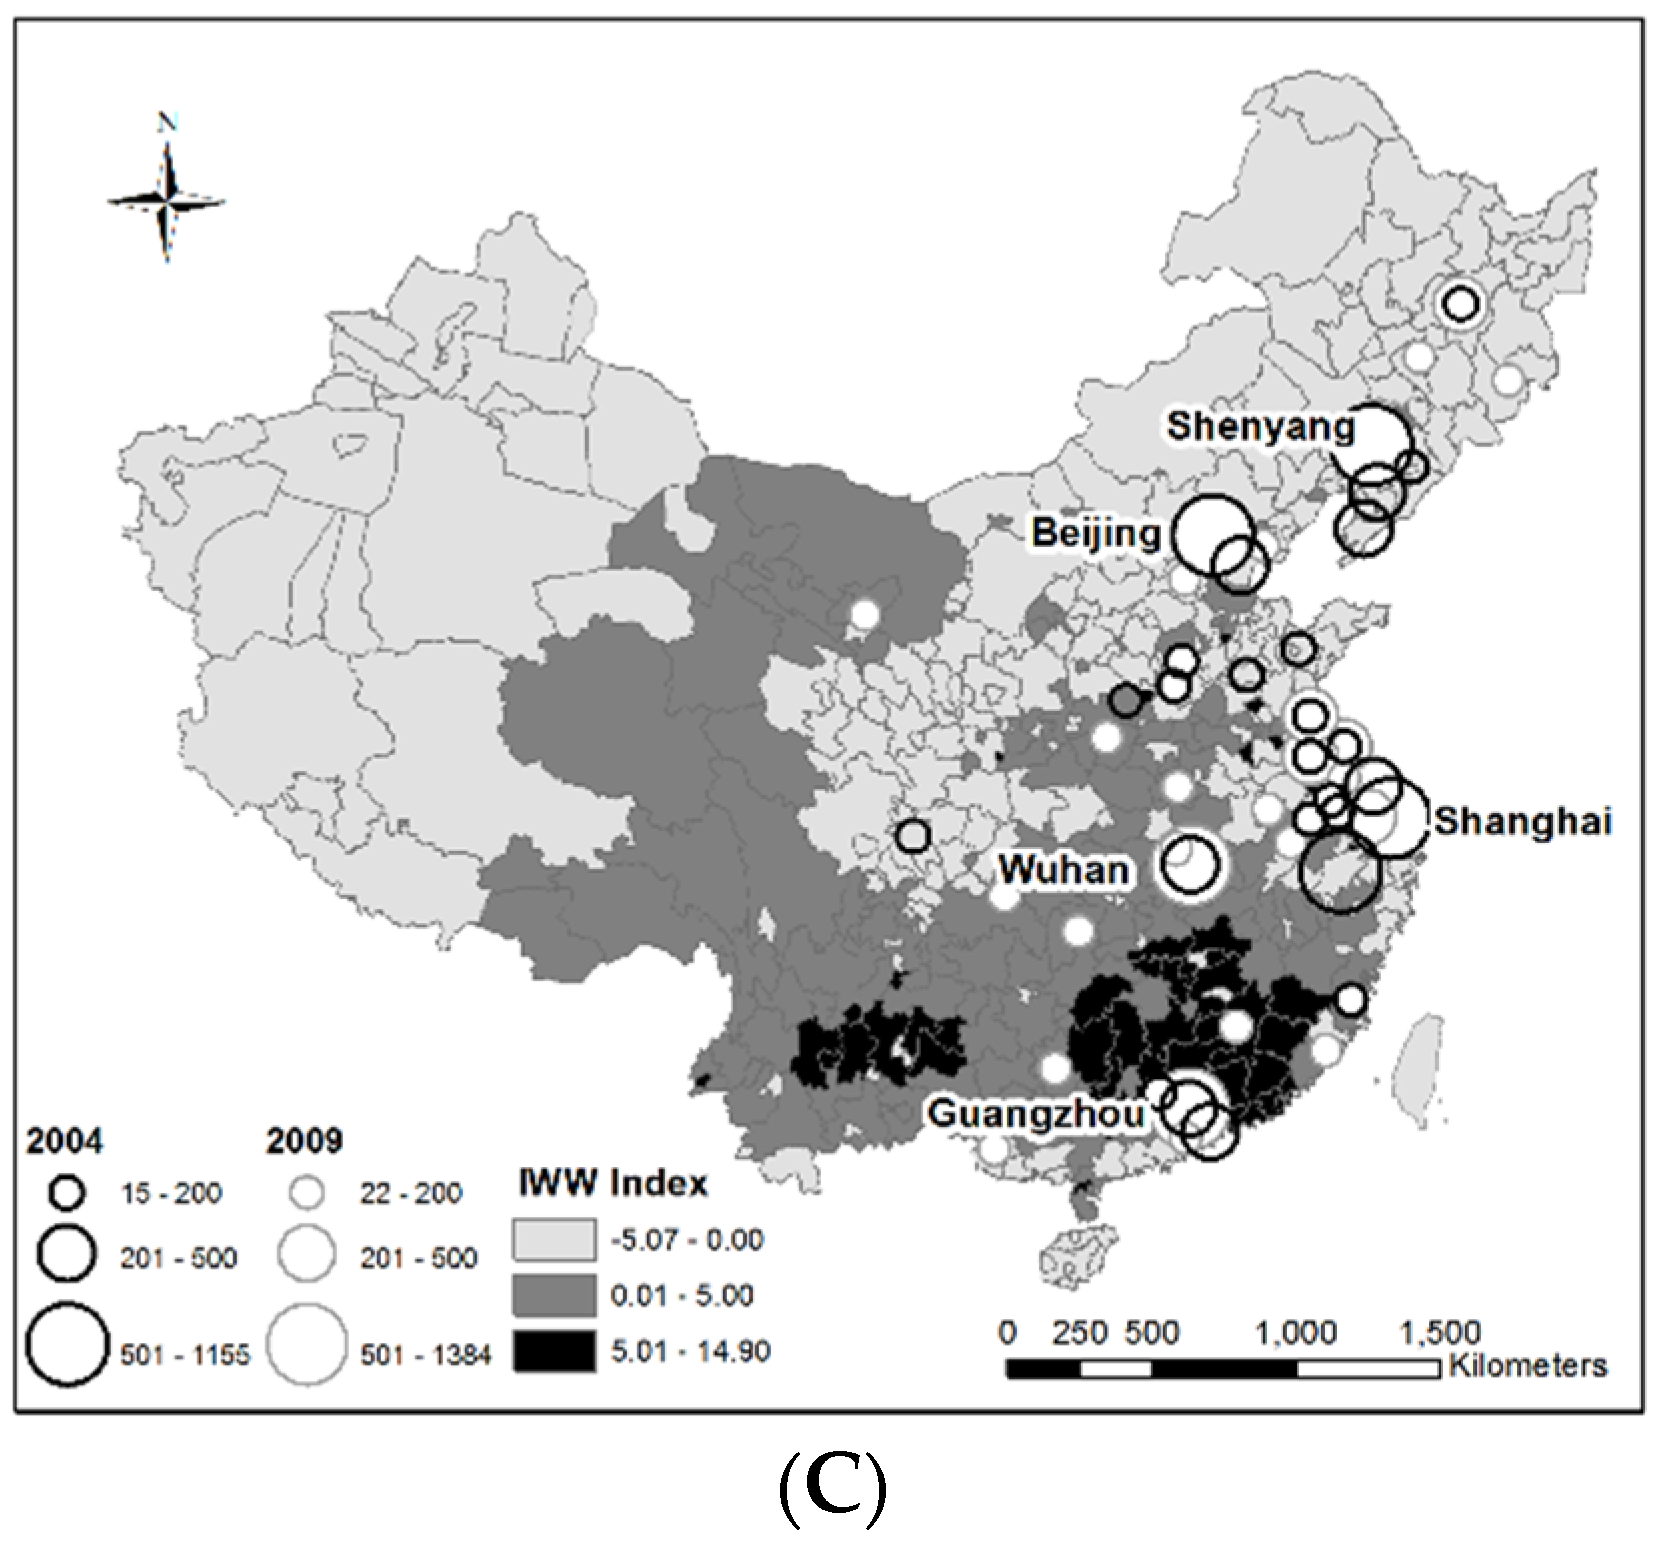
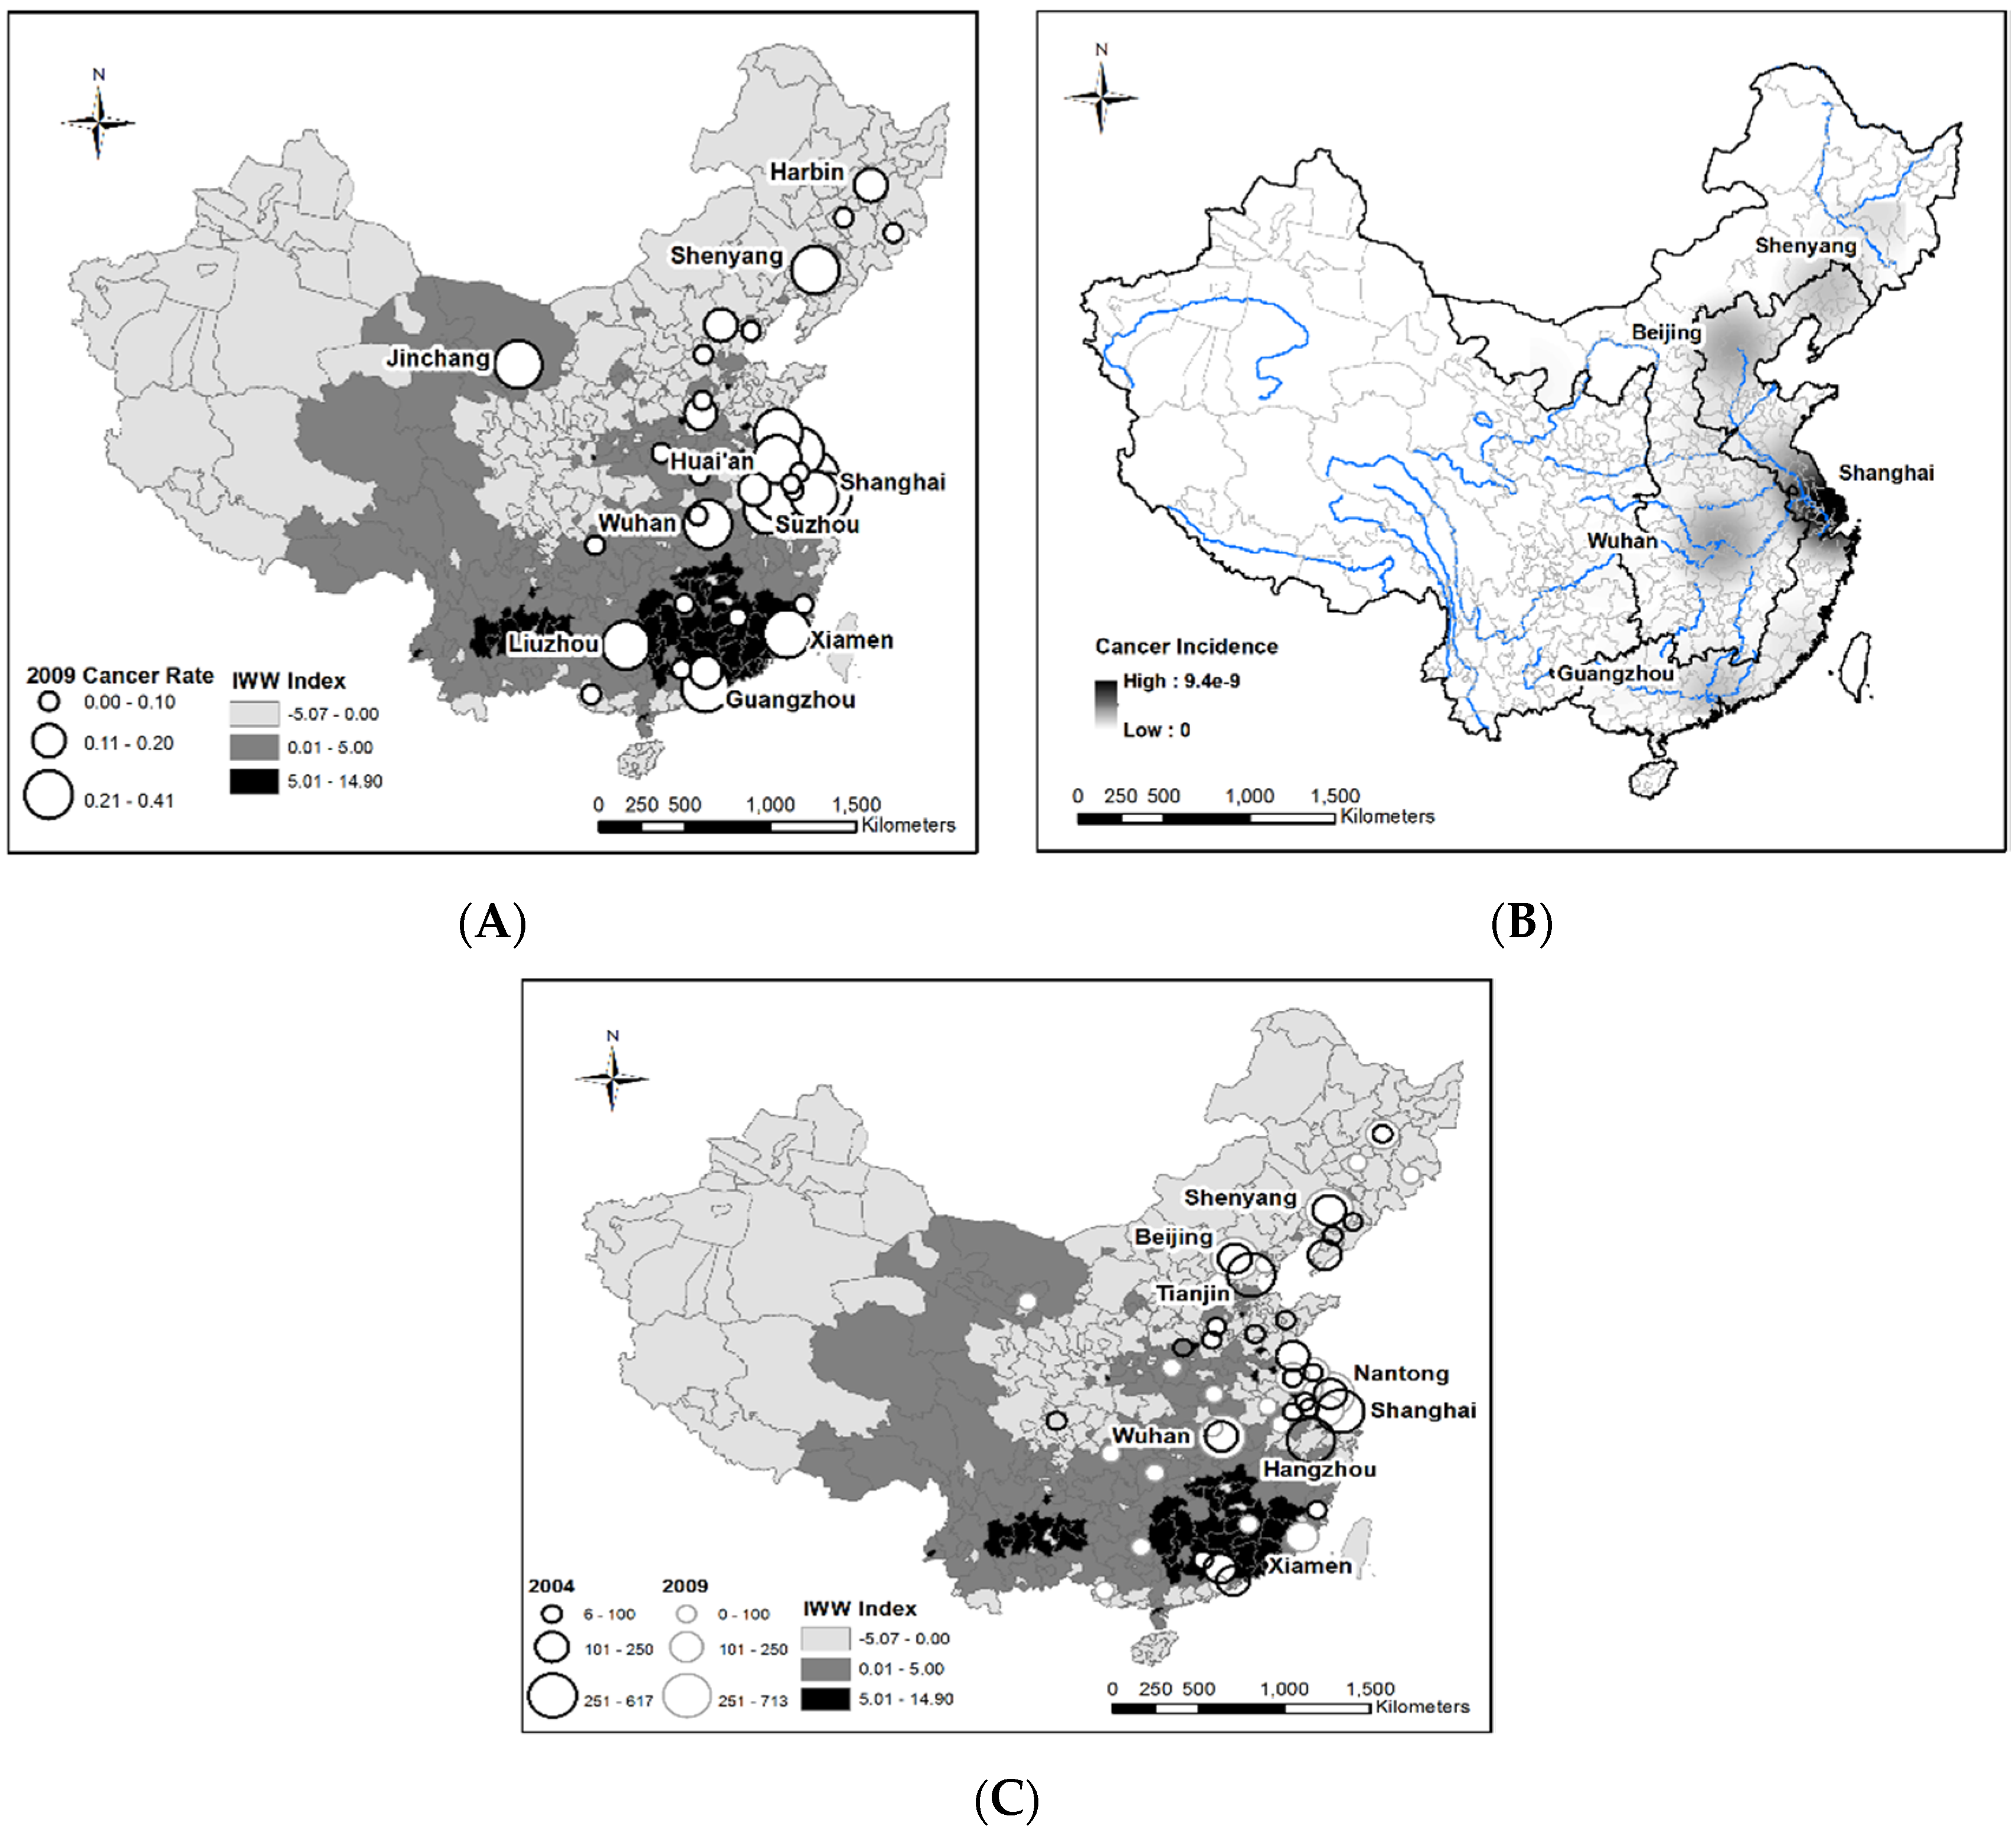
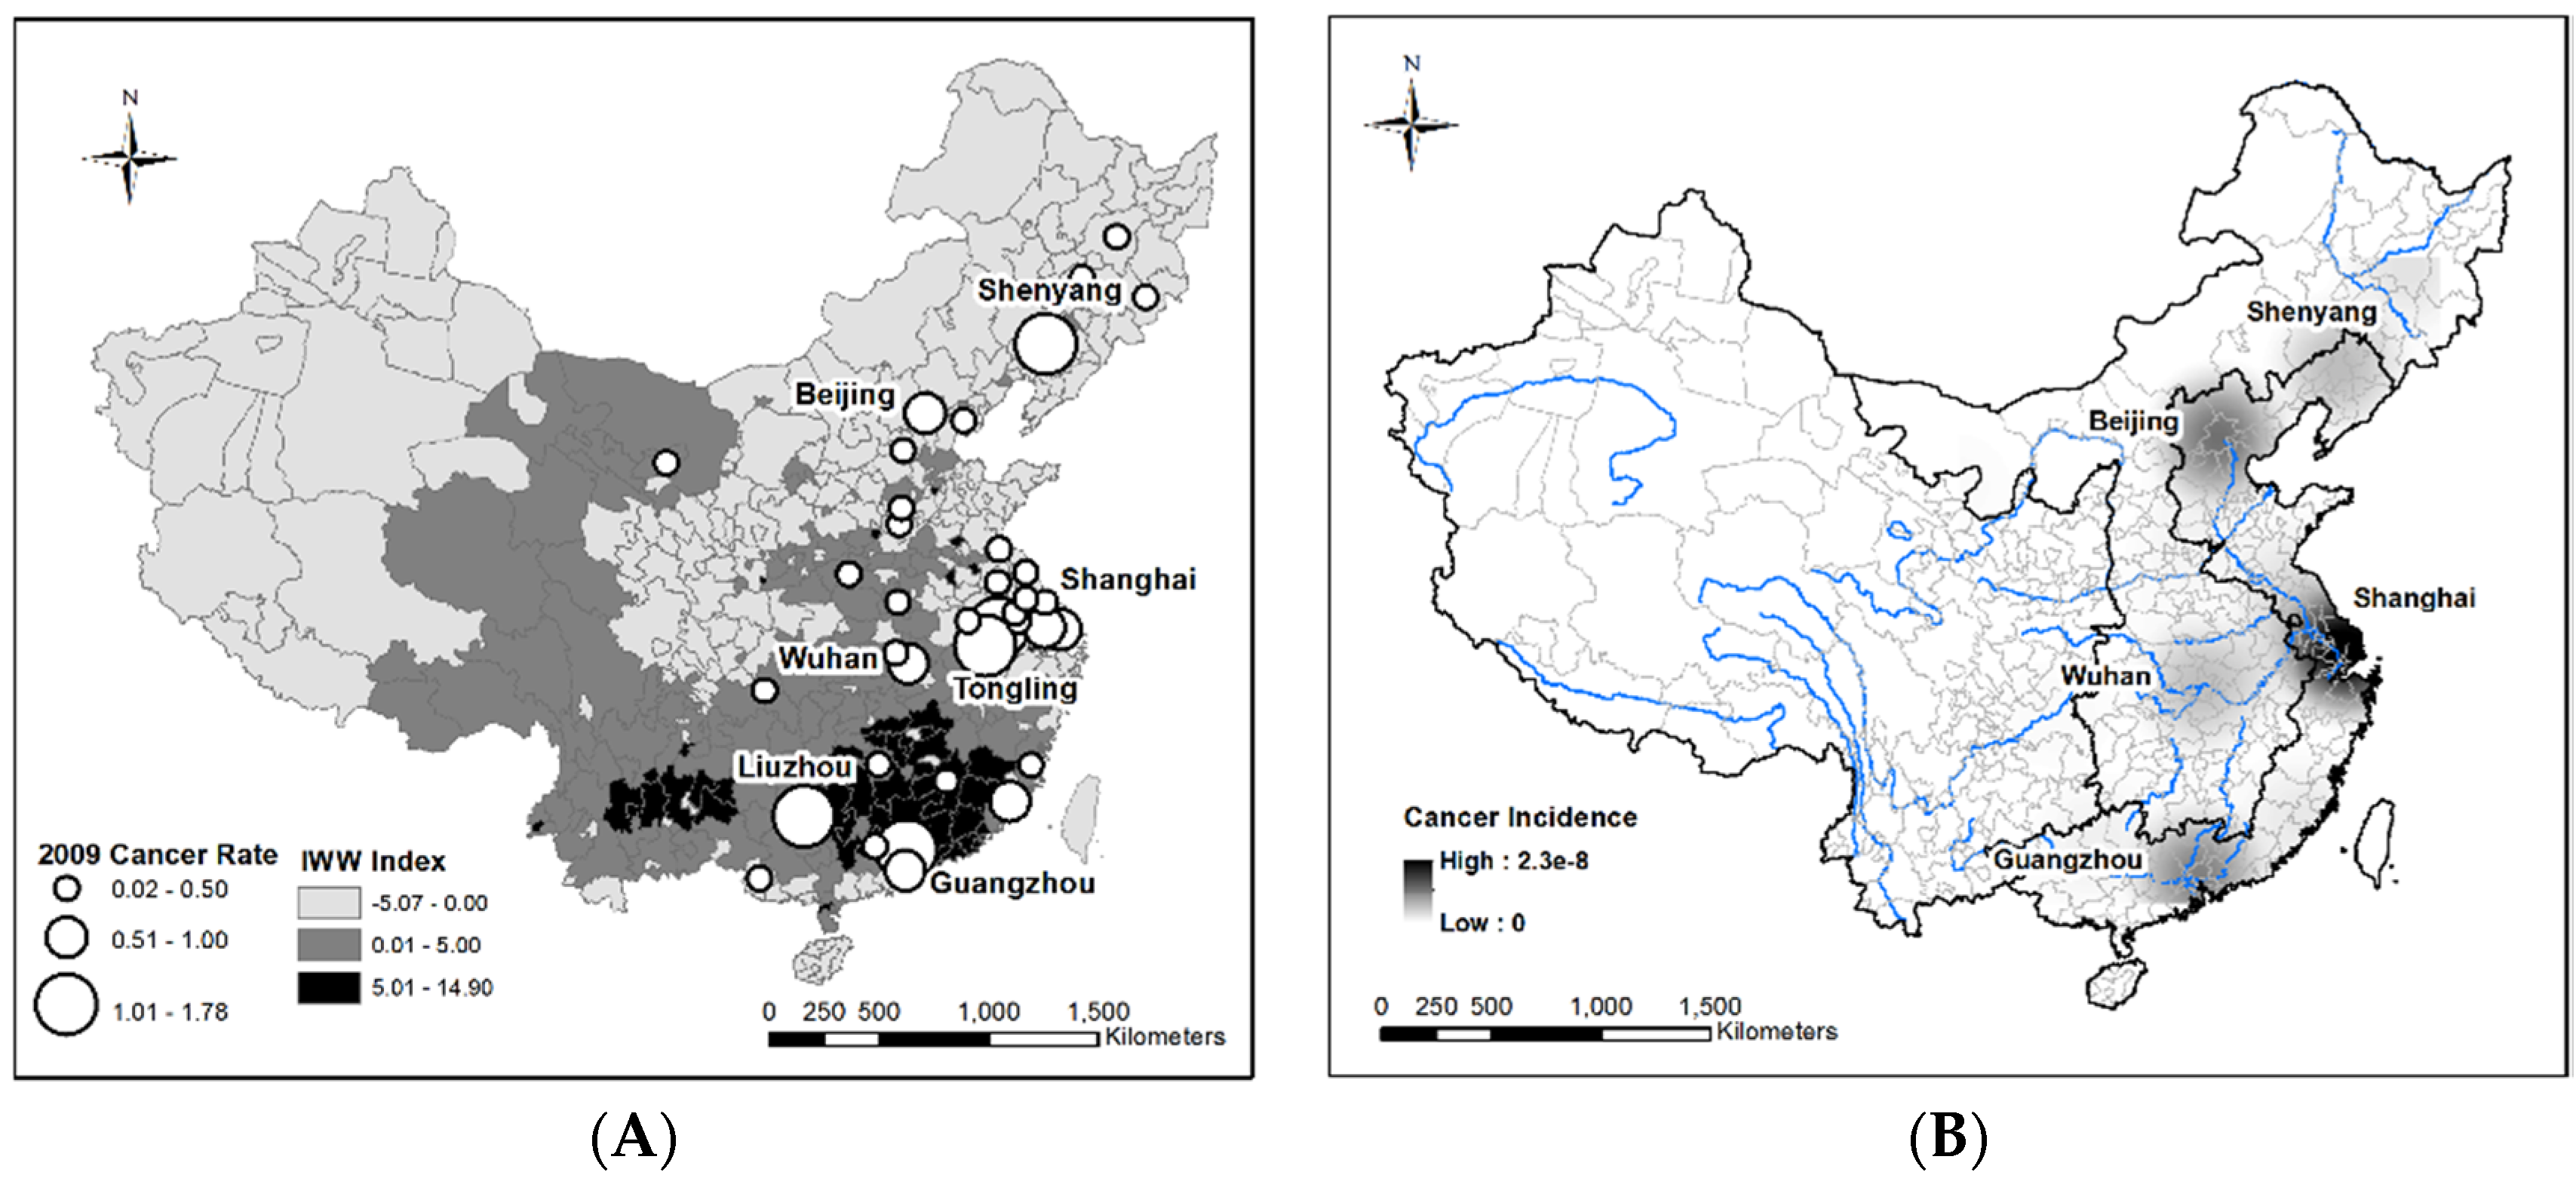
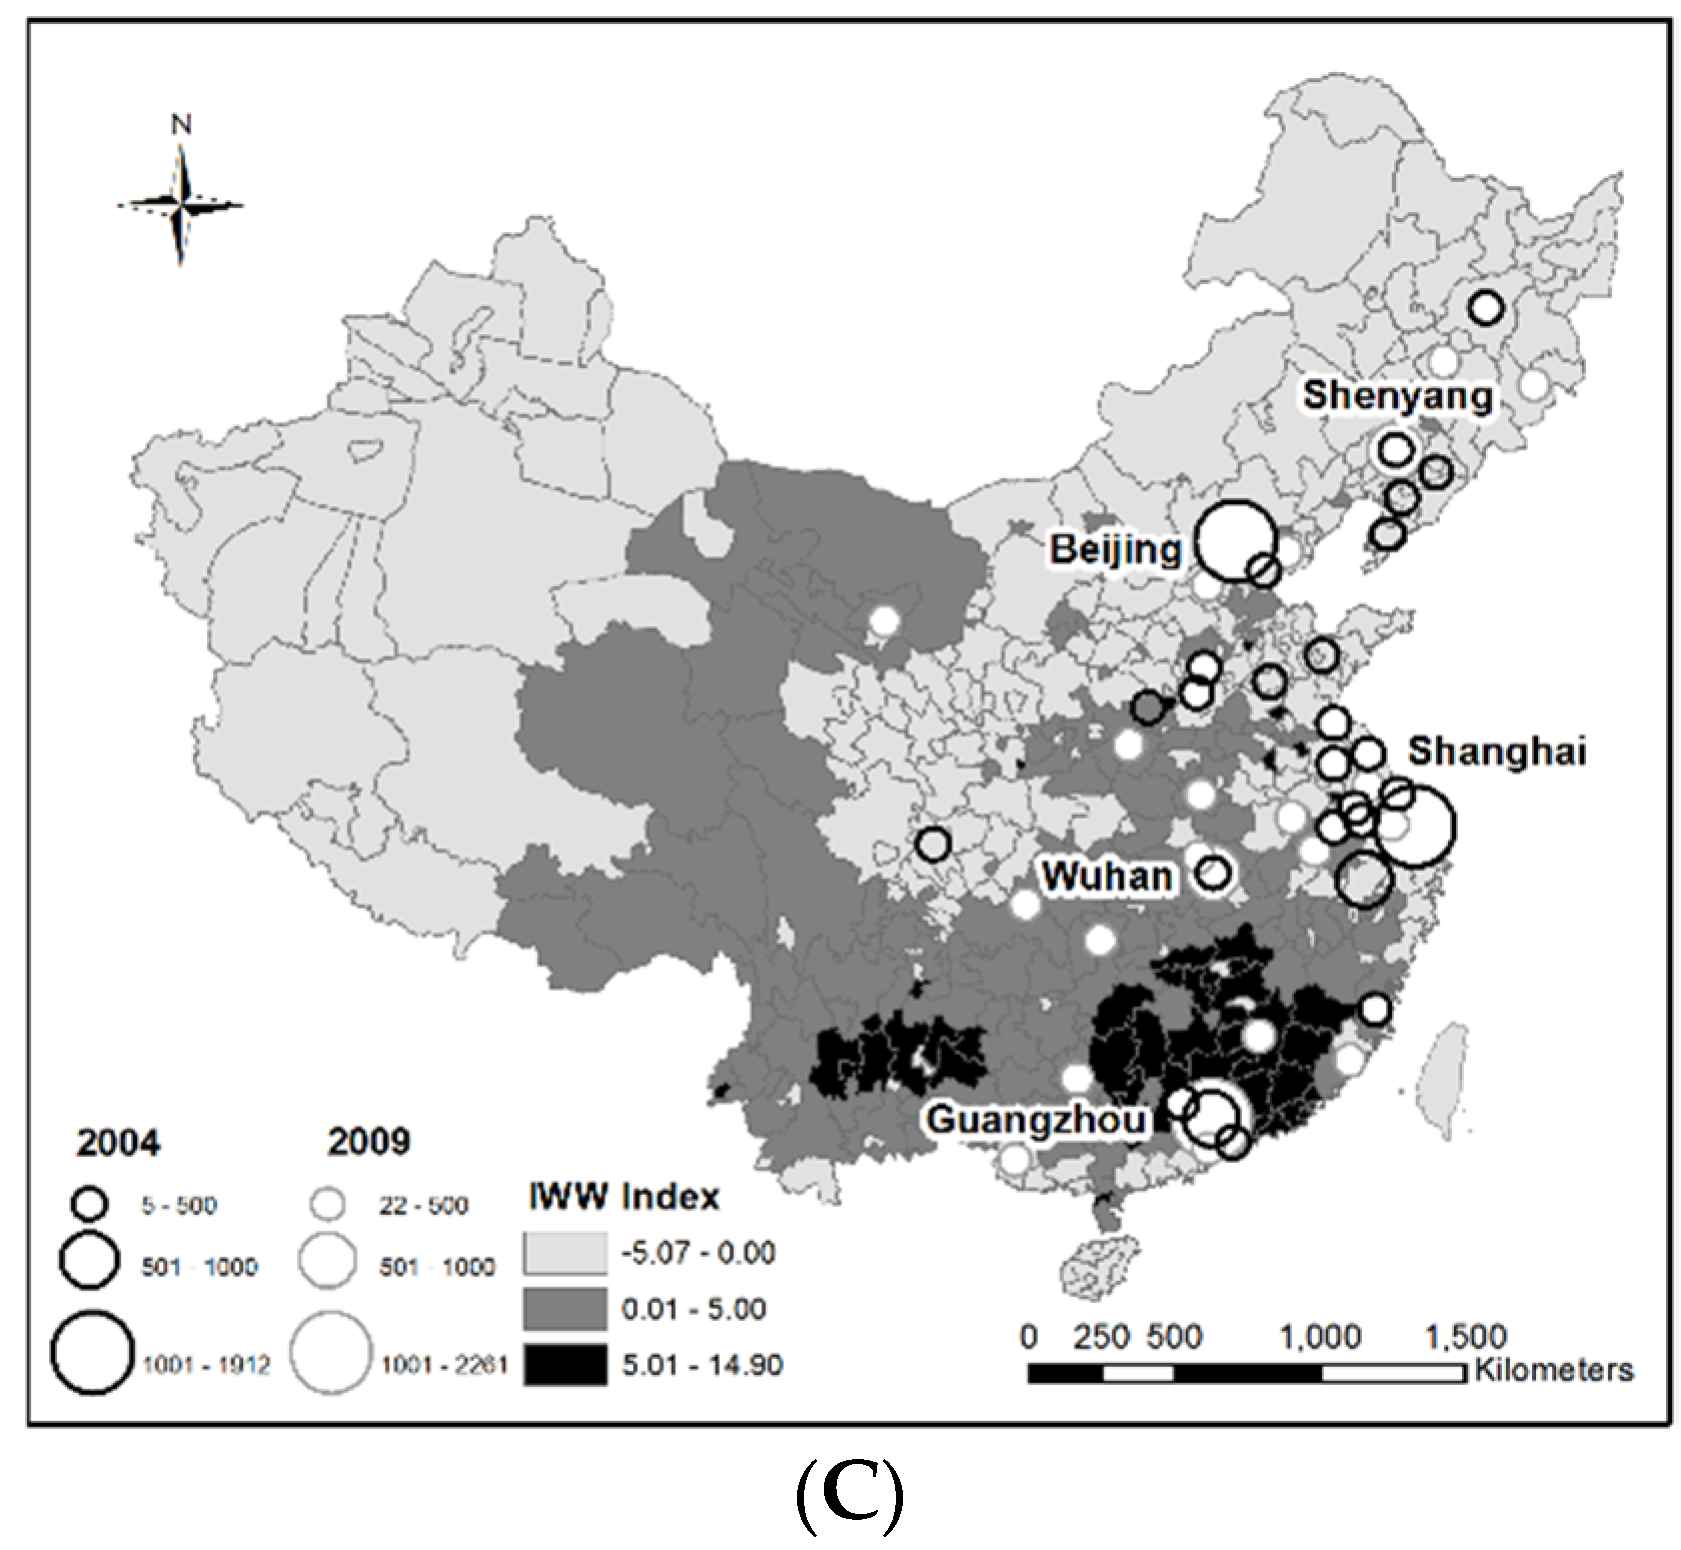
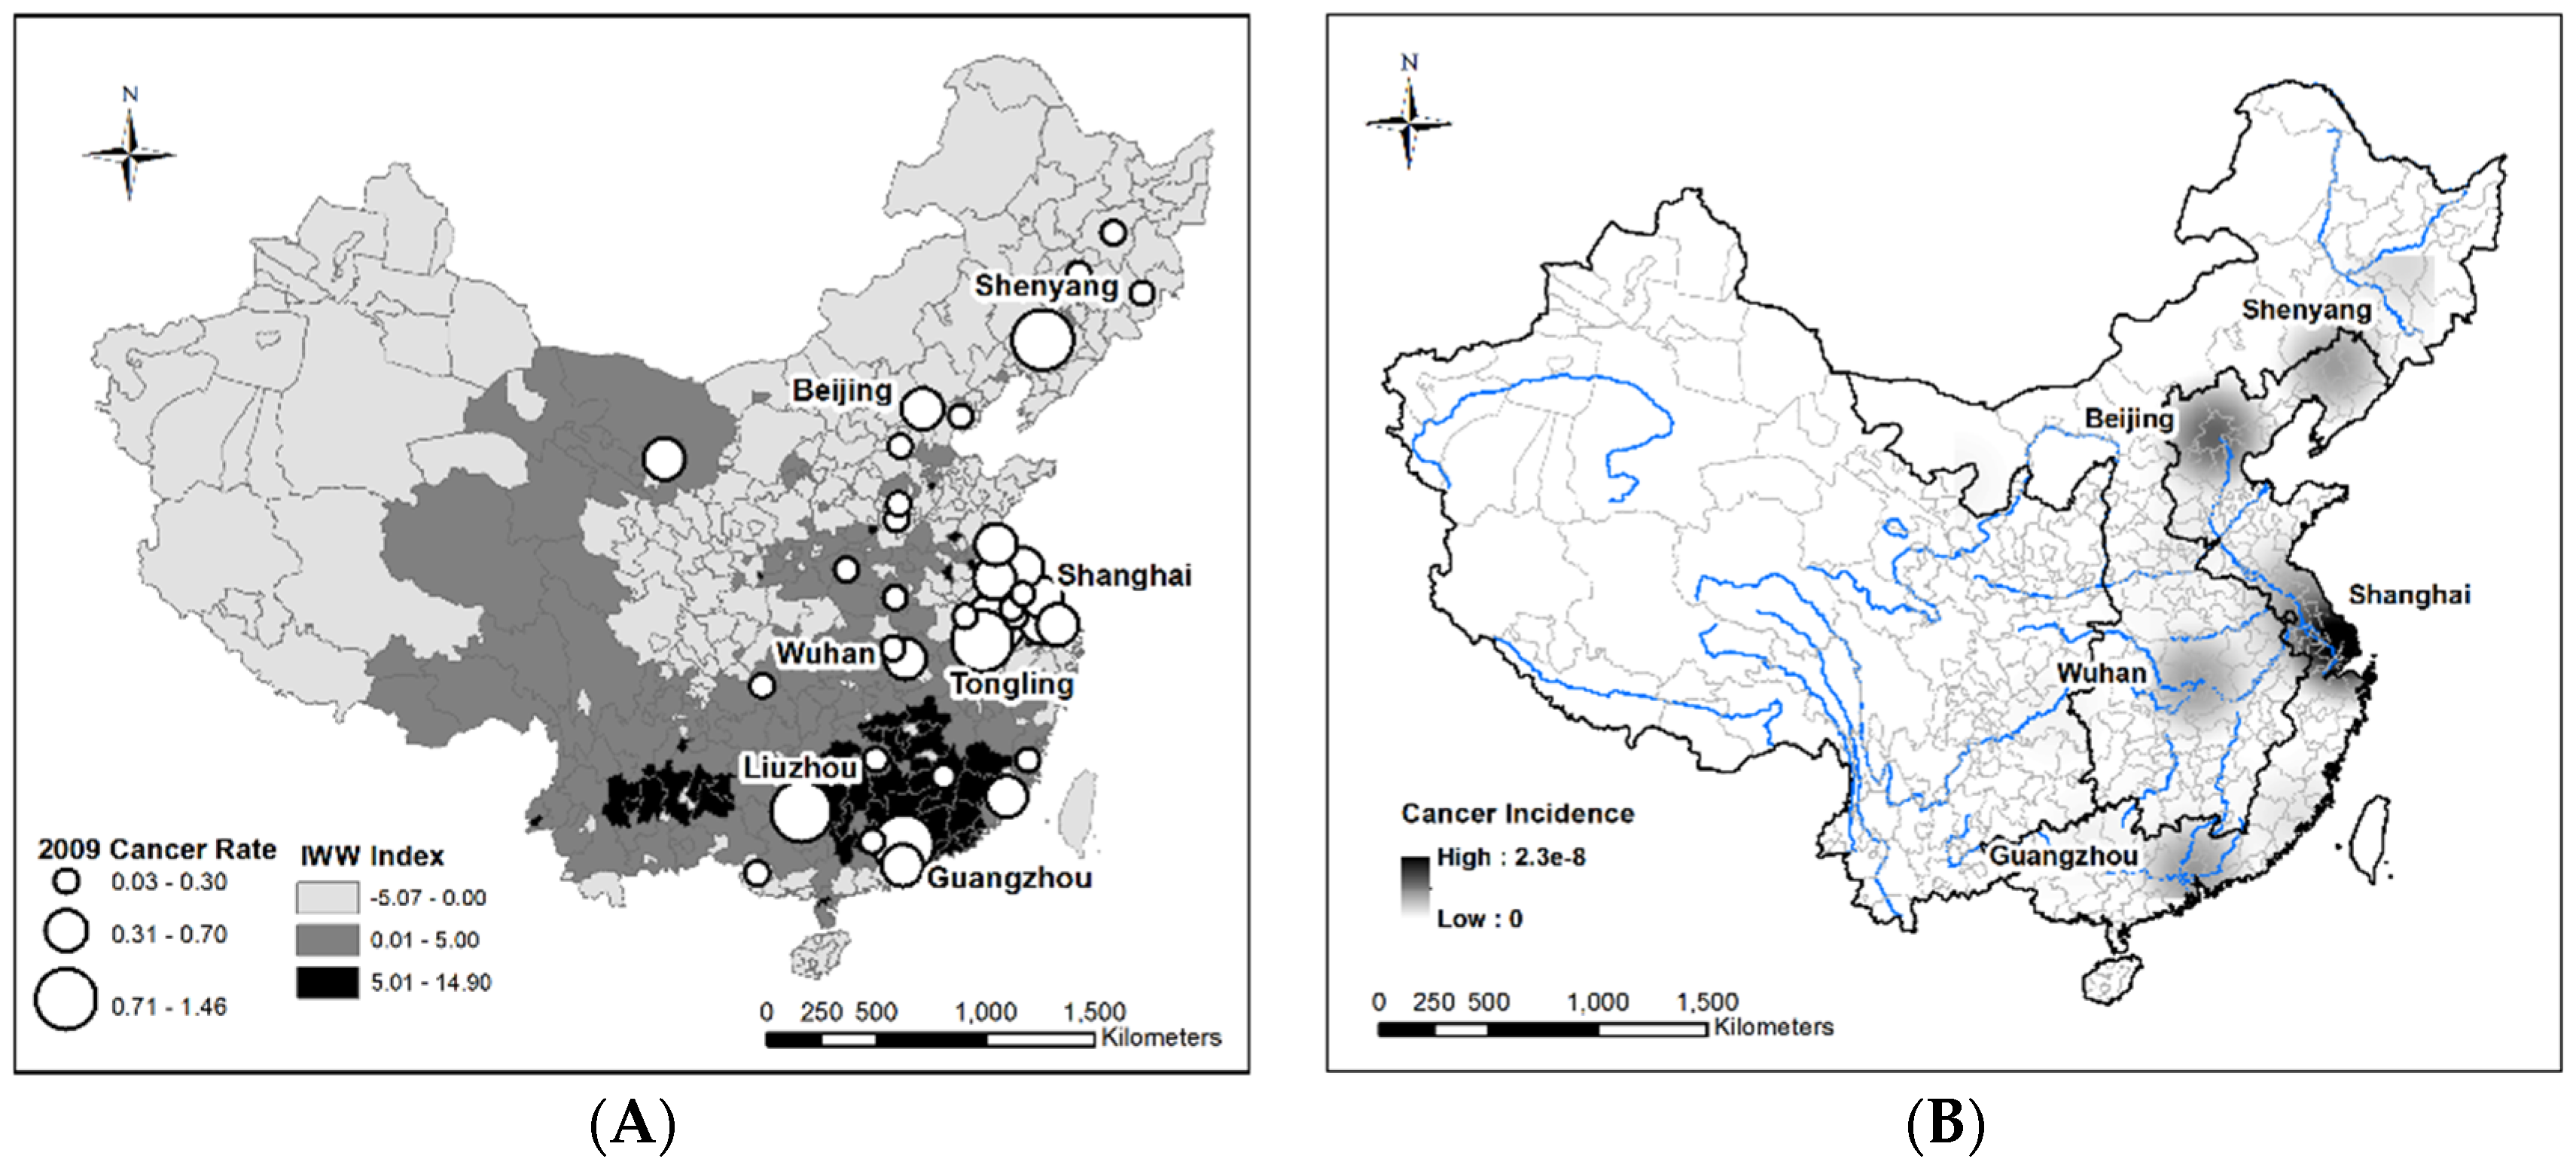
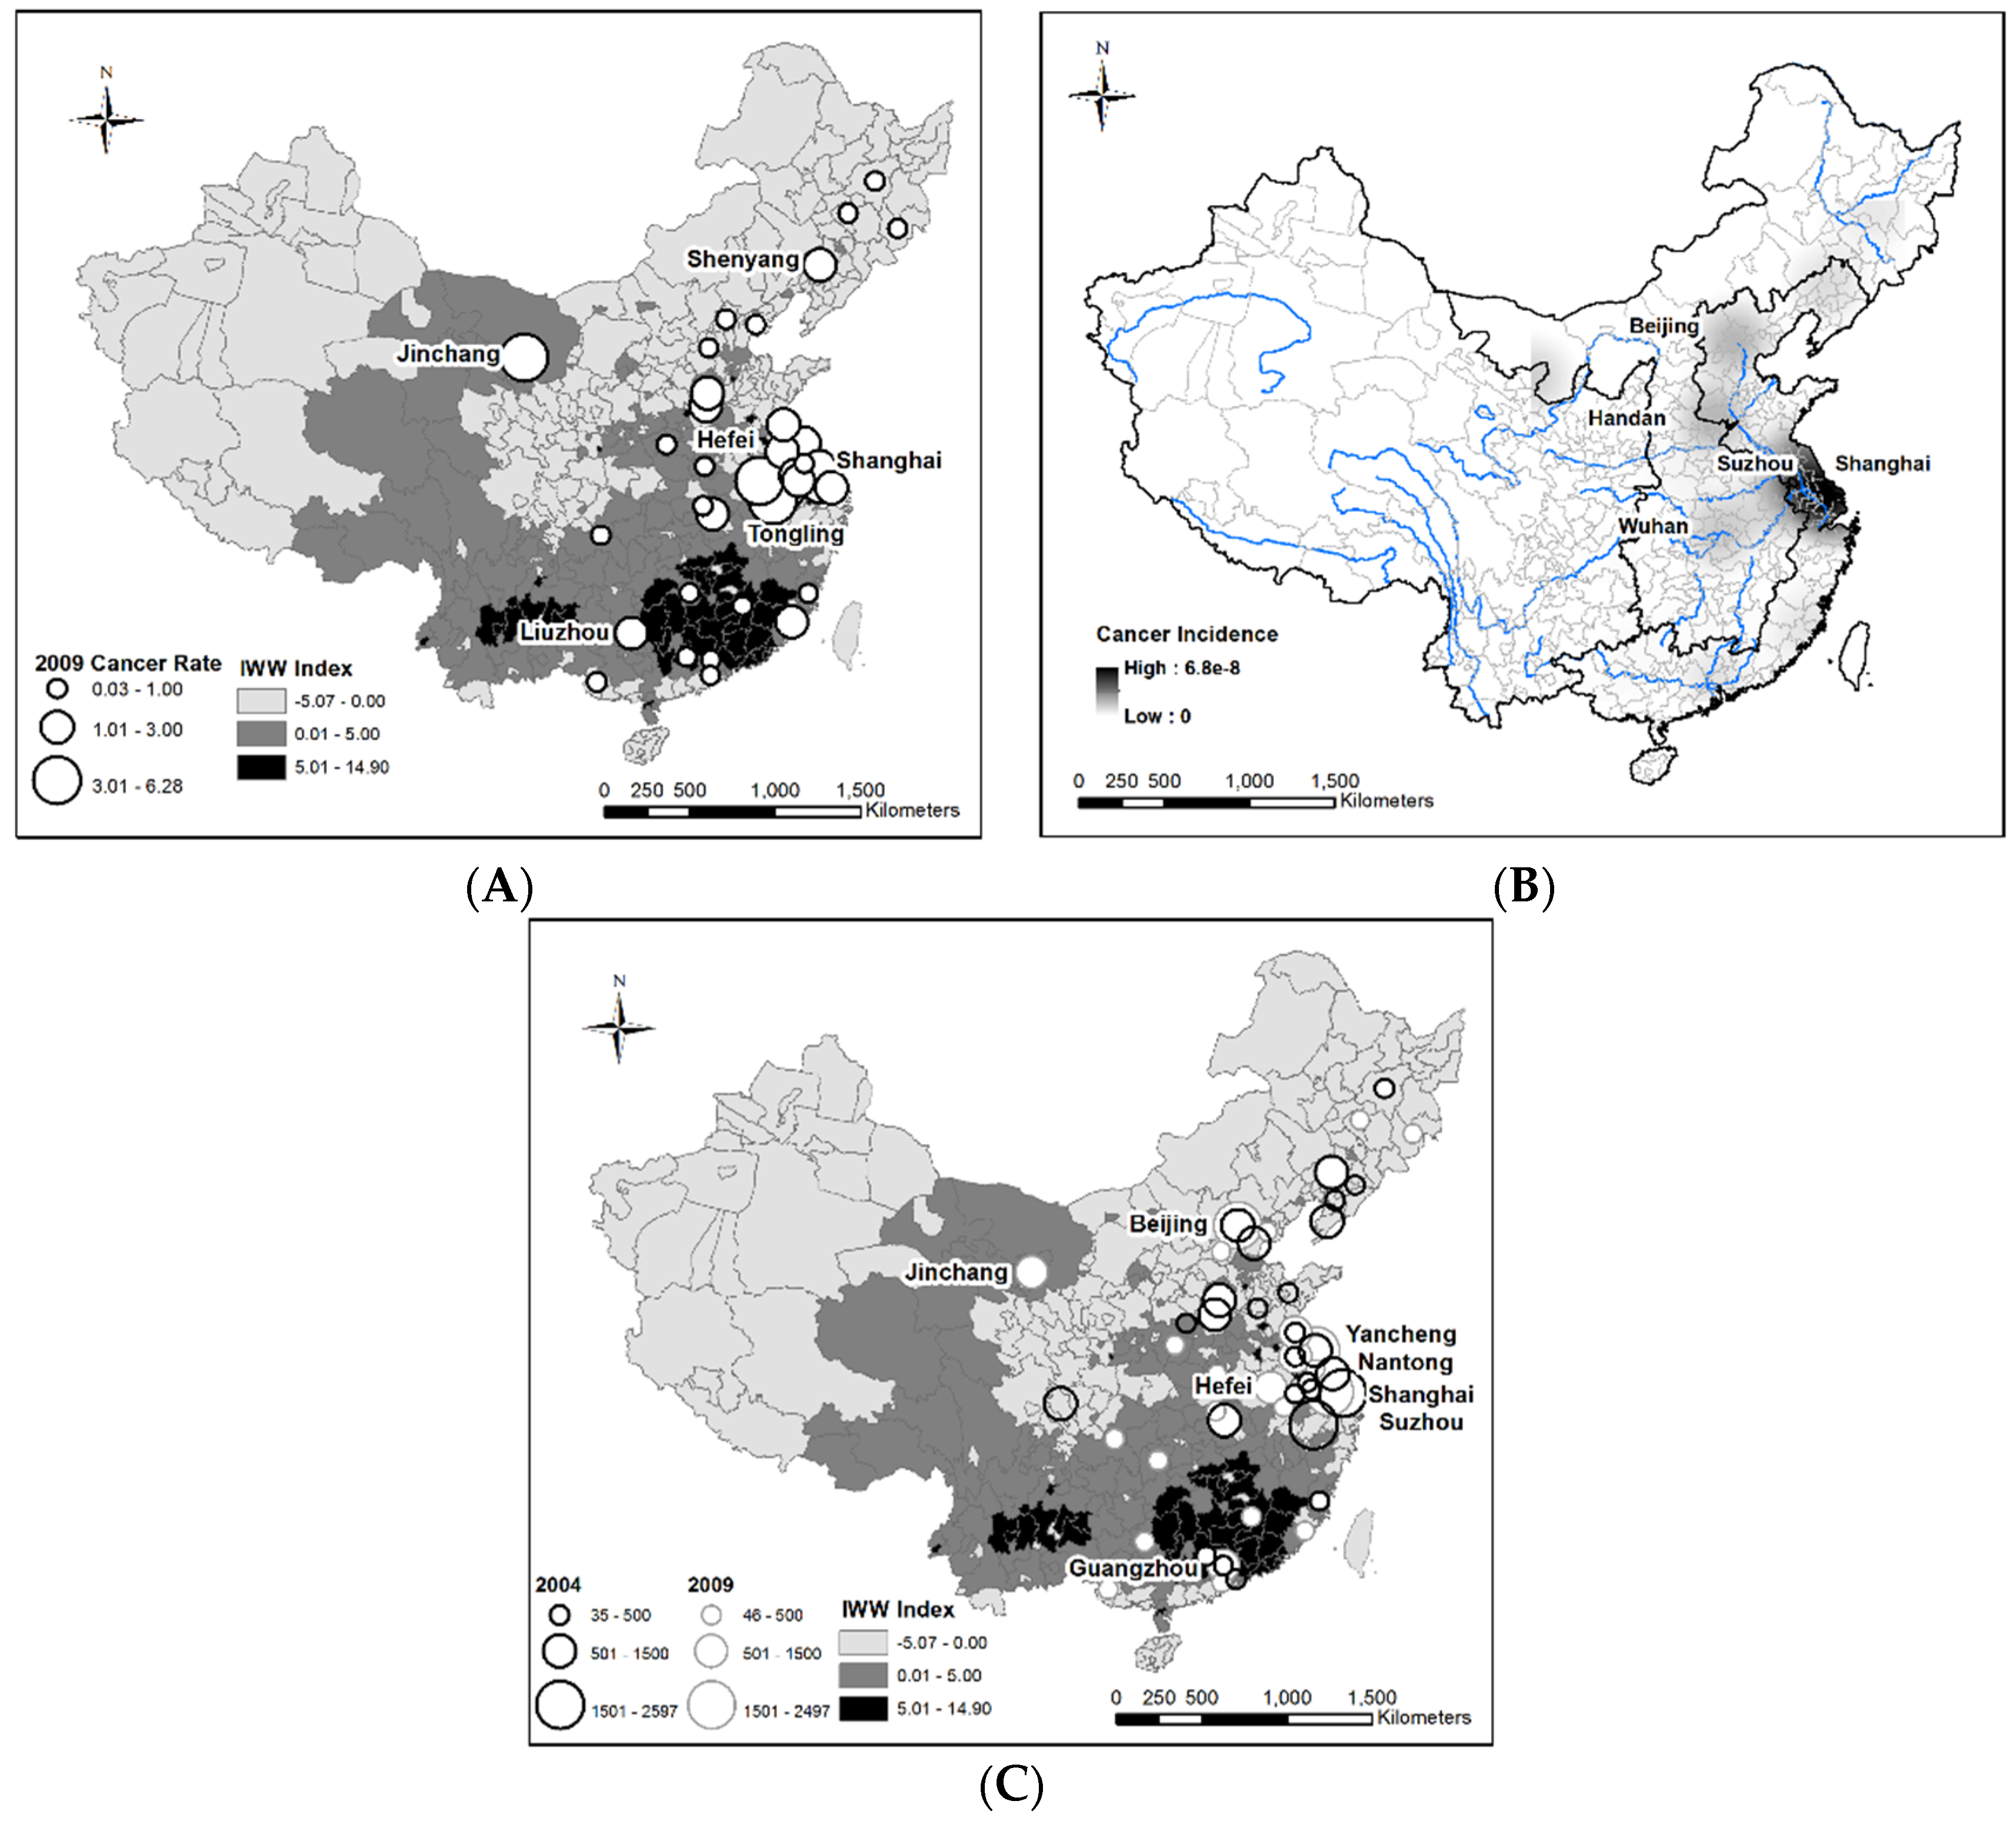
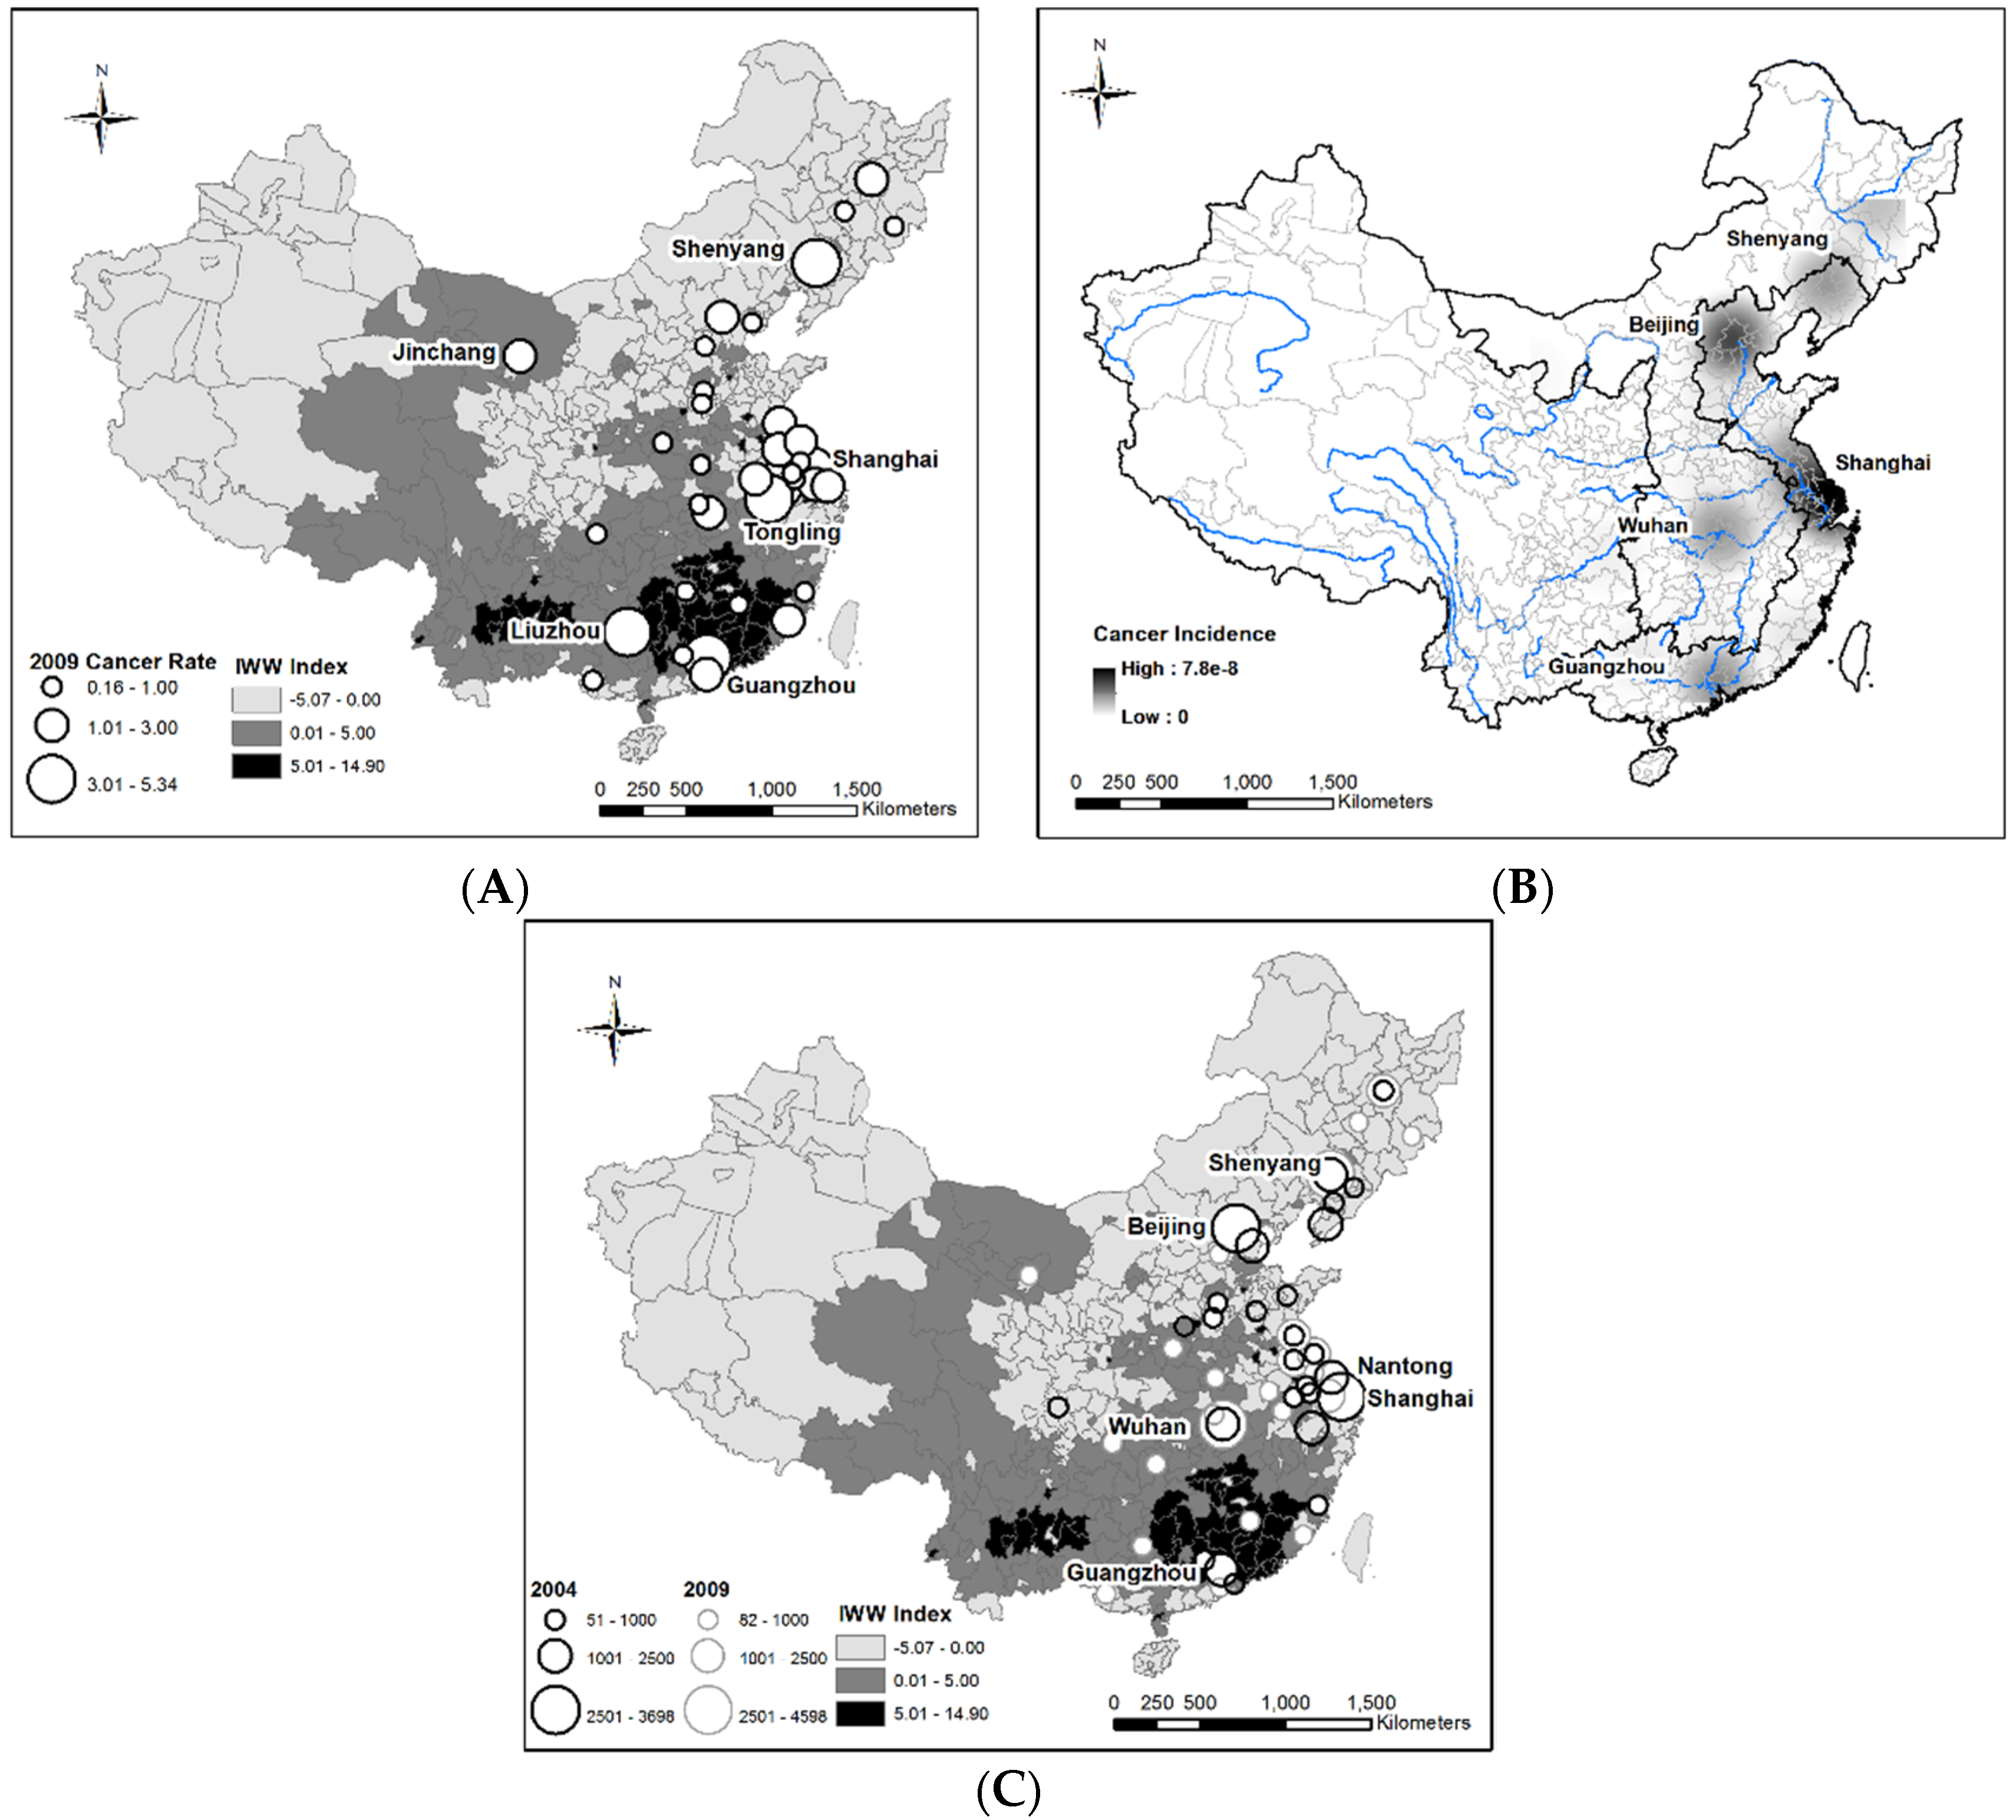
3.1. Spatial-Temporal Variations of Cancer Incidences and Industrial Pollution

Figure 3, Figure 4, Figure 5, Figure 6, Figure 7, Figure 8 and Figure 9 exhibit spatial-temporal variations of seven types of cancer incidences in China from 2004 to 2009. Most registered cancer incidences occurred in both traditional industrial bases and newly industrialized areas. The former includes Beijing, Shanghai, Shenyang, Wuhan, Tongling, and Liuzhou, while typical newly industrialized areas are Guangzhou, Suzhou, and Nantong with large-scale foreign-invested multinational corporations or small-scale TVEs, where very high rates of some or all seven types of cancers appeared in 2009 (Figure 3A, Figure 4A, Figure 5A, Figure 6A, Figure 7A, Figure 8A and Figure 9A). Similarly, kernel estimation identified clusters of high cancer incidences in highly industrialized and urbanized metro cities in eastern and central regions, including Beijing (North China), Shanghai (East China), Guangzhou (South China), Wuhan (Central China), and Shenyang (Northeast China) (Figure 3B, Figure 4B, Figure 5B, Figure 6B, Figure 7B, Figure 8B and Figure 9B). Between 2004 and 2009, the numbers of registered cancer patients increased significantly with continuously worsened environmental pollutions (Figure 3C, Figure 4C, Figure 5C, Figure 6C, Figure 7C, Figure 8C and Figure 9C). For example, trachea/bronchus/lung (TBL) cancer incidences increased from 3698 to 4598 cases, and esophageal cancer incidences doubled from 1129 to 2358 cases, especially in industrial cities like Shenyang and Wuhan. These results are consistent with previous studies [5,58,59] which show that distributions of cancer incidence clusters coincide with locations of major rivers and their tributaries, such as mid-lower Yellow River Basin, mid-lower Yangtze River Basin, Huaihe River Basin, and Pearl River Delta. These areas have a high population densities and are also prime locations for both domestic and foreign invested industrial parks [40]. For example, half of China’s 20,000 chemical factories are located along the Yangtze River, which have, at best, marginally regulated wastewater and toxic emissions [60].
When further comparing spatial patterns of cancer incidences with industrial pollution, strong correlations were observed between the industrial wastewater emission index (IWWI) and numbers of cancer patients, cancer incidence rates out of 10,000 people, and increases in cancer incidences from 2004 to 2009. One main cluster of all seven types of cancers developed in the Yangtze River Basin, including Wuhan, Shanghai, Suzhou, Nantong, Yancheng, and the surrounding areas. Two large clusters of rectal, colon, brain and nervous, and Trachea/bronchus/lung cancers were identified in Haihe River Basin with Beijing, Shenyang, and Tianjin as well as in the Pearl River Delta with Guangzhou and Liuzhou included. These rivers support China’s economic powerhouses, the largest industrial and urban agglomerations, and major grain producing areas, which have generated significant amounts of industrial, domestic, and agricultural wastewater with heavy metals and greatly polluted surface water [3,40,59]. According to a national survey, water quality was revealed worse than grade V, the worst category in the national standard, at about 10% of the monitored sections of Yangtze and Pearl Rivers and at all monitored sections in urban Guangzhou [61]. Haihe River, Yellow, and Huaihe River basins in the North China were faced with even worse surface water pollution than rivers in South China [59]. In addition to these major economic zones in coastal areas, high cancer risks were also identified in some small but specialized cities with large-scale heavy industries and affluent natural mining resources. In accordance to a large overall IWWI, high esophageal and stomach cancer incidences appeared in Jinchang, a western city established and developed around nickel resources and mining industries. Greater risks of rectal and liver cancers were observed in Tongling, a city famous for the steel industry in the central region.

3.2. Socioeconomic Transitions, Industrial Pollutions, and Human Health

Table 2 summarizes the results of the multiple regression models for understanding the impacts of industrial waste water emissions on cancer incidences within the framework of socioeconomic transitions and physical environmental conditions. Considering the potential multicollinearity problems, the variance inflation factors (VIFs) of the seven models were examined in ArcGIS. Water pollution level of arsenic (VIF = 10.76), foreign direct investment (VIF = 14.28), and total population (VIF = 26.74) were dropped since their VIFs were larger than 10, indicating strong correlations among independent variables and violation to the regression assumptions [47,62,63]. Thus, there were 14 independent variables in each of the seven regression models. The reliability and performance of all seven cancer models were demonstrated through both significance F and R-squared values. Results showed these models were all significant at the 1 percent confidence level (p < 0.01), except for the esophageal model (p = 0.13) and brain/nervous system model (p = 0.012). The R-squared values varied between 0.55 and 0.84 for seven models, indicating that 55% to 84% of variations in cancer incidences can be explained by those 14 independent variables reflecting heavy metal emissions from industrial wastewater, socioeconomic transitions, and physical environmental conditions. The results of the seven models revealed the following findings.
First, considerable amounts of industrial emissions with toxic heavy metals, in particular, mercury, was one of the major factors causing the outbreaks of cancers in China. As one of the most toxic heavy metals, mercury (Hg) poisons the human body directly through the food chain, especially through consumption of seafood and long-term exposure to contaminated environments via skin and hair [8,64]. The potent toxicity of mercury on human health has the potential to severely damage the human digestive system [7,8,64,65]. In this research, the level of mercury emission was positively associated with the incidences of digestive cancers (stomach, p = 0.02; liver, p = 0.09). With further examination of the concentration of gastrointestinal cancers in the Yangtze River Basin, it was found that local small-scale chemical, pesticide, and LPG factories had been linked to cancer outbreaks by previous studies [4,66]. For example, more than 70% of the residents died of cancers in a small village surrounded by several chemical plants in Yancheng, Jiangsu Province [4,66]. Literature showed that four other types of metals, lead (Pb), cadmium (Cd), chromium (Cr), and arsenic (As), could also seriously damage human health and cause lung, liver, stomach, and skin cancers [7,8,9,19,57,67]. The level of lead (Pb) emissions was found to significantly increase the risk of trachea/bronchus/lung cancers (TBL, p = 0.01) in this study. However, the other two types of heavy metal emissions (cadmium and chromium) did not significantly affect cancer incidences, which differed from previous research that showed them to be carcinogenic to human organs [7,8,9,19,57,67]. This inconsistency is mainly because we focused on the impacts of industrial wastewater emissions on human health, while domestic sewage and agricultural runoff have also contributed greatly to heavy metal water pollution levels, especially cadmium [2]. Although literature showed that arsenic (As) could seriously damage human skin, lung, and other organs [10,11,12], this research could not verify that conclusion, because the variability of arsenic emission was removed to avoid multicollinearity problems.
Second, rapid socioeconomic transitions and development have caused severe surface water pollution and produced negative impacts on human health in China. Industrialization, especially the overall industrial scale indicated by the annual gross industrial output (IND), significantly increased the risk of stomach (p = 0.002), colon (p = 0.002), rectum (p = 0.007), liver (p = 0.08), and brain and nervous cancers (p = 0.03). Another industrial factor reflecting the mining and quarrying industry (QM) was an influential factor in causing trachea/bronchus/lung cancer outbreak (TBL, p = 0.03). The transportation variable showed positive impacts on lowering TBL incidences (p = 0.08). Urbanization, represented by population density, was not significant to any cancer type. The other indicator, the annual gross agricultural output (AGR), has contributed to the low prevalence of stomach (p = 0.001), colon (p = 0.012), rectum (p = 0.022), and trachea/bronchus/lung (p = 0.018) cancers, which reflects that prefecture-level cities with a low level of urbanization tend to have less of those types of cancer patients. As a key indicator of economic growth, GDP per capita (ECO) was negatively related to incidences of stomach (p = 0.074), colon (p = 0.037), and rectum (p = 0.094) cancers. Urbanization (population density) had no association with all seven types of cancers.
Our results further reveal the complex and multifactorial mechanisms through which socioeconomic transitions influence human health in China, as discussed in previous studies [28,34,40,59,61]. Industrialization, urbanization, and globalization have occurred most rapidly in the eastern coastal region with strong policy support from the central government. Highly industrialized and urbanized city clusters have arisen and formed four of China’s economic pillars: Beijing–Tianjin–Bohai Bay, the Yangtze River Delta, the Pearl River Delta region, and the Northeast plain [61]. Surface water pollution caused by rapid socioeconomic transitions has been further deteriorated due to lack of strong environmental regulations [59]. As a result, high cancer incidence concentrations appeared around the four largest city clusters in the last decade. Furthermore, industrialization and urbanization are double-edged swords in terms of influencing water quality and human health [68]. The city clusters have generated a huge amount of chemical, biological, and physical hazards [34]; however, the overall urban sewage treatment rates reached 77.5% in 2010 due to the relatively strict environmental supervision systems compared to 10% in rural areas [59]. Similar to results from the control variable of this study (STR), prefecture-level cities with stricter treatment on industrial wastewater emissions showed better performance of reduced incidences of esophageal (p = 0.03) and stomach (p = 0.05) cancers. It was also noted that people living within wealthy and advanced areas usually benefit from better public infrastructures which improve their access to health care [68].
Third, interwoven with socioeconomic transitions, physical environmental conditions play a critical role in explaining spatial variations of cancer incidences as well, especially the relative locations of prefecture-level cities to major water bodies. Prefecture-level cities more accessible to a major river or lake (DIS), tended to have more patients of colon (p = 0.055), rectum (p = 0.074), TBL (p = 0.042), and BN (p = 0.087) cancers. This is consistent with previous research findings showing about 80% of cancer villages to be located within 5 km of a major river [59,69,70]. Increased stomach cancer incidences (p = 0.067) likely existed in downstream areas (HYD) as identified by kernel estimation (Figure 5 and Figure 8B) since heavy metals frequently cumulate at downstream locations due to runoff, generating higher carcinogenic risks [3]. These downstream river basins also serve as major rice, wheat, and maize producing areas [59]. The coincidence with the locations of dense cancer villages raises concerns of the issue that industrial wastewater emissions pollute not only water but also soil and food [20,71]. Another indicator of the physical environmental condition, green area coverage (GRE), generally was not significant in lowering cancer incidences as we expected. One explanation could be that the percentages of green area are extremely low in general regarding rapid urban expansion and deforestation in China.

4. Conclusions

This research contributes to the literature by investigating spatial-temporal variations of cancer incidences and industrial heavy metal wastewater emissions in mainland China, while exploring the impacts of industrial pollution on human health in conjunction with socioeconomic transitions and physical environmental conditions. The results revealed a significant increase of cancer incidences from 2004 to 2009 and detected large cancer patient clusters in the east and central regions, especially those major cities located downstream and at the basins of the Yellow, Yangtze, Pearl, and Huaihe Rivers. Coincidently, these areas are highly industrialized and urbanized with more advanced public facilities like sophisticated medical services and public transportation [6,48]. The pattern spatially matched the distributions of heavy metal emissions from wastewater as expected. The statistical analysis also demonstrated that both socioeconomic transitions and physical environmental conditions are crucial determinants of shaping China’s pollution and health maps. In particular, the double-edged effects of industrialization and urbanization reflected the multifactorial processes through which China’s development and transitions fundamentally influenced human health with the degradation of the natural environment [34,40,59,72,73].
This study also has policy implications through providing informative national scale knowledge on a worldwide issue. Pollution-caused cancer outbreaks in a rapidly developing country, such as China, may help policy makers better understand the complex interactions of socioeconomic development, physical environment, and human health. Because cancer concentrations mostly exist in well-urbanized and industrialized areas, the adjustment of policies are urgently needed to timely guide industrial transformation and economic restructuring to balance economic growth and physical environments in the interest of the people’s health and the country’s sustainable development. Additionally, special attention should be paid to heavily polluting traditional heavy industries and small scale TVEs and to supervise them to improve wastewater treatment rates. Cancer incubation periods could be very long. Because of the limitation of unavailable health and pollution data, this paper investigated the spatial temporal variations on cancer incidences between 2004 and 2009. A larger time span study may further our understanding on China’s public health and pollution issues. Furthermore, in China, both public health and environmental pollution are highly influenced by policies implemented by central and local governments. Policy should be also taken into consideration in future studies.

Acknowledgments

We would like to acknowledge the funding of the National Natural Science Foundation of China (41430637; 41329001).

Author Contributions

Yingru Li designed the analytical framework of this study, provided methodological advice, conducted statistical analysis, wrote most parts, and made major revisions to the manuscript. Huixuan collected and processed data, conducted GIS and statistical analysis, created all maps and tables, and wrote part of the manuscript; Zhongwei Liu conducted statistical analysis and revised the manuscript. Changhong Miao provided financial support, collected data, and coordinated the research team.

Conflicts of Interest

The authors declare no conflict of interest.

Abbreviations

The following abbreviations are used in this manuscript:
AsArsenic
CdCadmium
CrChromium
HgMercury
PbLead
IARCInternational Agency for Research on Cancer
USEPAU.S. Environmental Protection Agency
Igeogeo-accumulation index
TVEsTownship and Village Enterprises
MNCsmultinational corporations
TBLtrachea/bronchus/lung
IWWIindustrial wastewater index
INDindustrialization, the percentage of the annual industrial output out of the total GDP
MQmining and quarrying, the percentage of persons employed in mining and quarrying
TRAtransportation, road density
URBurbanization, population density
AGRagriculture, the percentage of the annual agricultural output from the total GDP
GLOGlobalization, foreign direct investment per capita
ECOeconomic development, GDP per capita
HYDhydrology properties
DISthe distance of a city to a major water body
GREgreen area coverage
STRthe sewage treatment rate
TPOPtotal population
VIFsvariance inflation factors
LPG factoriesLiquified Petroleum Gas factories

References

  1. Schwarzenbach, R.P.; Egli, T.; Hofstetter, T.B.; Von Gunten, U.; Wehrli, B. Global water pollution and human health. Annu. Rev. Environ. Resour. 2010, 35, 109–136. [Google Scholar] [CrossRef]
  2. Li, H.; Li, Y.; Lee, M.K.; Liu, Z.; Miao, C. Spatiotemporal analysis of heavy metal water pollution in transitional China. Sustainability 2015, 7, 9067–9087. [Google Scholar] [CrossRef]
  3. Wang, Y.; Wang, P.; Bai, Y.; Tian, Z.; Li, J.; Shao, X.; Mustavich, L.F.; Li, B.-L. Assessment of surface water quality via multivariate statistical techniques: A case study of the Songhua River Harbin region, China. J. Hydro-Environ. Res. 2013, 7, 30–40. [Google Scholar] [CrossRef]
  4. Liu, L. Made in China: Cancer villages. Environ. Sci. Policy Sust. Dev. 2010, 52, 8–21. [Google Scholar] [CrossRef]
  5. Sarkar, B. Heavy Metals in the Environment; CRC Press: Boca Raton, FL, USA, 2002. [Google Scholar]
  6. Hu, H.; Jin, Q.; Kavan, P. A study of heavy metal pollution in China: Current status, pollution-control policies and countermeasures. Sustainability 2014, 6, 5820–5838. [Google Scholar] [CrossRef]
  7. Duruibe, J.O.; Ogwuegbu, M.O.C.; Egwurugwu, J.N. Heavy metal pollution and human biotoxic effects. Int. J. Phys. Sci. 2007, 2, 112–118. [Google Scholar]
  8. Morais, S.; E-Costa, F.G.; De Lourdes Pereira, M. Heavy Metals and Human Health; InTech Open Access Publisher: Rijeka, Croatia, 2012. [Google Scholar]
  9. Liu, Y.; Chen, M.; Jiang, L.; Song, L. New insight into molecular interaction of heavy metal pollutant—Cadmium (II) with human serum albumin. Environ. Sci. Pollut. Res. 2014, 22, 6994–7005. [Google Scholar] [CrossRef] [PubMed]
  10. IARC Working Group on the Evaluation of Carcinogenic Risks to Humans; World Health Organization; International Agency for Research on Cancer. Some Drinking-Water Disinfectants and Contaminants, Including Arsenic; IARC: Lyon, France, 2004; Volume 84. [Google Scholar]
  11. Dauphiné, D.C.; Smith, A.H.; Yuan, Y.; Balmes, J.R.; Bates, M.N.; Steinmaus, C. Case-control study of arsenic in drinking water and lung cancer in California and Nevada. Int. J. Environ. Res. Public Health 2013, 10, 3310–3324. [Google Scholar] [CrossRef] [PubMed]
  12. Oberoi, S.; Barchowsky, A.; Wu, F. The global burden of disease for skin, lung, and bladder cancer caused by arsenic in food. Cancer Epidemiol. Biomark. Prev. 2014, 23, 1187–1194. [Google Scholar] [CrossRef] [PubMed]
  13. Meng, W.; Qin, Y.; Zheng, B.; Zhang, L. Heavy metal pollution in Tianjin Bohai bay, China. J. Environ. Sci. 2008, 20, 814–819. [Google Scholar] [CrossRef]
  14. Wang, M.M.; Webber, B.F.; Barnett, J. Rural industries and water pollution in China. Environ. Manag. 2008, 86, 648–659. [Google Scholar] [CrossRef] [PubMed]
  15. Zhai, L.; Liao, X.; Chen, T.; Yan, X.; Xie, H.; Wu, B.; Wang, L. Regional assessment of cadmium pollution in agricultural lands and the potential health risk related to intensive mining activities: A case study in Chenzhou City, China. J. Environ. Sci. 2008, 20, 696–703. [Google Scholar] [CrossRef]
  16. Liu, J.; Zhang, X.-H.; Tran, H.; Wang, D.-Q.; Zhu, Y.-N. Heavy metal contamination and risk assessment in water, paddy soil, and rice around an electroplating plant. Environ. Sci. Pollut. Res. 2011, 18, 1623–1632. [Google Scholar] [CrossRef] [PubMed]
  17. Zhou, Y.; Fu, S.; Zhang, C.; Chen, B.; Yang, X. Geochemical environmental effects of metallic sulfide deposits and its mining and origin of cancer village in Dabaoshan from northern Guangdong (China). Environ. Monit. Assess. 2008, 184, 2261–2273. [Google Scholar]
  18. Zhou, Y.; Fu, S.; Zhang, C.; Chen, B.; Yang, Z.; Yang, X. Geochemical migration model of heavy metal elements in eco-environmental system of sulfide-bearing metal mines in South China; specific discussion on Dabashan Fe-Cu-polymetallic mine, Guandong. Earth Sci. Front. 2008, 15, 248–255. [Google Scholar]
  19. Kerger, B.D.; Butler, W.J.; Paustenbach, D.J.; Zhang, J.; Li, S. Cancer mortality in Chinese populations surrounding an alloy plant with chromium smelting operations. J. Toxicol. Environ. Health Sci. Part A 2009, 72, 329–344. [Google Scholar] [CrossRef] [PubMed]
  20. Bale, R. China’s Other Pollution Problem-Its Soil. The Center for Investigative Reporting. 2014. Available online: http://www.environmentmagazine.org/Archives/Back%20Issues/March-April%202010/made-in-china-full.html (accessed on 25 October 2014).
  21. Tan, D. Heavy Metals & Agriculture. China Water Risk Review. 2014. Available online: http://chinawaterrisk.org/resources/analysis-reviews/heavy-metals-agriculture/ (accessed on 30 July 2015).
  22. Liu, J.; Diamond, J. China’s environment in a globalizing world. Nature 2005, 435, 1179–1186. [Google Scholar] [CrossRef] [PubMed]
  23. Hu, Y.; Cheng, H. Water pollution during China’s industrial transition. Environ. Dev. 2013, 8, 57–73. [Google Scholar] [CrossRef]
  24. Li, Z.; Ma, Z.; van der Kuijp, T.J.; Yuan, Z.; Huang, L. A review of soil heavy metal pollution from mines in China: Pollution and health risk assessment. Sci. Total Environ. 2014, 468, 843–853. [Google Scholar] [CrossRef] [PubMed]
  25. Chen, H.; Lu, X.; Chang, Y.; Xue, W. Heavy metal contamination in dust from kindergartens and elementary schools in Xi’an, China. Environ. Earth Sci. 2014, 71, 2701–2709. [Google Scholar] [CrossRef]
  26. Jiang, D.; Hu, Z.; Liu, F.; Zhang, R.; Duo, B.; Fu, J.; Cui, Y.; Li, M. Heavy metals levels in fish from aquaculture farms and risk assessment in Lhasa, Tibetan Autonomous Region of China. Ecotoxicology 2014, 23, 577–583. [Google Scholar] [CrossRef] [PubMed]
  27. World Bank. Water Quality Management Policy and Institutional Considerations; World Bank: Washington, DC, USA, 2006. [Google Scholar]
  28. Ebenstein, A. The consequences of industrialization: Evidence from water pollution and digestive cancers in China. Rev. Econ. Stat. 2012, 94, 186–201. [Google Scholar] [CrossRef]
  29. Ministry of Water Resources of China (MWR). China Water Resources Bulletin; China Ministry of Water Resources: Beijing, China, 2012.
  30. Geng, Y.; Wang, M.; Sarkis, J.; Xue, B.; Zhang, L.; Fujita, T.; Yu, X.; Ren, W.; Zhang, L.; Dong, H. Spatial-temporal patterns and driving factors for industrial wastewater emission in China. J. Clean. Prod. 2014, 76, 116–124. [Google Scholar] [CrossRef]
  31. Carr, R.; Zhang, C.; Moles, N.; Harder, M. Identification and mapping of heavy metal pollution in soils of a sports ground in Galway City, Ireland, using a portable XRF analyser and GIS. Environ. Geochem. Health 2008, 30, 45–52. [Google Scholar] [CrossRef] [PubMed]
  32. Kendy, E.; Zhang, Y.; Liu, C.; Wang, J.; Steenhuis, T. Groundwater recharge from irrigated cropland in the North China Plain: Case study of Luancheng County, Hebei Province, 1949–2000. Hydrol. Process. 2004, 18, 2289–2302. [Google Scholar] [CrossRef]
  33. Ministry of Environmental Protection (MEP). The State of the Environment of China in 2008. Available online: http://english.mep.gov.cn/News_service/news_release/200906/t20090618_152932.htm (accessed on 10 January 2016).
  34. Gong, P.; Liang, S.; Carlton, E.J.; Jiang, Q.; Wu, J.; Wang, L.; Remais, J.V. Urbanization and health in China. Lancet 2012, 379, 843–852. [Google Scholar] [CrossRef]
  35. Yearbook, C.S. China Statistical Yearbook; China Statistics Press: Beijing, China, 2015. [Google Scholar]
  36. Wei, Y.D. Beyond new regionalism, beyond global production networks: Remaking the Sunan model, China. Environ. Plan. C Gov. Policy 2010, 28, 72–96. [Google Scholar] [CrossRef]
  37. Yang, Q.L.; Li, W.D. Current issues on occupational health and control strategies. China Occup. Med. 2004, 31, 58–59. (In Chinese) [Google Scholar]
  38. Yang, T.; Liu, J. Health Risk Assessment and Spatial Distribution Characteristic on Heavy Metals Pollution of Haihe River Basin. J. Environ. Anal Toxicol. 2012. [Google Scholar] [CrossRef]
  39. Walter, I. Environmentally induced industrial relocation to developing countries. Environ. Trad. 1982, 2, 235–256. [Google Scholar]
  40. He, C.; Huang, Z.; Ye, X. Spatial heterogeneity of economic development and industrial pollution in urban China. Stoch. Environ. Res. Risk Assess. 2014, 28, 767–781. [Google Scholar] [CrossRef]
  41. Drezner, D. Bottom Feeders. Foreign Policy 2000, 122, 64–73. [Google Scholar] [CrossRef]
  42. Christmann, P.; Taylor, G. Globalization and the environment: Determinants of firm self-regulation in China. J. Int. Bus. Stud. 2001, 32, 439–458. [Google Scholar] [CrossRef]
  43. Liu, Z.; Li, Y.; Li, Z. Surface water quality and land use in Wisconsin, USA–a GIS approach. J. Integr. Environ. Sci. 2009, 6, 69–89. [Google Scholar] [CrossRef]
  44. Peplow, D. Environmental Impacts of Mining in Eastern Washington; University of Washington Water Center: Seattle, WA, USA, 1999. [Google Scholar]
  45. Garbarino, J.R.; Hayes, H.; Roth, D.; Antweider, R.; Brinton, T.I.; Taylor, H. Contaminants in the Mississippi River. Available online: http://pubs.usgs.gov/circ/circ1133/heavy-metals.html (accessed on 30 April 2016).
  46. Wang, S.; Xu, X.; Sun, Y.; Liu, J.; Li, H. Heavy metal pollution in coastal areas of South China: A review. Mar. Pollut. Bull. 2013, 76, 7–15. [Google Scholar] [CrossRef] [PubMed]
  47. Li, Y.; Wei, D.Y. The spatial-temporal hierarchy of regional inequality of China. Appl. Geogr. 2010, 30, 303–316. [Google Scholar] [CrossRef]
  48. Li, Y.; Wei, Y.D. Multidimensional inequalities in health care distribution in provincial China: A case study of Henan Province. Tijdschr. Voor Econ. Soc. Geogr. 2014, 105, 91–106. [Google Scholar] [CrossRef]
  49. China Data Center. Available online: http://chinadatacenter.org/ (accessed on 5 December 2015).
  50. IPE. Institution of Public & Environmental Affairs. Available online: http://www.ipe.org.cn/pollution/status.aspx (accessed on 27 January 2016).
  51. Li, X.; Cheng, G.; Lu, L. Spatial analysis of air temperature in the Qinghai-Tibet Plateau. Arct. Antarct. Alp. Res. 2005, 37, 246–252. [Google Scholar] [CrossRef]
  52. Yang, J.S.; Wang, Y.Q.; August, P.V. Estimation of land surface temperature using spatial interpolation and satellite-derived surface emissivity. J. Environ. Inform. 2004, 4, 37–44. [Google Scholar] [CrossRef]
  53. Simasuwannarong, B.; Satapanajaru, T.; Khuntong, S.; Pengthamkeerati, P. Spatial distribution and risk assessment of As, Cd, Cu, Pb, and Zn in topsoil at Rayong Province, Thailand. Water Air Soil Pollut. 2012, 223, 1931–1943. [Google Scholar] [CrossRef]
  54. Wu, T.; Li, Y. Spatial interpolation of temperature in the United States using residual kriging. Appl. Geogr. 2013, 44, 112–120. [Google Scholar] [CrossRef]
  55. Gramatica, P. Principles of QSAR models validation: Internal and external. QSAR Comb. Sci. 2007, 26, 694–701. [Google Scholar] [CrossRef]
  56. Agunwamba, J.C. Analysis of socioeconomic and environmental impacts of waste stabilization pond and unrestricted wastewater irrigation: Interface with maintenance. Environ. Manag. 2001, 27, 463–476. [Google Scholar] [CrossRef] [PubMed]
  57. Beaumont, J.J.; Sedman, R.M.; Reynolds, S.D.; Sherman, C.D.; Li, L.H.; Howd, R.A.; Sandy, M.S.; Zeise, L.; Alexeeff, G.V. Cancer mortality in a Chinese population exposed to hexavalent chromium in drinking water. Epidemiology 2008, 19, 12–23. [Google Scholar] [CrossRef] [PubMed]
  58. Watts, J. China’s environmental health challenges. Lancet 2008, 372, 1451–1452. [Google Scholar] [CrossRef]
  59. Lu, Y.; Song, S.; Wang, R.; Liu, Z.; Meng, J.; Sweetman, A.J.; Jenkins, A.; Ferrier, R.C.; Li, H.; Luo, W.; et al. Impacts of soil and water pollution on food safety and health risks in China. Environ. Int. 2015, 77, 5–15. [Google Scholar] [CrossRef] [PubMed]
  60. Gleick, P.H. China and water. In The World’s Water 2008–2009: The Biennial Report on Freshwater Resources; Island Press: Washington, DC, USA, 2009; pp. 79–100. [Google Scholar]
  61. Shao, M.; Tang, X.; Zhang, Y.; Li, W. City clusters in China: Air and surface water pollution. Front. Ecol. Environ. 2006, 4, 353–361. [Google Scholar] [CrossRef]
  62. Chatterjee, S.; Hadi, A.S. Regression Analysis by Example; John Wiley & Sons: New York, NY, USA, 2013. [Google Scholar]
  63. Wen, M.; Browning, C.R.; Cagney, K.A. Poverty, affluence, and income inequality: neighborhood economic structure and its implications for health. Soc. Sci. Med. 2003, 57, 843–860. [Google Scholar] [CrossRef]
  64. Jarup, L. Hazards of heavy metal contamination. Br. Med. Bull. 2003, 68, 167–182. [Google Scholar] [CrossRef]
  65. Risher, J.R.; De Woskin, R. Toxicological Profile for Mercury (Update); US Deptartment Health & Human Services: Washington, DC, USA, 1999; p. 619.
  66. Ye, W.T. Behind the deadly GDP: Investigating Jiangsu Yancheng cancer village and industrial chemical pollution. Village Townsh. Forum. 2006, 40–41. (In Chinese) [Google Scholar]
  67. Li, Y.; Liu, J.; Cao, Z.; Lin, C.; Yang, Z. Spatial distribution and health risk of heavy metals and polycyclic aromatic hydrocarbons (PAHs) in the water of the Luanhe River Basin, China. Environ. Monit. Assess. 2010, 163, 1–13. [Google Scholar] [CrossRef] [PubMed]
  68. Li, Y.; Wei, D.Y. A spatial-temporal analysis of health care and mortality inequalities in China. Eurasian Geogr. Econ. 2010, 51, 767–787. [Google Scholar] [CrossRef]
  69. Gong, G.; Zhang, T. Temporal–spatial distribution changes of cancer village in China. China Popul. Resour. Environ. 2013, 23, 156–164. (In Chinese) [Google Scholar]
  70. Zhang, X.; Zhuang, D.; Ma, X.; Jiang, D. Esophageal cancer spatial and correlation analyses: Water pollution, mortality rates, and safe buffer distances in China. J. Geogr. Sci. 2014, 24, 46–58. [Google Scholar] [CrossRef]
  71. Feng, J.; Zhao, J. Spatial distribution and controlling factors of heavy metals contents in paddy soil and crop grains of rice–wheat cropping system along highway in East China. Environ. Geochem. Health 2012, 34, 605–614. [Google Scholar] [CrossRef] [PubMed]
  72. Wang, W.C.; Xu, D.M.; Chau, K.W.; Lei, G.J. Assessment of river water quality based on theory of variable fuzzy sets and fuzzy binary comparison method. Water Resour. Manag. 2014, 28, 4183–4200. [Google Scholar] [CrossRef]
  73. Zhao, M.Y.; Cheng, C.T.; Chau, K.W.; Li, G. Multiple criteria data envelopment analysis for full ranking units associated to environment impact assessment. Int. J. Environ. Pollut. 2006, 28, 448–464. [Google Scholar] [CrossRef]
Figure 1. Analytical framework.
Sustainability 08 00480 g001
Figure 2. Study area.
Sustainability 08 00480 g002
Figure 3. Brain and nervous system cancer. (A) Number of patients per 10,000 people in 2009; (B) Kernel estimation of patients in 2009; (C) Spatial variations of cancer patients from 2004 to 2009.
Sustainability 08 00480 g003
Figure 4. Colon cancer. (A) Number of patients per 10,000 people in 2009; (B) Kernel estimation of patients in 2009; (C) Spatial variations of cancer patients from 2004 to 2009.
Sustainability 08 00480 g004aSustainability 08 00480 g004b
Figure 5. Esophagus cancer. (A) Number of patients per 10,000 people in 2009; (B) Kernel estimation of patients in 2009; (C) Spatial variations of cancer patients from 2004 to 2009.
Sustainability 08 00480 g005
Figure 6. Liver cancer. (A) Number of patients per 10,000 people in 2009; (B) Kernel estimation of patients in 2009; (C) Spatial variations of cancer patients from 2004 to 2009.
Sustainability 08 00480 g006
Figure 7. Rectal cancer. (A) Number of patients per 10,000 people in 2009; (B) Kernel estimation of patients in 2009; (C) Spatial variations of cancer patients from 2004 to 2009.
Sustainability 08 00480 g007aSustainability 08 00480 g007b
Figure 8. Stomach cancer. (A) Number of patients per 10,000 people in 2009; (B) Kernel estimation of patients in 2009; (C) Spatial variations of cancer patients from 2004 to 2009.
Sustainability 08 00480 g008
Figure 9. Trachea/Bronchus/Lung cancer. (A) Number of patients per 10,000 people in 2009; (B) Kernel estimation of patients in 2009; (C) Spatial variations of cancer patients from 2004 to 2009.
Sustainability 08 00480 g009
Table 1. Dependent and independent variables.
ClassesVariablesIndicators
Dependent variableCancer diseasesNumber of registered cancer patients
Independent variablesSocioeconomic transitionsIndustrializationIndustrialization: Industrial output (IND); % of population employed in mining and quarrying (MQ), highway/railway density (TRA)
UrbanizationPopulation density (URB)
Agricultural output (AGR)
GlobalizationForeign direct investment (GLO)
Economic developmentGDP per capita (ECO)
Physical conditionsGreen landPercentage of green area (GRE)
HydrologyUpper, middle, and lower reaches (HYD)
DistanceDistance to a major water body (DIS)
Heavy metalsUntreated discharged As, Cr, Hg, Cd, and Pb (HM)
Sewage treatment rate% of discharged treated polluted water (STR)
Total populationTotal population (TPOP)
Note: Chemical element symbols: Arsenic—As, Chromium—Cr, Mercury—Hg, Cadmium—Cd, Lead—Pb.
Table 2. Results of multiple regression models.
Independent VariablesCoefficients (Esophagus)Coefficients (Stomach)Coefficients (Colon)Coefficients (Rectum)Coefficients (Liver)Coefficients (TBL)Coefficients (BN)
Control VariablesIntercept619.62 *1107.07 ***367.00 *301.74 *683.71 **0.651006.42
Sewage Treatment Rate (STR)−5.81 **−4.40 **0.44−0.04−0.180.010.35
Heavy MetalsPb−251.61−489.96−101.21−135.77−254.422.24 **−450.86
Cr9.45−10.4799.0240.82160.080.09143.90
Hg12,576.3516,673.68 **−3517.433029.3511,190.96 *−2.6712,385.53
Cd488.89718.44−346.31−120.41−309.57−6.93 ***−626.10
Socioeconomic TransitionsUrbanization (URB)0.25−0.090.070.050.040.0010.07
Agricultural (AGR)−1.37−3.55 ***−1.88 **−1.37 **−1.60−0.01 **−3.77
Industrialization (IND)−0.020.51 ***0.37 ***0.24 ***0.25*0.000.76 **
Transportation (TRA)−88.58−109.23−136.38−176.97 *−213.02−0.92 *−667.05
Employment (MQ)−700.45−796.11−376.65−409.56−918.276.25 **−1787.92
Economic Development (ECO)−0.002−0.013 *−0.01 **−0.01 *−0.010.00−0.21
Physical ConditionsDistance (DIS)−189.63−107.54320.22 *239.31*252.471.38 **917.92 *
Hydrology (HYD)324.80 **229.16 *−98.05−12.9153.080.56−75.63
Green Coverage Rate (GRE)7.879.97*3.973.953.540.0115.96
Significance F0.1290.001 ***0.000 ***0.001 ***0.008 ***0.01 ***0.012 **
R-square0.550.770.840.760.700.690.68
Note: * p-value is significant at 10% significance level; ** p-value is significant at 5% significance level; *** p-value is significant at 1% significance level.

