Article

Wetland Transitions and Protection under Rapid Urban Expansion: A Case Study of Pearl River Estuary, China

Key Laboratory of Mountain Surface Processes and Ecological Regulation, Institute of Mountain Hazards and Environment, Chinese Academy of Sciences, Chengdu 610041, Sichuan, China
*
Author to whom correspondence should be addressed.
Sustainability 2016, 8(5), 471; https://doi.org/10.3390/su8050471
Submission received: 26 February 2016 / Revised: 5 May 2016 / Accepted: 5 May 2016 / Published: 12 May 2016

Abstract

:
Understanding wetland changes under urbanization is important for wetland management. In this study, net transition intensity (NTI) and total transition intensity (TTI) are presented to characterize wetland transitions based on spatial data obtained from Landsat satellite images of Pearl River estuary in South China. NTI is commonly used to represent changes in absolute amounts for each class of wetland, while TTI reflects the internal transition activities and amounts. The third index, the urbanization intensity index (UII), is used to investigate the intensity and velocity of urban land expansion at the same time periods. The results show that one-third of the total wetland area was lost from 1979 to 2009 in the study area and seven types of estuarine wetlands were degraded. The basic pattern of wetland transition is from natural wetlands to constructed wetlands and then to urban lands. Intertidal mud and sand and paddy fields were the major natural and constructed wetlands, respectively, transferred to urban lands. The TTI value was generally greater than the NTI value for these wetlands. TTI >> NTI is an important indicator for wetland transitions under rapid urban expansion in the Pearl River estuary. Based on the integration of the two indices (NTI and TTI), a protection and management plan framework for the Pearl River estuary wetlands is proposed. This plan emphasizes the key and important zones and their different features, and includes actions that can be implemented in and around natural and constructed wetlands.

1. Introduction

Global urbanization significantly affects estuary wetlands by altering, destroying or fragmenting natural habitats, which alters hydrological and geomorphological processes and degrades wetland functions [1,2,3,4]. Generally, the location, size, and shape of wetlands significantly influence ecosystem functions. An increase in wetland area enhances ecosystem functions such as flood control, pollution filtration, carbon entrapment, and fishing, and provides migratory pathways for native species by improving hydrological and biological connectivity, which determines the total habitable area [5]. However, a decrease in wetland area reduces the available habitat for native fauna and flora [6] and ecosystem functions [7]. During the past few decades, a significant area of estuarine wetlands has disappeared in some large river deltas due to rapid urbanization [8]. The remaining wetlands are suffering from population pressure, water shortage, and pollution, as well as biological invasions, and are becoming increasingly vulnerable [9,10,11].
The changes to estuarine wetlands include not only direct occupation and loss, but also construction or increase of new wetlands. Those wetlands occupied or lost are completely replaced by agricultural use, aquaculture lands, infrastructure, and tidal control structures; the remaining wetlands are bounded by development to varying extents [12,13,14]. These conditions reduce the hydrological and biological connectivity among wetlands, such that the wetlands lose their resilience when facing different stressors [15]. Newly built wetlands, such as salt fields, shrimp ponds, reservoirs, and restored sites, can partially offset the negative effects arising from the decrease in wetland area.
Different methods, such as rate of change of total wetland area [16,17,18], transition matrices for the process of wetland loss [9,19,20], and landscape pattern indices for wetland development [21,22,23], have been used to measure and evaluate wetland changes with absolute amounts by comparing their state at two time points. However, because the differences between newly increased wetlands and well-preserved ones, as well as between the same wetland types, are significant in structure and function due to their development period and location [13], understanding the internal transitions together with analyses of wetland changes plays an important role in conservation and restoration of wetlands [24]. Nevertheless, fewer indices have been studied to understand wetland interchange processes that occur at various stages, especially in the urban expansion area, during wetlands transferring to other land uses or vice versa.
The main objectives of this study were: (1) to develop a method to detect the characteristics of wetland transitions under rapid urban expansion in the Pearl River estuary; and (2) to quantify the spatial relationship between wetlands and urban lands for future restoration and conservation of estuarine wetlands.

2. Materials and Methods
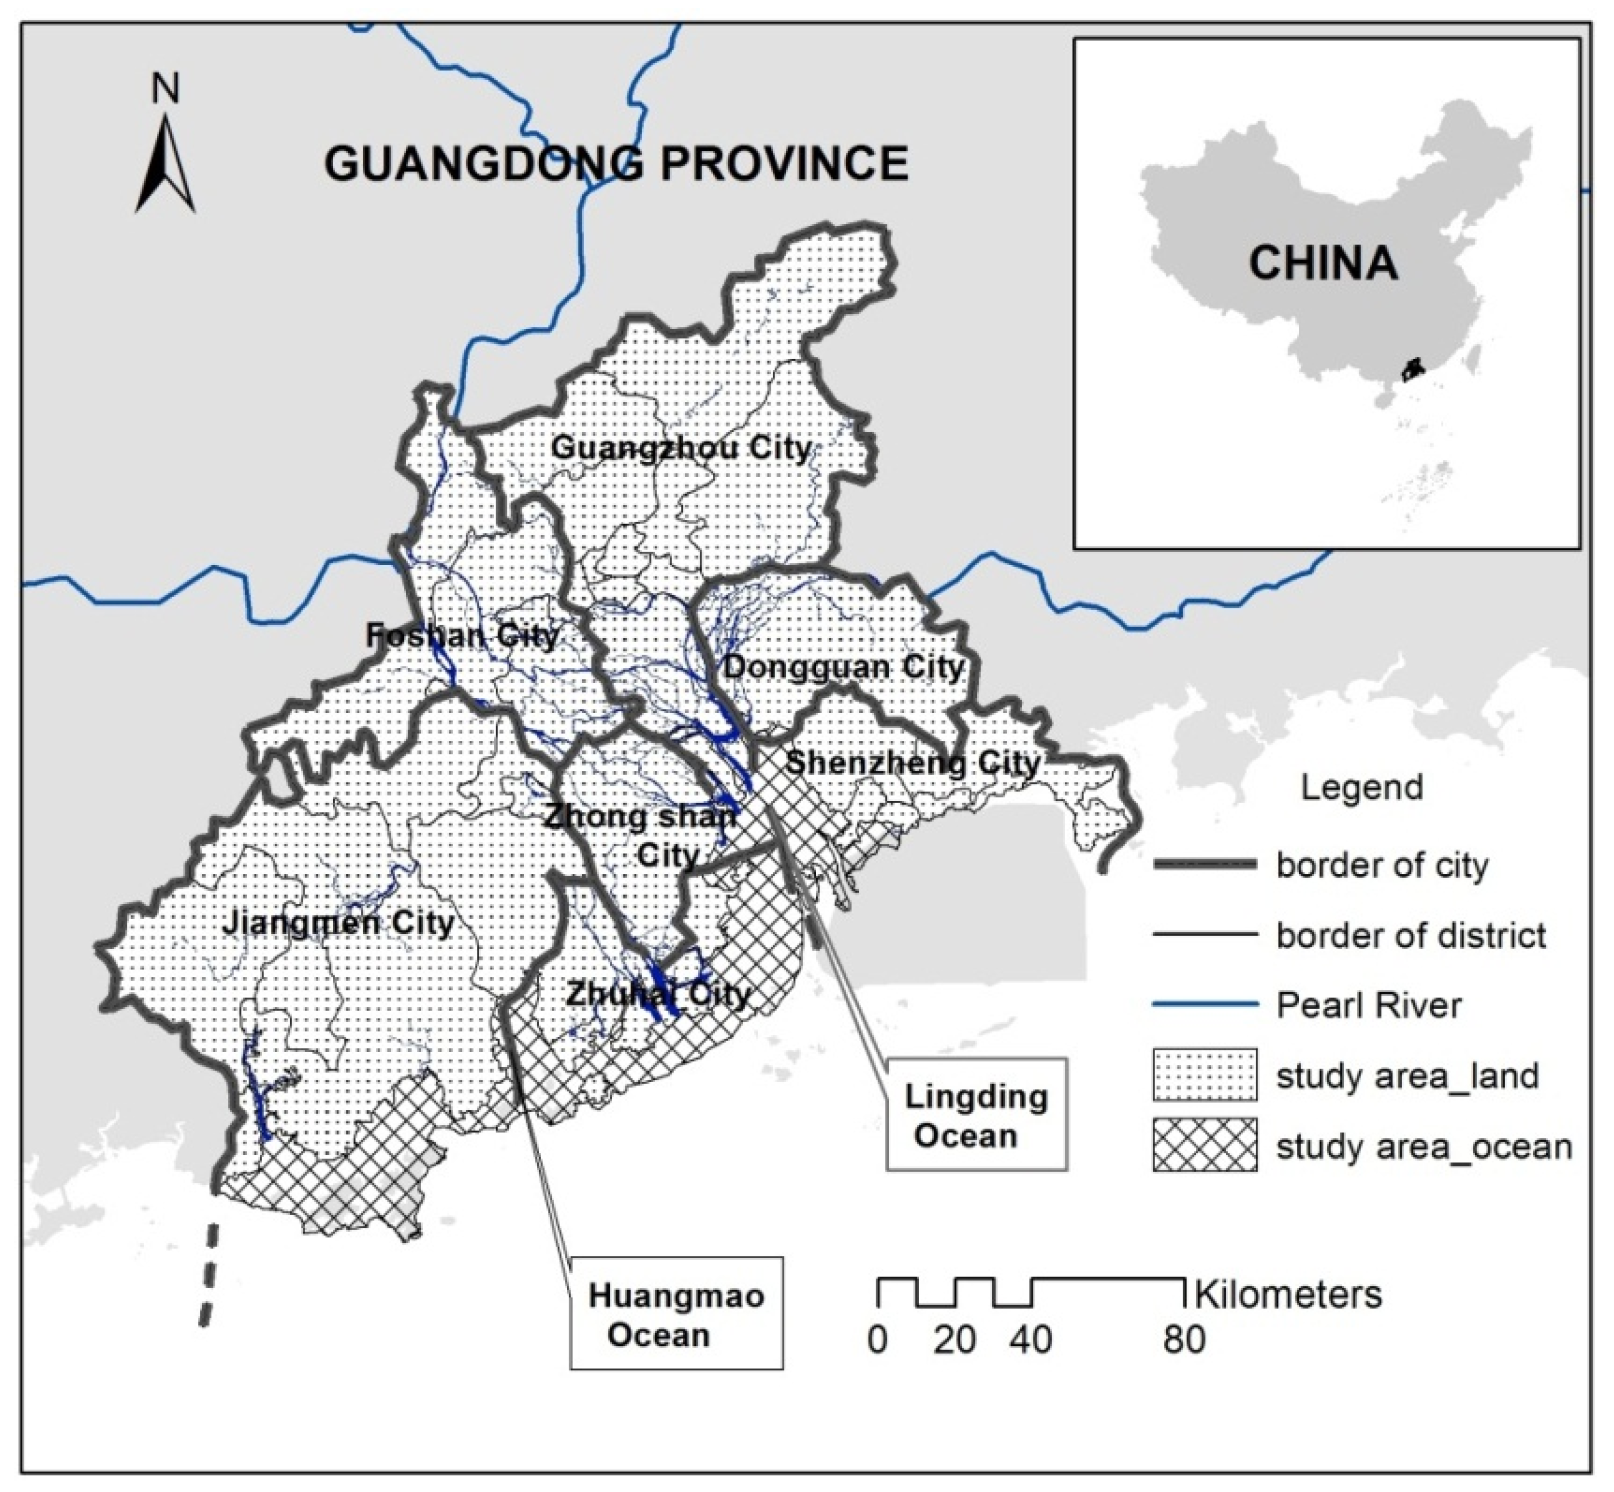
2.1. Study Area

The Pearl River estuary (21°34′ N to 23°56′ N, 111°58′ E to 114°38′ E) with an area of 31,831 km2 (Figure 1) is located on the southern coast of China. The Pearl River enters into the southern China Sea through the estuary by means of eight river branches, which results in different types of large wetlands. The climate of this region is warm and moist with a mean annual temperature of 22.1 °C. The weather is dominated by the northeast monsoon and the mean rainfall is low (30–40 mm month−1) from October to April. From May to September, the southwest monsoon brings up large amounts of rainfall (300–400 mm month−1) from lower latitudes [16,25]. Over the past three decades, the Pearl River estuary wetlands have suffered from rapid industrialization and urbanization. Seven major large cities, including 35 districts, have been formed [26,27].

2.2. Data Sources

In this study, wetland information was extracted from the satellite data of three Landsat instruments (Multispectral Scanner [MSS], Thematic Mapper [TM], and Enhanced Thematic Mapper plus [ETM+]). Forty-nine scenes of Landsat satellite data were obtained from the Center for Earth Observation and Digital Earth, Chinese Academy of Science and the Global Land Cover Facility at the University of Maryland [28]. Autumn and winter images, with less cloud and rain, were chosen to better differentiate the spectral information. The characteristics of the image data are presented in Table 1. A contour of −6 m obtained from Chinese digital elevation model (1985) was used to mark off the wetland class of shallow marine water (NW1) based on the Ramsar Convention.
The other used data mainly include: (1) topographic maps (1/100,000 scaled); (2) detailed vegetation maps (2005, Forestry and Water Affairs Minister in Guangzhou); (3) ground data (land survey and fieldwork); and (4) socioeconomic data (statistical year books).

2.3. Data Processing

2.3.1. Satellite Images Pre-Processing

All satellite images were geometrically corrected based on topographic map by linear polynomial method with 8 control points [29]. The total root mean square (RMS) error for this study was 4.5 m approximately, which is less than half the size of the pixel (15 m) [30,31]. The images were georeferenced using the Universal Transverse Mercator projection (UTM-49N, WGS-84) and resampled to 30 m spatial resolution [32]. The processing of remote-sensing satellite was carried out using the software package of Erdas Image V9.3 [33].
Related literature and image data were gained for the sake of better knowledge of the study region. Meanwhile, a fieldwork was developed with interviews, questionnaire and photography [32,34]. From August to October in 2009, field transects were carried out in order to verify the classification results of classification, and the hand-held GPS was used to record all the locations of interesting points and field transects.

2.3.2. Classification of Satellite Images

The classification criteria for the main types of wetlands and other land uses in the Pearl River estuary according to the Ramsar Convention on wetland classification are shown in Table 2. A multi-step classification procedure using the masked images was employed to characterize the different wetlands. At the beginning, the coastline was directly digitized from the satellite data, and NW1 wetlands were determined using digitized coastline and the −6 m contour. A supervised maximum likelihood classification was then performed [32,33].
After classification, the overall accuracy and a Kappa analysis could be used to perform a classification accuracy assessment based on an error matrix analysis [35]. Independently classified images were compared with each other to determine the changes of landuse types. Accuracy levels of more than 80% were considered enough for reliable classification of landuse [32,36]. In this study, the Kappa parameter was computed as an accuracy assessment for the different years, and were given as 0.85 (1979), 0.84 (1986), 0.85 (1990), 0.89 (1995), 0.85 (2000), 0.89 (2005), and 0.85 (2009).

2.3.3. Monitoring Indices of Wetland Transition and Urban Expansion

Detection and monitoring of wetland transitions included the use of multi-date images to evaluate the differences in wetland patterns [17,20]. Overlay analysis was implemented for continuous years to examine the inherent dynamics of wetlands during different periods. Two images on different dates were labeled and classified independently. Then, the transferred areas were extracted by the comparison of classification results. To understand the dynamics of estuarine wetland transitions, the mutual transfer extent among land uses was obtained from the overlay analysis and transition matrices using the spatial analysis module in ArcGIS 10.0.
Two indices, NTIi,t→t+n (Net Transition Intensity) and TTIi,t→t+n (Total Transition Intensity), were developed to evaluate wetland transitions. NTIi,t→t+n is the index of net transition intensity of wetlands during the time span t, t + n; TTIi,t→t+n is the total transition intensity of wetlands in the transfer process during the time span t, t + n. They are defined as:
N T I i , t t + n = ( i N w a in _ i , t t + n i N w a o u t _ i , t t + n ) n × W A i , t × 100 %
T T I i , t t + n = ( i N w a in _ i , t t + n + i N w a o u t _ i , t t + n ) n × W A i , t × 100 %
where wain_i,t is the wetland area of the ith wetland class transferred from other land use during the time span t, t + n; and waout_i,t→t+n is the area of other land use that is transferred from the ith wetland class during the time span t, t + n. WAi,t+n and WAi,t are the area of wetlands in the year t + n and t, respectively. N is the total number of wetland classes. Generally speaking, TTI can reflect the internal transition activities and total transition amounts for wetlands, but NTI is just used to represent changes in absolute amounts.
To examine the spatial relationship between wetland transitions and urban expansion in the Pearl River estuary, the urbanization intensity index (UII) [37] was used to characterize the intensity and velocity of urban land expansion at different time periods, which is given as:
U I I i , t t + n = ( U L A i , t + n U L A i , t ) n T L A i × 100 %
where UIIi,t→t+n is the index of urban expansion intensity for spatial unit i in the period of t; t + n, ULAi,t+n and ULAi,t are the urban land use area in the year t + n and t, respectively; and TLAi is the total area of spatial unit i.

3. Results

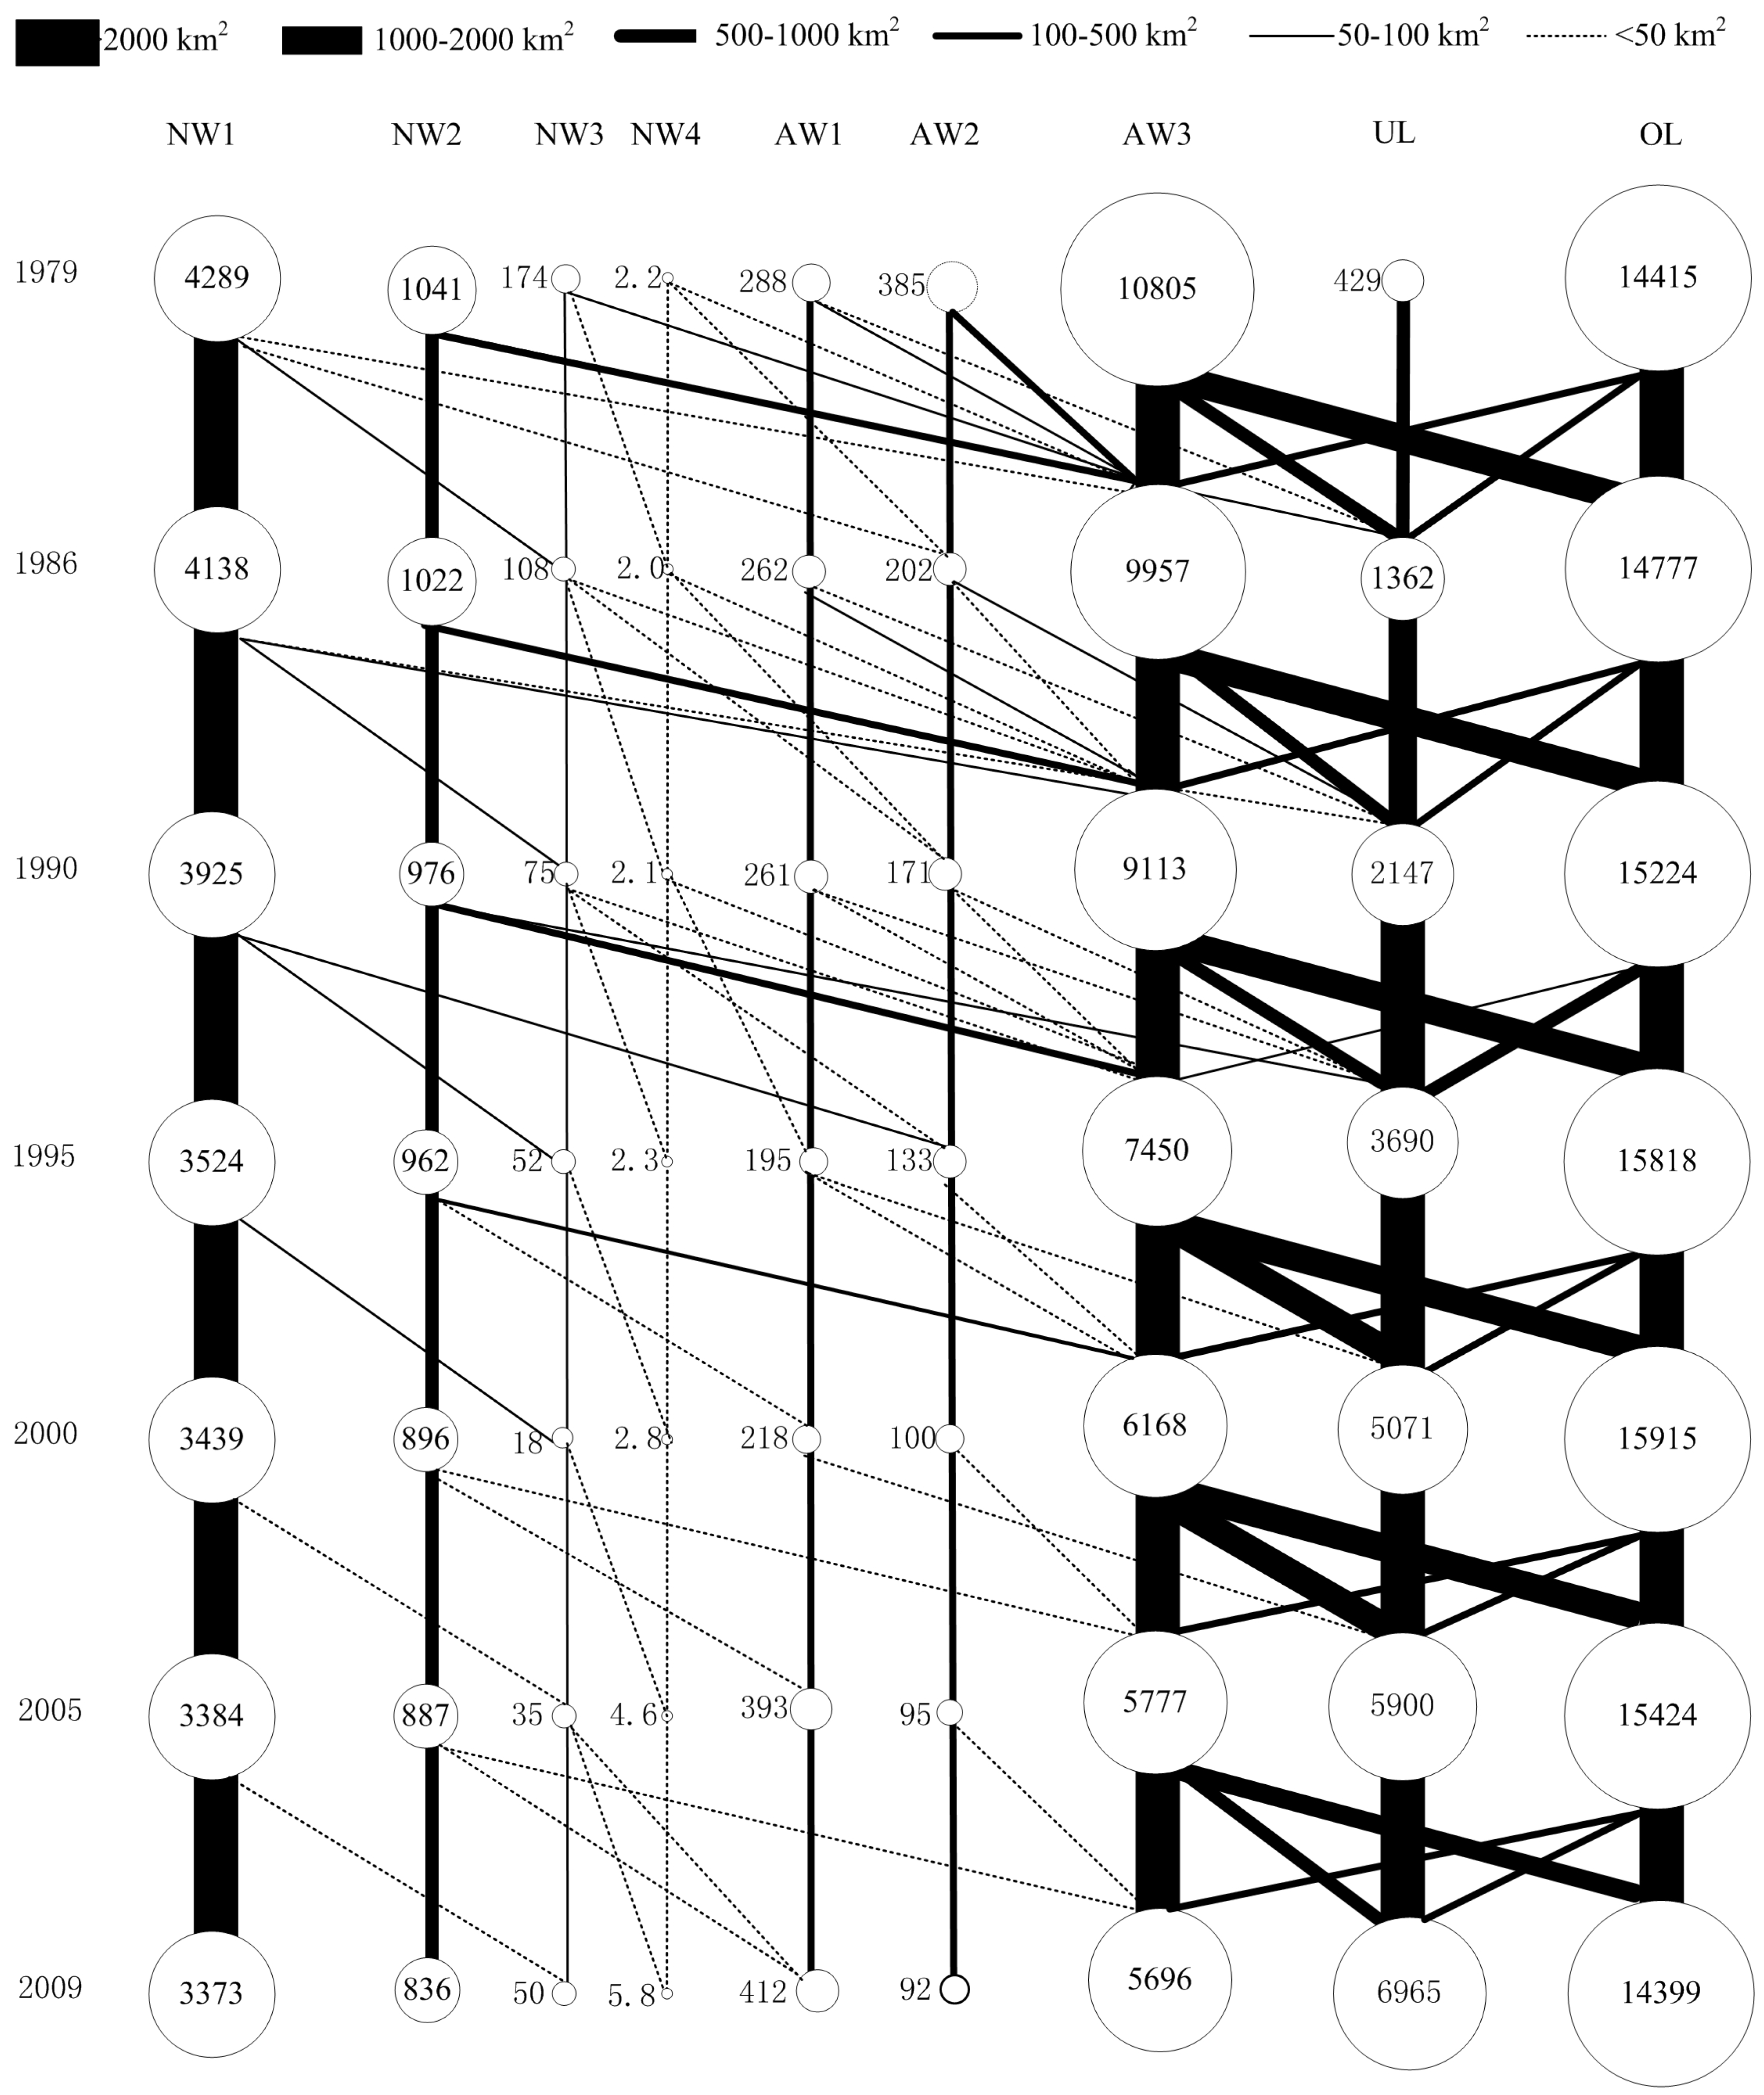
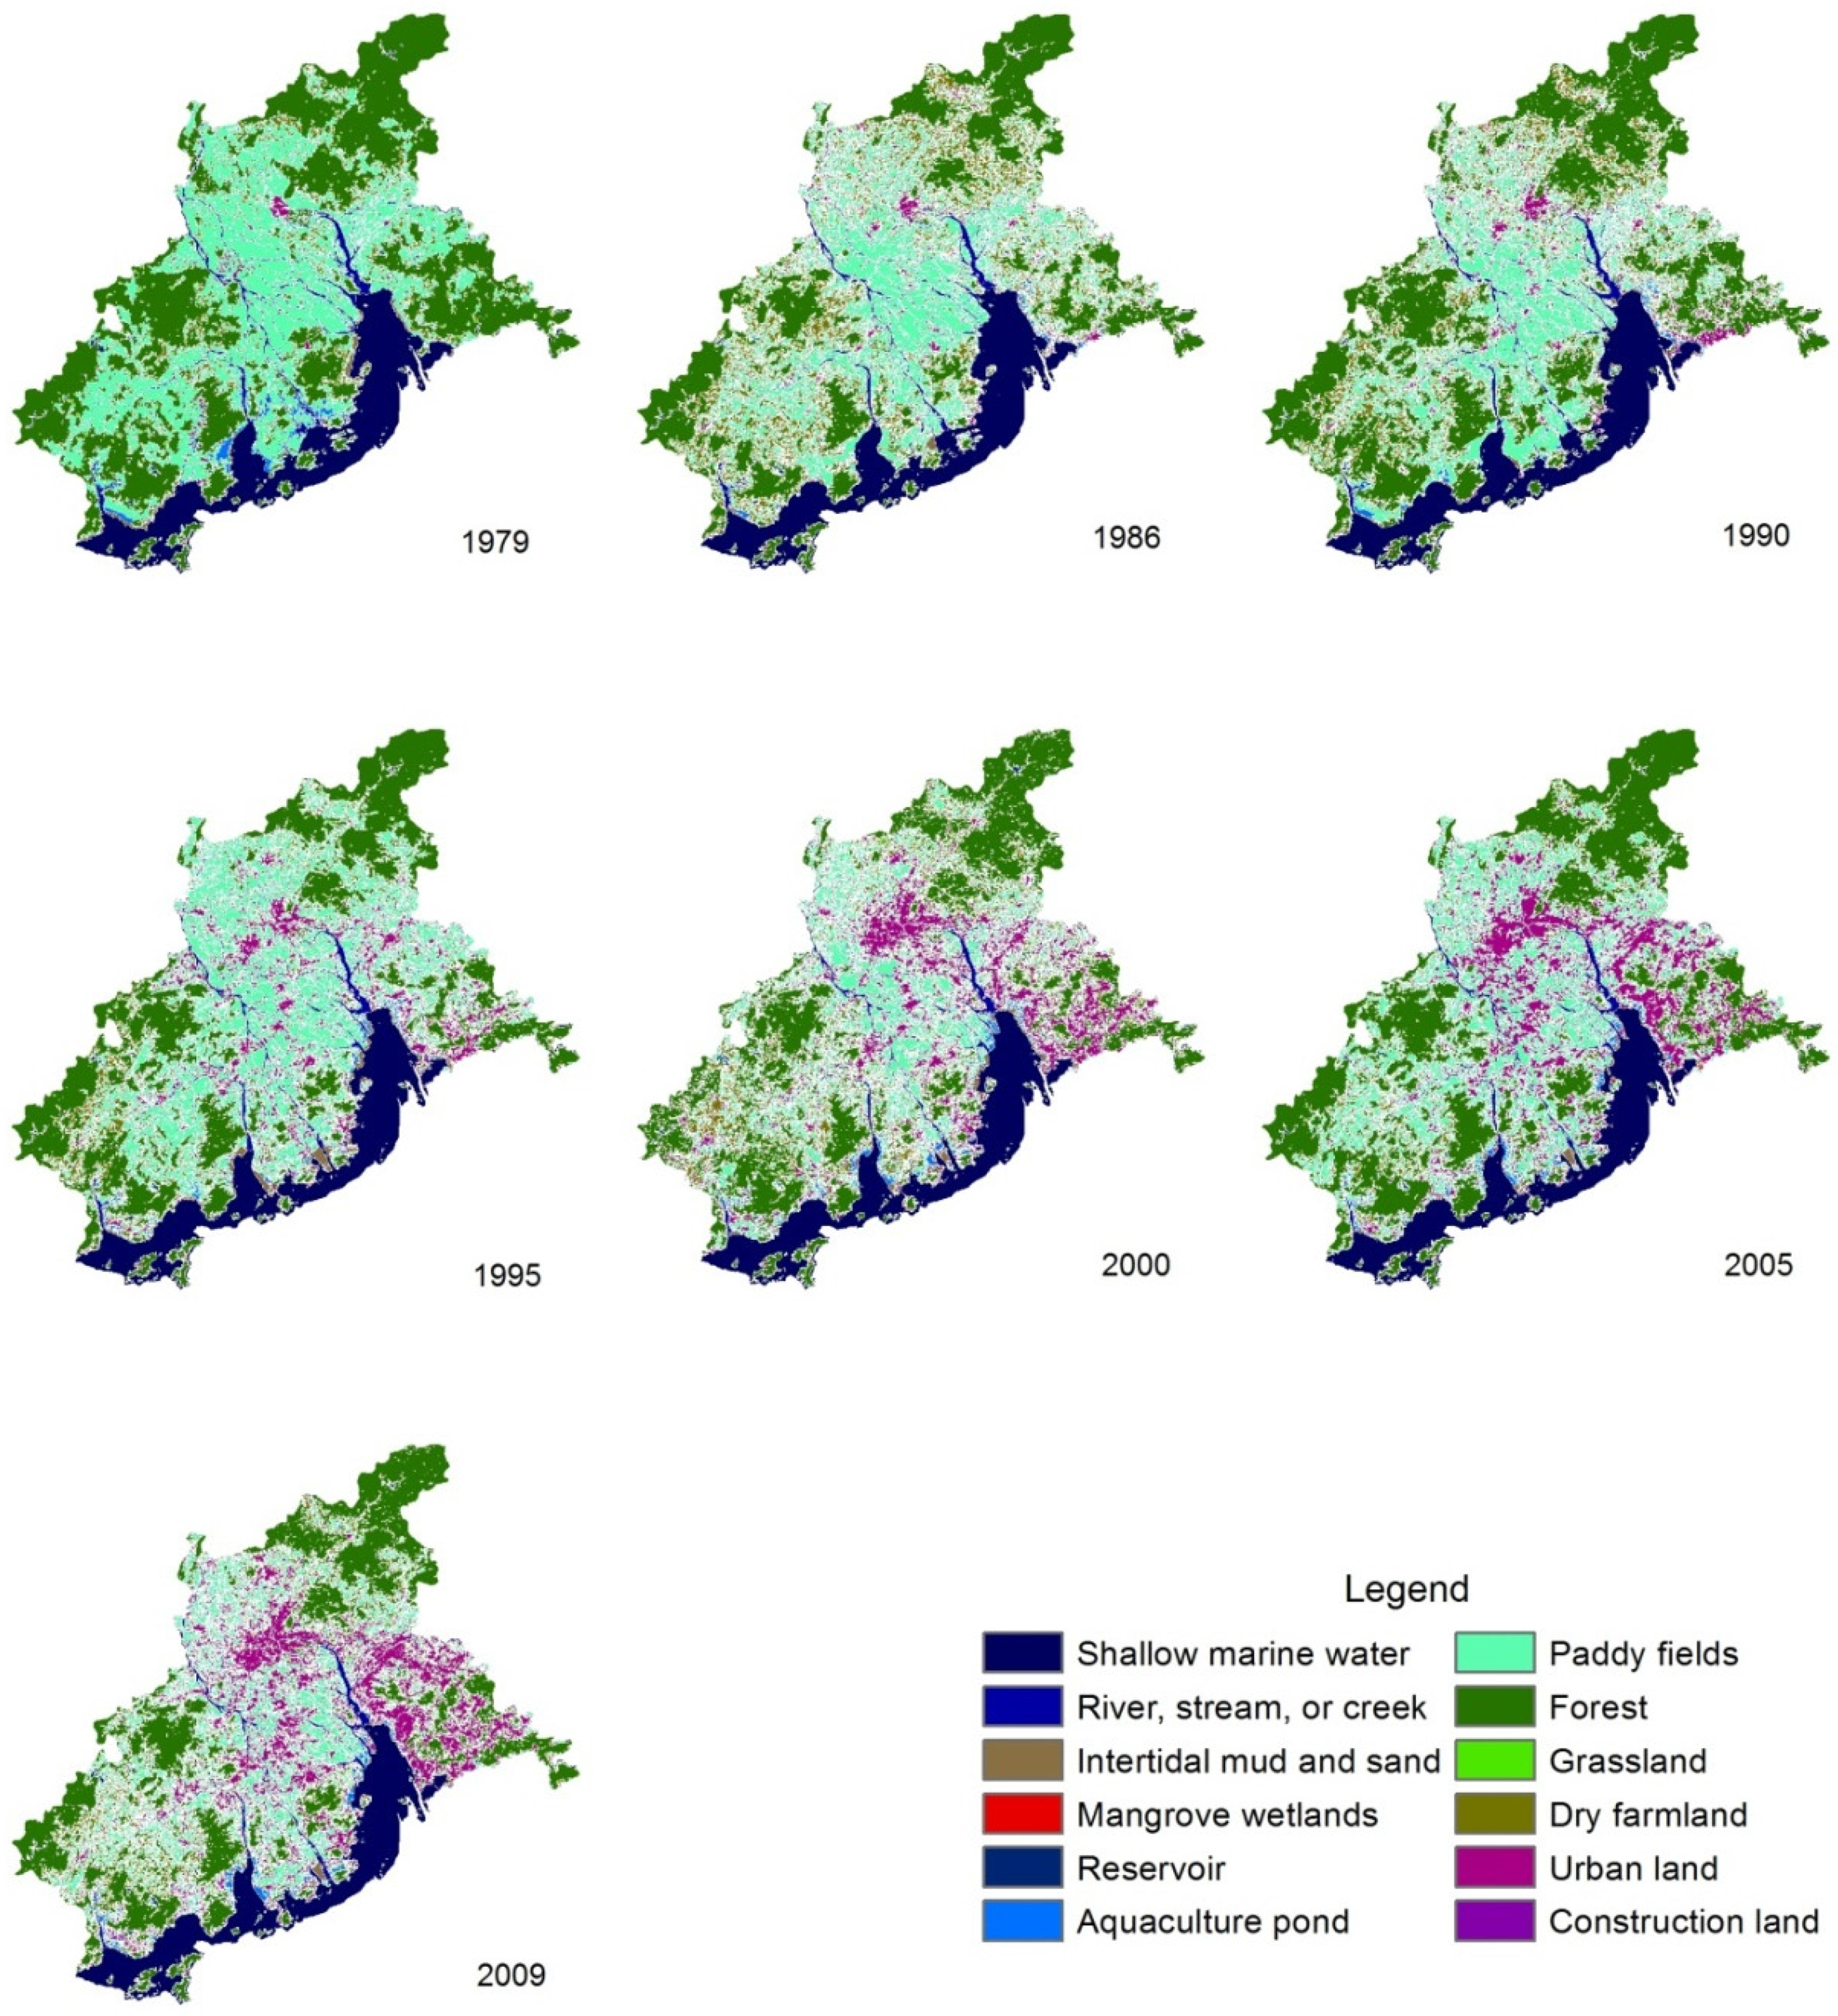
3.1. Patterns of Wetland Transitions

Seven wetland classes and other land use (Figure 2) were obtained from the interpretation of Landsat images. Mutual transfer quantities among land uses were evaluated using the overlay analysis and transition matrices (Figure 3). One-third of the total wetlands were lost in the past 30 years in the Pearl River estuary (decreased from 16,986 km2 in 1979 to 10,465 km2 in 2009). The decreased area for wetlands from 1979 to 1995 and from 1995 to 2009 is 4665 km2 and 1851 km2, respectively.
It was found that NW1 and CW3 were the main natural and constructed wetland classes, respectively, in the study area. About 2% of NW1 was transferred to NW3, CW3, and CW2 from 1979 to 1995; 0.5% of NW1 was transferred to NW3; and 0.1% of NW1 was transferred to CW3 and UL. NW2 gradually decreased and was transferred into CW3 and UL1 over the past 30 years. Both NW3 and NW4 were closely related to NW1, and their area was transferred from NW1. NW3 was mainly transferred to NW4, CW2, and CW3, and NW4 was transferred to CW2 and CW3. The most extensive and intensive transitions of NW1, NW3, and NW4 occurred along the shoreline of Huangmao Ocean and the western shoreline of Lingding Ocean. Figure 4a,b shows two specific locations from these shorelines. The three classes of constructed wetlands were mostly transferred into other land and urban land (Figure 4d). The transfer intensity of CW3 was the largest among the seven classes of wetlands. Three main modes of transition patterns were determined: (1) NW1 → NW3 → NW4/CW2/CW3 → UL (Figure 4a,b); (2) NW2 → CW3 → UL (Figure 4c); and (3) CW1/CW2 → CW3 → UL (Figure 4d). The transition processes of all wetland classes showed that the dominant transition pattern was NW → CW → UL or OL in the six stages from 1979 to 2009 (Figure 3).

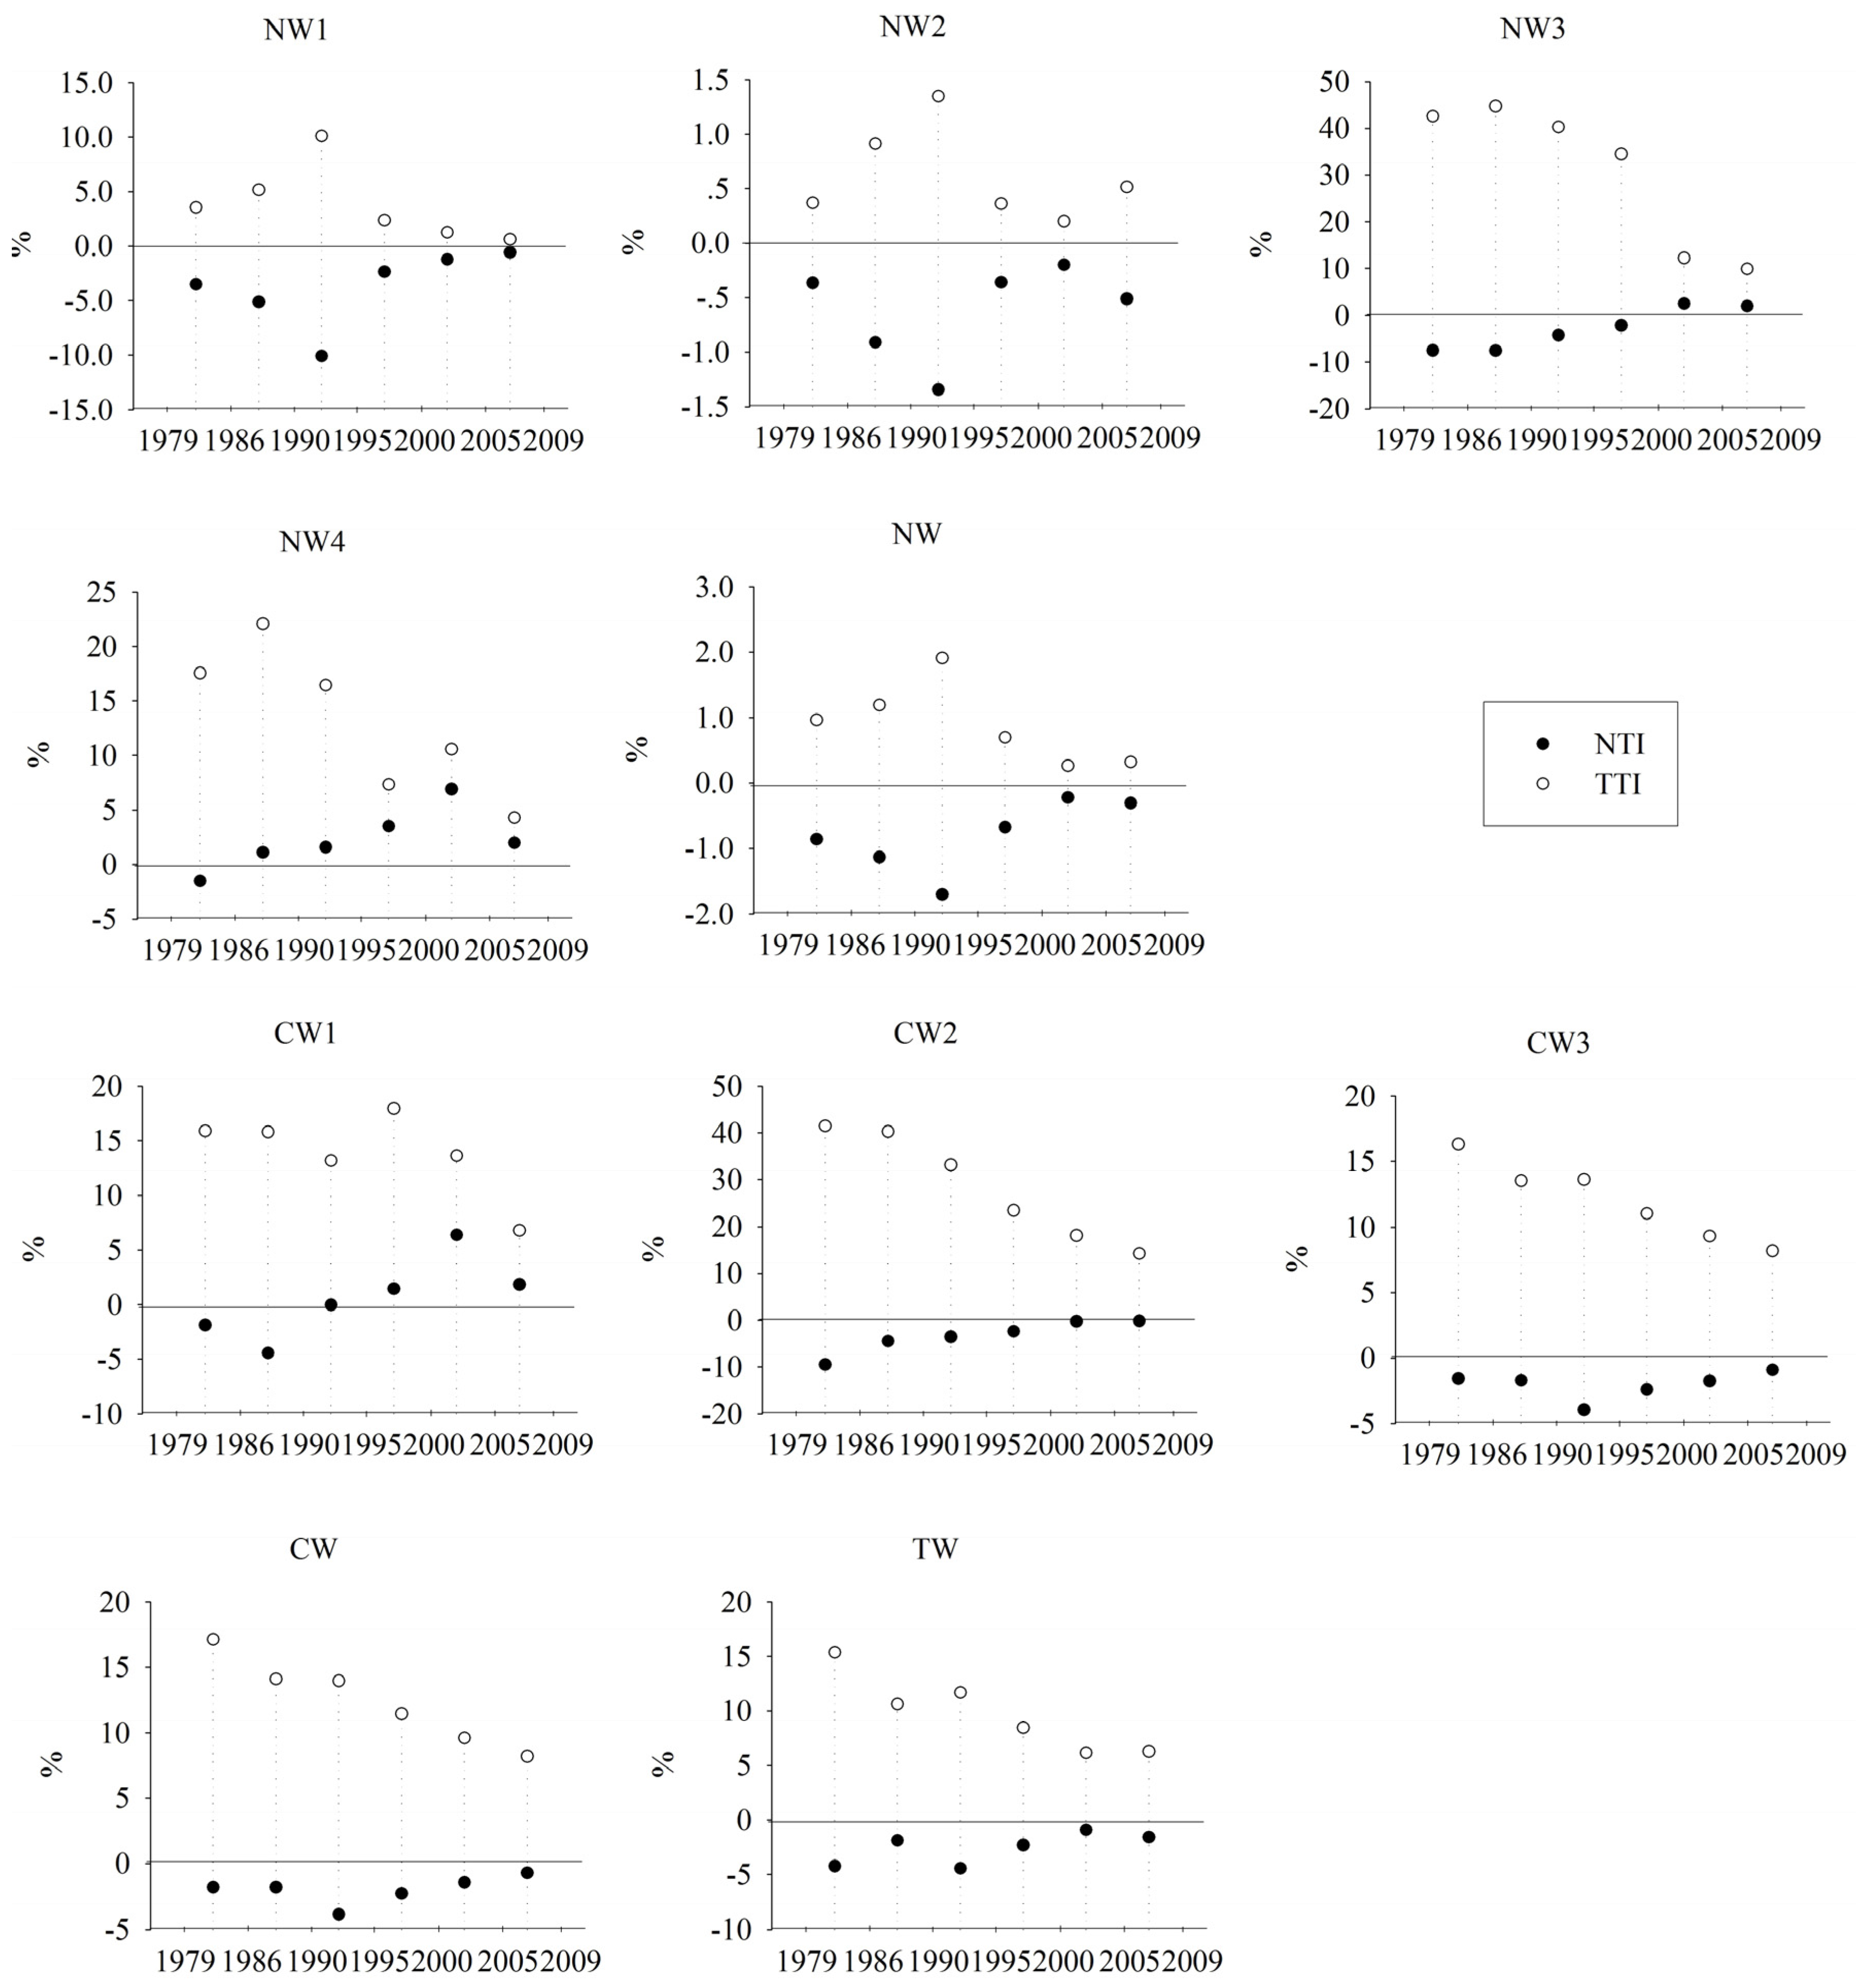
3.2. Amounts of Wetland Transitions (NTI and TTI)

Total and absolute transition amounts for wetlands were calculated (Figure 5). If NTI < 0, the absolute amount for wetland was decreased. Otherwise, the absolute amount increased. Two net transition patterns among the seven classes of wetlands based on NTI values were determined. One was NTI < 0 in each stage within a five-year interval, such as NW1, NW2, CW2, and CW3, where their area decreased continually during the 30 years. The other was NTI > 0 at certain stages, such as NW3, NW4, and CW1, which showed a fluctuating trend over the six stages. The negative NTI values of NW, CW, and total wetland from 1990 to 1995 were the largest out of the six stages, indicating the maximum net area loss in the past 30 years. TTI values for most wetlands were much bigger than their NTI absolute values. For example, TTI of NW3 was four times its NTI at the same stage. This indicates that the internal transition, which includes both decreases and increases in areas, for most wetlands was frequent and complex. The TTI values of NW1 and NW2 were equal to their NTI absolute values at the same stage, indicating only a decrease in area occurred in NW1 and NW2.

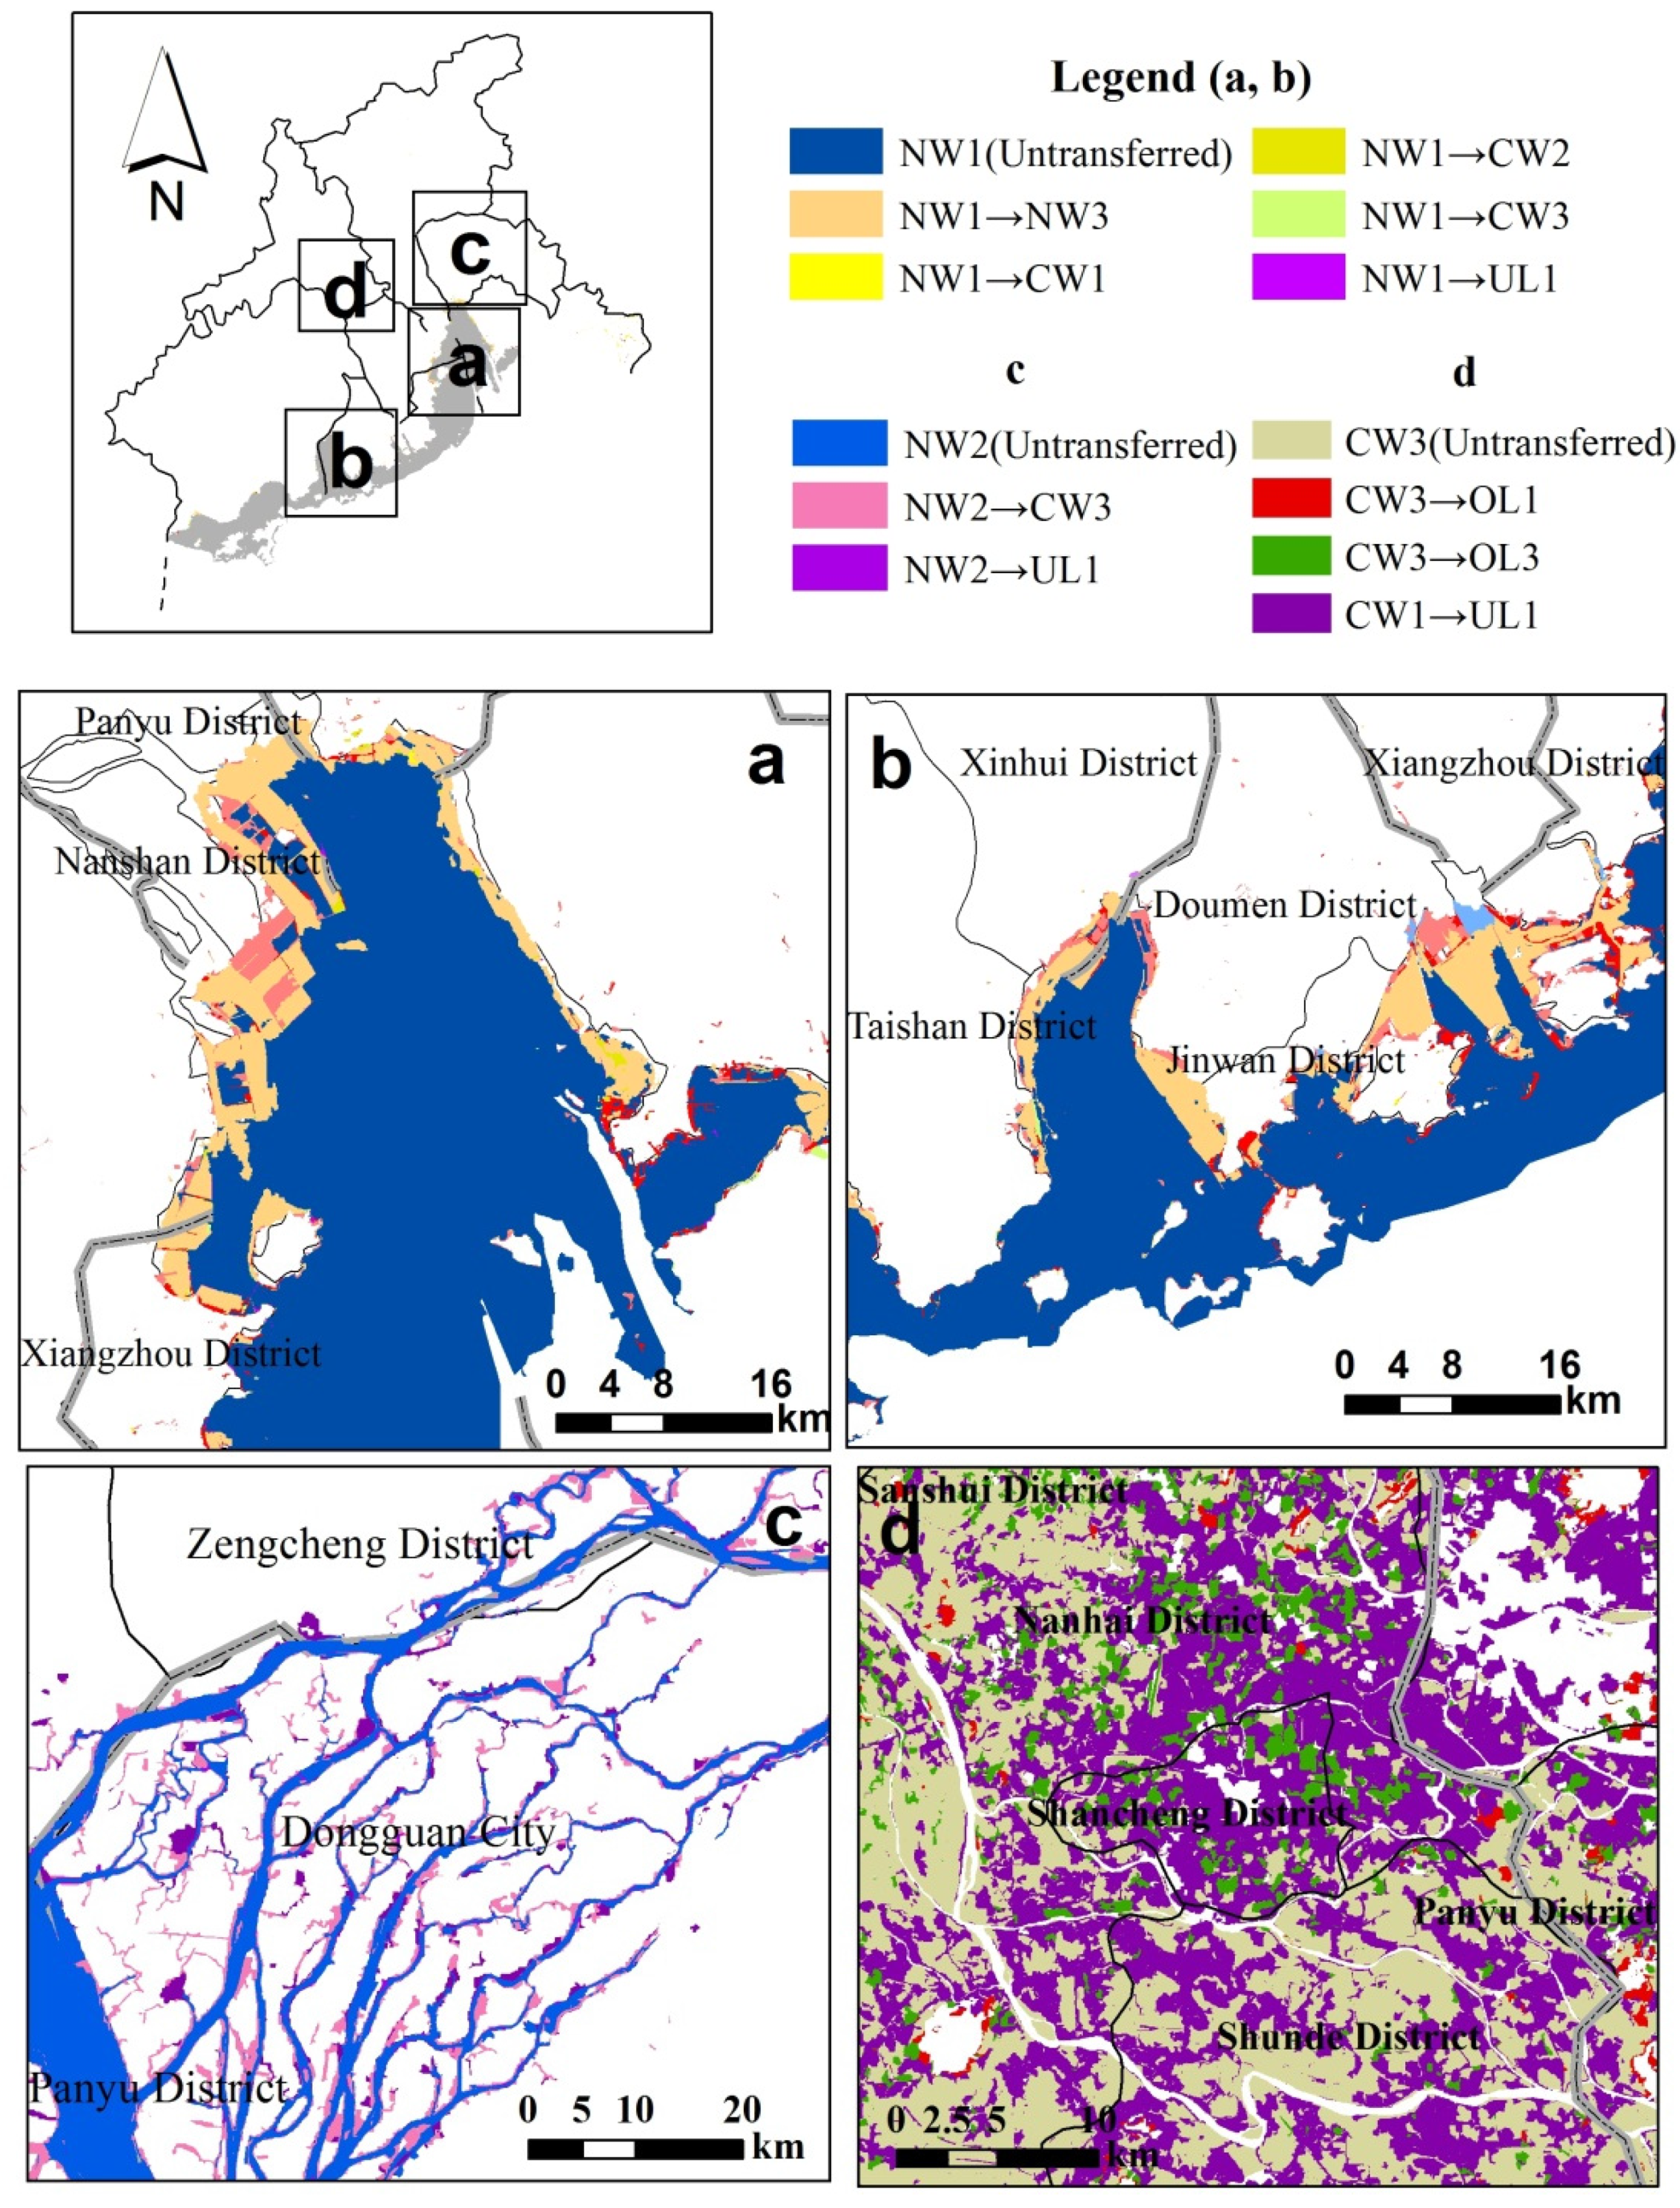
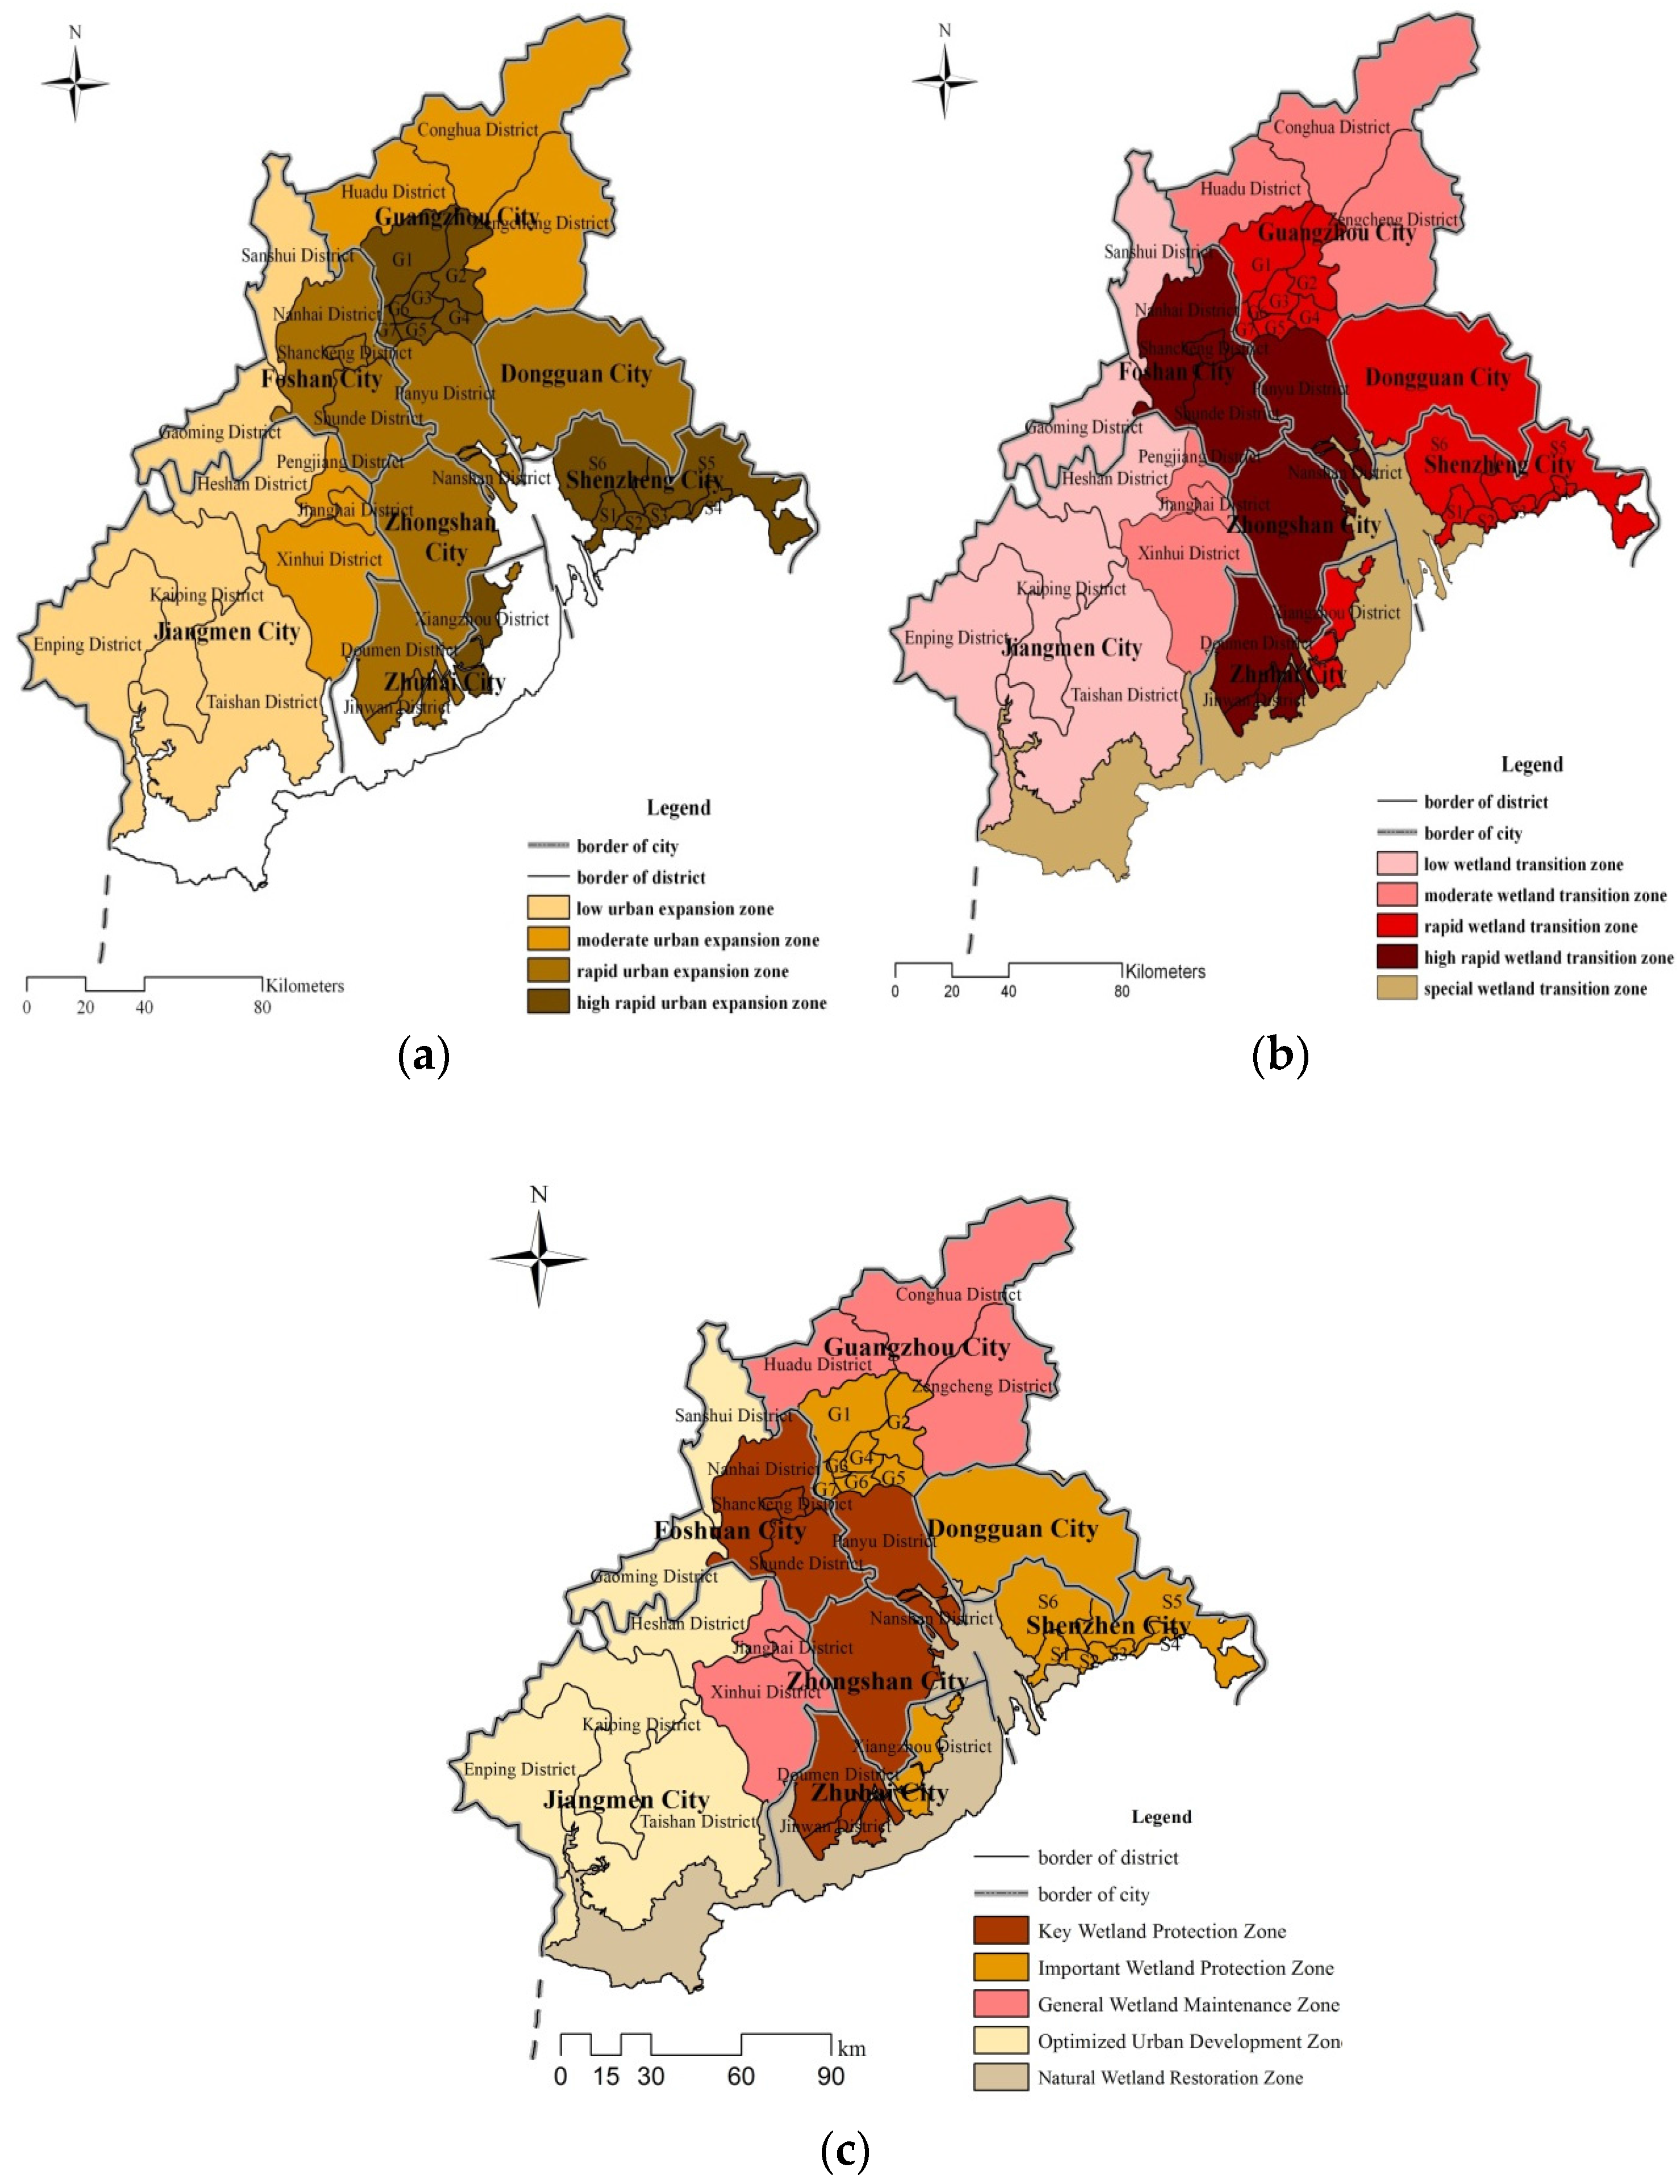
3.3. Divided Zones to Reduce Wetland Transitions

The characteristics of wetland transitions for 35 county-level administrative districts were mapped using NTI and TTI. As a result, the study area was divided into five kinds of transition mode: (1) high rapid wetland transition zones, TTI ≥ 25%; (2) rapid wetland transition zones, 25% > TTI ≥ 20%; (3) moderate wetland transition zones, 20% > TTI ≥ 10%; (4) low wetland transition zones, TTI < 10%; and (5) special wetland transition zones, particularly NW3 (TTI >> NTI). The UII values for each administrative district from 1979 to 2009 were also determined using Equation (3). The results were divided into four types: (1) high rapid urban expansion zones (UII ≥ 0.9%); (2) rapid urban expansion zones (0.9% > UII ≥ 0.6%); (3) moderate urban expansion zones (0.6% > UII ≥ 0.3%); and (4) low urban expansion zones (UII < 0.3%).
In Figure 6a,b, the relationships between wetland transitions and urban land expansions are obvious in the Pearl River estuary based on the integrated TTI and NTI values and the UII values. The highest intensities of urban expansion were observed in the center of Guangzhou City, the whole of Shenzhen City, and the northeast region of Zhuhai City, where no high rapid wetland transition zones were found. The highest intensity of wetland transitions only appeared in rapid urban expansion zones, such as Nanhai District, Shancheng District, and Nanshan District, where a large number of CW3 wetlands exist. According to the hierarchy maps of wetland transitions and urban expansions, a conservation plan to restore and maintain a variety of wetlands was devised. This plan divides the whole study area into five zones: (1) wetland restoration zones; (2) important wetland protection zones; (3) general wetland maintenance zones; (4) optimized urban development zones; and (5) natural wetland restoration zones. The scope and conservation measures for each zone are given in Table 3 and Figure 6c. The integration of transition indices and a wetland conservation plan will facilitate the development of a long-term assessment and management system for estuarine wetlands in the Pearl River delta.

4. Discussion

4.1. Characteristics of Wetland Transitions under Rapid Urban Expansion

Transition intensity is an important indicator for assessing land-use changes [19,20]. In this study, two transition indices were presented to represent the wetland transition intensity between various wetlands and urban lands. NTI is commonly used to represent changes in absolute amounts, while TTI reflects the internal transition activities for each class of wetland. When wetlands are in their original state or at the beginning of a transition, the values of NTI and TTI are the same due to a single change (e.g., NW1 to NW2). When wetlands are in the middle stages of the transition process, bi-directional conversions might occur [17,22]. Generally, the TTI value is much greater than the NTI value. For example, the NTI value of CW3 is <5% from 1990 to 1995, but TTI values of CW3 exceed 10% due to the change in transfer patterns. This phenomenon is an important hint of wetland degradation in the rapid urbanized area.
Different transition intensity indices can be explained as the degree of ‘reclamation activities’ in a specific geographical region and different social communities. A large number of NW1 wetlands were occupied by newly built intertidal mud due to reclamation activities. The intertidal mud was then quickly occupied by CW3. During this process, the loss and newly built intertidal mud existed at the same stage, and only 10% of old intertidal mud was left at its original location in the Pearl River estuary. In the case of wetlands located on the reclaimed landscape, specific criteria have not yet been developed. The combined analysis of the two indices could be used to explain the characteristics of the detailed transitions and reclamation activities of wetlands.

4.2. Implications for Wetland Management

The management of natural and constructed wetlands usually focuses on one or several objectives, such as wetland functions and service values. In fact, it is difficult to operate wetlands with fragmented habitats induced by urbanization. Coastal zone management is considered a better way to strengthen the conservation of wetlands [38]. This study proposes a conservation plan (Table 3 and Figure 6c) that integrates the indices of wetland transitions and urban expansion intensities to facilitate the management of the degraded and constructed wetlands. This plan involves activities that can be conducted in and around both natural and constructed wetlands. The most important measure is controlling the expansion of urban land or limiting the occupation of the natural wetlands. This plan depends on the government actions and the participation of local people. The Ramsar Convention has been playing a leading role, and guidelines on the participatory management of wetlands have been adopted [39,40].
In the study area, the wetland transition activities were very intense in the first 15 years (1979–1995) due purely to the pursuit of economic development. In the second 15 years (1995–2009), wetland conservation was considered seriously by the local government, and many activities affecting natural wetlands were forbidden by the government regulations. Some wetland reserves were built along Lingding Ocean, e.g., Futian Mangrove Nature Reserve (2000) and Nanshan Wetland Nature Reserve (2007). The aforementioned two transition periods indicate the importance of rational management policies and measures for wetlands. Some individual and governmental activities, such as digging ditches and impoundments, stream channelization, and placement of impervious surfaces, which lead to the loss and degradation of wetlands, have not been completely controlled so far. Further measures are required for conservation of wetlands in the estuary wetlands.

5. Conclusions

In this study, the spatial characteristics of estuarine wetland transitions under rapid urban expansion from 1979 to 2009 in the Pearl River estuary were investigated. Two indices, NTI and TTI, were calculated to characterize the wetland transitions at the regional scale. The combined analysis of NTI and TTI provided useful information on wetland transitions and the patterns of each wetland class. According to the hierarchy maps of wetland transitions and urban expansion intensities, a conservation plan was devised to restore and maintain the various wetlands. More wetland transition indices are required to forecast future trends and facilitate decision-making for wetland conservation.

Acknowledgments

This study was financially supported by the National Natural Science Foundation (Grant No. 41201096), the National Science and Technology Support Projects (Grant No. 2012BAC19B05), and the Youth Scientific Foundation of Institute of Mountain Hazards and Environment (Grant No. SDS-QN-1308).

Author Contributions

All authors contributed to the design and development of this research. The manuscript was primarily written by Hui Zhao. Xiaodan Wang contributed to design the topic and experiments; Yanjiang Cai and Weilong Liu contributed to do some fieldwork and analyze the data.

Conflicts of Interest

The authors declare no conflict of interest.

References

  1. Robert, P.B.; Denice, H.W.; Charles, A.C. Are we purveyors of wetland homogeneity? A model of degradation and restoration to improve wetland mitigation performance. Ecol. Eng. 2005, 24, 331–340. [Google Scholar]
  2. Vela, A.; Pasqualini, V.; Leoni, V.; Djelouli, A.; Langar, H.; Pergent, G.; Pergent-Martini, C.; Ferrat, L.; Ridha, M.; Djabou, H. Use of SPOT 5 and IKONOS imagery for mapping biocenoses in a Tunisian Coastal Lagoon (Mediterranean Sea). Estuar. Coast Shelf Sci. 2008, 79, 591–598. [Google Scholar] [CrossRef]
  3. Marieke, A.E.; Reinold, P.; Hendrik, J.V.; Julie, D.P. Remotely sensed seasonality in the spatial distribution of sea-surface suspended particulate matter in the southern North Sea. Estuar. Coast Shelf Sci. 2008, 80, 103–113. [Google Scholar]
  4. Li, Y.; Zhu, X.; Sun, X.; Wang, F. Landscape effects of environmental impact on bay-area wetlands under rapid urban expansion and development policy: A case study of Lianyungang, China. Landsc. Urban Plan. 2010, 94, 218–227. [Google Scholar] [CrossRef]
  5. Santiago, S.; Christine, E.; Coralie, M.; Monica, R.-F. Network analysis to assess landscape connectivity trends: Application to European Forests (1990–2000). Ecol. Indic. 2011, 11, 407–416. [Google Scholar]
  6. Gabriella, B.; Santiago, S.; Janos, P.; Ferenc, J. Contribution of habitat patches to network connectivity: Redundancy and uniqueness of topological indices. Ecol. Indic. 2011, 11, 1301–1310. [Google Scholar]
  7. Zhang, Y.S.; Zhao, L.; Liu, J.Y.; Liu, Y.L.; Li, C.S. The impact of land cover change on ecosystem service values in urban agglomerations along the coast of the Bohai Rim, China. Sustain. Basel 2015, 7, 10365–10387. [Google Scholar] [CrossRef]
  8. Wang, W.; Pilgrim, M.; Liu, J.N. The evolution of river-lake and urban compound systems: A case study in Wuhan, China. Sustain. Basel 2016, 8, 15. [Google Scholar] [CrossRef]
  9. Biondini, M.; Kandus, P. Transition matrix analysis of land-cover change in the accretion area of the lower delta of the Parana River (Argentina) reveals two succession pathways. Wetlands 2006, 26, 981–991. [Google Scholar] [CrossRef]
  10. Ivan, S.; Sonja, L.; Mladen, J.; Esad, P. Mechanism of land-sea interactions-the distribution of metals and sedimentary organic matter in sediments of a river dominated Mediterranean Karstic Estuary. Estuar. Coast Shelf Sci. 2008, 80, 12–20. [Google Scholar]
  11. Xue, B.; Yan, C.L.; Lu, H.L.; Bai, Y. Mangrove-derived organic carbon in sediment from Zhangjiang Estuary (China) Mangrove Wetlands. J. Coast. Res. 2009, 25, 949–956. [Google Scholar] [CrossRef]
  12. Liu, H.; Zhang, S.; Li, Z.; Lu, X.; Yang, Q. Impacts on wetlands of large-scale land-use changes by agricultural development: The small Sanjiang plain, China. Ambio 2004, 33, 306–310. [Google Scholar] [CrossRef] [PubMed]
  13. Lee, S.Y.; Dunn, R.J.K.; Young, R.A.; Connolly, R.M.; Dale, P.E.R.; Dehayr, R.; Lemckert, C.J.; McKinnon, S.; Powell, B.; Teasdale, P.R.; et al. Impact of urbanization on coastal wetland structure and function. Austral Ecol. 2006, 31, 149–163. [Google Scholar] [CrossRef]
  14. Antos, M.J.; Ehmke, G.C.; Tzaros, C.L.; Weston, M.A. Unauthorized human use of an urban coastal wetland sanctuary: Current and future patterns. Landsc. Urban Plan. 2007, 80, 173–183. [Google Scholar] [CrossRef]
  15. Grossinger, R. Documenting local landscape change: The San Francisco Bay area project. In The Historical Ecology Handbook: A Restorationist’s Guide to Reference Ecosystems; Egan, D., Howell, E., Eds.; Island Press: Washington, DC, USA, 2001; pp. 34–65. [Google Scholar]
  16. Duan, L.J.; Li, S.Y.; Liu, Y.; Moreau, J.; Christensen, V. Modeling changes in the coastal ecosystem of the Pearl River Estuary from 1981 to 1998. Ecol. Model 2009, 220, 2802–2818. [Google Scholar] [CrossRef]
  17. Yu, G.M.; Zeng, Q.; Yang, S.; Hu, L.M.; Lin, X.W.; Che, Y.; Zheng, Y.G. On the intensity and type transition of land use at the basin scale using RS/GIS: A case study of the Hanjiang River Basin. Environ. Monit. Assess. 2010, 160, 169–179. [Google Scholar] [CrossRef] [PubMed]
  18. Xie, Z.L.; Xu, X.G.; Yan, L. Analyzing qualitative and quantitative changes in coastal wetland associated to the effects of natural and anthropogenic factors in a part of Tianjin, China. Estuar. Coast Shelf Sci. 2010, 86, 379–386. [Google Scholar] [CrossRef]
  19. Spathelf, P.; Durlo, M.A. Transition matrix for modeling the dynamics of a subtropical seminatural forest in southern Brazil. For. Ecol. Manag. 2001, 151, 139–149. [Google Scholar] [CrossRef]
  20. Takada, T.; Miyamoto, A.; Hasegawa, S.F. Derivation of a yearly transition probability matrix for land-use dynamics and its applications. Landsc. Ecol. 2010, 2, 561–572. [Google Scholar] [CrossRef]
  21. Liu, J.Y.; Zhan, J.Y.; Deng, X.Z. Spatio-temporal patterns and driving forces of urban land expansion in china during the economic reform era. Ambio 2005, 34, 450–455. [Google Scholar] [CrossRef] [PubMed]
  22. Ichikawa, K.; Okubo, N.; Okubo, S.; Takeuchi, K. Transition of the satoyama landscape in the urban fringe of the Tokyo metropolitan area from 1880 to 2001. Landsc. Urban Plan. 2006, 78, 398–410. [Google Scholar] [CrossRef]
  23. Zha, Y.; Liu, Y.S.; Deng, X.Z. A landscape approach to quantifying land cover changes in Yulin, Northwest Chin. Environ. Monit. Assess. 2010, 86, 379–386. [Google Scholar]
  24. Bendor, T. A dynamic analysis of the wetland mitigation process and its effects on no net loss policy. Landsc. Urban Plan. 2009, 89, 17–27. [Google Scholar] [CrossRef]
  25. Zhang, W.; Yan, Y.; Zheng, J.; Li, L.; Dong, X.; Cai, H. Temporal and spatial variability of annual extreme water level in the Pearl River Delta region, China. Glob. Planet Chang. 2009, 69, 35–47. [Google Scholar] [CrossRef]
  26. Seto, K.C.; Woodcock, C.E.; Song, C.; Huang, X. Monitoring land-use change in the Pearl River delta using Landsat TM. Int. J. Remote Sens. 2002, 23, 1985–2004. [Google Scholar] [CrossRef]
  27. Yu, X.J.; Ng, C.N. Spatial and temporal dynamics of urban sprawl along two urban–rural transects: A case study of Guangzhou, China. Landsc. Urban Plan. 2007, 79, 96–109. [Google Scholar] [CrossRef]
  28. The Global Land Cover Facility at the University of Maryland. Available online: http://glcfapp.glcf.umd.edu:8080/esdi/index.jsp (accessed on 3 February 2009).
  29. Yang, Y.Y.; Zhang, S.W.; Wang, D.Y.; Yang, J.C.; Xing, X.S. Spatiotemporal changes of farming-pastoral ecotone in Northern China, 1954–2005: A case study in Zhenlai County, Jilin Province. Sustain. Basel 2015, 7, 1–22. [Google Scholar] [CrossRef]
  30. Campbell, J.B. Introduction to Remote Sensing, 3rd ed.; The Guilford Press: New York, NY, USA, 2002. [Google Scholar]
  31. Fonji, S.F.; Taff, G.N. Using satellite data to monitor land-use/land-cover change in North-Eastern Latvia. Springerplus 2014, 3, 61. [Google Scholar] [CrossRef] [PubMed]
  32. Ikiel, C.; Ustaoglu, B.; Dutucu, A.A.; Kilic, D.E. Remote sensing and GIS-based integrated analysis of land cover change in Duzce plain and its surroundings (north western Turkey). Environ. Monit. Assess. 2013, 18, 1699–1709. [Google Scholar] [CrossRef] [PubMed]
  33. Dang, A.R. Erdas Imagine: Processing Method of Remote Sensing Image; Tsinghua University Press: Beijing, China, 2003. [Google Scholar]
  34. Richards, J.A.; Jia, X. Remote Sensing Digital Image Analysis: An Introduction, 3rd ed.; Springer: Berlin, Germany, 1999. [Google Scholar]
  35. Guler, M.; Yomralioglu, T.; Reis, S. Using landsat data to determine land use/land cover changes in Samsun, Turkey. Environ. Monit. Assess. 2007, 127, 155–167. [Google Scholar] [CrossRef] [PubMed]
  36. Alrababah, M.A.; Alhamad, M.N. Land use/cover classification of arid and semi-arid Mediterranean landscapes using Landsat ETM. Int. J. Remote Sens. 2006, 27, 2703–2718. [Google Scholar] [CrossRef]
  37. Tate, C.M.; Cuffney, T.F.; Mcmahon, G.; Giddings, E.M.P.; Coles, J.F.; Zappia, H. Use of an urban intensity index to assess urban effects on streams in three contrasting environmental settings. Am. Fish. Soc. Symp. 2005, 47, 291–315. [Google Scholar]
  38. Bartlett, D.J.; Smith, J.L. GIS for Coastal Zone Management; CRC Press: Boca Raton, FL, USA; London, UK; New York, NY, USA; Washington, DC, USA, 2005. [Google Scholar]
  39. Schulte-Hosteddea, B.; Waltersb, D.; Powellc, C.; Shrubsole, D. Wetland management: An analysis of past practice and recent policy changes in Ontario. J. Environ. Manag. 2007, 82, 83–94. [Google Scholar] [CrossRef] [PubMed]
  40. Fletcher, S.; Kawabe, M.; Rewhorn, S. Wetland conservation and sustainable coastal governance in Japan and England. Mar. Pollut. Bull. 2011, 62, 956–962. [Google Scholar] [CrossRef] [PubMed]
Figure 1. Layout of the study region (Seven large cities and two major river branches in the Pearl River estuary, i.e., Guangzhou City, Foshan City, Zhongshan City, Dongguan City, Jiangmen City, Shenzhen City, Zhuhai City and Huangmao Ocean, Lingding Ocean).
Sustainability 08 00471 g001
Figure 2. Land use maps for the years (1979, 1986, 1990, 1995, 2000, 2005 and 2009) in the study region.
Sustainability 08 00471 g002
Figure 3. The transition process of various wetland classes from 1979 to 2009.
Sustainability 08 00471 g003
Figure 4. Specific locations for wetland transitions in the Pearl River estuary: (a) Lingding Ocean; (b) Huangmao Ocean; (c) Dongguan City; and (d) Shancheng and Nanhai District.
Sustainability 08 00471 g004
Figure 5. NTI (net transition intensity) and TTI (total transition intensity) of the main wetland classes in six periods (TW: total wetlands).
Sustainability 08 00471 g005
Figure 6. District hierarchy maps of: (a) urban land expansion; (b) wetland transition intensity; and (c) wetland protection planning in the Pearl River estuary. Note: G1-G7 are located in the center of Guangzhou City. G1: Baiyun District; G2: Luogang District; G3: Tianhe District; G4: Huangpu District; G5: Haizhu District; G6: Yuexiu District; G7: Liwan District. S1-S7 are located in Shenzhen City. S1: Nanshan District; S2: Futian District; S3: Luohu District; S4: Yantian District; S5: Longgang District; S6: Bao’an District.
Sustainability 08 00471 g006
Table 1. List of the satellite data used.
Data Used (Path/Row)TimeLandsat Instruments
130/4430 September 1979MSS
130/4530 September 1979MSS
131/4319 October 1979MSS
131/4419 October 979MSS
131/4525 December 1973MSS
132/4420 October 1979MSS
132/4520 October 1979MSS
121/4418 October 1986, 9 October 1991, 26 March 1995,TM and ETM+
28 December 2000, 12 October 2004, 11 January 2009
121/4518 October 1986, 9 October 1991, 26 March 1995,TM and ETM+
28 December 2000, 12 October 2004, 14 January 2010
122/433 November 1986, 24 December 1990, 30 December 1995,TM and ETM+
14 September 2000, 23 November 2005, 2 January 2009
122/443 November 1986, 13 October 1990, 30 December 1995,TM and ETM+
14 September 2000, 23 November 2005, 2 January 2009
122/453 November 1986, 13 October 1990, 30 December 1995,TM and ETM+
14 September 2000, 23 November 2005, 2 January 2009
123/4421 September 1986, 21 September 1991, 25 August 1993,TM and ETM+
24 December 1999, 13 December 2004, 25 November 2009
123/4521 September 1986, 2 September 1990, 25 August 1993,TM and ETM+
24 December 1999, 19 December 2006, 9 January 2009
Table 2. The classification of main wetlands and other land uses.
First Class LevelSecond Class LevelMeaning
Natural wetlands (NW)Shallow marine water (NW1)Ocean area, intertidal and shallow (<6 m at low tide) sub-tidal soft sediment areas, including sea bays and straits, including water of estuaries and estuarine systems of deltas.
River, stream, or creek (NW2)River network with submerged, floating-leaved and emerging plants, including permanent (seasonal, intermittent, irregular) rivers, streams and creeks.
Intertidal mud and sand (NW3) Sand, shingle or pebble shores; sand bars, spits and sandy islets, including dune systems and humid dune slacks; salt marshes, salt meadows, saltings, raised salt marshes; tidal brackish and freshwater marshes.
Mangrove wetlands (NW4)Mangrove swamps, nipah swamps and tidal freshwater swamp forests.
Constructed wetlands (CW)Reservoir (CW1)Stock ponds, small tanks (generally <8 ha).
Aquaculture pond (CW2)Land used to feed fish and shrimp, including fishponds and aquafarms.
Paddy fields (CW3)Irrigation channels and rice fields.
Urban land (UL)Urban land (UL1)Land covered by buildings, residential areas, and other man-made structures.
Construction land (UL2)Land, outside the town, is independent of mines, large industrial zones, oil fields, salt fields, quarry lands, traffic roads, airports, etc.
Other land (OL)Forest (OL1)Land dominated by trees, with a percent canopy cover of >10%
Grassland (OL2)Land dominated by herbaceous types, or tree and shrub cover is <10%.
Dry farmland (OL3)Land covered with temporary crops followed by harvest and a bare soil period (e.g., single and multiple cropping systems). Note that perennial woody crops will be classified as the appropriate forest or shrub land cover type.
Table 3. Protection plan for wetlands of the Pearl River estuary.
ZoneScopeDistinctionDistrictProtection Measures
Key Wetland Protection ZoneTTI ≥ 25%;Where the high rapid and the largest-scale transformation of wetlands exists; wetlands are vulnerable to outside interference, especially for constructed wetlands.Nanhai District, Shancheng District, Shunde District, Doumen District, Jinwan District, Zhongshan City, Panyu District, Nansha DistrictRestriction of occupation for constructed wetlands; implementation of restoration projects for threatened natural wetlands; control of disturbance of urban land expansion to constructed wetlands; selection of environmentally friendly industry only.
Important Wetland Protection Zone25% > TTI ≥ 20%;
UII ≥ 0.6%
Where the rapid and larger-scale transformation of wetlands exists.Baiyun District, Luogang District, Tianhe District, Huangpu District, Haizhu District, Yuexiu District, Liwan District, Nanshan District, Futian District, Luohu District, Yantian District, Longgang District, Bao’an District, Xiangzhou District, Dongguan CityStop occupation for natural wetlands; restriction of disturbance of urban land expansion to constructed wetlands; experiment with restoration project for threatened natural wetlands; selection of environmentally friendly industry mainly.
General Wetland Maintenance Zone20% > TTI ≥ 10%;
0.6% > UII ≥ 0.3%
Where both moderate-scale transformation and moderate urban expansion of wetlands exist.Huadu District, Conghua District, Zengcheng District, Jianghai District, Pengjiang District, Xinhui DistrictStop occupation for natural wetlands; selection of environmentally friendly industry partly; wise consumption of resources and reduction of excessive emission of pollutants.
Optimized Urban Development Zone10% > TTI
0.3% > UII
Where both low-scale transformation of wetlands and low urban expansion exist.Sanshui District, Gaoming District, District, Taishan District, Kaiping District, Enping District. Improvement of investment and business environment; wise consumption of resources and reduction of excessive emission of pollutants.
Natural Wetland Restoration ZoneEspecial protection to intertidal wetlands TTI >> NTIWhere intertidal wetlands transfer intensively; great loss of shallow marine water and mangroves; the disaster of biodiversity loss may occur if no restoration is undertaken.Special wetland transition zoneStop occupation for intertidal wetlands; control of urban development; implementation of restoration programs and construction of wetland reserves; restoration of mangrove and regional endemic species.

