1. Introduction
Economic and environmental sustainability, as a part of a globalized society, have been topics of debate since 1970, and solutions for destructive effects in the planet have been researched [
1,
2]. Climate change represents a serious environmental transformation in progress. Therefore, experts are interested and making efforts to take actions that allow energy sustainability in housing through the implementation of new technologies that can help mitigate the negative effects of climate changes. The recent increase in energy and sustainability research also reflects the recent growth of knowledge generated around the globe, both academically and industrially speaking. For instance, the number of wind and solar technology patents has increased by 20% and 15%, respectively, on a global basis since 2000 [
2,
3,
4].
Climate change is the resulting status of a complex array of factors that interact. Amongst them, solar radiation is one of the most crucial factors, as are: atmosphere circulation, ocean currents, the geometry of orbital planetary movements, snow-covered surfaces, and the physiographic characteristics of each place, and so forth [
5]. Constructions/ buildings are always exposed to the climate conditions of the place where they are located, constantly receiving a thermal energy interchange, whose main source is solar radiation, which influences the elements that shape the building, which, along with thermo-physical properties of materials, establish the thermal performance of the enclosure [
6,
7].
High temperatures are registered in several geographic areas, and when these temperatures range around 30 °C, in addition to high humidity, they generate an unpleasant thermal sensation for the human body and these two factors are what create the need for thermal comfort [
8,
9,
10]. The variables that were taken into account for the analysis of the comfort level were: percentages of relative humidity and dry bulb temperature, since all the air temperature fluctuations and/or average radiant temperature directly affect the thermal comfort of the inhabitants [
11].
A lack of thermal comfort is generally found both inside and outside housing, and when referring to the former, it represents a critical situation from an environmental perspective since electrical appliances such as air conditioning devices and fans have to be acquired so as to help regulate these thermal conditions and to provide a comfortable and fresh environment inside buildings. Consequently, high electricity consumption occurs, affecting the economy of users and increasing global warming, a problem which affects the entire society [
12].
High temperature conditions inside buildings are mainly brought about by rooftop slabs, which are considered to be the elements which receive greater radiation heat due to their position and the incidence of solar rays on them, hence transferring this heat to the inner part of buildings. It is convenient, therefore, to improve their individual performance. In this research, such improvement was made through the use of passive cooling devices, which are environmental cooling devices, characterized by the total independence of conventional energetics [
13]. The previous statement corresponds to the conditions of traditional housing in the southern region of Mexico, which are built with 0.15 m wall thickness using annealed clay bricks, with a compressive strength of 42 kg/cm
2, and with a mortar and sand-based coating in a 1:7 ratio and 0.02 m width and a reinforced concrete slab of 0.08 m wide.
Studying the behavior of this component (rooftop slabs) is essential for reaching energy savings and sustainability of existing housing in areas where heat conditions are not compatible with human comfort. However, the case study also brings to light some fundamental challenges to create more sustainable means of life in areas of construction and energy [
8,
14,
15].
To perform the assessment of passive thermal storage and cooling systems, several tools are required and some of them are essential, such as the Mollier diagram or psychrometric chart. With these tools, it is possible to estimate the level of thermal comfort and the fractal analysis, where each system is considered to have a certain aspect integral to its nature, which is the presence of oscillations or fluctuations in the elements that integrate it. In each system, fluctuations can be particularly classified as linear or nonlinear; in systems with nonlinear oscillations, these are presented in an erratic way and are apparently unpredictable, a behavior which is called chaotic movement [
16].
Several research works have been conducted on the effect of cooling devices for improving and cooling air through heat tubes, so as to enhance natural venting systems on buildings. In order to assess their thermal performance on actual operating conditions, a series of simulations were performed and their results were observed. The result: a cooling potential of up to 12 °C [
17] and a decrease in temperature for buildings on tropical climates [
18] were observed. For a better thermal comfort in traditional houses built in arid and semi-arid climate conditions in the northern part of Mexico, air flow distribution has been analyzed through the construction of wind towers with the purpose of vacuuming air currents and forcing them to flow inside the building for a greater thermal comfort [
19]. The arrangement of heat tubes influences the efficiency of sustainable thermal systems [
20]. Several simplified methods have been developed and tested to calculate the savings on cooling necessities using passive cooling systems based on ventilation, among them wind towers, night direct ventilation and air-soil heat exchangers [
21]. To assess the efficiency and accuracy of the air flow on buildings, several numerical simulations have been performed [
22,
23,
24]. For example, an indirect evaporation cooling system has been assessed for prototype housing located in several cities of Brazil, where the system is capable of ensuring a greater thermal comfort in most of the cities [
25]. Likewise, many strategies have been taken to improve thermal comfort in buildings in Iran, considering the geometric properties of the natural and physical parameters [
26].
Temperature is a nonlinear, complex, variable and a heterogeneous system: housing units are built with different materials, and heat fluxes which have been registered are totally heterogeneous. Therefore, this research conducts an analysis using Fractal Geometry. It was used to study temperature changes and storage, and its dynamics represent a useful tool to have a better understanding of the attributes of the analyzed system and the existing correlations between physical and fractal variables [
27,
28]. In 1975, Benoit Mandelbrot, established the basis for a new geometry known as fractal geometry, which is being developed to a greater extent in the interest of its applications in fields such as Economy [
29], Electrochemistry [
30], Biology [
31], Engineering [
32,
33], and Bio-reactors [
34], among others. Fractal Geometry has recently progressed in the fields of image processing, physical space-time, medical images analysis, electrochemical patterns, digital imaging, sounds, temperatures,
etc., where the fractal dimension parameter is a vital part of the fractal geometry when extracting pattern characteristics and recognition [
35]. During the last decades, a wide array of structures and phenomena of interest to geologists and geochemical engineers have been characterized by the use of fractal geometry and models so as to quantify the spatial distribution of geochemical data [
36]. Several studies have shown that fractal geometry is a tool that can replicate and investigate the nature of materials and their physical properties, such as the distribution of the size of pores in thermal conductivity values in porous materials [
37]. Fractal methodology has been used in areas such as mathematics, music and biology [
38]. It has also been used for the analysis of cognitive functions, spatial memory and learning abilities in animals [
39]. It has also been used to detect the most temperature-sensitive areas throughout the length of a reactor [
40]. Fractal models have also been applied for the analysis of distribution and diversity of species indexes in the field of Biology [
41]. In medicine, a physical-mathematical diagnose of the cardiac dynamic has been performed based on dynamic systems [
42]; it has also been used for the authentication of Pollock’s paintings [
43], as well as to classify turbulent flows and the description of irregular fluctuations in several phases [
44]. In Chemistry, it has been applied to modify natural starch as a bio-polymeric product [
35]. Fractal Geometry can be a useful and powerful tool for an explicit, objective and automatic description of data of the production process in Industrial Engineering, where complex and irregular structures are described [
45]. It has also been used in the optical evaluation of vibratory systems [
46] and for the texture analysis of colors [
47], as well as in several different situations within the field of architecture [
48]. Additionally, it has been applied to assess the scale behavior of marine herbs and the pattern persistence of such [
49]. Specialized models have been made to replicate the behavior of heat transfer [
50]. Also, research works have been conducted on the thermal reduction inside buildings by means of the construction of a concrete slab along with a special steel-encapsulated material [
51,
52]. A wide range of materials have been used to achieve thermal storage such as light concretes with recycled aggregates and a geopolymer concrete; their thermal properties have been measured and used as inputs in the mathematical model to assess their application in thermal storage [
53]. Lithium and Copper materials have also been used to reduce temperature levels, generating economical savings [
54].
In this case, experimental results are analyzed by self-compatible tools from the Benoit Version 1.3 software rescaled range (R/S) and wavelets [
55]. In the Benoit software, one characteristic of data is measured (system attribute) in a function of the observation scale [
16]. There have been several analytical models for thermal conductivity in nano-fluids using fractal analysis, obtaining good concordance between experimental data and predictions of the proposed model verifying the fractal model of effective thermal conductivity of nano-fluids, revealing physical heat mechanisms for nano-fluids [
56].
The main purpose of this research is to analyze a methodology for implementing passive thermal storage systems, applied over reinforced concrete rooftop slabs of houses in the southern east part of Mexico, where tropical warm climate prevails, and to compare different systems in order to determine which one has higher temperature storage properties. Additionally, thermal comfort was analyzed using the psychrometric parameters (relative humidity percentage, dry bulb temperature, and enthalpy saturation inside the household) in order to reduce heat within the households during summer, and to encourage the use of sustainable energy by reducing electrical power cost caused by electrical cooling devices, and to aid the material recycling culture. Likewise, another purpose is to perform an analysis by Fractal Geometry, which has a high impact in complex, dynamic and nonlinear systems.
2. Materials and Methods
In this research, two thermal passive storage systems were implemented and assessed: the first one had encapsulated water in recycled PET bottles as the main element, and the second one used polystyrene plates. Both systems were placed on rooftop slabs of experimental models in a scale of 1:2, according to the average normal household measurements in Mexican territory. Reinforced concrete with no additional storage was used as reference to perform the assessment of the function of such system.
The area of the experiment was within the facilities of the “Engineering School of the Universidad Veracruzana” in Veracruz, Mexico (southern east part of Mexico), at 19°09′57.19” North latitude and 96°06′53.11″ West longitude. The climate type is tropical warm, with a maximum temperature of 36.9 °C and a minimum temperature of 24.05 °C during experimental conditions. It is worth mentioning that all three prototypes were subjected to the same experimental conditions [
57].
2.1. Encapsulated Water System
The first Passive Cooling System (PCS) consisted of a layer of recycled PET bottles with a volume of 0.60 liters, white painted, horizontally placed over the rooftop slabs and filled with water. On the edges of the tiles a formwork was placed in order to stabilize bottles and avoid any type of movement. Water was chosen as the main element of the passive cooling device on account of its high heat capacity, and also because of its availability and easy handling.
2.1.1. Bottle Coating
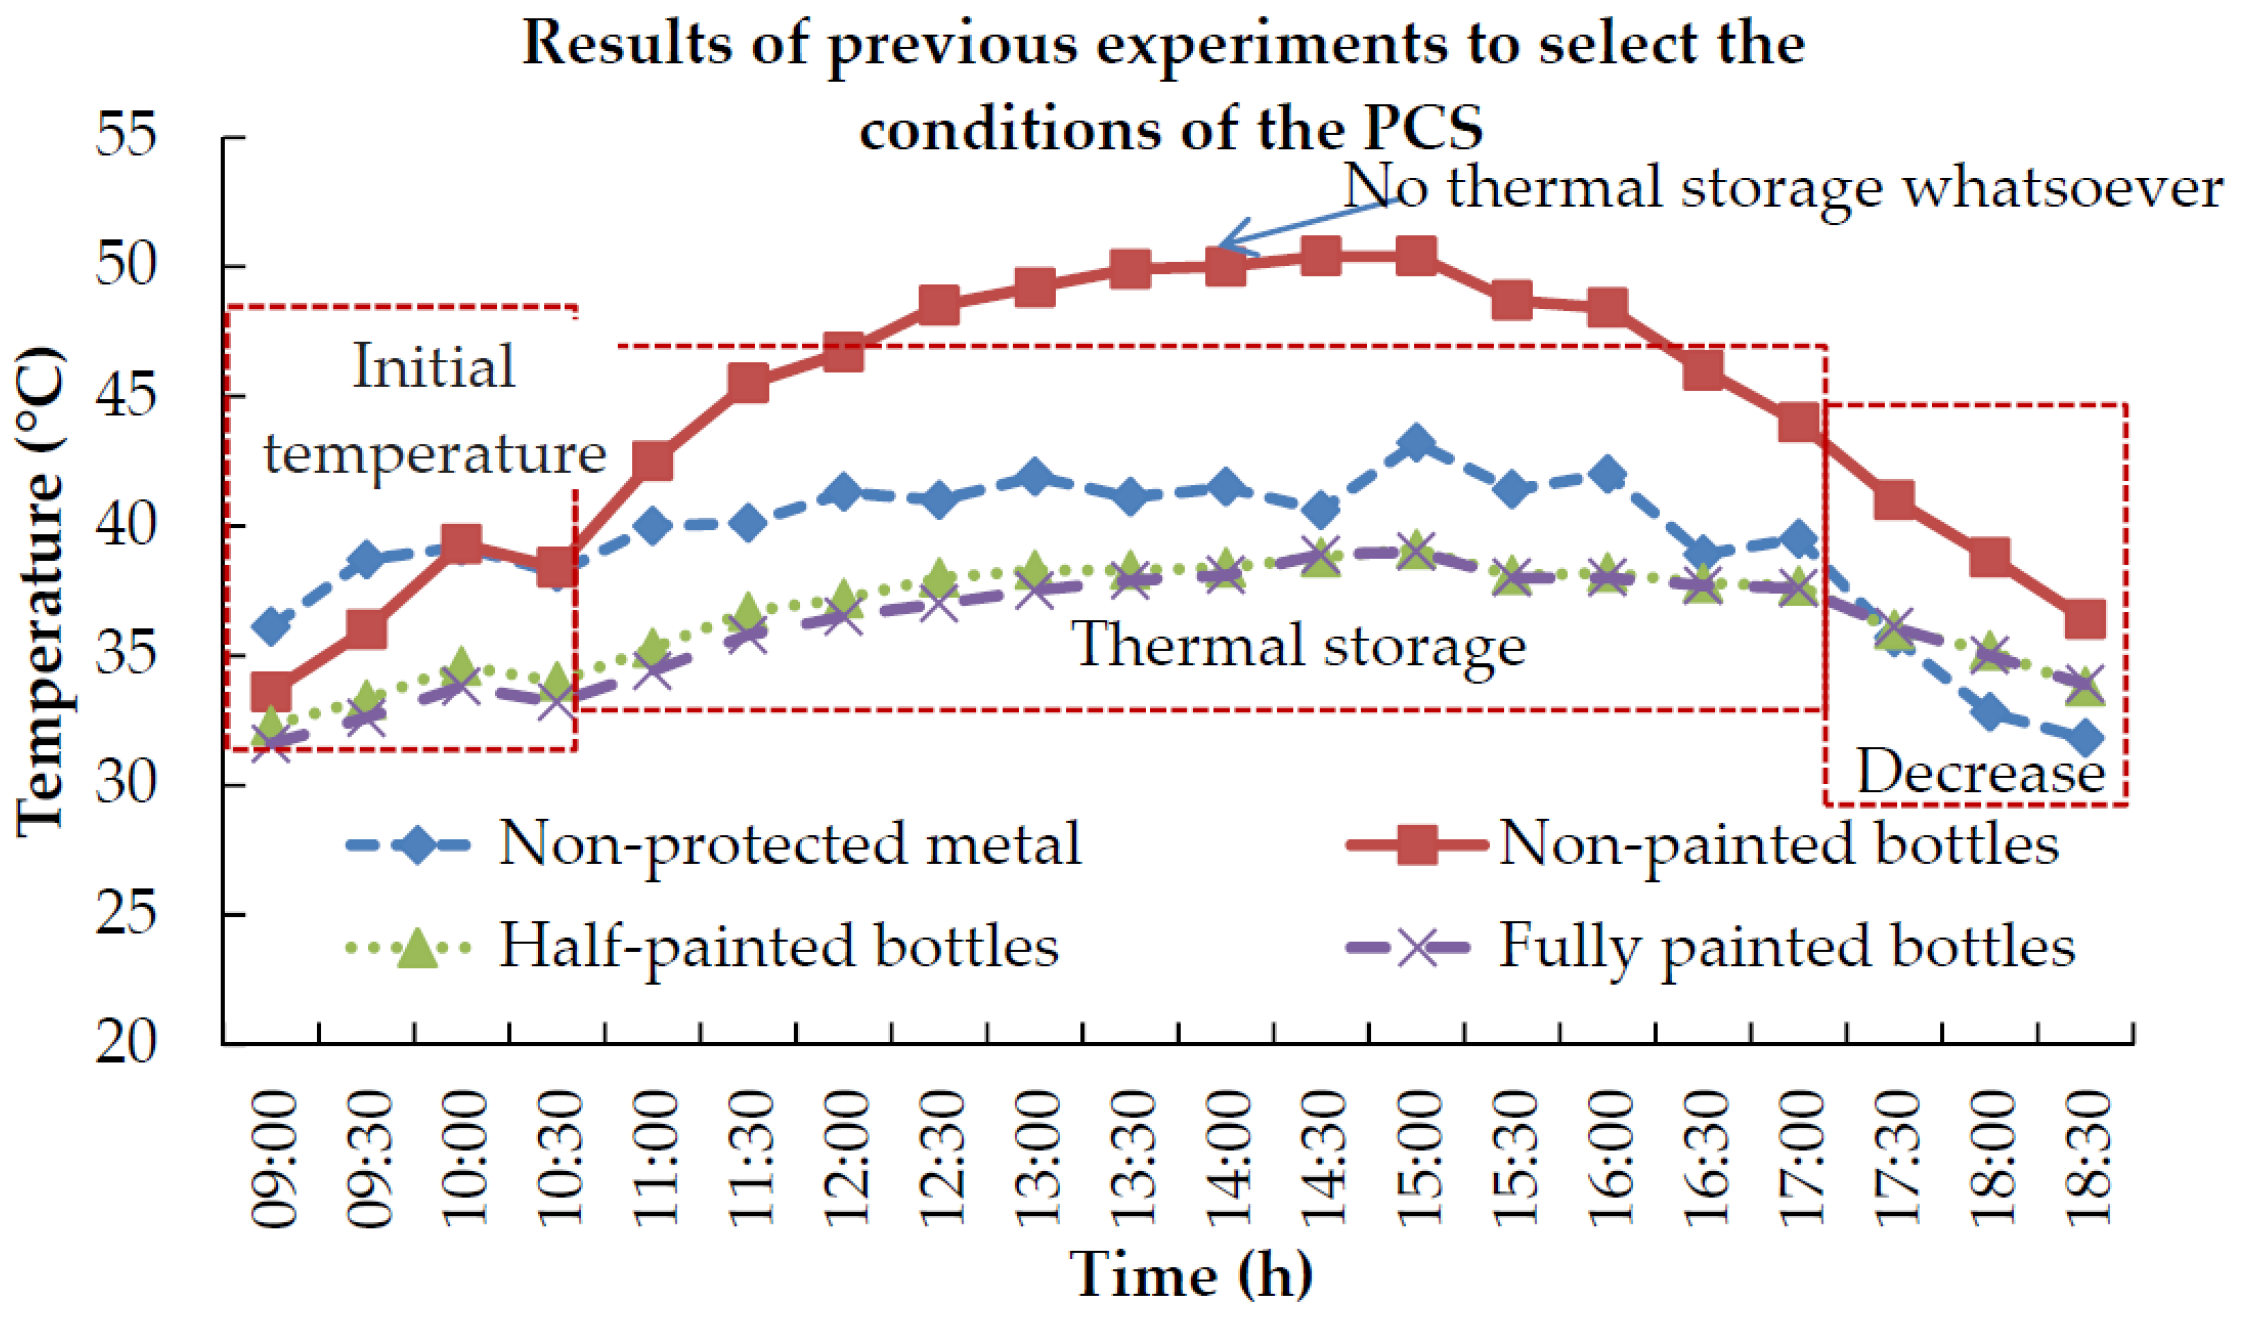
The first stage of the experiment was to determine the best performance of the painting as coating in PET bottles. Four variants were performed for the sampling of the device, using three wooden boxes with similar characteristics. In the upper part of the boxes, a layer of bottles filled with 0.50 liters of water was placed, simulating a cover for such boxes. In order to analyze the influence of color and position of the device, the bottles were used as now described. In the first case: a white coating was used to achieve a higher radiation reflection during the day. In the second case: a white coating was used in the upper and lower part as a type of shadowing over the cover. In the third case: one of the devices had no coating in order to notice the difference the influence of such in the devices. In the fourth case: a metallic element, that had no type of storage was placed, in order to verify the performance of the coating and to make sure water functioned as a thermal storage agent. Systems were installed and monitored on a completely horizontal surface, under the same climate, time and form conditions. The behavior of the different devices is shown in
Figure 1.
In this figure, three zones of the temperature behavior on previous experimental treatments for the final selection of the PCS can be clearly seen. Within the first hours of the day; from 9:00 to 10:30, the highest temperatures were registered for the metallic system without treatment followed by the bottles without paint with an average of 37.7 °C and 36.4 °C respectively. The other treatments remained with similar temperatures fluctuating between 31.6 °C and 34.6 °C. Afterwards, a thermal storage was seen in the system of the half painted bottles and in its totality between 10:30 and 17:00, presenting a range of temperatures that went from 33.6 °C to 37.6 °C. During this lapse of time, a low thermal storage could be seen in the untreated bottles with temperatures increasing up to 50.4 °C. The metal system without storage protection presented low fluctuation in temperatures during the times with the most intense heat as seen in the figure, yet a range between 38.4 °C and 43.2 °C was registered. Finally, after 17:00 a decrease of temperatures was seen. The unpainted bottles system was therefore the most significant regarding temperature fluctuation.
2.1.2. Amount of Encapsulated Water
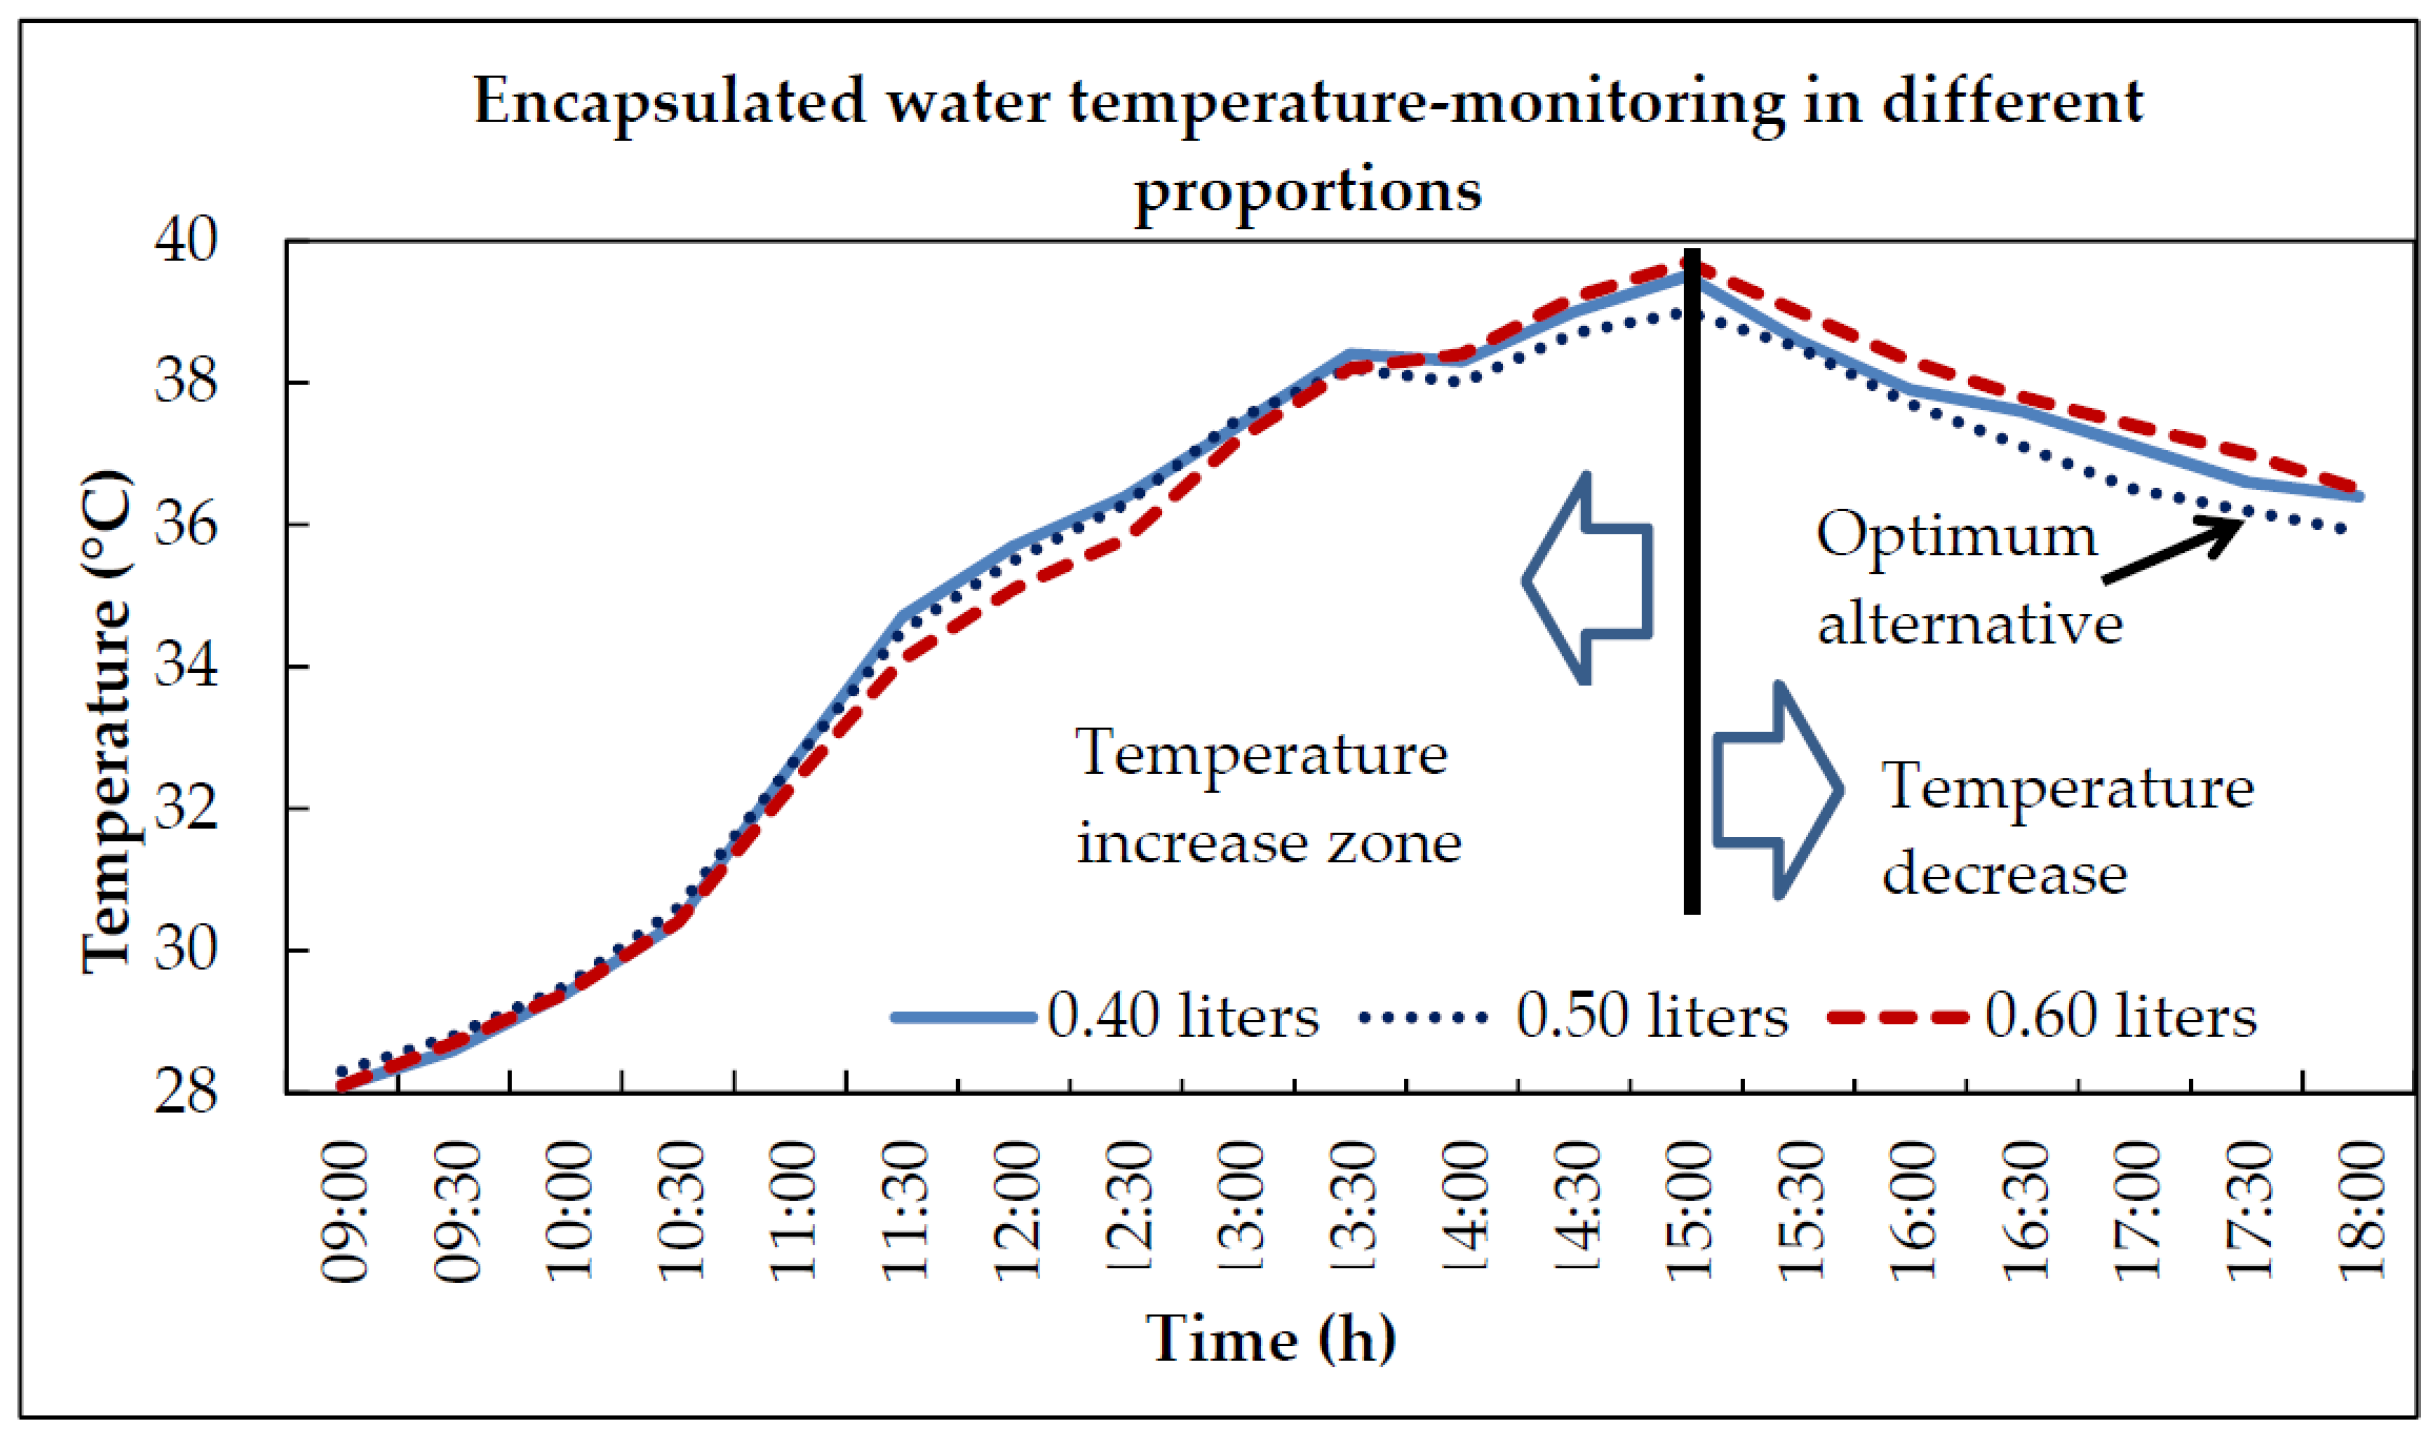
To determine the optimum amount of water in the device, monitoring was done using the previously described system. This time, all bottles were completely covered with the coating, since it was the method that had the best results. Each device was tested with different water proportions: 0.60, 0.50 and 0.40 liters, respectively for each device.
Figure 2 shows thermal behaviors related to different proportions of encapsulated water. In this temperature distribution, it was determined that the best storage function was performed by the 0.50 liters proportion.
The lowest registered temperature was 28 °C in each of the three techniques, registering a temperature raise starting at 10:30 reaching the highest at 15:00. All of the three methods show temperature similarities, having registered an average of 35.2 °C for 0.50 liters and, for the others, a similar average of 35.4 °C. From 15:00 on, a decrease in temperatures was found, which remained steady until 18:00 with an average temperature of 36 °C.
2.1.3. Application to the Experimental Model
Once the first stage was finished, it was determined that the encapsulated water passive cooling device met our expectations of generating thermal storage. Therefore, we proceeded to apply the experimental model, and, as such, 336 bottles were required with the same characteristics, previously stated, using a total coating and filling each one of them with 0.50 liters of water, covering a total area of 5.5 m
2, corresponding to the rooftop slabs dimensions of the experimental module as represented in
Figure 3.
2.2. Polystyrene Plate Device
The second PCS consisted of a layer of expanded polystyrene plates with 0.05 m thickness, horizontally placed over the rooftop slab of an experimental model. In order to stabilize and give a better appearance, mortar in a proportion of 1:7 (cement-sand) was placed on top of the panels. Polystyrene was chosen as the main element for this device on account of its high heat transfer resistance. This material has good acceptance in construction sites due to its excellent thermal insulating ability, that is why it was selected to compare the thermal performance of water against a PCS, which is considered to be highly accepted and one of the best thermal insulation systems in construction.
2.2.1. Application to the Experimental Model
In order to apply the PCS, the slab surface was totally cleaned, ensuring that it was contaminant-free, which could have affected good adhesion of the polystyrene plates to the reinforced concrete (rooftop slabs); afterwards, eight sections with dimensions 0.05 m × 0.60 m × 1.27 m of polystyrene plates were placed and joined with the slab. A special mortar was required (an adhesive for polystyrene elements and concrete elements which offers a finer finish).
Installation procedure: the rooftop slab was moistened (so as not to absorb mortar moisture), the mortar’s mixture was prepared in a tray, with a relation of 1.5 l for every 10 kg of powder adhesive, enough for a surface of approximately 2.5 m2, it was applied with a concrete trowel over the slab and the polystyrene plates were immediately placed on top, applying some pressure to ensure the adhesion.
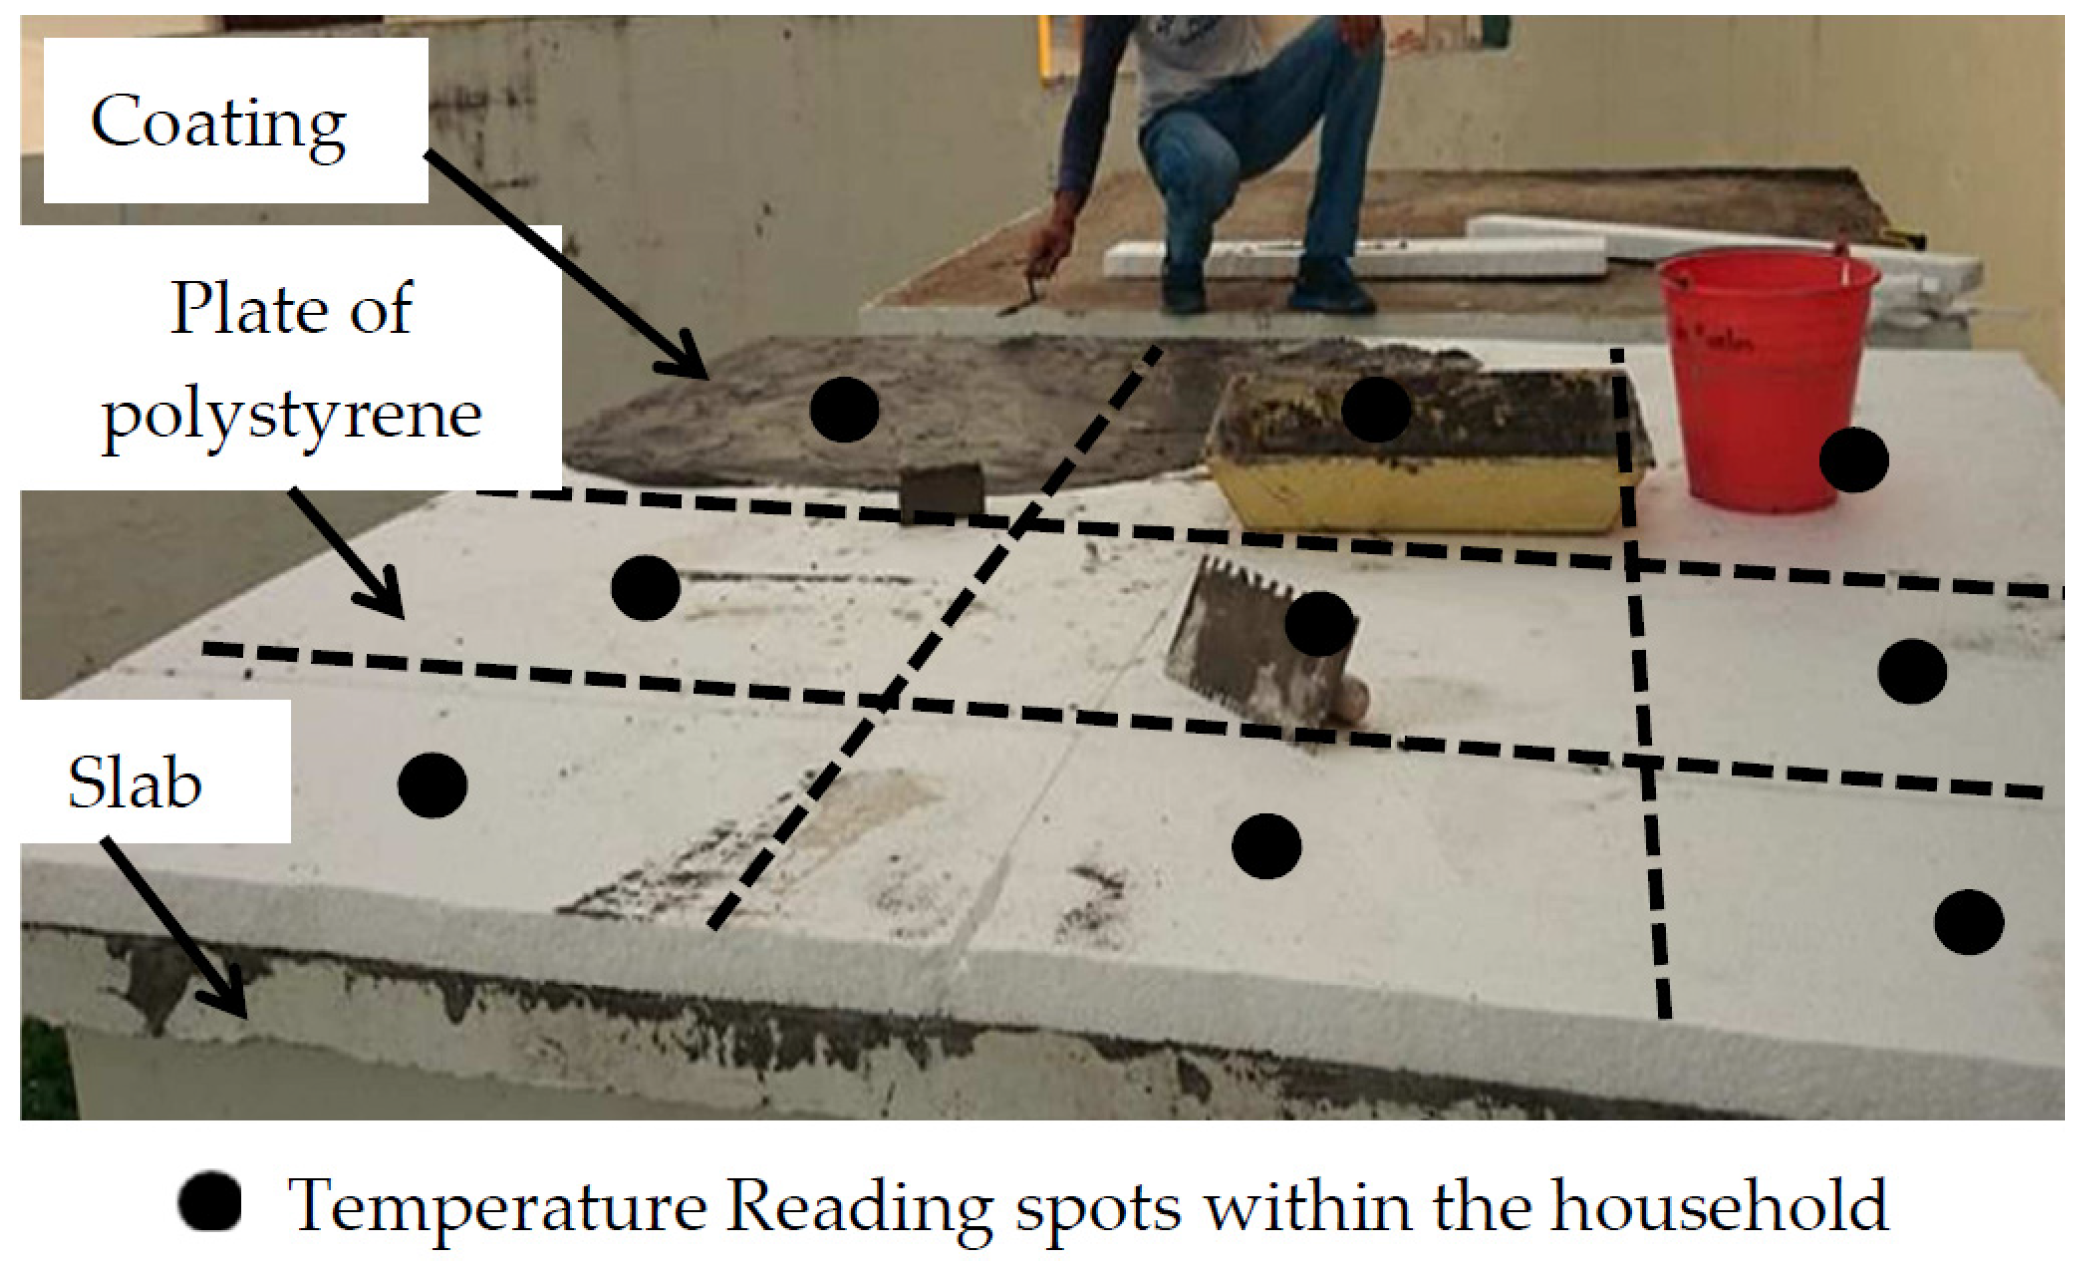
After 24 h, the plates were completely adhered to the slab and we proceeded to cut the remaining edges of the plates which overflowed the slab. Once the slab was completely covered and the edges were uniform, a coating was placed on top and at the edges of the plates for a greater fixation and to improve the appearance as a mortar based finish, with a relation of 1:7 (cement-sand), completely covering the plates and giving them a concrete-like appearance. Afterwards, the corresponding curing was performed, enabling the passive cooling system. In
Figure 4, this process is described.
The prototypes had no obstacles and on the east side of the area, and 3 m away from the experiment zone, there was a 2 m high wall.
The measurements of the prototypes were given as follows: 1.50 m high, 1.90 m wide, and 2.20 m long, with the following experimental conditions: 0.08 m thick reinforced concrete slab, with a 0.50 m × 0.50 m window, a 1.5 m high and 0.5 m wide door; slab dimensions of 1.9 m wide and 2.20 m long with 15 cm thick walls, built with annealed clay bricks, with a compressive strength of 42 kg/cm
2, and with a mortar and sand based coating in a 1:7 ratio. During the temperature fluctuation monitoring, the prototypes were unoccupied.
Figure 4 shows the distribution of the temperature measuring points in the inner part of the prototype.
2.3. Temperature Monitoring
Once both passive cooling systems were placed over the concrete slabs, we proceeded to take temperature readings, both on the PCS models and the model without storage (regular slab). Such readings were taken in the inner part of the slab of the experimental model (house), at intervals of one hour in between each reading, from 08:00 to 20:00 during the Daylight Saving Time Schedule, for a 20-day period, from 4 to 24 August 2015, during summer. Solar radiation at the experiment zone during the monitoring period was 5.1 kWh/m
2-day [
57].
Such readings were taken at nine different points uniformly distributed on the slab, covering a 2.7 m2 (1.5 m × 1.8 m) area. The reading and measurement equipment consisted of PASCO Xplorer GLX model thermometers, with a measure range from −10 °C to 40 °C and an accuracy of 0.01 °C; additionally, relative humidity readings were taken as well as general temperature inside the models, with a EXTECH EasyView20 hygro thermometer, with a range and resolution from 10.0% to 95.0% RH and an accuracy of ±3% RH (at 25 °C, 30% to 95% RH), and temperature from −4 °F to 140 °F (−20 °C to 60 °C) and accuracy of ±1 °C.
2.4. Statistical Analysis
A statistical analysis had to be performed so as to verify the efficiency of the cooling systems, to analyze data and to extract the significant differences amongst the experimental conditions. In order to study data collected from the temperature readings performed on the systems, a statistical analysis was carried out and data were collected, such as: arithmetic average, mean, variance, standard deviation, minimum, maximum, range, interquartile range, asymmetry, kurtosis, normality testing, T student testing, etc. These statistical analyses were performed with SPSS software (Statistical Product and Service Solutions).
2.5. Thermal Comfort Degree Analysis
Most people are comfortable within an environment with a relative humidity between 30% and 70%, and a temperature range between 21 °C and 29 °C. By locating the spots of these conditions on the psychrometric chart, an area known as comfort area is delimited [
58,
59]. By verifying each obtained spot for each relative humidity-temperature relation of the dry bulb located in the graphic, we can obtain the enthalpy difference to a saturation of kJ/kg dry air that might exist in between the location point and the closest point located within the thermal comfort zone. We call this difference delta
h. If delta
h is equal to zero, it is considered that the comfort degree is reached, but if it is different from zero, it is not within the comfort zone. The higher the value, the greater the lack of comfort is, therefore, the greater the energy will be needed to cancel the thermal charge inside the house to achieve that comfort zone. Finally, by adding delta
h to each one of the experimental modules, it is indicated that if the sum is equal to zero, then it is determined that the system achieves the conditions for necessary thermal comfort of the human body inside the room. If the value is different from zero, the system is not considered efficient enough to achieve a comfort zone. The further delta h is from zero, the harder it is to achieve a comfortable environment.
To determine the level of thermal comfort for the human body inside the experimental models, the psychrometric chart was used at normal temperatures and a barometric pressure of 101.325 kPa (sea level) since these are the crucial characteristics for the study zone where this research was performed. The experiment consisted of obtaining the arithmetic means of relative humidity and dry bulb temperature inside the experimental module. Once the relationship relative humidity-temperature of the dry bulb was obtained per hour, we proceeded to the location of each point on the psychrometric chart. Human beings will be comfortable under a variety of temperature and humidity combinations.
2.6. Fractal Analysis
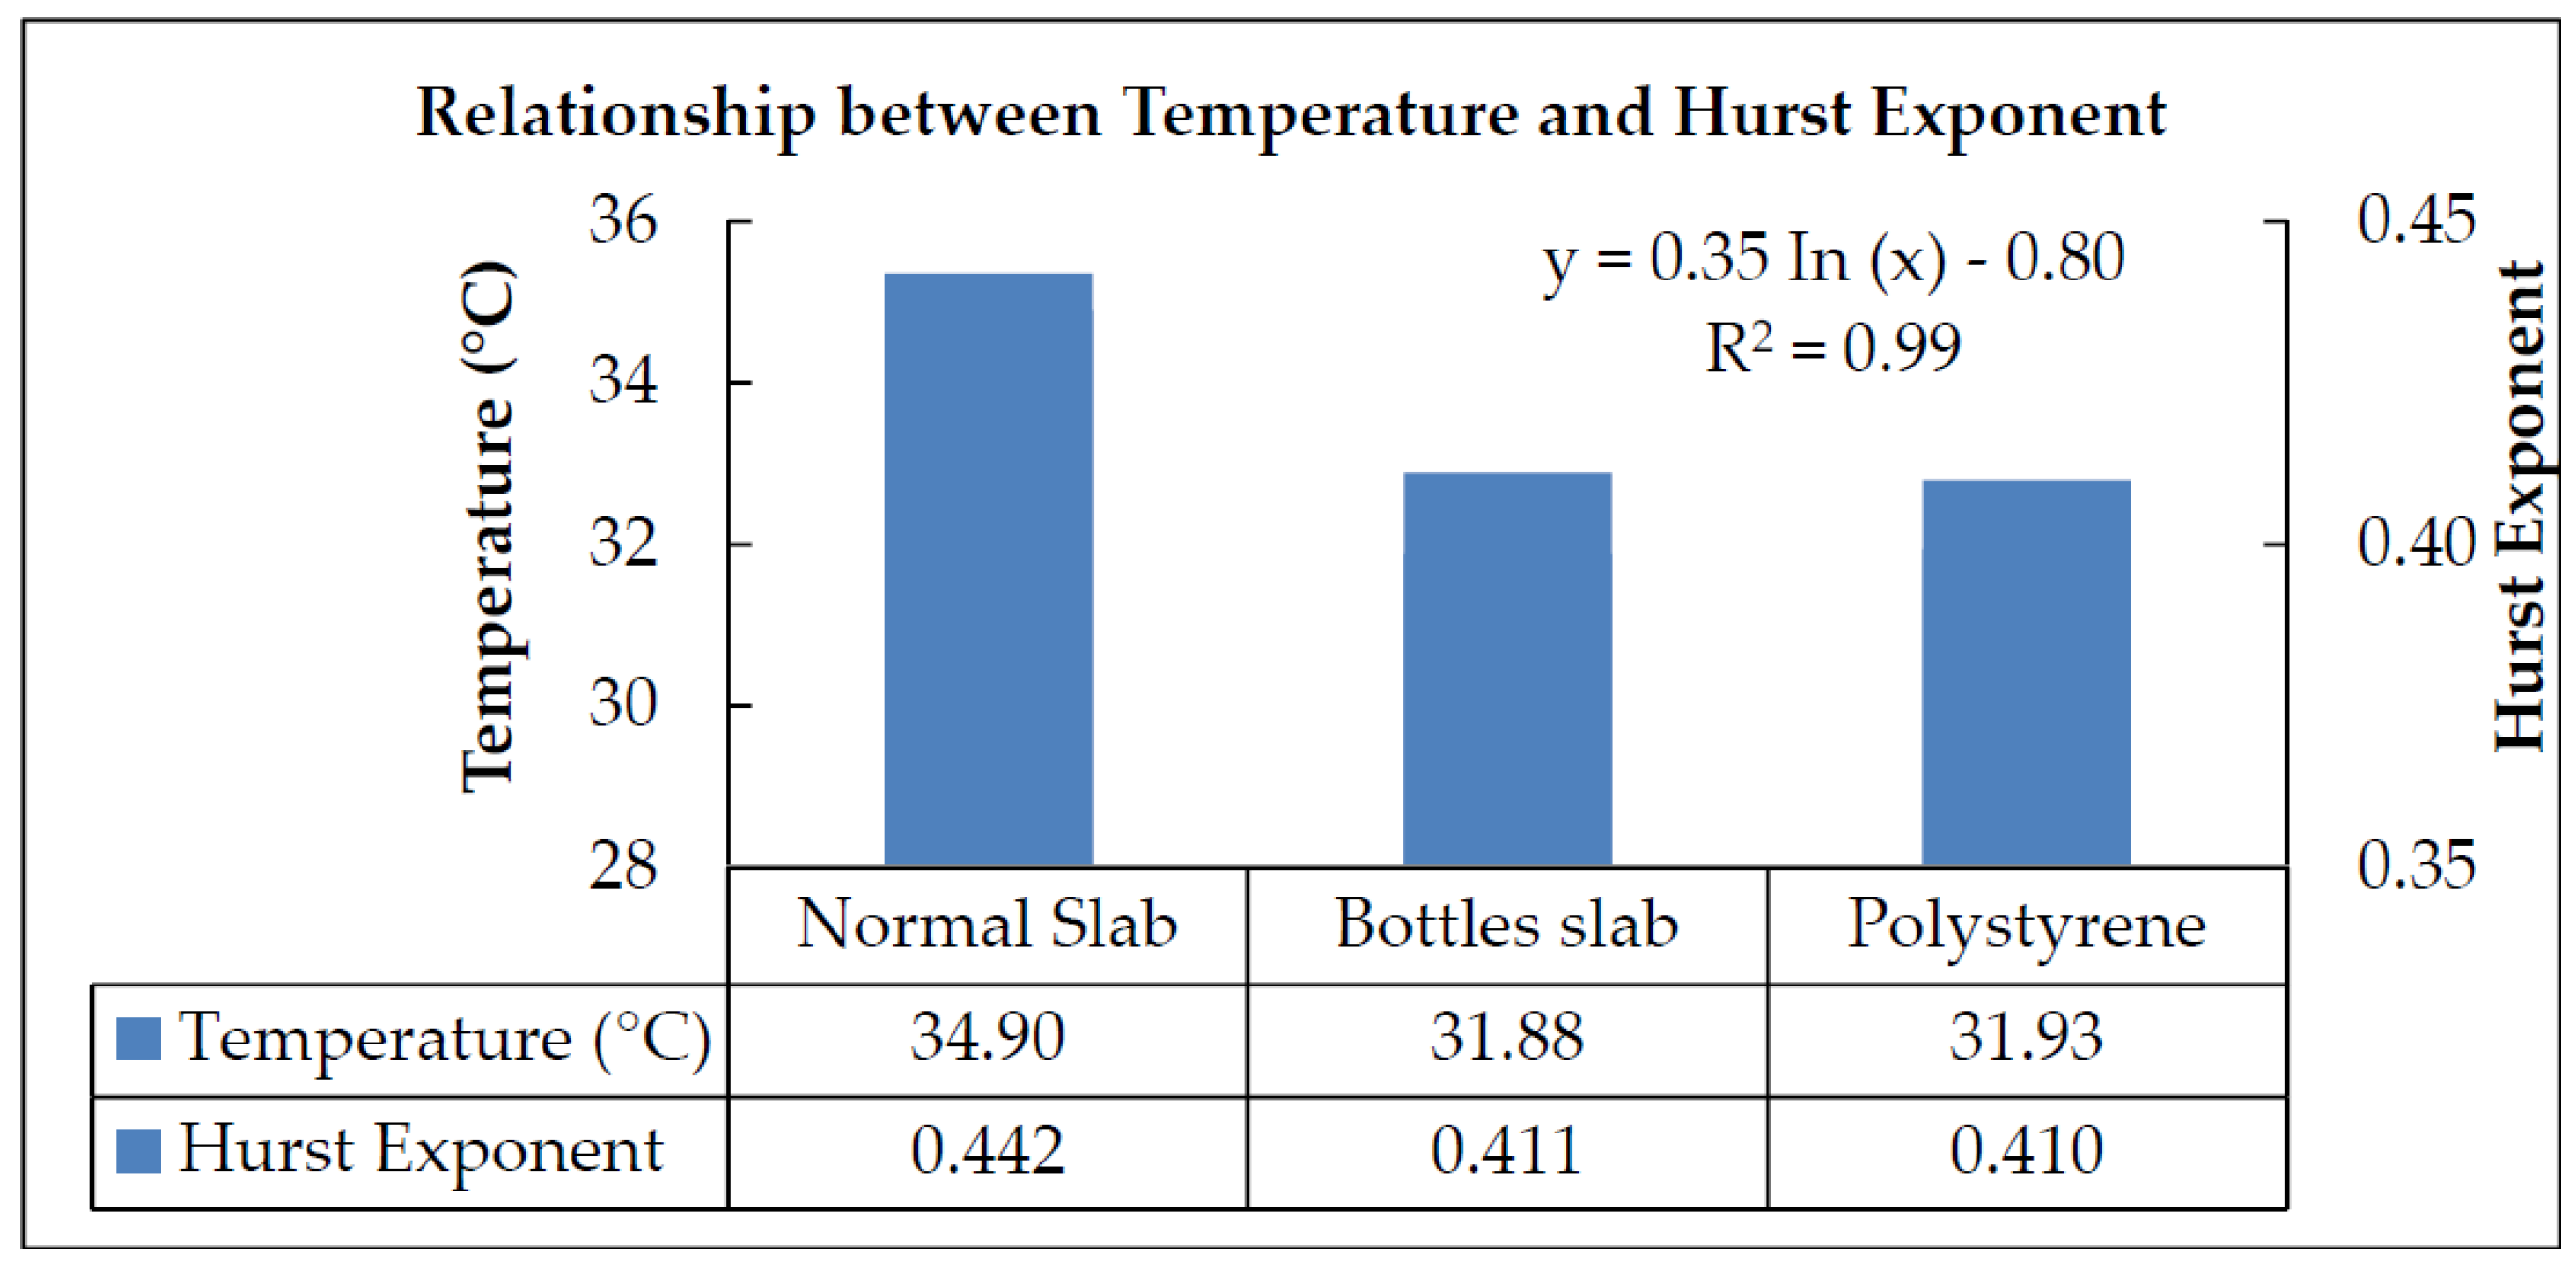
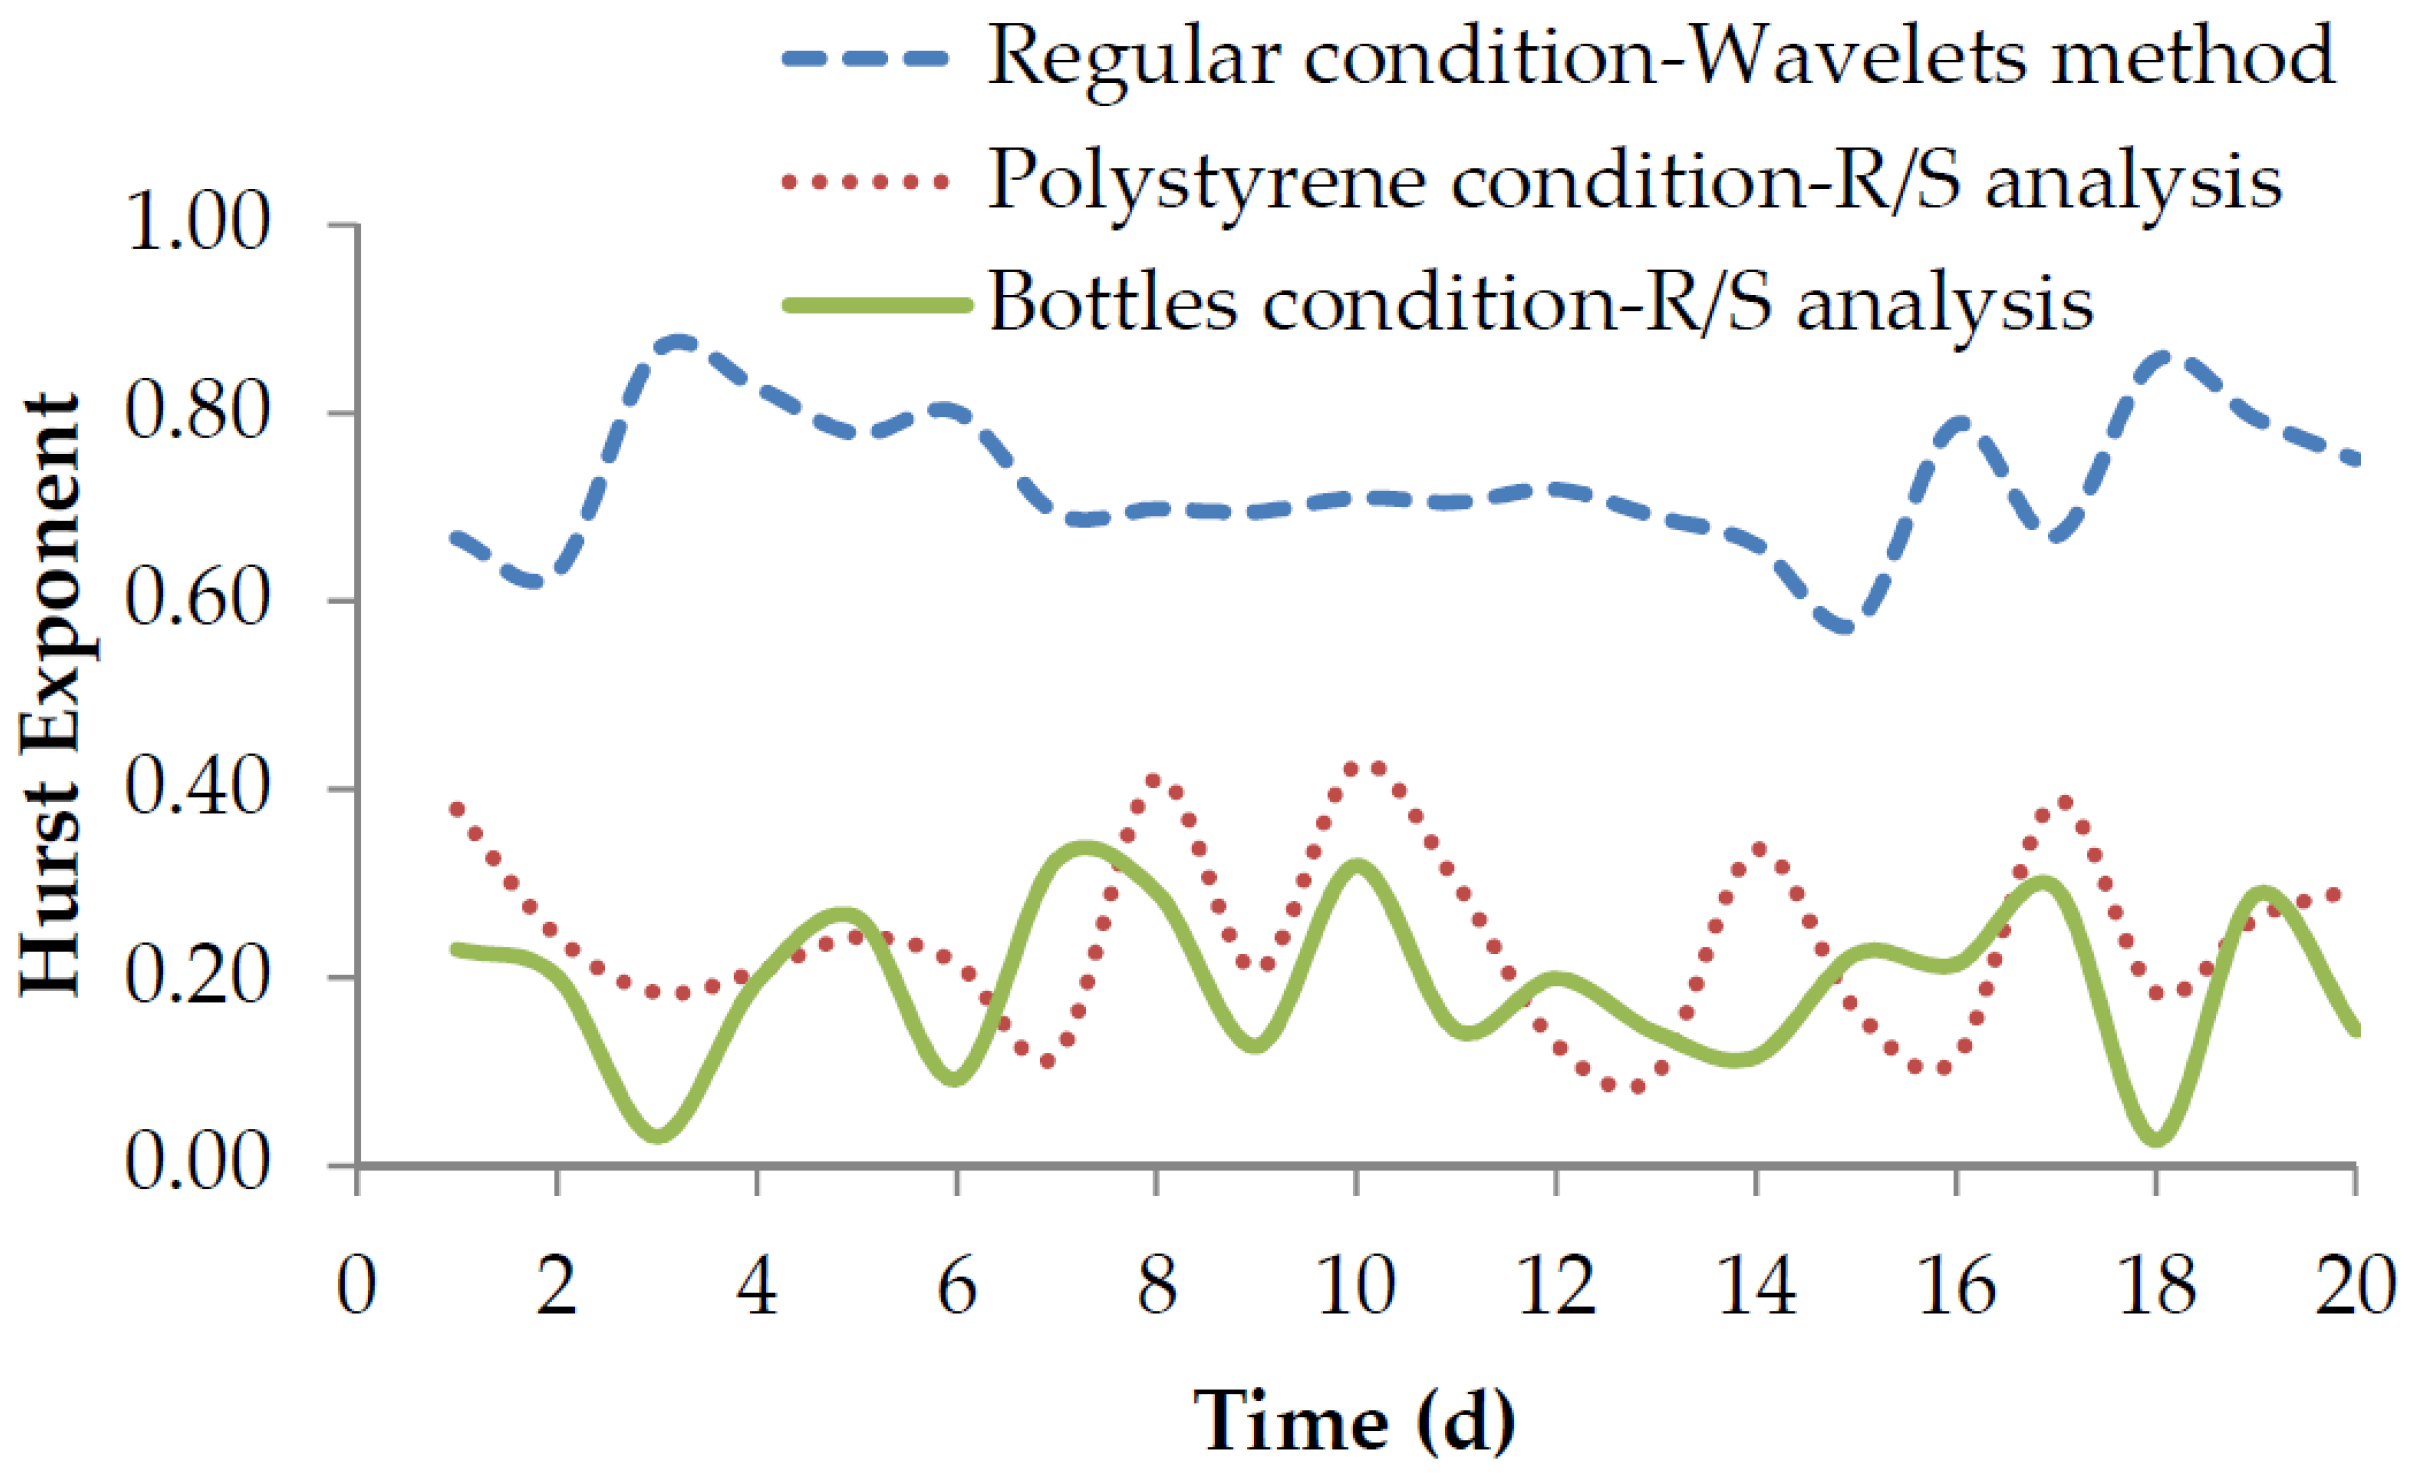
Fractal analysis was performed with the Benoit version 1.3 software for each database of the temperature fluctuation monitoring corresponding to each experimental module. The purpose of the fractal analysis is to determine statistic correlations and to describe the main attributes of the experimental variables and the fractal parameters (in this case the Hurst exponent (H) and fractal dimension) and then to obtain the appropriate fractal methodology for each storage system. With H, the persistence or anti-persistence of the database information is obtained and the intensity of the long term dependence is measured, according to its magnitude. Time series are classified as persistent (0.5 < H < 1) and anti-persistent (0 < H < 0.5). In case H = 0.5 it can be said that time series are random and non-correlated. The performed Fractal analysis methods were rescaled range and wavelets:
Rescaled Range (R/S): the R/S analysis is used to calculate the Hurst exponent, from the value of the fractal dimension in a series of time. Once the data is processed, the new outcome file shows the value of the Hurst exponent (H), the fractal dimension (DR/S) and the standard deviation (SD). The R/S method divides the time series into intervals or w (windows), measuring two quantities on each one of them:
R(w), the range of values taken by and at w interval, which are measured with regard to the trend of its general variation within the window; this trend is simply estimated from the analysis of the line that connects the first and last point of the segment of the series analyzed within the corresponding window. This procedure subtracts the average of the trend presented in the window.
S(w), the standard deviation of the values observed within the w window.
The equation used to calculate the re-scaled R/S(w) range of the data is as follows:
where the brackets [] denote the mean average of all the performances (Benoit, Version 1.3 [
55]). Fractal dimension (D
R/S) is calculated from its relation with the Hurst exponent (H):
where: D
R/S is the fractal dimension estimated by the rescaled range method; H is Hurst exponent.
Wavelet method: The wavelet method is a tool that allows us to analyze localized variations of the power law exponent, relating the data through the decomposition of the time series within time-space. This decomposition is useful to determine the types of variability that dominate in a data series, as well as its time dynamics. This is the appropriate method for the analysis of non-stationary traces/series, where the variance is not constant in relation to the increase in size of the data analysis window. The method considers n transformed to wavelets, each one with its own and different scaling coefficient a
i, where S
1, S
2, …, Sn are the standard deviations as of the respective scaling coefficients. The variation rate and the standard deviations G1, G2, …, Gn−1 are defined as:
The average value of Gi is estimated as shown in the following equation:
The Hurst exponent (H) as
where f is a heuristic function in which Hurst exponent estimates are given by Gaverage for the stochastic traces. Hurst exponent is related with the fractal dimension as follows:
4. Discussion
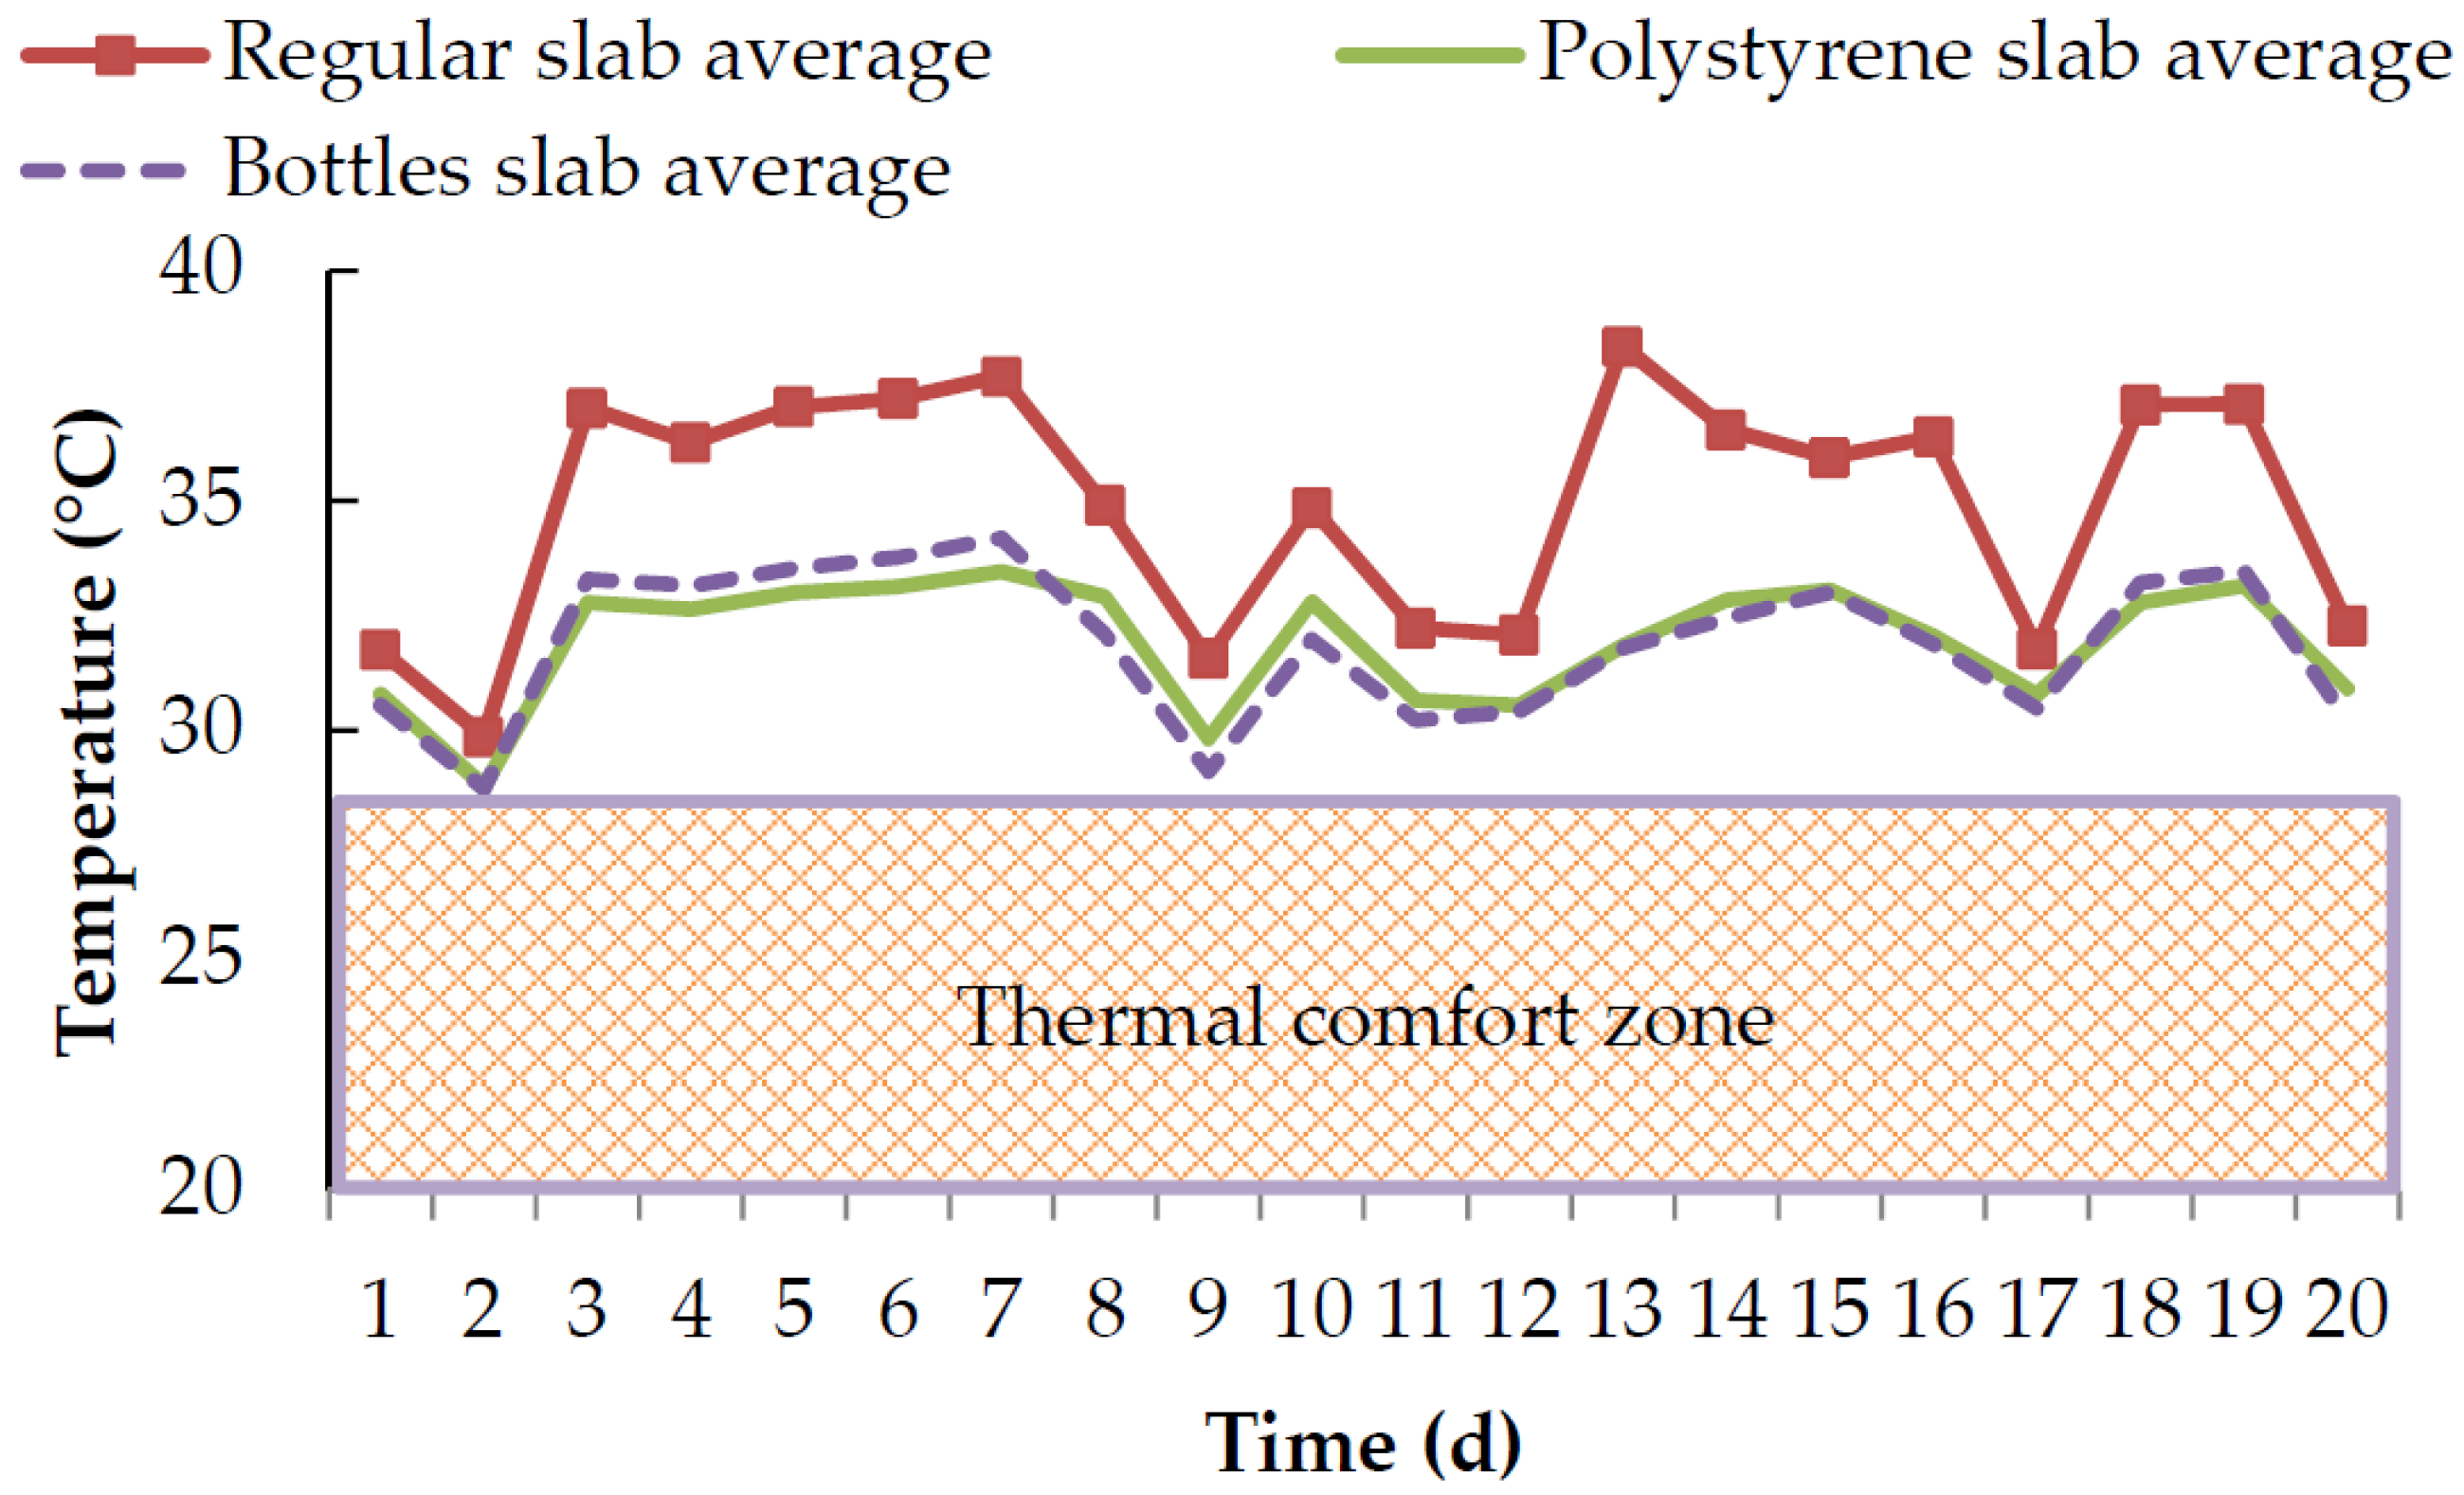
With the gathered data from comparing the PCS experimental modules in comparison with the NTSRS, it is clear that the PCS provide a better thermal behavior to the slabs, achieving a 17% temperature decrease inside the housing, with a maximum difference of 7 °C in the most critical time frame (between 16:00 and 18:00). The experimental psychrometric data, such as relative humidity percentage and dry bulb temperature were very important when determining the degree of thermal comfort within the PCS and NTSRS prototypes. Since thermal comfort is based on both relative humidity percentage and dry bulb temperature, we can calculate the enthalpy and heat that need to be removed in order to reach a thermal comfort, and consequently, calculate energy consumption and electrical cooling device investment, contributing to a sustainable energy use and encouraging the material recycling culture, such as PET. With the fractal techniques such as the Wavelet method and the R/S analysis method, significant data regarding temperature fluctuations for each analyzed prototype were extracted in order to determine the persistence of experimental data and temperature changes.
The temperature fluctuation monitoring from the diverse analyzed storage systems was made in August, since it is the month where the highest temperatures are registered in the experiment zone. However, although no other experimental data from other months were registered, this study establishes the methodological bases to be done in different periods and regions of the world. PCSs are low cost systems that can be installed in low resources areas, where, in many cases, buying sophisticated cooling systems (minisplits) is not possible. In addition, where they contribute to energy saving, as is the case here, a sustainable economic benefit can be observed.
The PCSs are economic and easy-to-install systems which present meaningful advantages regarding other thermal storage systems such as green roofs in which a constant maintenance is required, and with a high water consumption which is not sustainable in arid or semi-desert areas, in addition to these devices being affected by evapotranspiration [
60]. Another example of storage systems is the DOMOTEJ [
61] in which space materials and qualified personnel are needed for its installation, which make it an affordable system.
A meaningful difference between our research and others is the analysis of the persistence of experimental data from temperature fluctuations inside homes based on Hurst’s Exponent extracted with fractal geometry. Fractal geometry includes all the information in a statistical way, extracting just a value of the persistence from the analyzed system. This value is represented according to Hurst’s exponent and Fractal dimension. The methods that fitted to this systems were the rescaled range analysis for untreated systems and wavelets for PCSs.
In order to verify the system’s efficiency, a complete statistical analysis is made, where each statistical parameter is thoroughly debated, amongst them, standard deviation, kurtosis, mean and variance.
The lack of a thermal comfort state or a temperature fluctuation storage within households may generate a variety of diseases, such as heat stress, languidness, dehydration and so forth.
An annual thermal storage and economical savings estimation that PCSs offer was made using data shown in
Figure 6 where the air saturation enthalpy value, and the area below the curve for each one of the study cases are shown. Such values reflect the amount of heat which needs to be retrieved for each prototype to reach the thermal comfort zone.
When converting mathematical units, we showed that, for the NTSRS of the normal prototype, a consumption of 162.84 kWh is annually required, whereas with the PCSs with encapsulated water, 110.74 kWh are required and, for the PCS with polystyrene, 115.01 kWh are annually required.
Considering that the studied prototypes have a scaled dimension of 1:2 of an average household and readjusting initial values, it is inferred that in a normal household, 1302.72 kWh are annually required. However, if the proposed PCSs with encapsulated water are installed in the aforementioned room, only 885.92 kWh will need to be retrieved (or 920.08 kWh for the polystyrene one). This data, multiplied by the cost of kWh in the location where these systems are installed will reveal the necessary amount of money to attain a comfort zone, and the difference between the normal household and the one with installed PCSs will indicate the economical and thermal storage.
Particularly speaking about Mexico, the zone where this research was done, an average fee of $0.956 per kWh is established. Therefore, an average room incurs an annual cost of $1245.40 whereas with encapsulated water and polystyrene PCSs $846.93 and $875.59 are required, respectively. Note that these economical savings are applied only to a room but could substantially increase if the treatment is applied to all the slabs in a house.
6. Conclusions
In this research, a sustainable and easy-to-install methodology was implemented to achieve passive thermal storage in concrete slabs within households, employing recycled and low-cost materials, which contribute to power and energy savings in air conditioning, thus achieving thermal storage within the household. Therefore, thermal comfort will be reached faster than if cooling devices are placed inside the household. The aforementioned methodology can be implemented anywhere in the world where high temperatures are found. Besides, PCSs can function as thermal storage systems during summer and heaters during winter, this just does not only contribute to energy saving but to improve the quality of life for inhabitants.
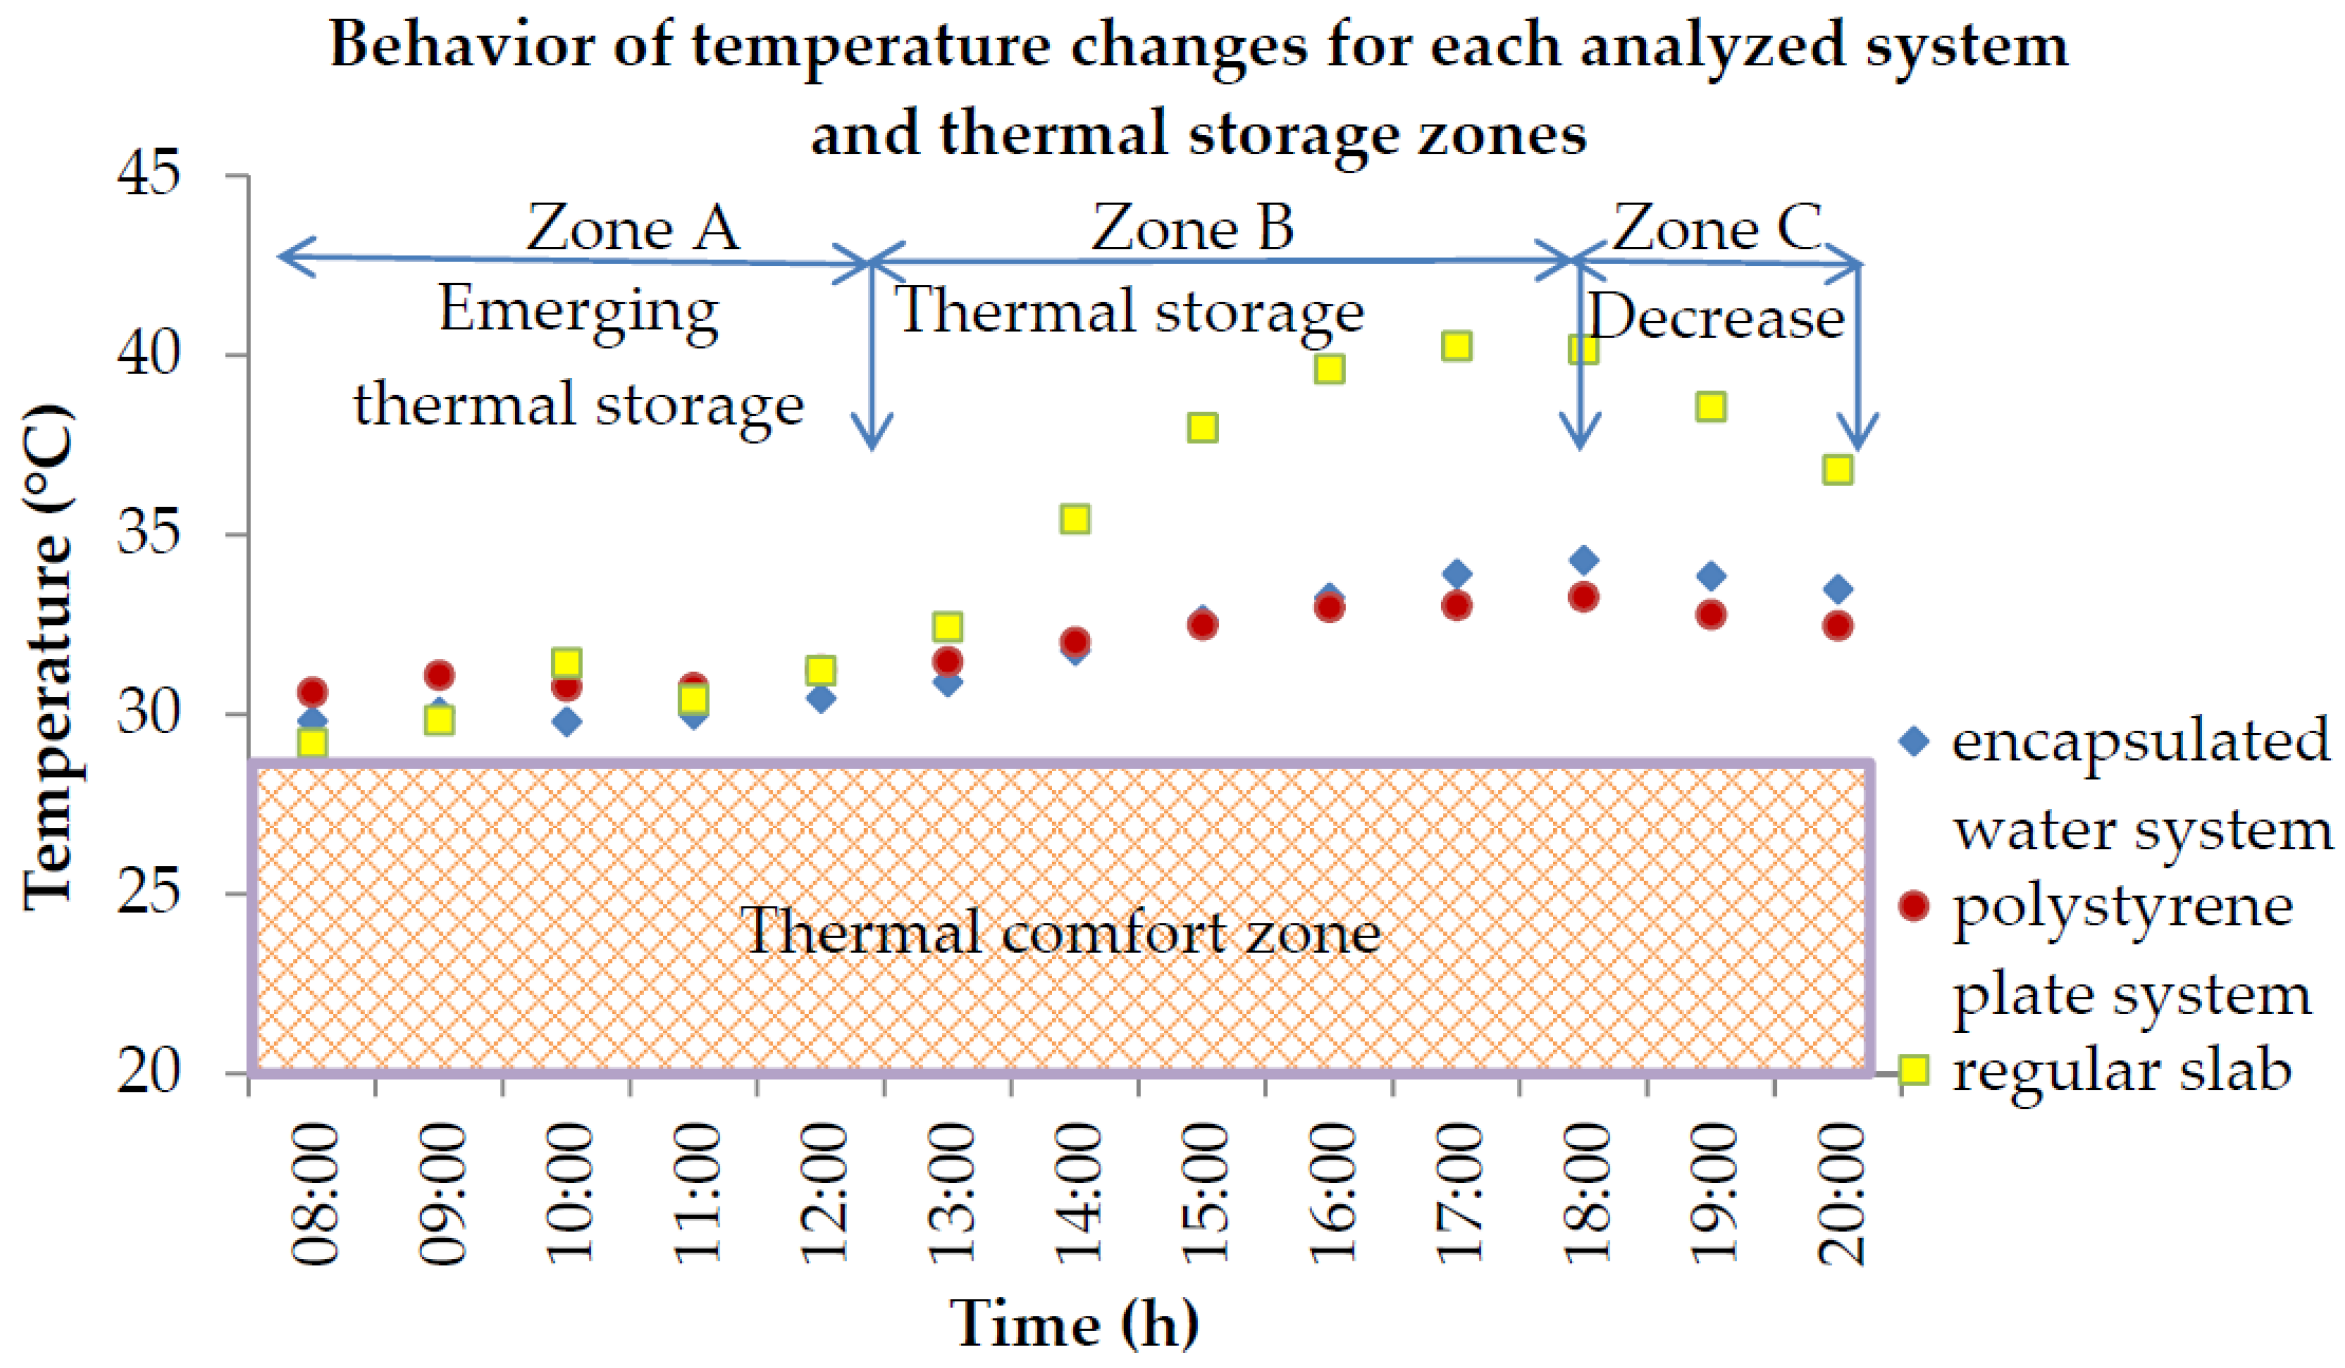
In the graphic representations of the gathered data about temperature changes for each one of the systems, it was observed that the PCSs are closer to the comfort zone which is in a range between 21 °C and 29 °C in addition to a relative humidity of 30% and 70% as shown in
Figure 6, showing that these systems are an efficient tool to reduce temperature within households. The experimental analysis period in which the psychrometric variables were monitored was during the month of August because it is considered to be the month with the highest temperatures throughout the year, which enabled us to extract energy savings data employing passive thermal storage techniques.
Encapsulated water and polystyrene plates PCSs applied to rooftop slabs on housing encourage temperature reduction. Therefore, inside the house, the need for electrical appliances such as fans and air-conditioning devices (which require an initial starting cost and a constant expense for their maintenance) is reduced, as are CO2 emissions to the atmosphere, and an economical saving is generated. The use of a 12660672 J air-conditioning device (mini-split) for 8 h on a daily basis, represents an estimated monthly consumption of 278 kWh, which based on the standard fee of electrical energy consumption for domestic use, reflects a saving of approximately 200 MXN (10.22 EUR) per month, equivalent to 2.73 times the minimum wage in Mexico. The previously mentioned benefits increase energetic sustainability in housing units and also economic sustainability for users.
With the implemented psychometrical study on the prototypes it is possible to quantify the charge of heat saturation in the air that is needed to be retrieved from the houses to reach thermal comfort and with it, also measure the electrical consumption and investment in air conditioning devices in each room.
The recycling and sustainability culture are complied with, since the reuse of plastic PET bottles can be used for the encapsulated water based conditioning system, making this a low-cost device.
Nonetheless, these systems do not represent a definite solution for the problem, since none of the systems achieve thermal comfort by themselves. Moreover, this research can be continued, seeking a more favorable comfort temperature, by improving the design in experimental models.
The application of these systems is only viable to reinforced concrete slabs since the load placed over these slabs is considered to be a live load; such a load is below the maximum allowed capacity for reinforced concrete slabs.
The descriptive statistical analysis allowed us to establish the variations of the experimental data described according to the parameters of the standard deviation, mean, kurtosis and T student tests.
Fractal analysis allowed us to assess the series of temperature monitoring time, differentiating characteristics and fluctuations for each system (cooling NTSRS and PCS). Analyzed characteristics have a similar behavior to a distribution, which allows us to define them as fractal statistical. The analyzed fractal parameters were the Hurst exponent and the Fractal Dimension by the rescaled range and wavelets method. The PCS presented a self-correlation marked with the rescaled range method; and, in the case of the NTSRS, the wavelets method works better. Temperature fluctuations are similar to the Hurst exponent values, denoting the statistical efficiency of the results presented in this research.


