
Analysis of Water Resources in Horqin Sandy Land Using Multisource Data from 2003 to 2010


Abstract
:1. Introduction
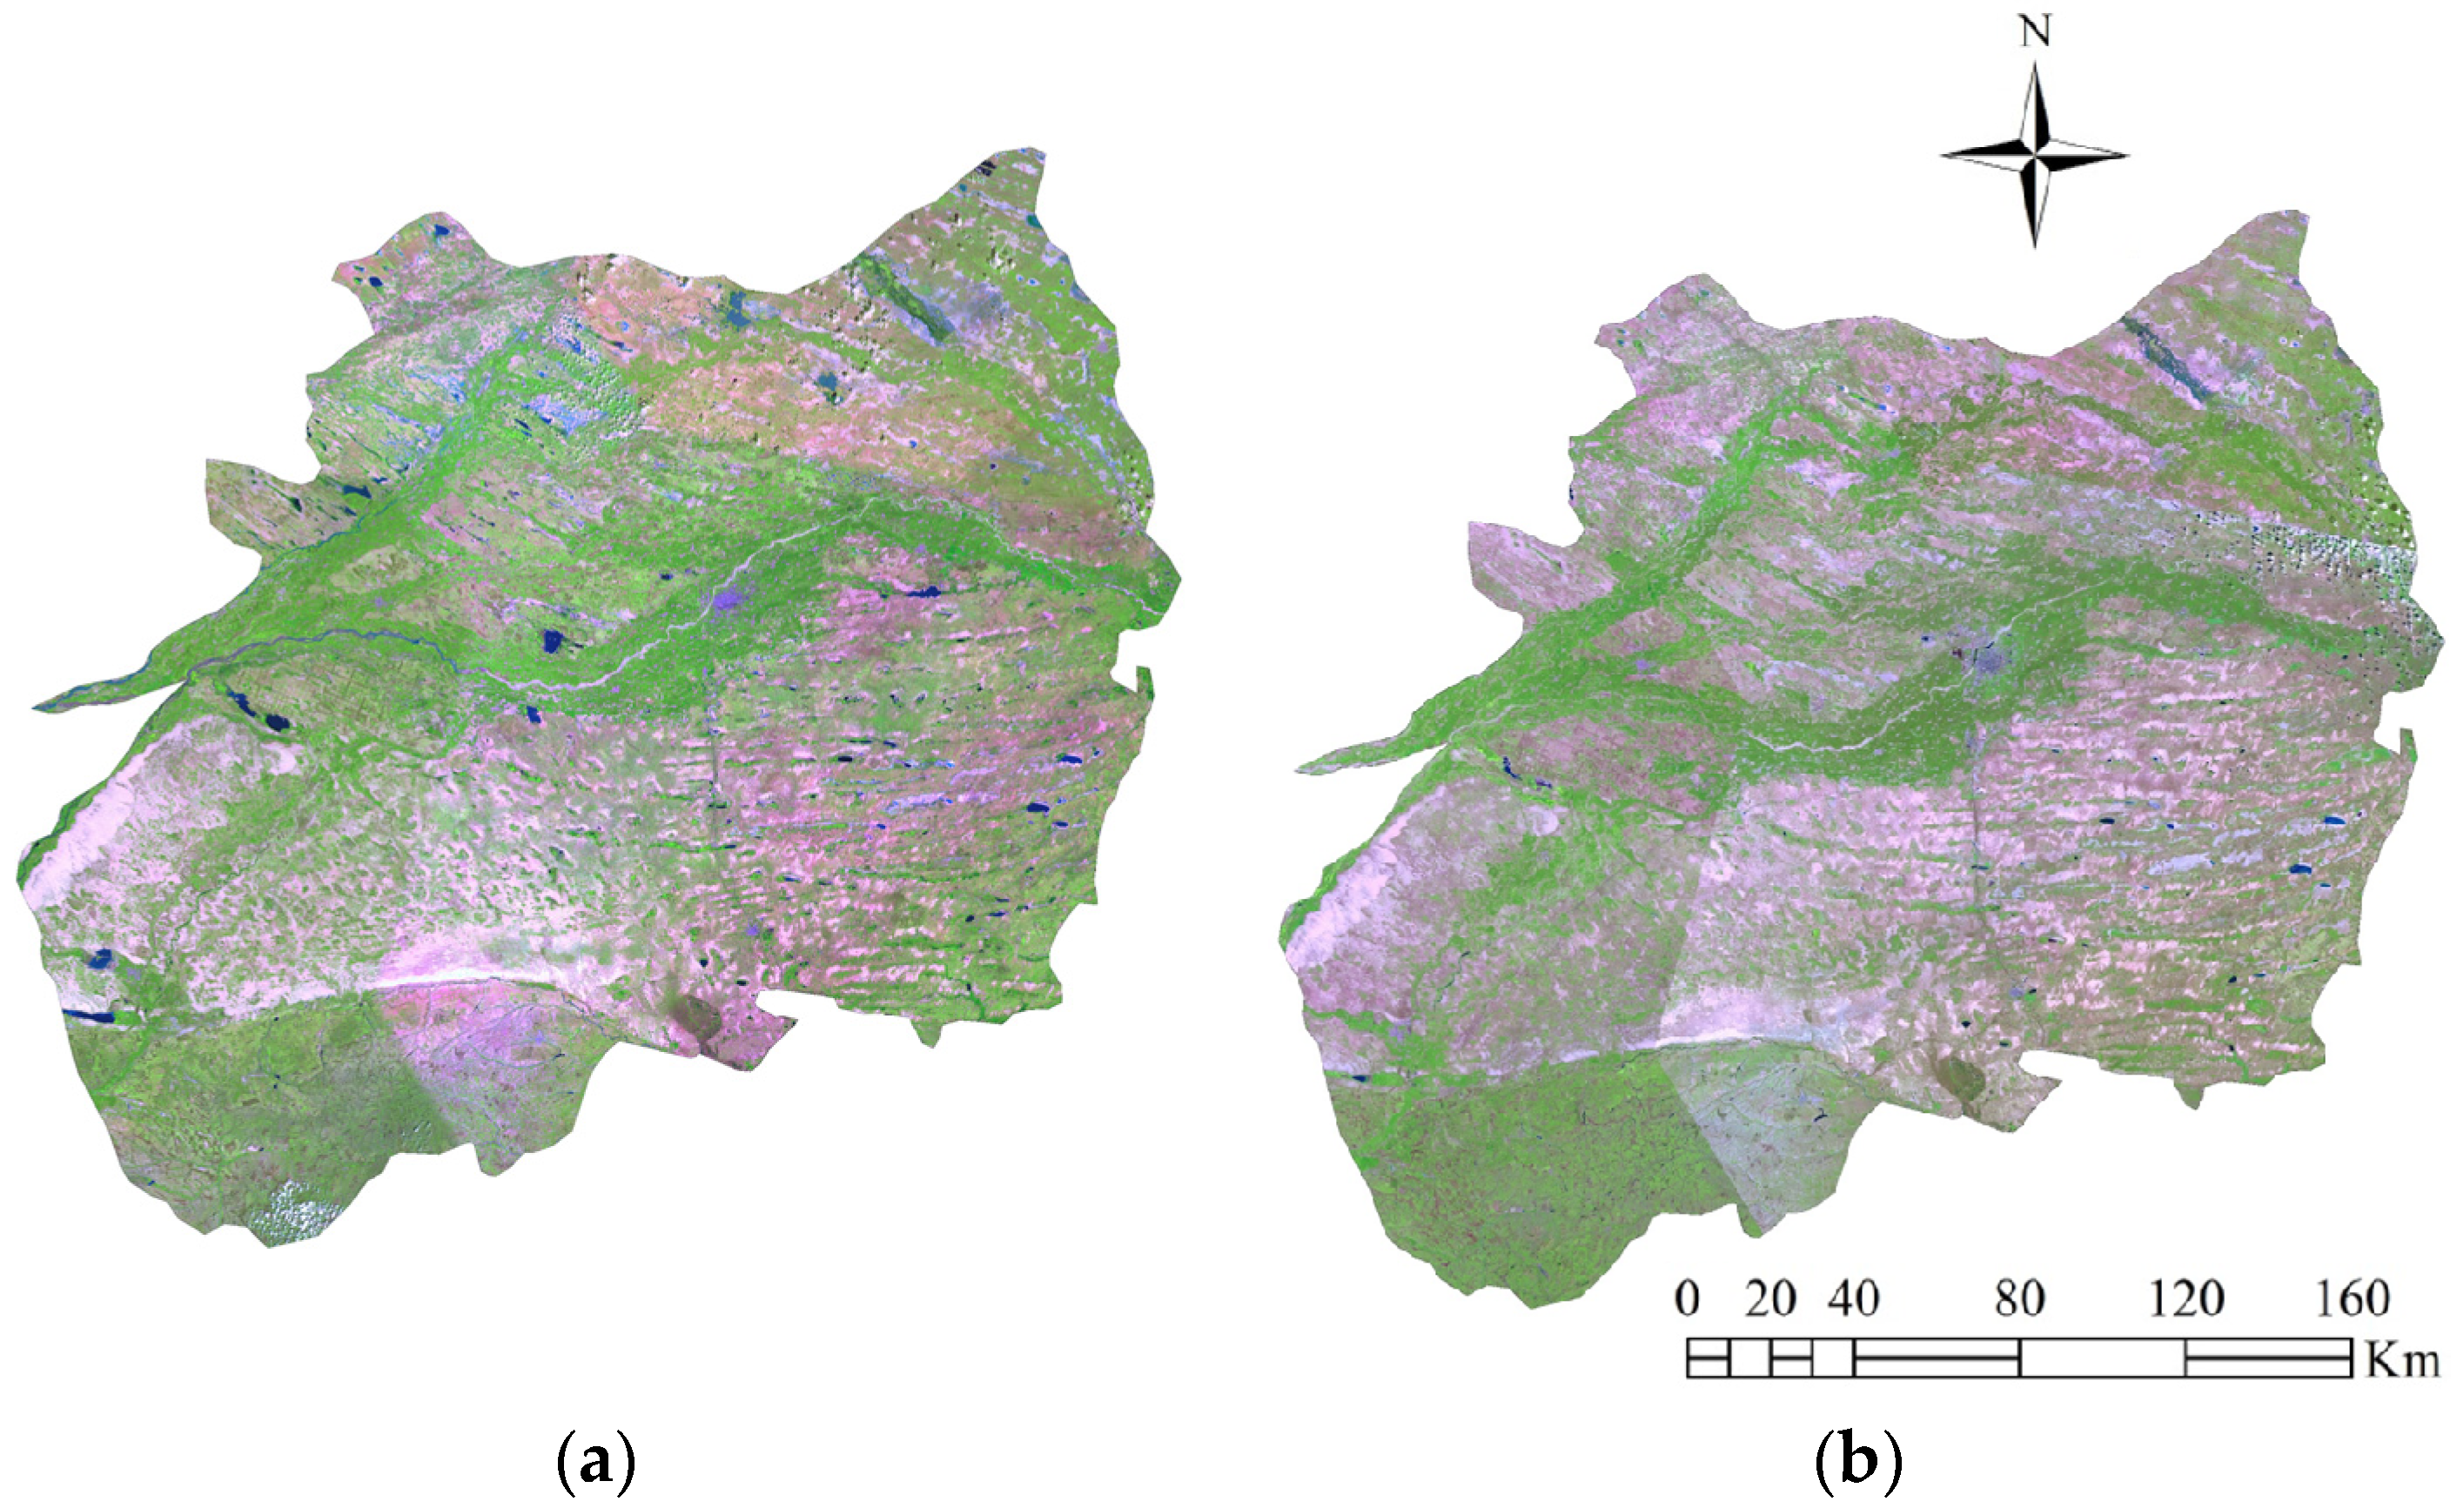
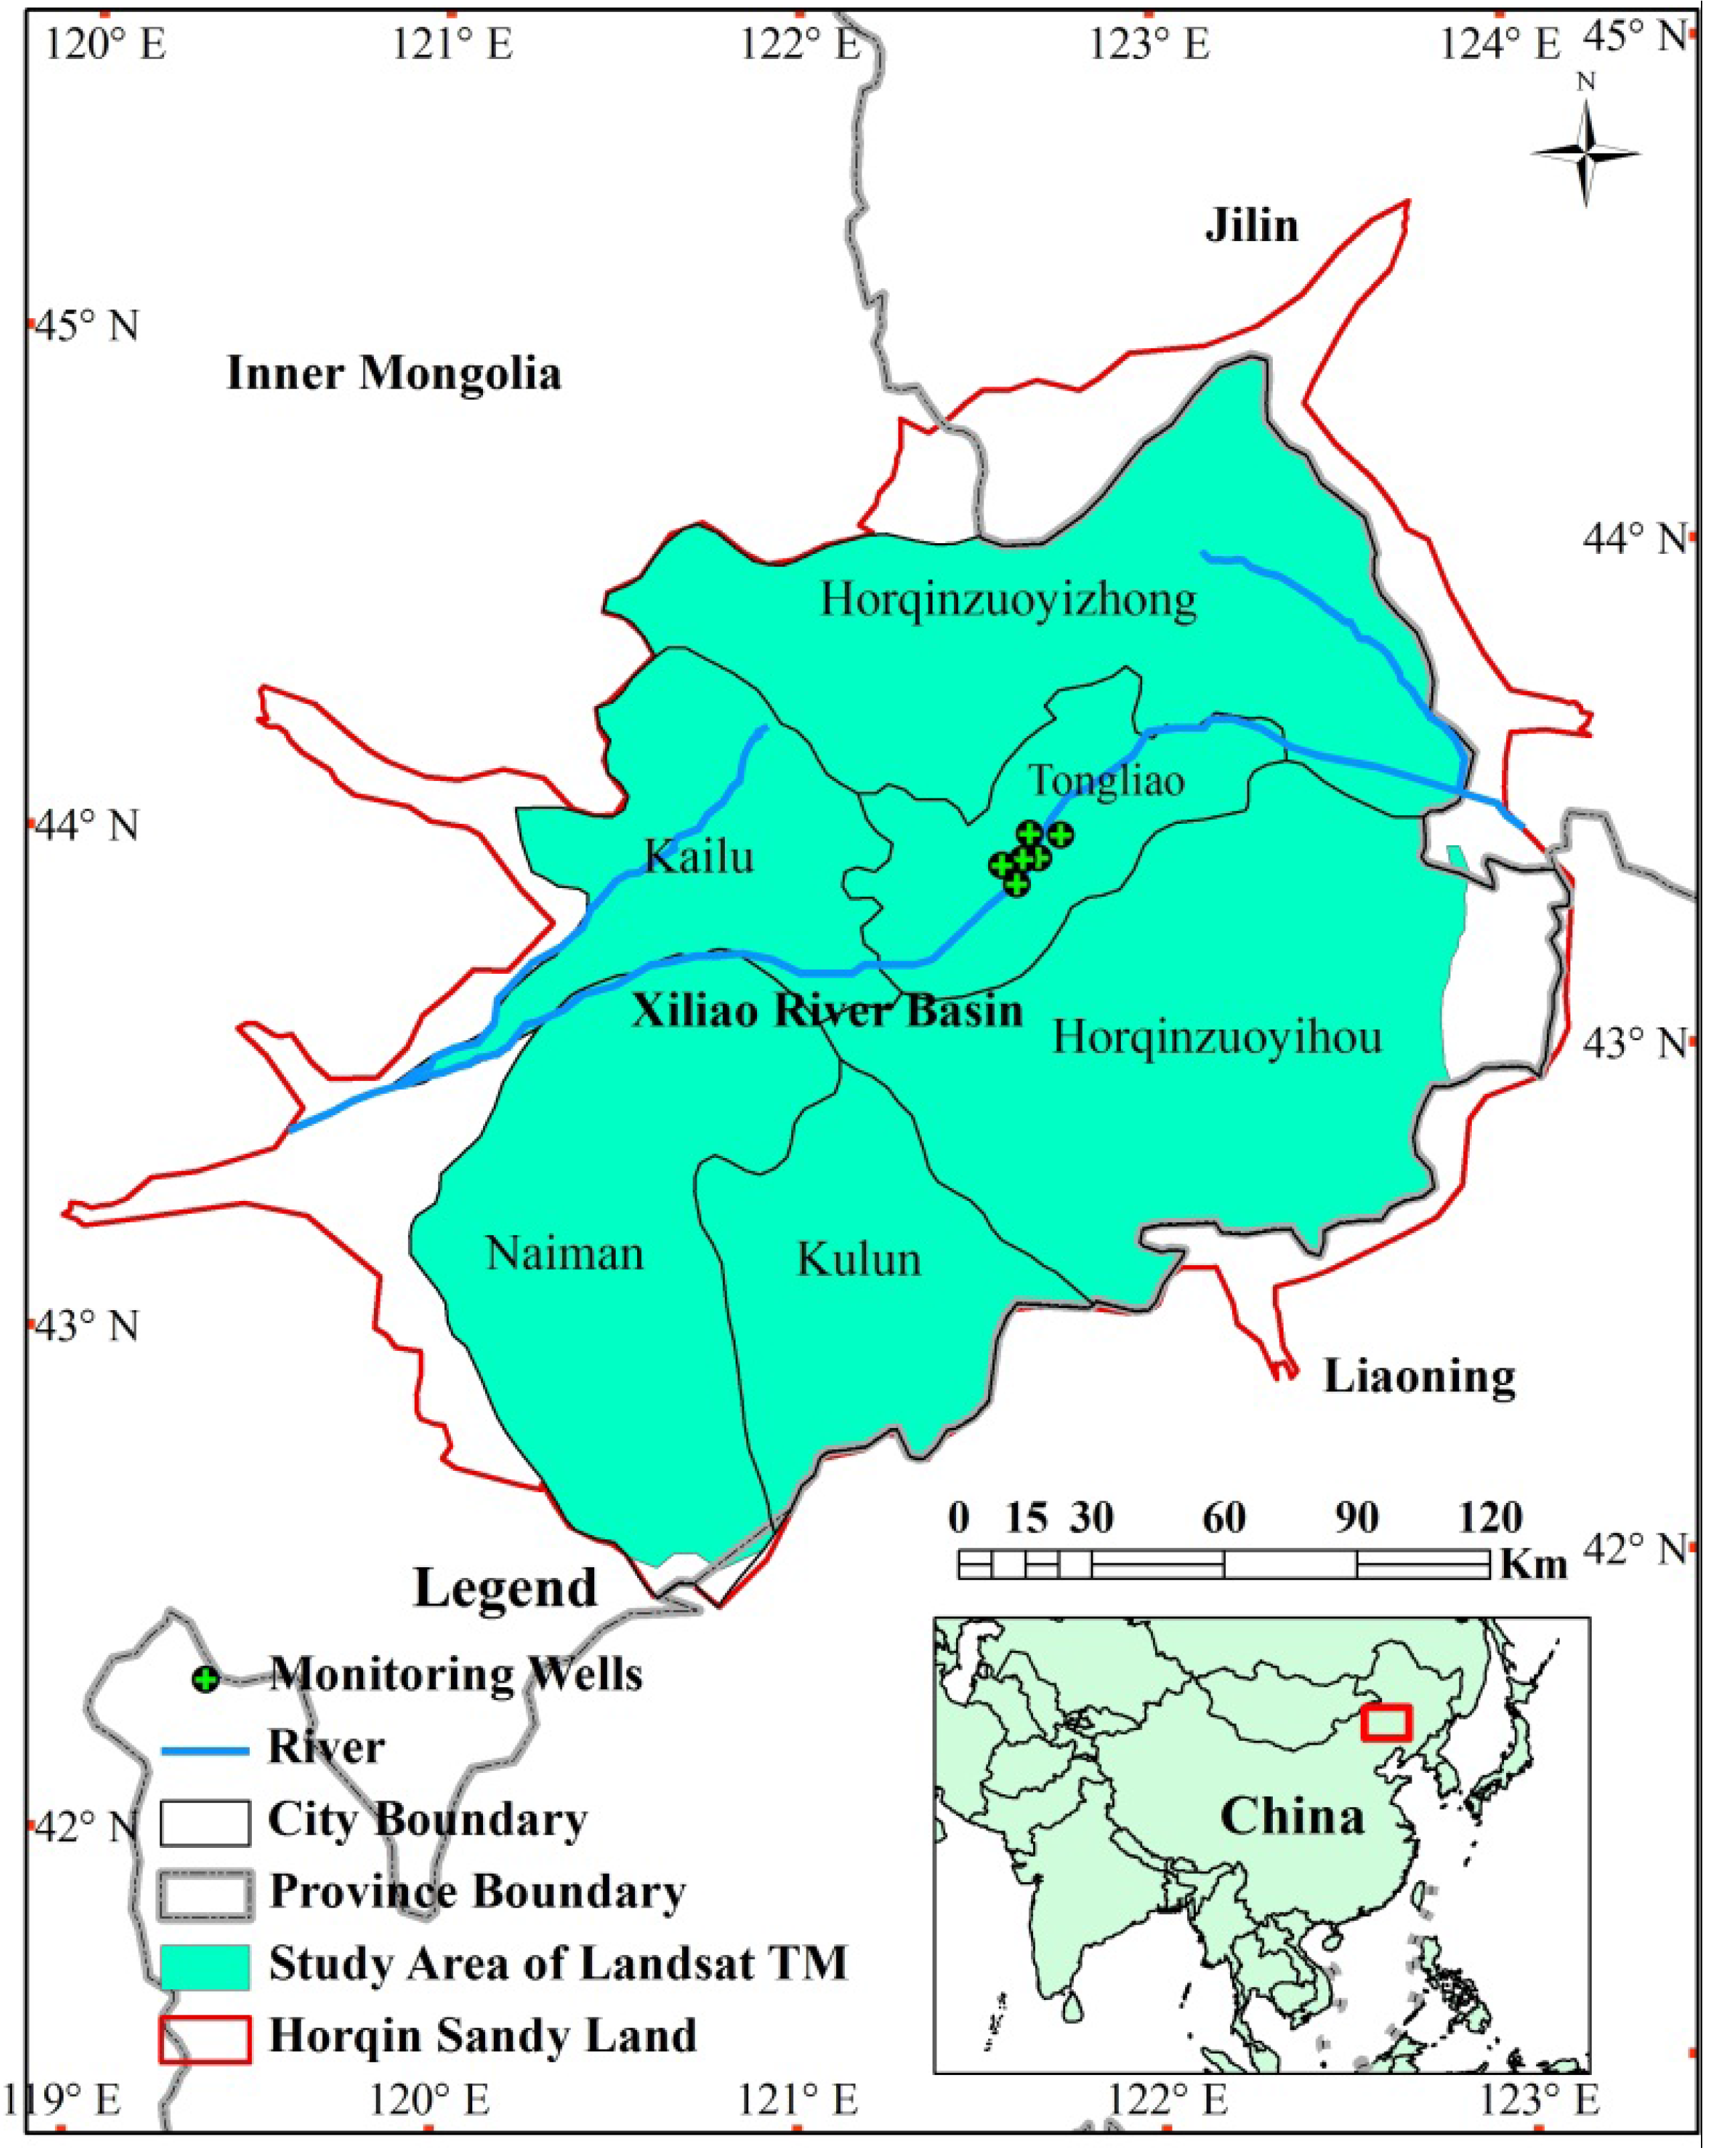
2. Study Area
3. Data and Method
3.1. GRACE Data
3.2. Groundwater Level Data
3.3. Hydrological Models
3.4. Landsat TM and Preprocessing
3.5. LU/LC Change Detection
4. Results and Discussion
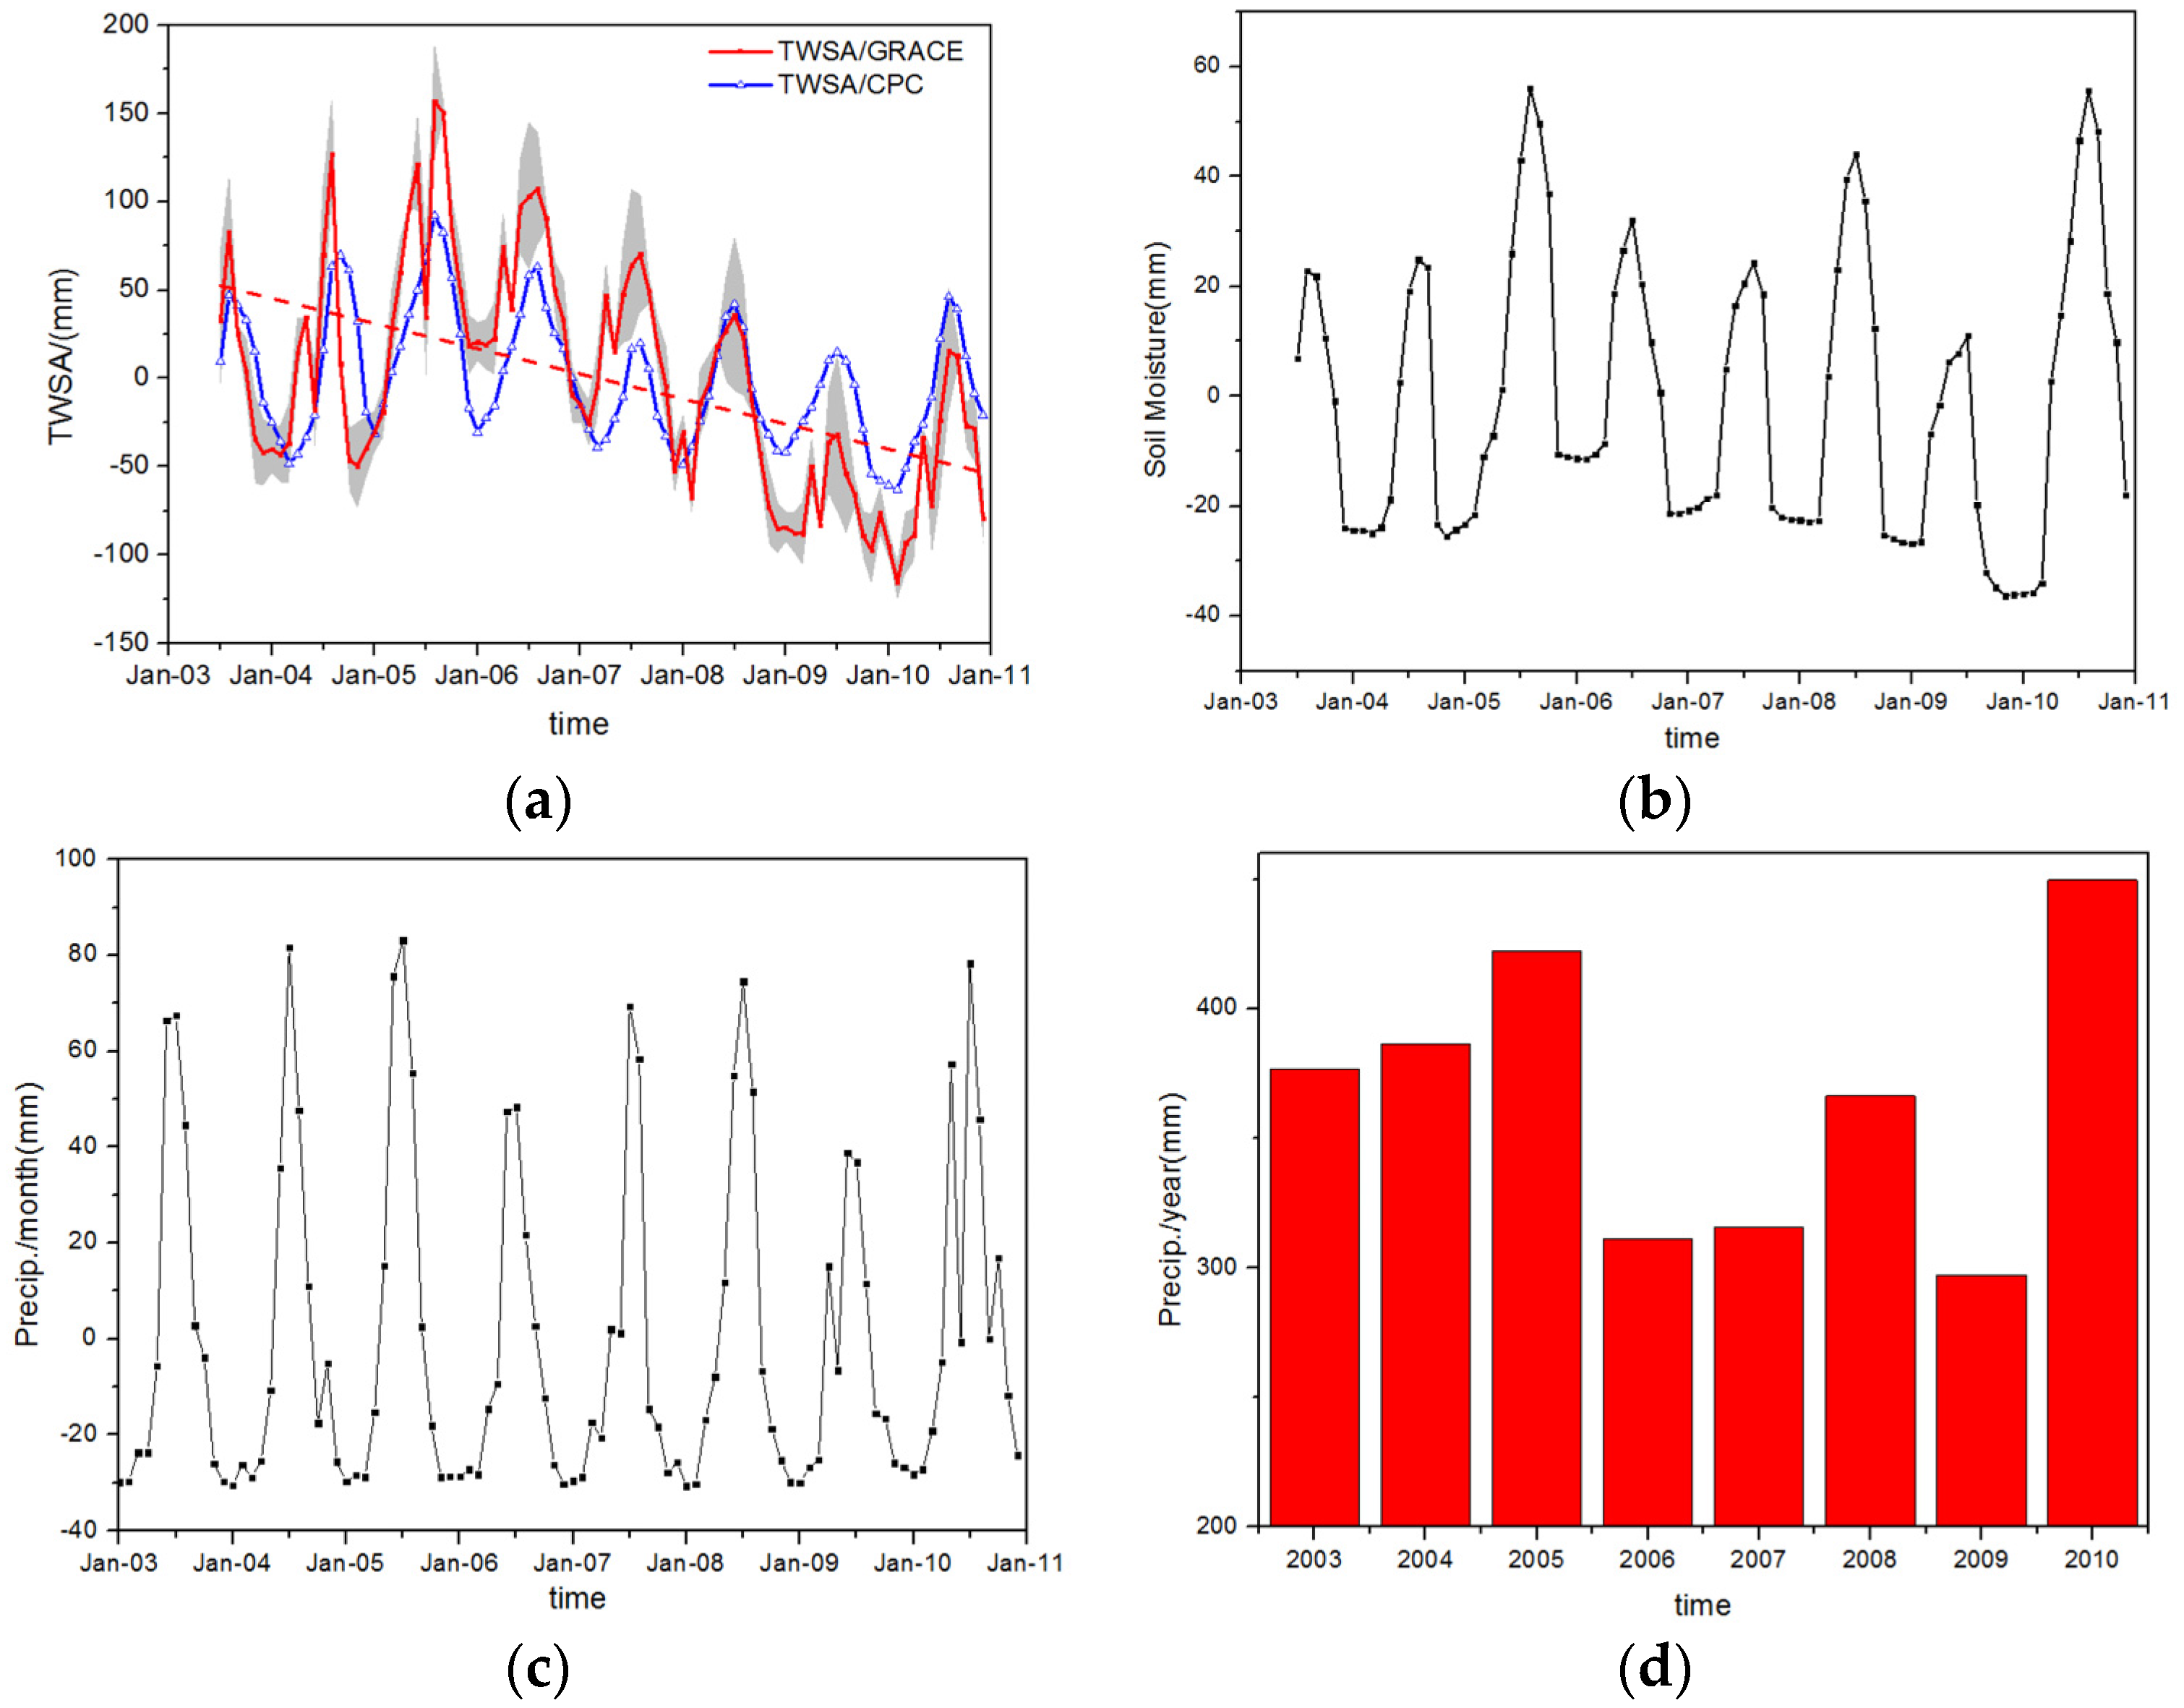
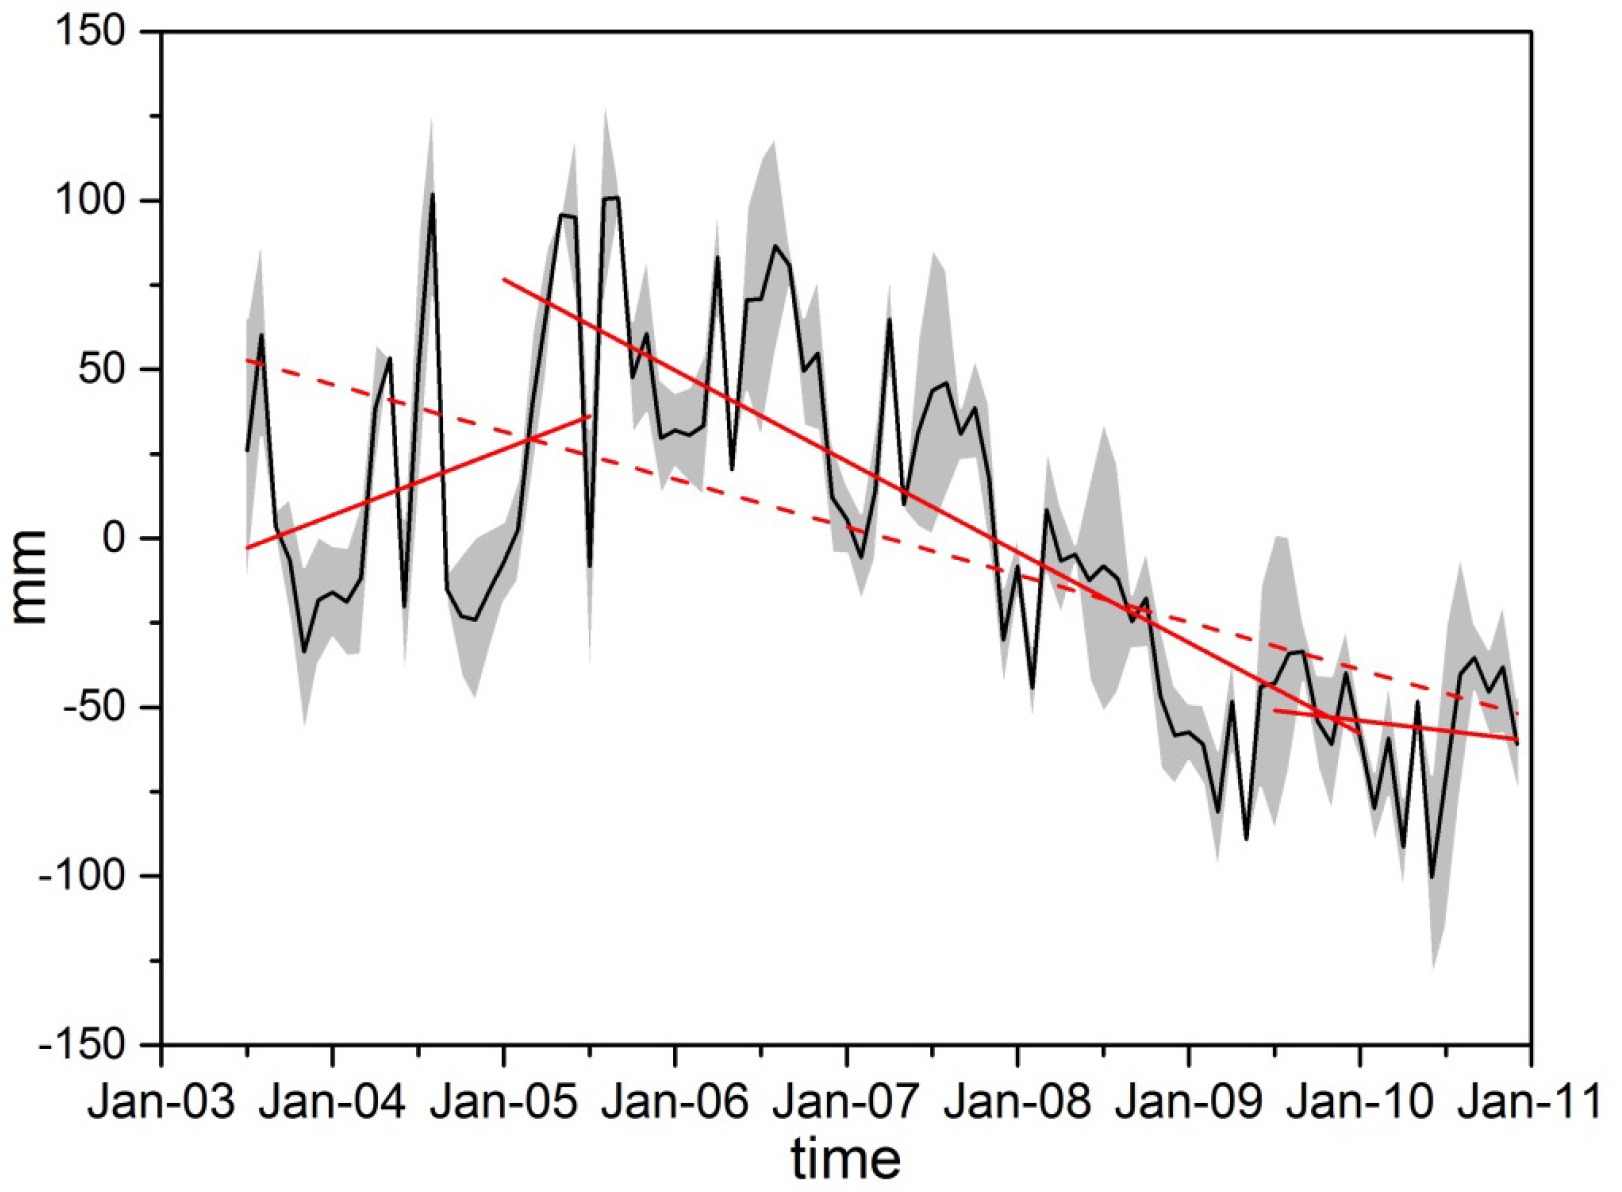
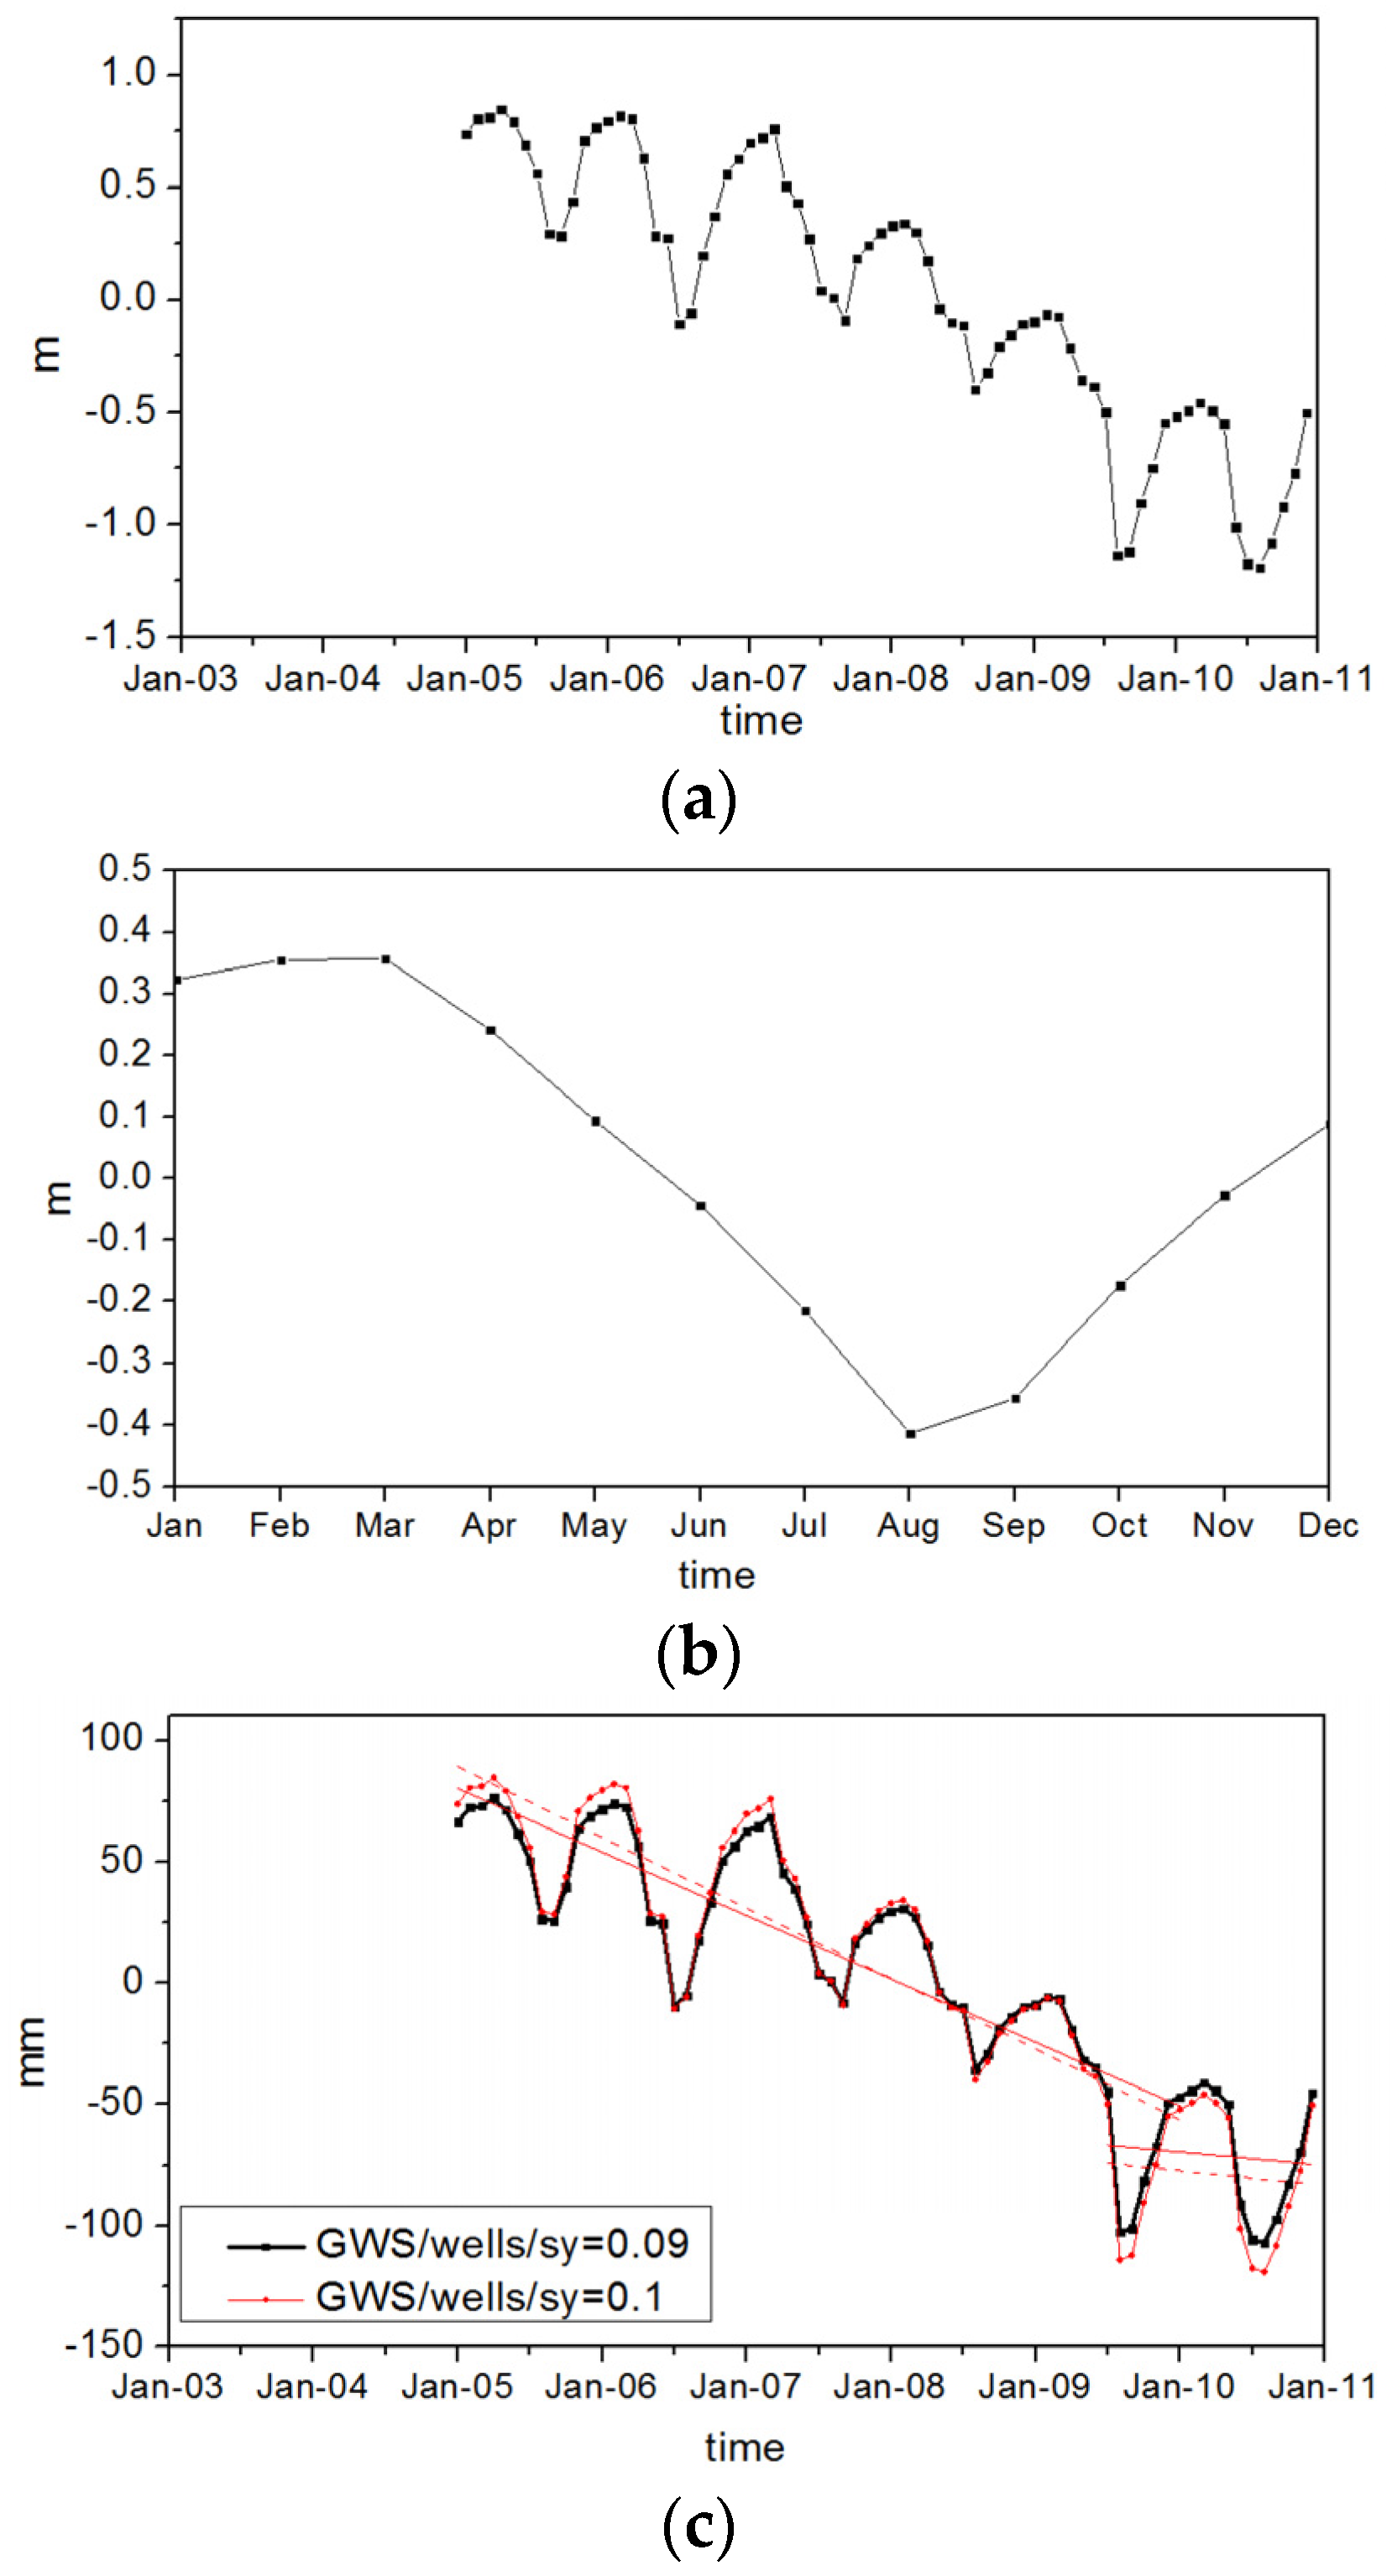
4.1. GWS Changes
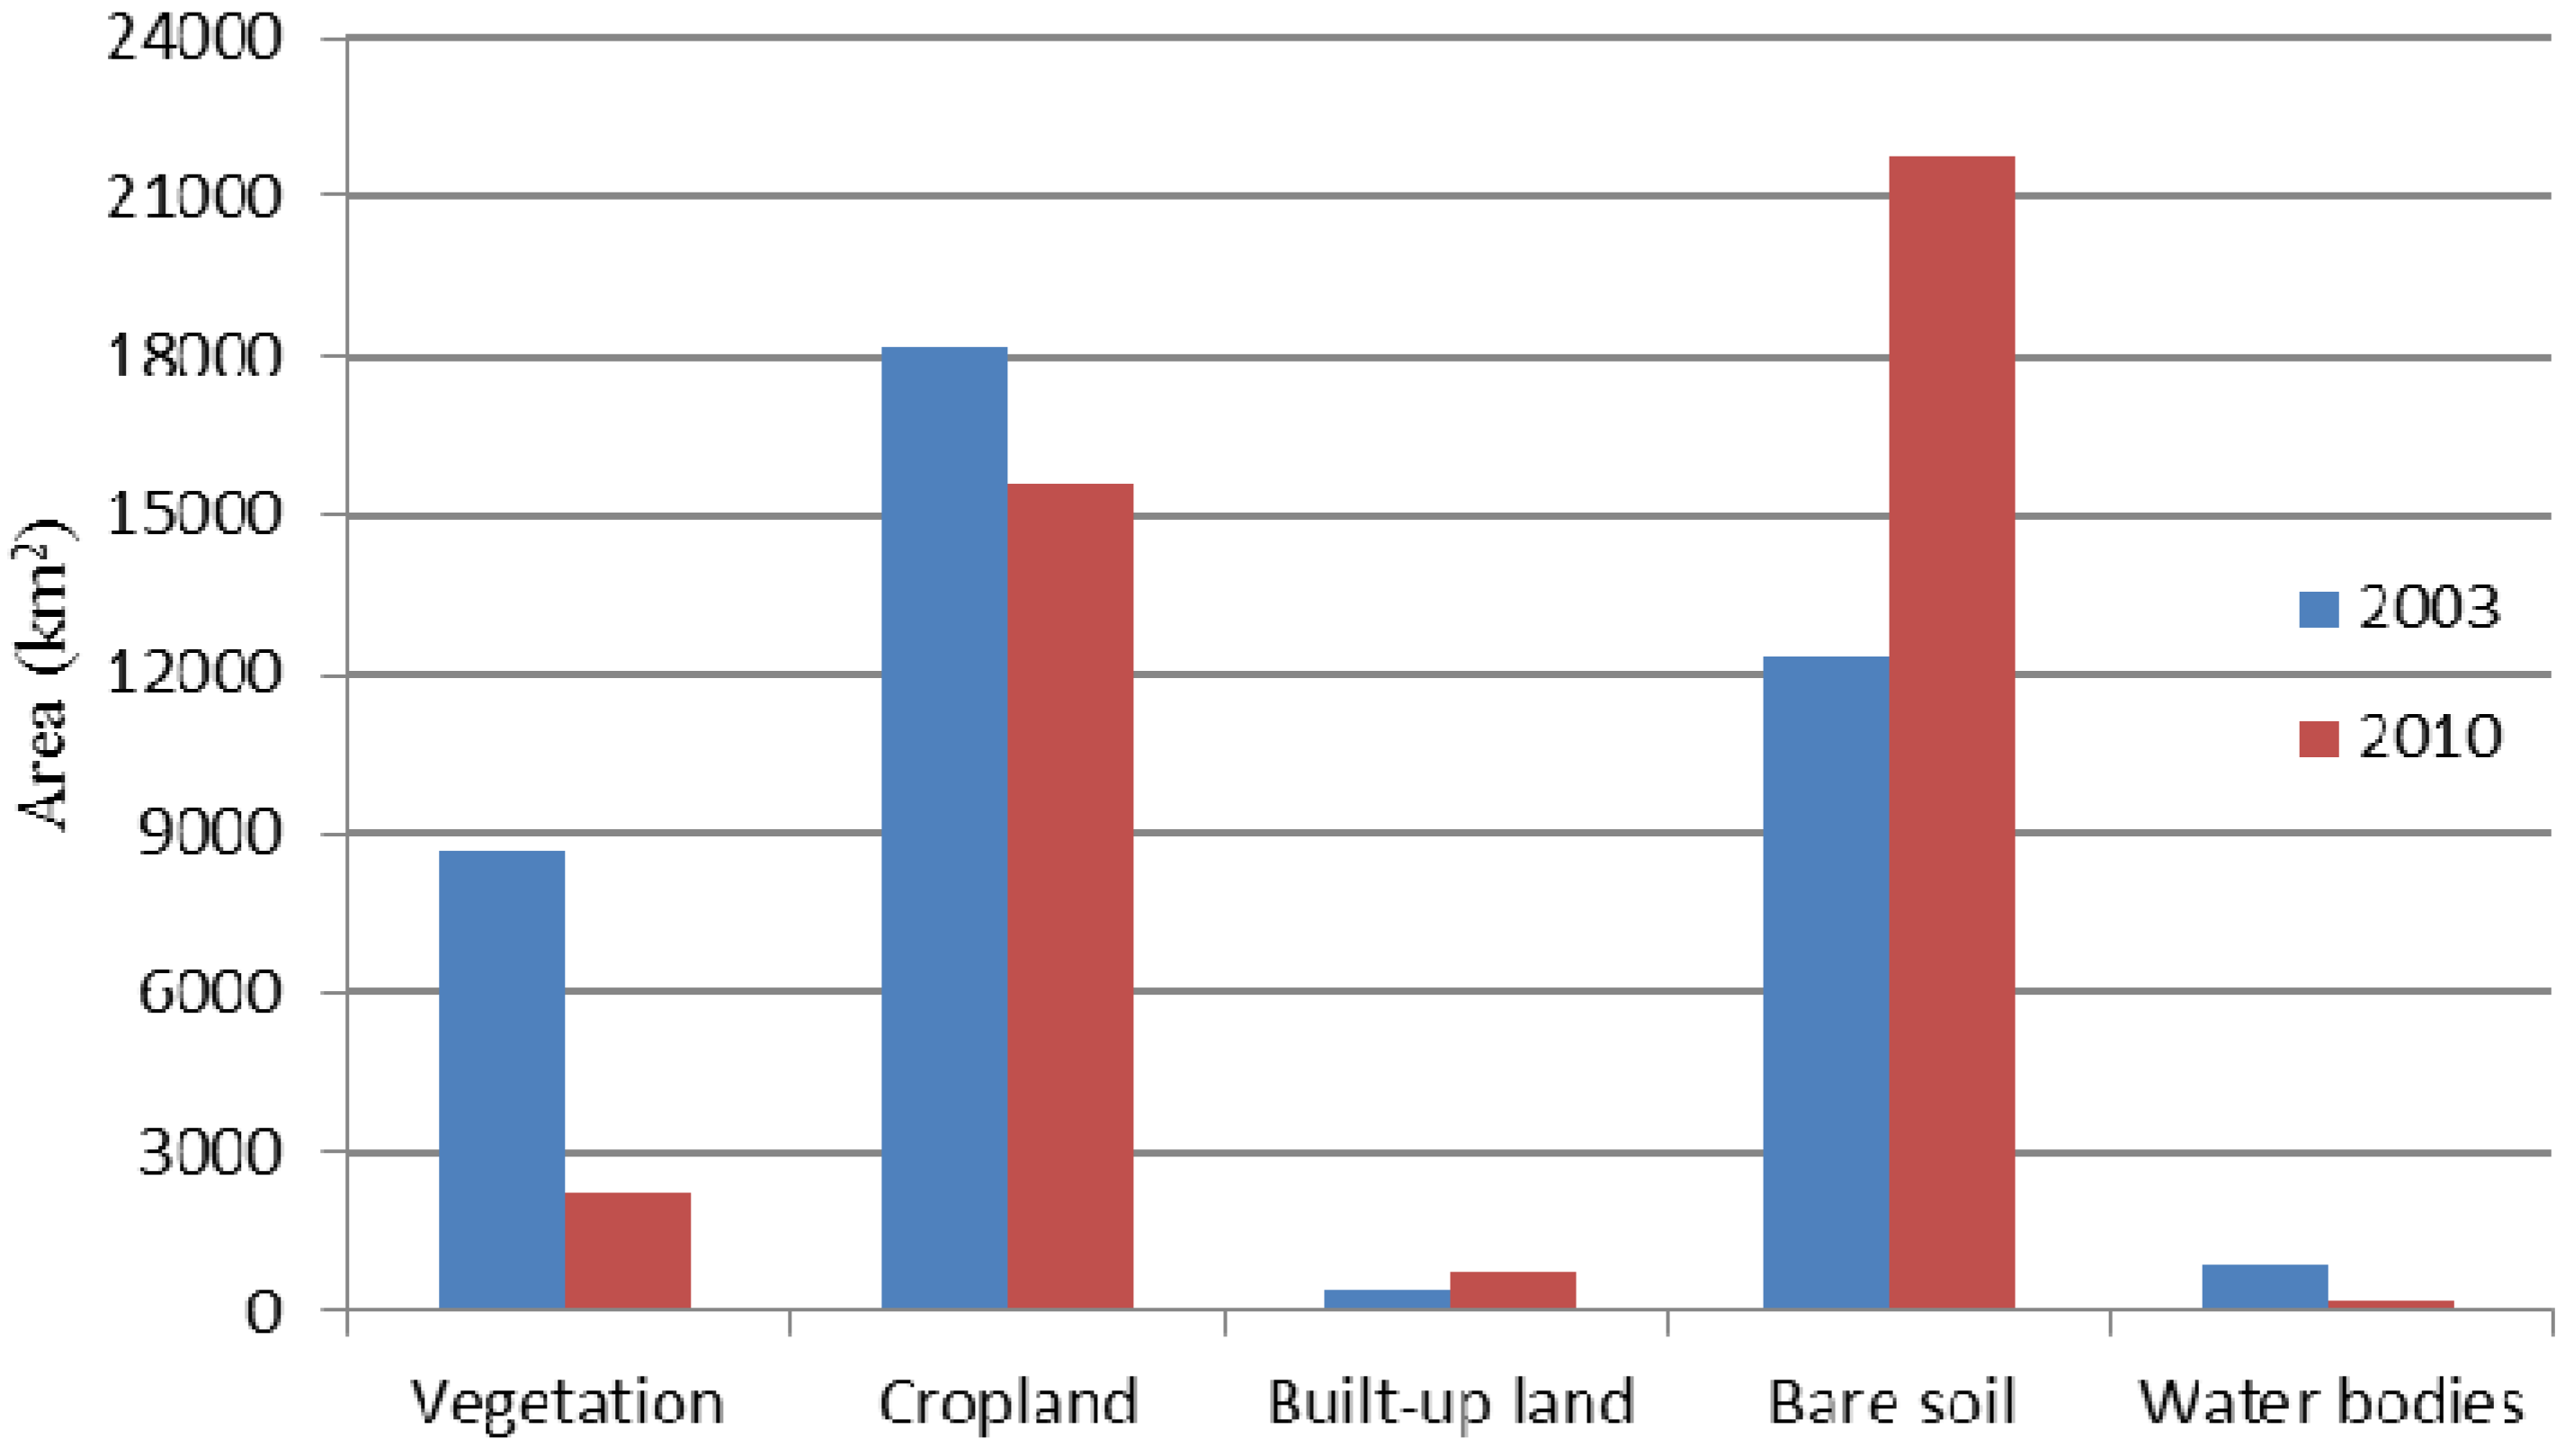
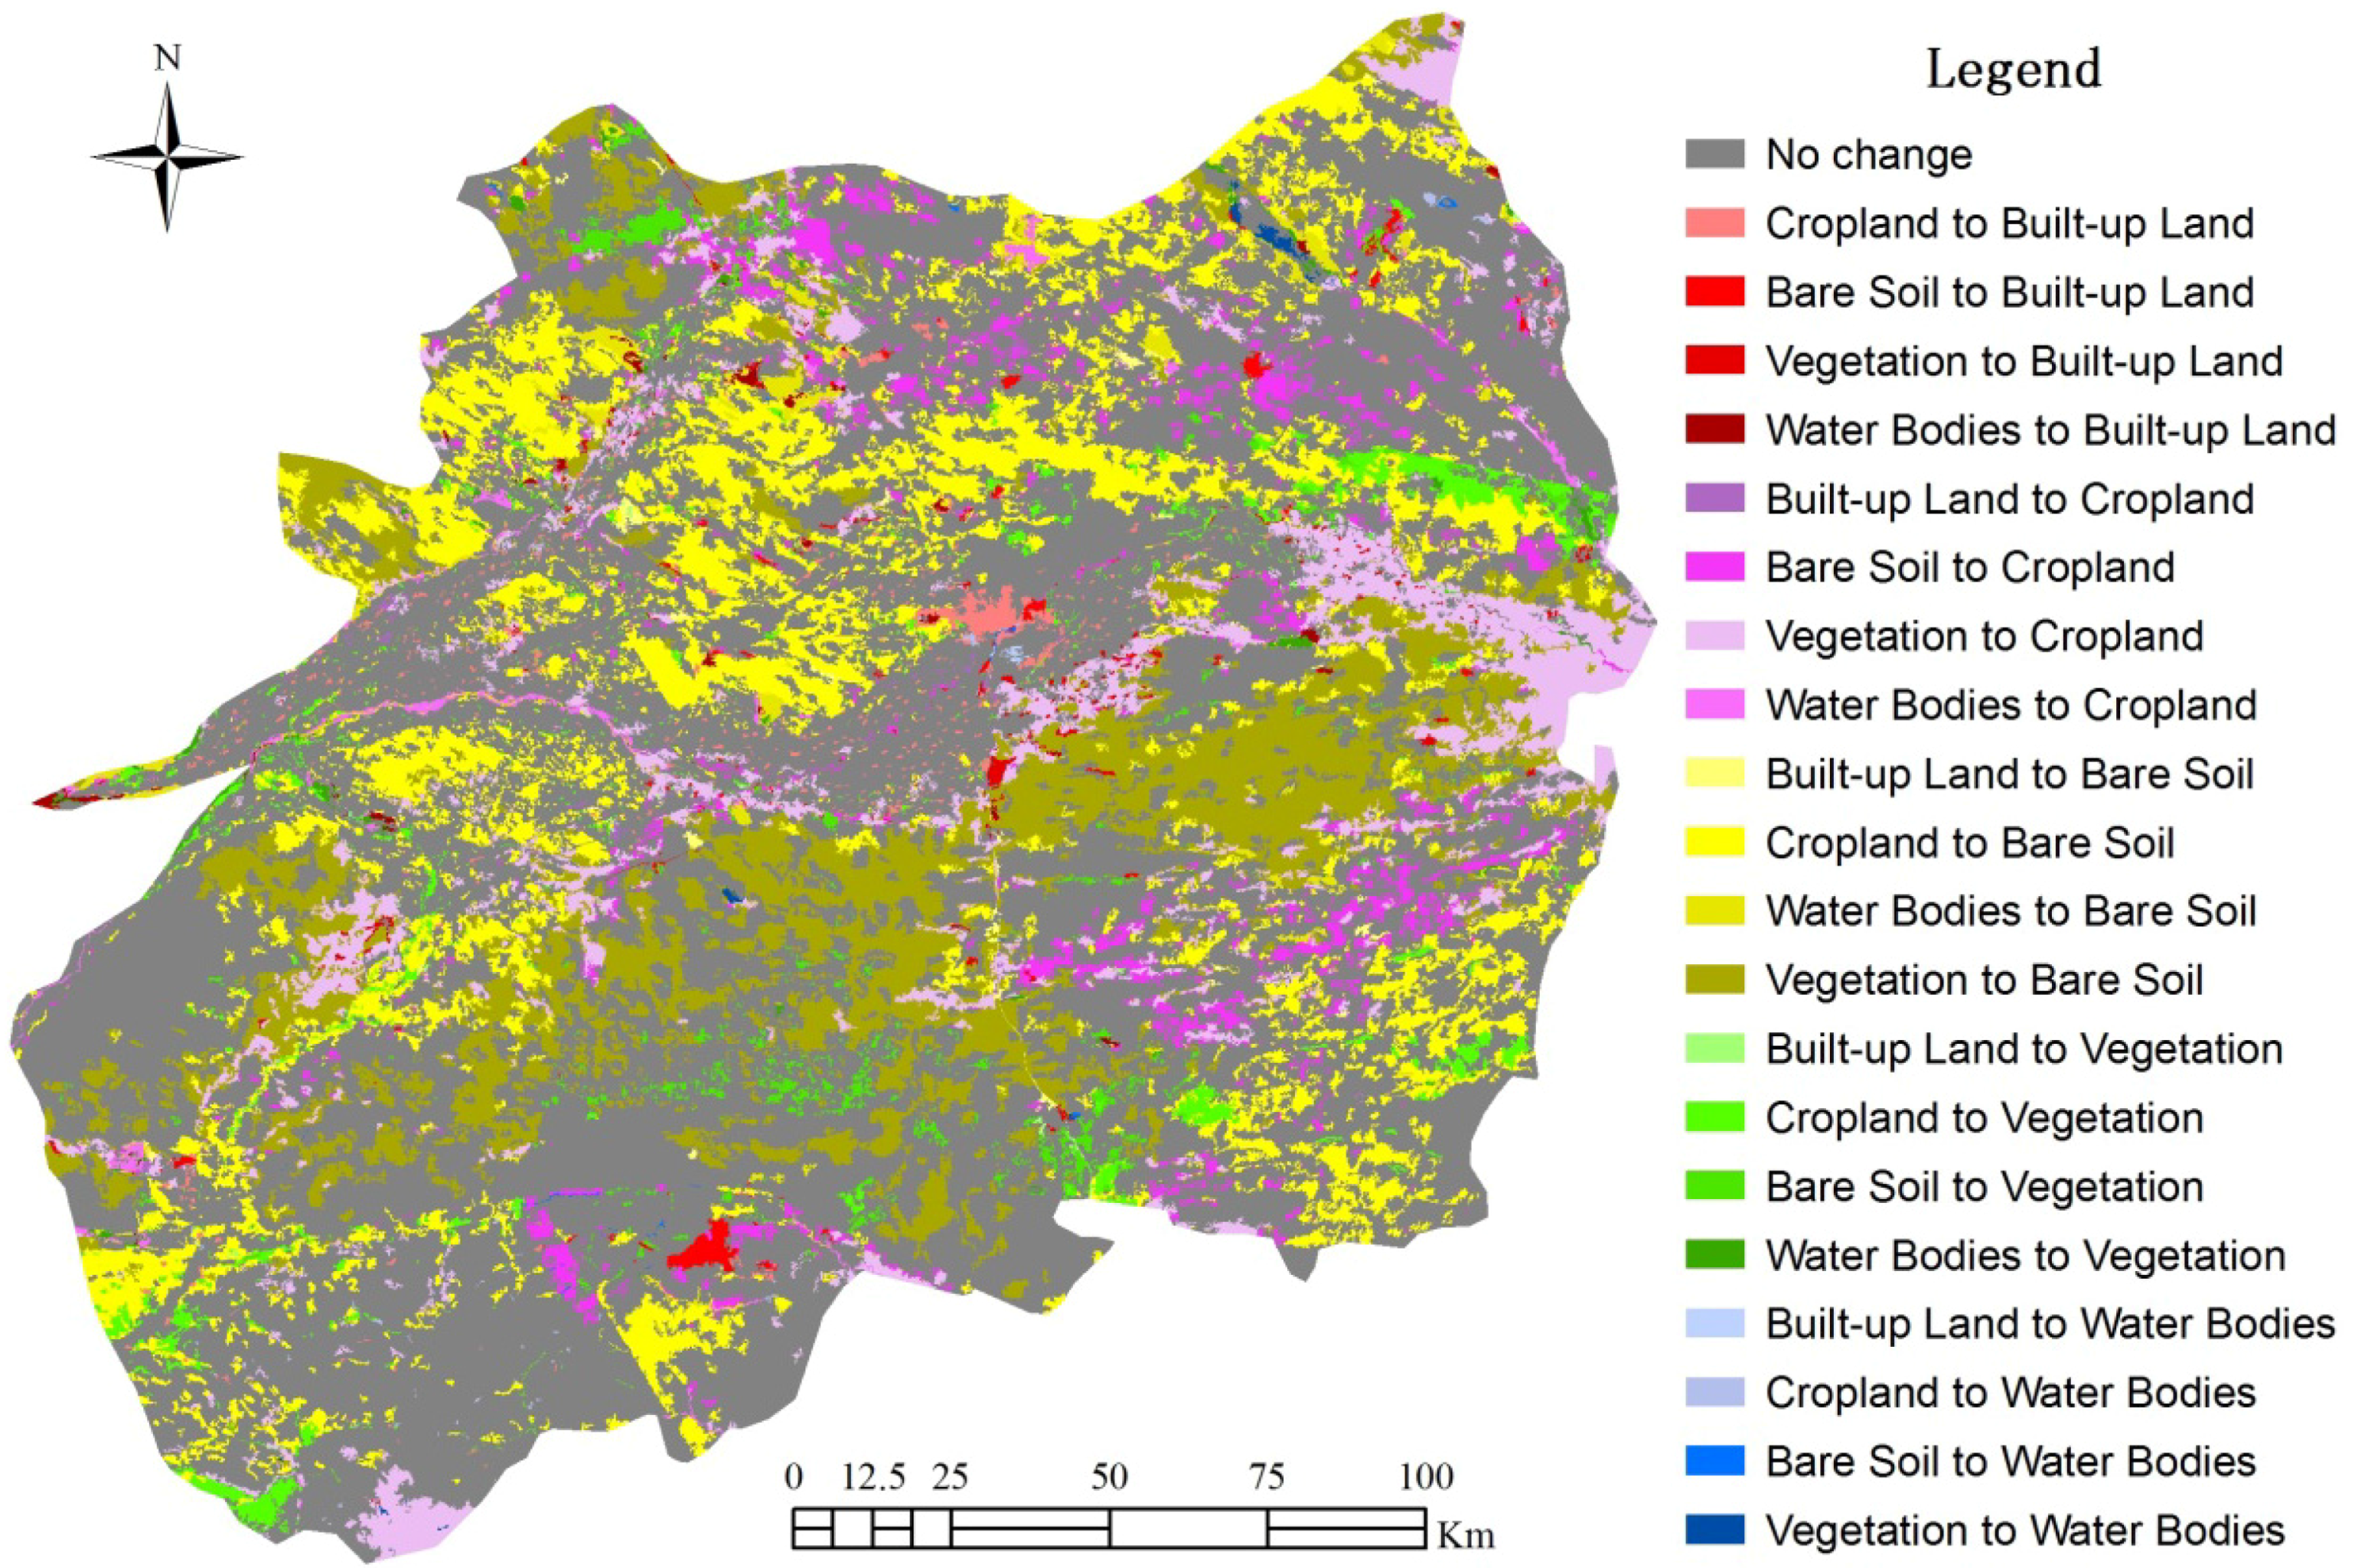
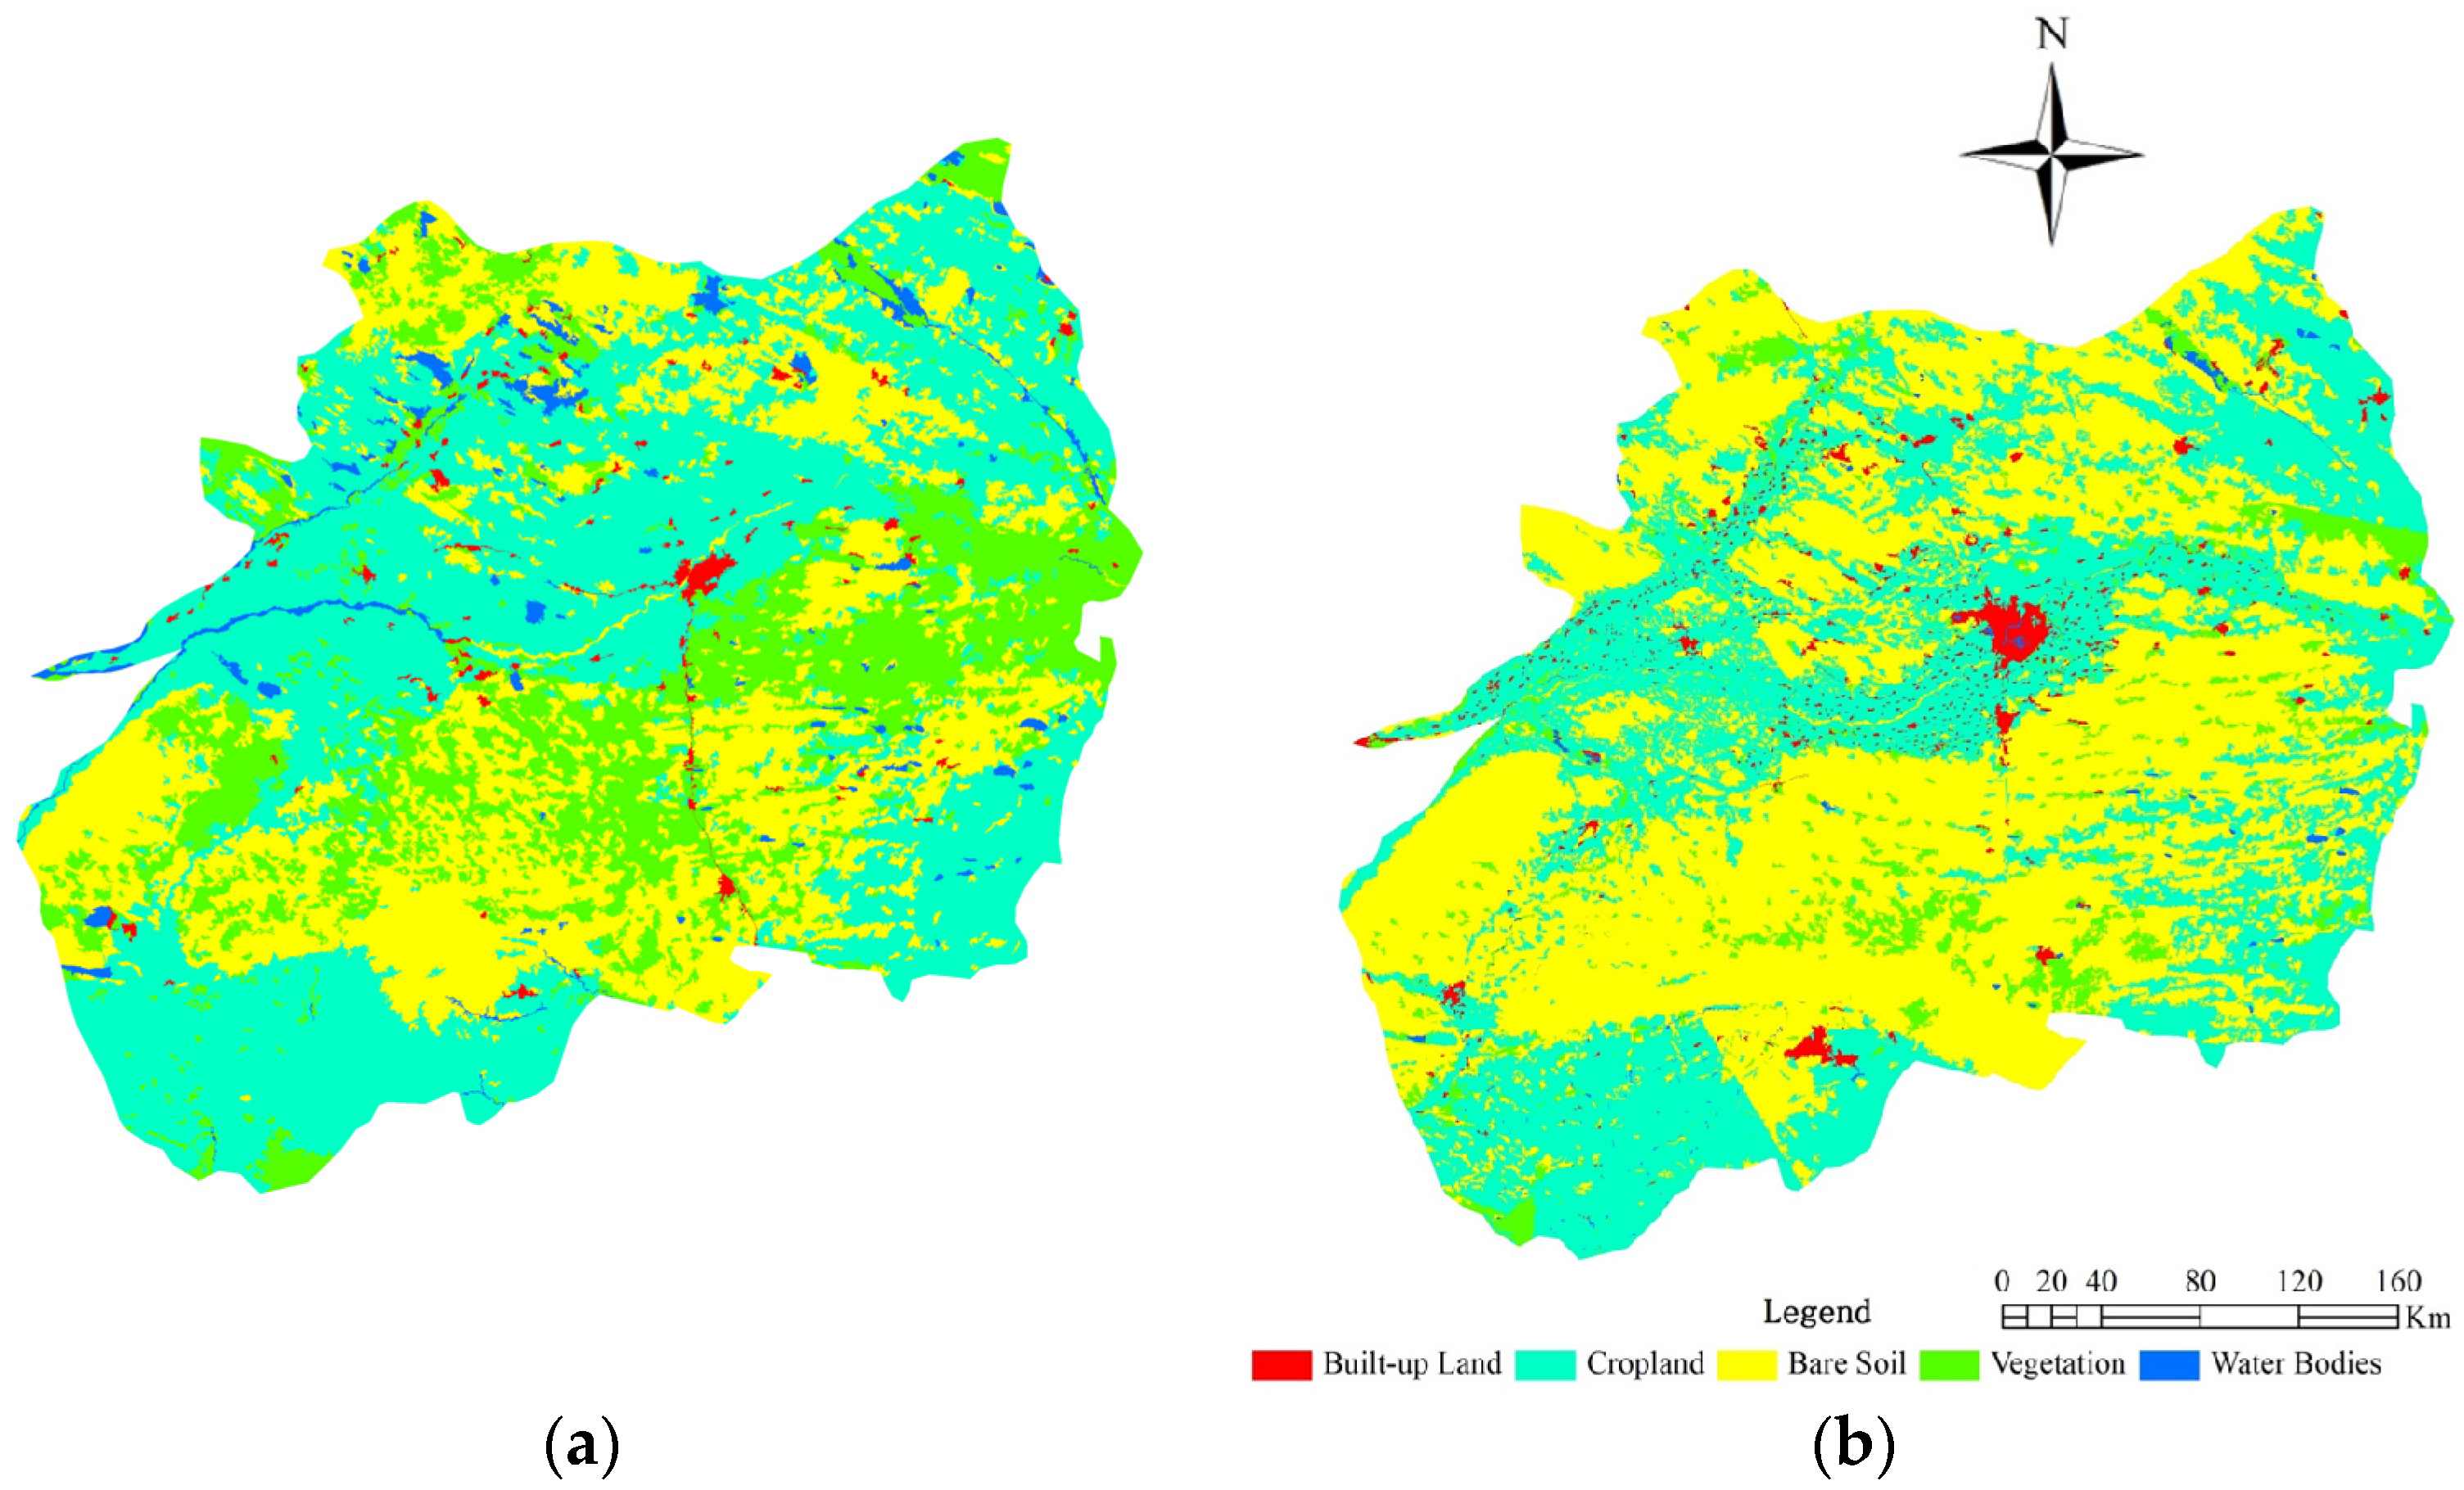
4.2. LU/LC Change Detecton
4.3. Effects of LU/LC Changes on GWS
5. Conclusions
Acknowledgments
Author Contributions
Conflicts of Interest
References
- Famiglietti, J.S.; Lo, M.; Ho, S.L.; Bethune, J.; Anderson, K.J.; Syed, T.H.; Swenson, S.C.; de Linage, C.R.; Rodell, M. Satellites measure recent rates of groundwater depletion in California’s Central Valley. Geophys. Res. Lett. 2011, 38, L03403–L03406. [Google Scholar] [CrossRef]
- Alley, W.M.; Healy, R.W.; LaBaugh, J.W.; Reilly, T.E. Hydrology—Flow and storage in groundwater systems. Science 2002, 296, 1985–1990. [Google Scholar] [CrossRef] [PubMed]
- Wada, Y.; van Beek, L.P.H.; van Kempen, C.M.; Reckman, J.W.T.M.; Vasak, S.; Bierkens, M.F.P. Global depletion of groundwater resources. Geophys. Res. Lett. 2010, 37, 114–122. [Google Scholar] [CrossRef]
- Gleeson, T.; Wada, Y.; Bierkens, M.F.P.; van Beek, L.P.H. Water balance of global aquifers revealed by groundwater footprint. Nature 2012, 488, 197–200. [Google Scholar] [CrossRef] [PubMed]
- Siebert, S.; Burke, J.; Faures, J.M.; Frenken, K.; Hoogeveen, J.; Doll, P.; Portmann, F.T. Groundwater use for irrigation—A global inventory. Hydrol. Earth Syst. Sci. 2010, 14, 1863–1880. [Google Scholar] [CrossRef] [Green Version]
- Scanlon, B.R.; Jolly, I.; Sophocleous, M.; Zhang, L. Global impacts of conversions from natural to agricultural ecosystems on water resources: Quantity versus quality. Water Resour. Res. 2007, 43, 455–456. [Google Scholar] [CrossRef]
- Hanasaki, N.; Kanae, S.; Oki, T.; Masuda, K.; Motoya, K.; Shirakawa, N.; Shen, Y.; Tanaka, K. An integrated model for the assessment of global water resources—Part 2: Applications and assessments. Hydrol. Earth Syst. Sci. 2008, 12, 1027–1037. [Google Scholar] [CrossRef]
- Hanasaki, N.; Kanae, S.; Oki, T.; Masuda, K.; Motoya, K.; Shirakawa, N.; Shen, Y.; Tanaka, K. An integrated model for the assessment of global water resources—Part 1: Model description and input meteorological forcing. Hydrol. Earth Syst. Sci. 2008, 12, 1007–1025. [Google Scholar] [CrossRef]
- Feng, W.; Zhong, M.; Lemoine, J.-M.; Biancale, R.; Hsu, H.-T.; Xia, J. Evaluation of groundwater depletion in north China using the gravity recovery and climate experiment (grace) data and ground-based measurements. Water Resour. Res. 2013, 49, 2110–2118. [Google Scholar] [CrossRef]
- Scanlon, B.R.; Longuevergne, L.; Long, D. Ground referencing grace satellite estimates of groundwater storage changes in the California Central Valley, USA. Water Resour. Res. 2012, 48, 142–148. [Google Scholar] [CrossRef]
- López-Vera, F. Groundwater: The invisible resource. Int. J. Water Resour. D 2012, 28, 141–150. [Google Scholar] [CrossRef]
- Rodell, M.; Chen, J.L.; Kato, H.; Famiglietti, J.S.; Nigro, J.; Wilson, C.R. Estimating groundwater storage changes in the Mississippi River Basin (USA) using grace. Hydrogeol. J. 2007, 15, 159–166. [Google Scholar] [CrossRef]
- Tapley, B.D.; Bettadpur, S.; Ries, J.C.; Thompson, P.F.; Watkins, M.M. Grace measurements of mass variability in the earth system. Science 2004, 305, 503–505. [Google Scholar] [CrossRef] [PubMed]
- Yeh, P.J.F.; Swenson, S.C.; Famiglietti, J.S.; Rodell, M. Remote sensing of groundwater storage changes in illinois using the gravity recovery and climate experiment (grace). Water Resour. Res. 2006, 42, 395–397. [Google Scholar] [CrossRef]
- Zaitchik, B.F.; Rodell, M.; Reichle, R.H. Assimilation of grace terrestrial water storage data into a land surface model: Results for the Mississippi River Basin. J. Hydrometeorol. 2008, 9, 535–548. [Google Scholar] [CrossRef]
- Wada, Y.; Wisser, D.; Bierkens, M.F.P. Global modeling of withdrawal, allocation and consumptive use of surface water and groundwater resources. Earth Syst. Dynam. 2014, 5, 15–40. [Google Scholar] [CrossRef]
- Pokhrel, Y.N.; Koirala, S.; Yeh, P.J.F.; Hanasaki, N.; Longuevergne, L.; Kanae, S.; Oki, T. Incorporation of groundwater pumping in a global land surface model with the representation of human impacts. Water Resour. Res. 2015, 51, 78–96. [Google Scholar] [CrossRef]
- Bagan, H.; Takeuchi, W.; Kinoshita, T.; Bao, Y.H.; Yamagata, Y. Land cover classification and change analysis in the Horqin Sandy Land from 1975 to 2007. IEEE J. Sel. Top. Appl. Earth Obs. Remote Sens. 2010, 3, 168–177. [Google Scholar] [CrossRef]
- Jiang, G.M.; Han, X.G.; Wu, J.G. Restoration and management of the inner mongolia grassland require a sustainable strategy. Ambio 2006, 35, 269–270. [Google Scholar] [CrossRef] [PubMed]
- Katoh, K.; Takeuchi, K.I.; Jiang, D.M.; Nan, Y.H.; Kou, Z.W. Vegetation restoration by seasonal exclosure in the Kerqin Sandy Land, inner Mongolia. Plant Ecol. 1998, 139, 133–144. [Google Scholar] [CrossRef]
- Sasaki, T.; Okubo, S.; Okayasu, T.; Jamsran, U.; Ohkuro, T.; Takeuchi, K. Two-phase functional redundancy in plant communities along a grazing gradient in Mongolian rangelands. Ecology 2009, 90, 2598–2608. [Google Scholar] [CrossRef] [PubMed]
- Wu, J.; Vincent, B.; Yang, J.; Bouarfa, S.; Vidal, A. Remote sensing monitoring of changes in soil salinity: A case study in inner Mongolia, China. Sensors 2008, 8, 7035–7049. [Google Scholar] [CrossRef]
- Kou, Z. Amelioration of desertification and construction of sustainable landuse system in Wulan-Aodu area. In Towards Solving the Global Desertification Problem; National Institute for Environmental Studies: Tsukuba, Japan, 1994; Volume 4, pp. 45–47. [Google Scholar]
- Li, Y.; Cui, J.; Zhang, T.; Okuro, T.; Drake, S. Effectiveness of sand-fixing measures on desert land restoration in Kerqin Sandy Land, northern China. Ecol. Eng. 2009, 35, 118–127. [Google Scholar] [CrossRef]
- Brogaard, S.; Li, X. Agricultural performance on marginal land in eastern inner Mongolia, China—Development in the pre- and post-1978 reform periods. GeoJournal 2005, 64, 163–175. [Google Scholar] [CrossRef]
- Yan, Y.; Zhu, J.; Yan, Q.; Zheng, X.; Song, L. Modeling shallow groundwater levels in Horqin Sandy Land, north China, using satellite-based remote sensing images. J. Appl. Remote Sens. 2014, 8, 083647. [Google Scholar] [CrossRef]
- Cao, C.; Jiang, D.; Teng, X.; Jiang, Y.; Liang, W.; Cui, Z. Soil chemical and microbiological properties along a chronosequence of Caragana microphylla Lam. Plantations in the Horqin Sandy Land of northeast China. Appl. Soil Ecol. 2008, 40, 78–85. [Google Scholar] [CrossRef]
- Han, M.; Zhao, Y.; Zhang, D. Agricultural reclamations in Xiliao River Valley, China since the Holocene. J. Geogr. Sci. 2012, 22, 371–381. [Google Scholar] [CrossRef]
- Chambers, D.P.; Bonin, J.A. Evaluation of release-05 grace time-variable gravity coefficients over the ocean. Ocean Sci. 2012, 8, 859–868. [Google Scholar] [CrossRef]
- Swenson, S.; Yeh, P.J.F.; Wahr, J.; Famiglietti, J. A comparison of terrestrial water storage variations from grace with in situ measurements from Illinois. Geophys. Res. Lett. 2006. [Google Scholar] [CrossRef]
- Paulson, A.; Zhong, S.J.; Wahr, J. Inference of mantle viscosity from grace and relative sea level data. Geophys. J. Int. 2007, 171, 497–508. [Google Scholar] [CrossRef]
- Velicogna, I.; Wahr, J. Acceleration of greenland ice mass loss in spring 2004. Nature 2006, 443, 329–331. [Google Scholar] [CrossRef] [PubMed]
- Longuevergne, L.; Scanlon, B.R.; Wilson, C.R. Grace hydrological estimates for small basins: Evaluating processing approaches on the high plains aquifer, USA. Water Resour. Res. 2010. [Google Scholar] [CrossRef]
- Longuevergne, L.; Wilson, C.R.; Scanlon, B.R.; Crétaux, J.F. Grace water storage estimates for the middle east and other regions with significant reservoir and lake storage. Hydrol. Earth Syst. Sci. 2013, 17, 4817–4830. [Google Scholar] [CrossRef] [Green Version]
- Long, D.; Longuevergne, L.; Scanlon, B.R. Global analysis of approaches for deriving total water storage changes from grace satellites. Water Resour. Res. 2015, 51, 2574–2594. [Google Scholar] [CrossRef]
- Long, D.; Yang, Y.; Wada, Y.; Hong, Y.; Liang, W.; Chen, Y.; Yong, B.; Hou, A.; Wei, J.; Chen, L. Deriving scaling factors using a global hydrological model to restore grace total water storage changes for China’s Yangtze River Basin. Remote Sens. Environ. 2015, 168, 177–193. [Google Scholar] [CrossRef]
- Landerer, F.W.; Swenson, S.C. Accuracy of scaled grace terrestrial water storage estimates. Water Resour. Res. 2012. [Google Scholar] [CrossRef]
- Wahr, J.; Swenson, S.; Velicogna, I. Accuracy of grace mass estimates. Geophys. Res. Lett. 2006. [Google Scholar] [CrossRef]
- Yu, C.J. Dynamic Simulation Evaluation about Water Resource System and Opimal Allocation Model of Macro-Economy Water Resource in Tong Liao City. Ph.D. Thesis, Inner Mongolia Agricultural University, Hohhot, China, 2004. [Google Scholar]
- Yang, Q.; Lun, W.; Fang, Y. Numerical modeling of three dimension groundwater flow in Tongliao (China). Procedia Eng. 2011, 24, 638–642. [Google Scholar] [CrossRef]
- Duan, Q.M. Research on Three-Dimensional Geologic Modeling and Numerical Simulation of Groundwater in Xiliao River Plain. Ph.D. Thesis, China University of Geosciences, Beijing, China, 2006. [Google Scholar]
- Moiwo, J.P.; Lu, W.; Tao, F. Grace, gldas and measured groundwater data products show water storage loss in western Jilin, China. Water Sci. Technol. 2012, 65, 1606–1614. [Google Scholar] [CrossRef] [PubMed]
- Wei, Y.F.; Fang, J.; Liu, S.; Zhao, X.Y.; Li, S.G. Stable isotopic observation of water use sources of Pinus sylvestris var. mongolica in Horqin Sandy Land, China. Trees 2013, 27, 1249–1260. [Google Scholar]
- Rodell, M.; Houser, P.R.; Jambor, U.; Gottschalck, J.; Mitchell, K.; Meng, C.J.; Arsenault, K.; Cosgrove, B.; Radakovich, J.; Bosilovich, M.; et al. The global land data assimilation system. Bull. Am. Meteorol. Soc. 2004, 85, 381–394. [Google Scholar] [CrossRef]
- Long, D.; Scanlon, B.R.; Longuevergne, L.; Sun, A.Y.; Fernando, D.N.; Save, H. Grace satellite monitoring of large depletion in water storage in response to the 2011 drought in Texas. Geophys. Res. Lett. 2013, 40, 3395–3401. [Google Scholar] [CrossRef] [Green Version]
- Long, D.; Longuevergne, L.; Scanlon, B.R. Uncertainty in evapotranspiration from land surface modeling, remote sensing, and grace satellites. Water Resour. Res. 2014, 50, 1131–1151. [Google Scholar] [CrossRef]
- Rodell, M.; Velicogna, I.; Famiglietti, J.S. Satellite-based estimates of groundwater depletion in India. Nature 2009, 460, 999–1002. [Google Scholar] [CrossRef] [PubMed]
- Schroeder, T.A.; Cohen, W.B.; Song, C.; Canty, M.J.; Yang, Z. Radiometric correction of multi-temporal landsat data for characterization of early successional forest patterns in western Oregon. Remote Sens. Environ. 2006, 103, 16–26. [Google Scholar] [CrossRef]
- Song, C.L.; Woodcock, C.E.; Seto, K.C.; Lenney, M.P.; Macomber, S.A. Classification and change detection using landsat TM data: When and how to correct atmospheric effects? Remote Sens. Environ. 2001, 75, 230–244. [Google Scholar] [CrossRef]
- Yalçıntaş, M.; Bulu, M.; Küçükvar, M.; Samadi, H. A framework for sustainable urban water management through demand and supply forecasting: The case of Istanbul. Sustainability 2015, 7, 11050–11067. [Google Scholar] [CrossRef] [Green Version]
- Im, J.; Rhee, J.; Jensen, J.R.; Hodgson, M.E. An automated binary change detection model using a calibration approach. Remote Sens. Environ. 2007, 106, 89–105. [Google Scholar] [CrossRef]
- Mas, J.F. Monitoring land-cover changes: A comparison of change detection techniques. Int. J. Remote Sens. 1999, 20, 139–152. [Google Scholar] [CrossRef]
- Araya, Y.H.; Hergarten, C. A comparison of pixel and object-based land cover classification: A case study of the Asmara region, Eritrea. WIT Trans. Built Environ. 2008, 100, 233–243. [Google Scholar]
- Chen, X.H.; Chen, J.; Shi, Y.S.; Yamaguchi, Y. An automated approach for updating land cover maps based on integrated change detection and classification methods. ISPRS J. Photogramm. Remote Sens. 2012, 71, 86–95. [Google Scholar] [CrossRef]
- Lu, D.; Mausel, P.; Brondizio, E.; Moran, E. Change detection techniques. Int. J. Remote Sens. 2004, 25, 2365–2407. [Google Scholar] [CrossRef]
- Blaschke, T. Object based image analysis for remote sensing. ISPRS J. Photogramm. Remote Sens. 2010, 65, 2–16. [Google Scholar] [CrossRef]
- Hay, G.J.; Blaschke, T. Special issue: Geographic object-based image analysis (GEOBIA) foreword. Photogramm. Eng. Remote Sens. 2010, 76, 121–122. [Google Scholar]
- Li, J.; Liu, Y.; Cao, M.; Xue, B. Space-time characteristics of vegetation cover and distribution: Case of the Henan Province in China. Sustainability 2015, 7, 11967–11979. [Google Scholar] [CrossRef]
- Rudorff, B.F.T.; Adami, M.; Risso, J.; de Aguiar, D.A.; Pires, B.; Amaral, D.; Fabiani, L.; Cecarelli, I. Remote sensing images to detect soy plantations in the Amazon biome—The soy moratorium initiative. Sustainability 2012, 4, 1074–1088. [Google Scholar] [CrossRef]
- Sizo, A.; Noble, B.; Bell, S. Futures analysis of urban land use and wetland change in Saskatoon, Canada: An application in strategic environmental assessment. Sustainability 2015, 7, 811–830. [Google Scholar] [CrossRef]
- Cao, Y.; Nan, Z.; Cheng, G. Grace gravity satellite observations of terrestrial water storage changes for drought characterization in the arid land of northwestern China. Remote Sens. 2015, 7, 1021–1047. [Google Scholar] [CrossRef]
- Gao, H.; Yang, S. A severe drought event in northern China in winter 2008–2009 and the possible influences of La Niña and Tibetan Plateau. J. Geophys. Res. 2009. [Google Scholar] [CrossRef]
- Ye, Q. Research on Resource Efficiency of Agricultural Production in Horqin Sandy Land. Master’s Thesis, Huazhong Agricultural University, Wuhan, China, 2011. [Google Scholar]
- Song, Q.Y. The Study on the Water Saving Potential of Agricultural in Keerqin District of Tongliao City. Master’s Thesis, Chinese Academy of Agricultural Sciences, Beijing, China, 2007. [Google Scholar]
- Guo, B.; Li, W.; Guo, J.; Chen, C. Risk assessment of regional irrigation water demand and supply in an arid inland river basin of northwestern China. Sustainability 2015, 7, 12958–12973. [Google Scholar] [CrossRef]
- Motoshita, M.; Ono, Y.; Finkbeiner, M.; Inaba, A. The effect of land use on availability of Japanese freshwater resources and its significance for water footprinting. Sustainability 2016. [Google Scholar] [CrossRef]
- Dams, J.; Woldeamlak, S.T.; Batelaan, O. Predicting land-use change and its impact on the groundwater system of the Kleine Nete catchment, Belgium. Hydrol. Earth Syst. Sci. 2008, 12, 1369–1385. [Google Scholar] [CrossRef]
- Scanlon, B.R.; Reedy, R.C.; Stonestrom, D.A.; Prudic, D.E.; Dennehy, K.F. Impact of land use and land cover change on groundwater recharge and quality in the southwestern US. Glob. Chang. Biol. 2005, 11, 1577–1593. [Google Scholar] [CrossRef]
- Hoekstra, A.; Chapagain, A.; Zhang, G. Water footprints and sustainable water allocation. Sustainability 2015. [Google Scholar] [CrossRef]
- Ge, X.D.; Huang, C.; Ye, Q. Agricultural production technical efficiency in horiqn sandy land during 2000–2008: A case study in Tongliao. J. Desert Res. 2012, 32, 1457–1462. [Google Scholar]
- Ma, D.; Xian, C.; Zhang, J.; Zhang, R.; Ouyang, Z. The evaluation of water footprints and sustainable water utilization in Beijing. Sustainability 2015, 7, 13206–13221. [Google Scholar] [CrossRef]
- Yu, X.; Geng, Y.; Heck, P.; Xue, B. A review of China’s rural water management. Sustainability 2015, 7, 5773–5792. [Google Scholar] [CrossRef]


| LU/LC Class | Description |
|---|---|
| Cropland | Land cultivated for crops, including paddy land and dry land |
| Water bodies | Bodies of water, including natural bodies of water (e.g., streams, rivers, and lakes) and artificial structures (e.g., reservoirs and ponds) |
| Built-up land | Lands used for urban built-up areas, rural settlements, factories, roads, and other artificial structures |
| Vegetation | Woodland (e.g., forests, shrubs, and gardens) and grassland (e.g., shrub rangeland and mixed rangeland) |
| Bare soil | Sand dunes, salinized soil, bare ground, and exposed soil with less than 5% vegetation cover |
| Time | GWS | Trend (mm·year−1) |
|---|---|---|
| January 2005–December 2009 | GRACE-derived GWS | −26.04 to 29.1 |
| well-derived GWS | −26.7 ± 2.7 | |
| July 2009–December 2010 | GRACE-derived GWS | −6.0 ± 1.9 |
| well-derived GWS | −5.5 to 6.1 |
| 2010 | Total | Decrease | ||||||
|---|---|---|---|---|---|---|---|---|
| Built-up Lands | Water Bodies | Bare Soil | Croplands | Vegetation | ||||
| 2003 | Built-up lands | 191.4 | 5.8 | 99.2 | 94.9 | 20.4 | 411.7 | 220.3 |
| Water bodies | 69.3 | 82.3 | 404.5 | 195.8 | 114.5 | 866.4 | 784.1 | |
| Bare soil | 136.9 | 12.1 | 10,557.5 | 1210.3 | 439.6 | 12,356.4 | 1798.9 | |
| Croplands | 281.1 | 24.5 | 5524.2 | 11,657.0 | 724.3 | 18,211.1 | 6554.1 | |
| Vegetation | 99.2 | 27.7 | 5192.2 | 2468.0 | 926.6 | 8713.7 | 7787.1 | |
| Total | 777.9 | 152.4 | 21,777.6 | 15,626.0 | 2225.4 | 40,559.3 | 17,144.5 | |
| Increase | 586.5 | 70.1 | 11,220.1 | 3969 | 1298.8 | 17,144.5 | ||
© 2016 by the authors; licensee MDPI, Basel, Switzerland. This article is an open access article distributed under the terms and conditions of the Creative Commons by Attribution (CC-BY) license (http://creativecommons.org/licenses/by/4.0/).
Share and Cite
Zhao, Z.; Lin, A.; Feng, J.; Yang, Q.; Zou, L. Analysis of Water Resources in Horqin Sandy Land Using Multisource Data from 2003 to 2010. Sustainability 2016, 8, 374. https://doi.org/10.3390/su8040374
Zhao Z, Lin A, Feng J, Yang Q, Zou L. Analysis of Water Resources in Horqin Sandy Land Using Multisource Data from 2003 to 2010. Sustainability. 2016; 8(4):374. https://doi.org/10.3390/su8040374
Chicago/Turabian StyleZhao, Zhenzhen, Aiwen Lin, Jiandi Feng, Qian Yang, and Ling Zou. 2016. "Analysis of Water Resources in Horqin Sandy Land Using Multisource Data from 2003 to 2010" Sustainability 8, no. 4: 374. https://doi.org/10.3390/su8040374