Abstract
Many studies have found that larger parks might be needed to counteract the Urban Heat Island effects typical in densely populated Asian megacities. However, it is not easy to establish large parks to serve as urban cool islands in Asian megacities, where little space exists for large urban neighborhood parks. Officials in these cities would rather use small areas by replacing heat-absorbing artificial land cover with natural cover. The main objective of this study was to understand the cooling effect of changes in land cover on surface and air temperatures in urban micro-scale environments for supporting sustainable green-space planning and policy in densely built-up areas. This was achieved using measurements at different heights (ground surface, 0.1 m, and 1.5 m) for five land cover types (LCTs) and modeling with the micro-scale climate model ENVI-met. At all vertical measuring points, the average temperature over the entire measurement period had the same hot-to-cold order: asphalt > soil > grass > water > forest. However, the value dramatically decreased as the measuring points became higher. The intensity of hot and cool spots showed the highest value at surface by 18.2 °C, and declined with the height, showing 4.1 °C at 0.1 m and 3.1 °C at 1.5 m. The modeling results indicated that the well-known diurnal variation in surface insolation also occurred in our small domain, among the various LCTs. Based on these findings, providing small-scale green infrastructure in densely built-up areas could be an effective way to improve urban micro-scale thermal conditions.
1. Introduction
The urban heat-island effect is a phenomenon that occurs when the air temperature over urban areas is significantly higher than that over surrounding rural areas due to increased amounts of anthropogenic heat, heat-absorbing land cover, air pollution, and the reduction of green spaces as urban areas develop. Higher temperature has impacts on the habitability of cities. For example, it could increase the risk of mortality [1,2,3,4], and could also increase the consumption of energy for cooling in summer, thereby contributing to global warming [5].
In contrast, the urban cool island (UCI) effect is the phenomenon that occurs when lower air temperature occurs in green spaces, than occurs in artificial surroundings. Since UCIs can mitigate negative urban heat-island effects, many studies have been performed to identify cooling effects of green spaces that might serve as tools to ameliorate the effects of climate change [6,7,8,9,10]. Some studies have found that urban parks are 1–2 °C, sometimes 5–7 °C, cooler than their urban surroundings [2,11,12,13]. Although park size may be non-linearly correlated to park cool-island intensity [2,11], the park cooling effect generally depends on the park size [11,14,15,16]. Hence, larger parks might be needed to counteract the UHI effects that typically cause such suffering in densely populated cities, such as Asian megacities.
However, it is not easy to establish large parks as urban cool islands in Asian megacities. There, the rapid urban transition has evolved dense urban infrastructure and little space for large urban neighborhood parks. The officials of these cities would rather use small areas by replacing heat-absorbing artificial land cover (like asphalt-covered pavement) with natural land cover (like vegetation and water) to form what could be termed cool spots, than to establish new cool islands in the form of large parks. Considering the nature of densely populated Asian cities, many cool spots in densely built-up areas might be more helpful. To support the use of cool spots for green-space design within micro-scale areas and in land-use planning during urban regeneration, the climatic effects of each land cover type (LCT) should be investigated at the scale of human activity.
Much of the research into thermal effects of land cover and vegetation involves broad-scale approaches that use images from remote-sensing satellites to indicate surface temperature [17,18,19,20,21]. Together with remote sensing data, field investigations were used for assessing the effect of land cover changes on air temperature for large area [20]. These kind of data can support local-scale urban planning and decision-making, considering heat-island mitigation and air-quality-improvement measures [22,23]. Fine-scale approaches to the study of thermal effects of land cover and vegetation, normally use small meteorological sensors or mobile devices to measure air temperature [13,24,25,26]. Both surface temperature and air temperature are affected by LCTs, and hence thermal variation of surface and air temperatures by LCT at fine scale should be quantitatively investigated to support the use of cooling effects for green-space design within micro-scale areas in densely built-up Asian megacities like Seoul, South Korea. In particular, it is needed to find out the formation of cool spots in microclimates provided by different LCTs within the broader-scale UHI effect. However, there is not much quantitative data regarding fine-scale thermal variation due to changes in land cover within urban environments. Some studies focused on thermal environments in high densely urbanized areas such as Mexico City [27], Taipei City [2], Lisbon [28] and Hong Kong [29], which showed how the size and type of green areas affect thermal environment.
The main aim of this study is to understand the thermal effect of very small-scale changes in land cover on surface and air temperatures in urban microclimates for supporting land use planning and policy in densely built-up areas like Asian megacities. We selected the Kunkuk University campus (Seoul, Korea) as a test bed and measured temperatures at different vertical heights within different LCTs during summer and winter. The measurements were expected to investigate temperature changes and thermal characteristics at and near the ground surface in consideration of human activities. Next, urban microclimate modeling was performed using the ENVI-met model to simulate fine-scale interactions between urban surfaces and the atmosphere within various types of land cover. Finally, cool spot effects were analyzed using the results from both measurement and model simulation. We expect this work could provide scientific basis to understand the effectiveness of small green infrastructure implementation plans for mitigating climate change in old-and-populated megacities like Seoul.
2. Materials and Methods
2.1. Study Area
The Konkuk University campus is located in east-central Seoul. The area surrounding the university campus includes commercial facilities, high-rise residential buildings, and two subway stations, all within an area of high population density. Hence, this test bed is within an area representative of the complex, negative characteristics of the modern urban climate. These include generation of waste heat from intensive energy consumption, greenhouse effects caused by air pollutants, accumulation of heat during daytime due to the heat capacity of high-rise structures, and low evapotranspiration due to high ratios of impermeable surfaces. The campus includes a variety of LCTs including asphalt-paved roads, buildings, grassy land, forest, and a lake. Inclusion of relatively large area of forest, grass, and lake—2nd largest artificial lake in Seoul—makes the campus serve as an urban park area, not only for students but also for residents in the vicinity. For all these reasons, Konkuk University campus is considered the deal test bed for monitoring the microclimate of LCTs, and for analyzing the characteristics of urban heat islands and cool islands (green spaces and water bodies) in an Asian megacity.
The domain for urban microclimate modeling covered an area 1.5 km × 1.5 km, which comprised the Konkuk University campus and the surrounding area. This domain consists of typical urban land-use types: mixed use (39.81%), public (19.69%), residential (17.88%), roads (10.48%), green and open spaces (5.51%), commercial (4.35%), water body (2.26%), and industrial areas (0.03%). A distinguishing mark of this domain is the large artificial lake, which was used to determine the thermal effects of artificial water bodies in our study (Figure 1).
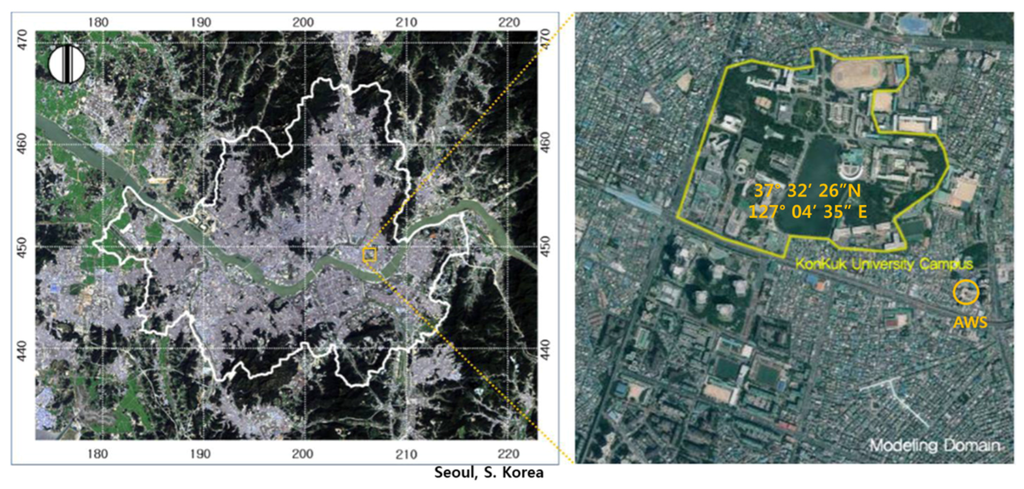
Figure 1.
Domain for microclimate modeling including the Konkuk University campus.
2.2. Temperature Measurement
Temperature is the most important parameter to understand UCI effect. The measurements in this study were performed; (1) to investigate differences of temperature by different LCT and by different heights, (2) to assess performance of the microclimate model (ENVI-Met) simulation. The AWS monitoring network in Seoul was not dense enough to investigate the meteorological characteristics for each receptor within our study domain. Furthermore, for built-up areas with little open spaces, AWSs are normally installed on the roof of a building. Hence, their data are not adequate to represent near-surface meteorological conditions that directly affect the thermal comfort of humans. For this reason, we directly measured temperature to provide detailed temperature changes and thermal characteristics near the surface within the different experimental LCTs: soil, grass, forest, water, and asphalt. The measurement points of the five LCTs were the same as the five receptors selected for ENVI-met simulations.
Temperature measurements were performed between 1:00 p.m. and 3:00 p.m., when thermal changes in microclimate by LCT were distinctly observed. The measurements were done in summer to clearly represent the thermal characteristics of each LCT, and also done in winter to determine the thermal variation in each LCT when solar radiation was weak. Temperatures were measured through 11 measurement campaigns from the end of July to early September in 2013 for summer period, and 12 campaigns from the end of October through early December in 2012 for winter period. During each campaign, measurements were done for five land cover types. The measurements of each land cover type were repeated three times at the same location for all campaigns. This was done via hand-held measuring devices, such as the illuminometer DT-1308 (It was used just to provide relative light intensity differences so that similar solar intensity conditions could be maintained at each measuring point), the infrared thermometer DT-8865 (for surface measurements), and the temperature meter TESTEK-303A (for simultaneous measurements at two points using an external sensor).
To determine thermal characteristics at and near the ground surface, temperature measurements were done at three different heights at each measurement point. First, the temperature was measured directly on the ground surface in order to observe temperature differences of the natural ground surface between LCTs. Second, the temperature at 0.1 m height was measured to observe near-surface air temperature, directly representing surface thermal properties. Third, the air temperature at 1.5 m, the standard measuring height in which human activities are directly influenced, was measured to analyze the effects of land cover on the human thermal environment, and to understand the relations between surface temperature and air temperature. The measurements were also repeated three times for each height, and the average temperatures calculated were finally used as the representative values for each LCT and height.
2.3. Urban Microclimate Modeling
ENVI-met [30], the three-dimensional non-hydrostatic urban-climate model, has been used to simulate micro-scale interactions between urban surfaces, vegetation and the atmosphere in a number of urban-climate studies [31,32,33]. Since this model has been adopted to examine the effect of greenery, paved areas, and soil type on the thermal environment, and the sophistication of simulations by ENVI-met has been examined by lots of other studies [28,34,35], ENVI-met was adopted to supplement the measurements in this study. Hence, the ENVI-met model was used to simulate the microclimate of the test bed and its surroundings. The entire model domain contained 75 × 75 grids with 20 m grid spacing in the x- and y-directions, and 30 layers with 20 m vertical grid spacing in the z-direction, extending to a height of 600 m.
The model input parameters used are shown in Table 1. The surface data was generated using aerial LiDAR data acquired by the National Geographic Information Institute of Korea.

Table 1.
Input parameters for ENVI-met modeling.
TerraScan and TerraModeler developed by Terrasolid, which are industry-standard software tools, were used for processing the aerial LiDAR data. The data were finally organized in layers of Digital Elevation Model (DEM) and Digital Surface Model (DSM) as geomorphological data, surface cover like building, vegetation, asphalt, soil, and water (Figure 2).
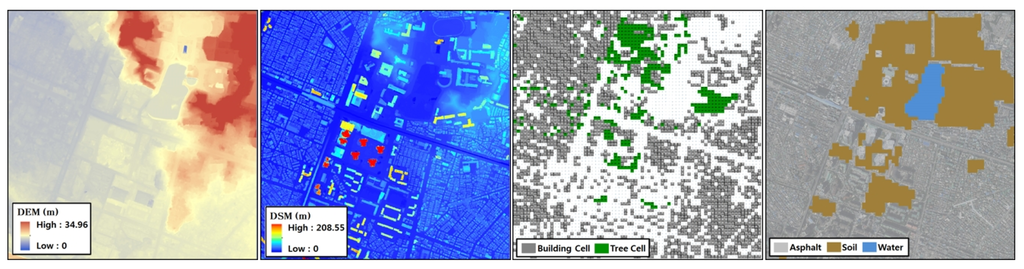
Figure 2.
Input data setting for ENVI-met modeling: Digital Elevation Model (DEM) and Digital Surface Model (DSM) as geomorphological data, surface cover (building or tree) and soil types.
The meteorological parameters were generated from field measurements, from an Automatic Weather Station (AWS) operated by the Korea Meteorological Administration (KMA), and from annual climatological reports published by the KMA. The temperature data were from field measurements using portable devices, wind and humidity data were from an AWS located near the test bed, and soil data were from climatological reports for the years 2012 and 2013. We selected five land cover types (LCTs): paved road in campus was designated as “Asphalt”, lake is representative of “Water”, a soccer field that is bare soil is representative of “Soil”, grass area is representative of “Grass”, and forest area that is underneath the forest canopy is representative of “Forest”. To extract time-sequential data from ENVI-met modeling and to verify modeling results using measurement data, receptor files were setup, showing the state of the atmosphere, the surface and of the soil at selected points inside the ENVI-met model. Hence, five receptors by LCTs (Soil, Grass, Forest, Water, and Asphalt) were defined within the simulation domain.
3. Results and Discussion
3.1. Surface and Air Temperature from Measurement
Table 2 shows the average temperatures of data measured by the portable measuring devices for five LCTs during summer (29 July to 15 September 2013) and winter (25 October to 7 December 2012) periods. Surface and air temperatures at heights of 0.1 m and 1.5 m were collected separately and averaged for each of the five LCTs. The average temperatures represent arithmetic mean of five LCTs, not intended to represent domain-wide average temperatures.
Table 2.
Average temperatures measured by the portable measuring devices for five land cover types at different heights during summer and winter periods (Unit: °C).
Figure 3 shows comparisons of all the vertical-measurement over five LCTs during summer. The measurement temperature exhibited the same patterns at all vertical measurement points. Asphalt had the highest value, followed by soil, grass, water, and forest. This means that artificial land cover has higher temperatures than natural ones in all vertical layers (to the maximum height measured). Taking a closer look at data from the vertical measuring points, the average temperature difference among LCTs at the ground surface was 18.2 °C: asphalt had the highest value (47.3 °C) and forest had the lowest (29.1 °C). The greatest difference was 24.2 °C, recorded on 9 August between asphalt (highest value 53.1 °C) and forest (lowest value 28.9 °C). The difference in surface temperature among LCTs was clearly defined in the summer-heat-wave period following the rainy season. In particular, the temperature over asphalt is clearly higher than other LCTs at the ground surface, compared with those at heights of 0.1 m and 1.5 m. Compared with the average temperature difference at the ground surface, this was clearly lower at 0.1 m, with a difference of 4.1 °C between asphalt (35.3 °C) and forest (31.2 °C). This is because the temperature at this height is affected mainly by atmospheric factors, although it is still affected by the type of land cover. The average temperature difference among LCTs at the height of 1.5 m was 3.1 °C (between asphalt: 34.6 °C and forest: 31.5 °C). This was the lowest difference value, compared with those at other measuring heights.
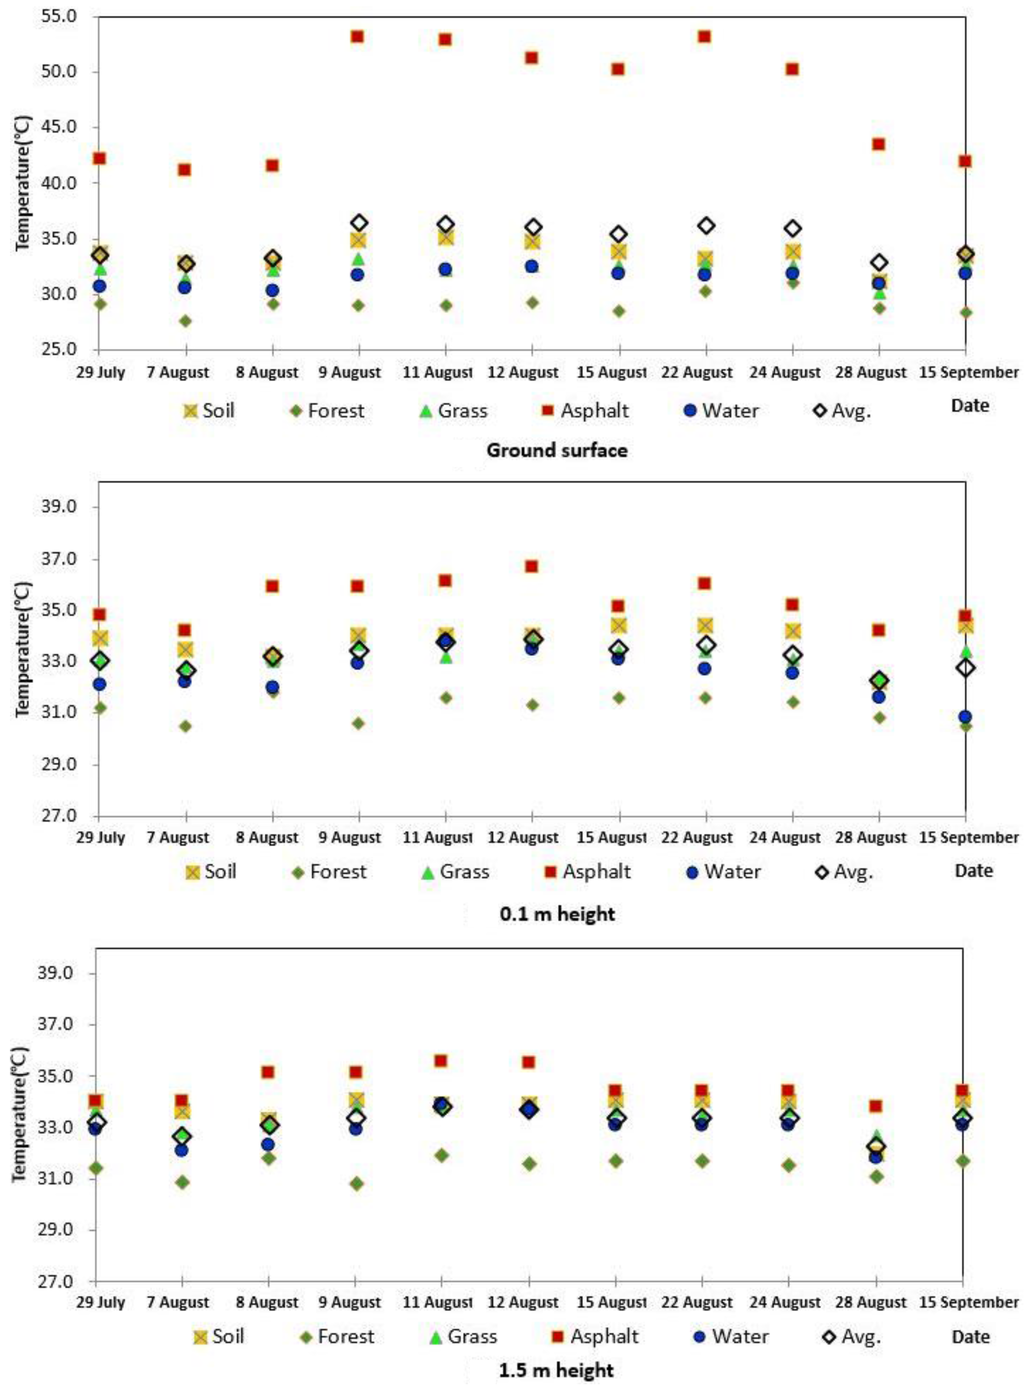
Figure 3.
Temperature variation of five LCTs by vertical measurements during summer.
The interesting result was that artificial and natural land covers have different patterns in vertical variation of thermal microclimate. Asphalt had the highest temperature at the surface (average 47.3 °C), and the value dramatically decreased at the height of 0.1 m (35.4 °C) and 1.5 m (34.6 °C). While temperatures over the artificial land cover declined with increasing height, temperatures over the natural land cover increased with increasing height. The lowest average temperature of the three natural land covers (grass, forest, and water) was recorded at the surface (30.9 °C), and temperatures increased at 0.1 m (32.2 °C) and 1.5 m (32.6 °C). We think that the difference in specific heats between artificial and natural LCTs influences the vertical variation within the thermal microclimate.
Among the temperature patterns at three measuring heights, the temperature over asphalt was higher than over other types at all heights, and this created hot spots. Among the natural LCTs, forest had the lowest temperature at all heights due to the shielding effect of forest canopies (blocks and absorbs solar energy). Compared with the hot spots over asphalt, cool spots definitely formed at micro-scale in the forest.
Similar to the case during summer, asphalt had the highest value at all measuring heights and forest had the lowest during winter. However, compared with that from summer period, the winter showed different variations in temperature with increasing height. While temperature over the artificial land cover declined with increasing height during summer, temperature increased with increasing height during winter. In contrast, temperatures over the natural land covers increased with increasing height, just as in summer.
3.2. Surface Temperature from Microclimate Modeling
Figure 4 shows the temporal distribution of the surface temperatures from the ENVI-met model simulations for summer. Asphalt was the LCT with the highest temperature recorded (averages for each simulation day range from 27.8 °C to 33.0 °C), and it was followed by soil (averages from 22.7 °C to 28.3 °C), forest (averages from 22.8 °C to 28.1 °C), and grass (averages from 22.0 °C to 27.3 °C). Water was the LCT with the lowest (averages from 21.5 °C to 26.9 °C). The highest temperature ranges were found between 12:00 p.m. and 3:00 p.m. in all LCTs. The greatest difference in temperatures occurred between natural and artificial LCTs in the middle of the day, when the solar radiation gradually increasing after sunrise. The maximum temperature difference appeared between asphalt and water at 2:00 p.m., recording the average value of 12.8 °C. The temperature difference between natural and artificial LCTs decreased gradually during the night without the influence of solar radiation, and the minimum difference was founded early in the morning before sunrise (average value of 1.3 °C). These modeling results indicated that high temperatures during daytime are remarkably reduced at night, and verified that the well-known diurnal variation in surface insolation also occurred in our small domain, among the various LCTs. An interesting result was also found between two natural LCTs. The surface temperatures above grass were higher than those over soil during the day, but lower over grass at night. We think that this phenomenon resulted from the variation of specific heat in these two modeled LCTs.
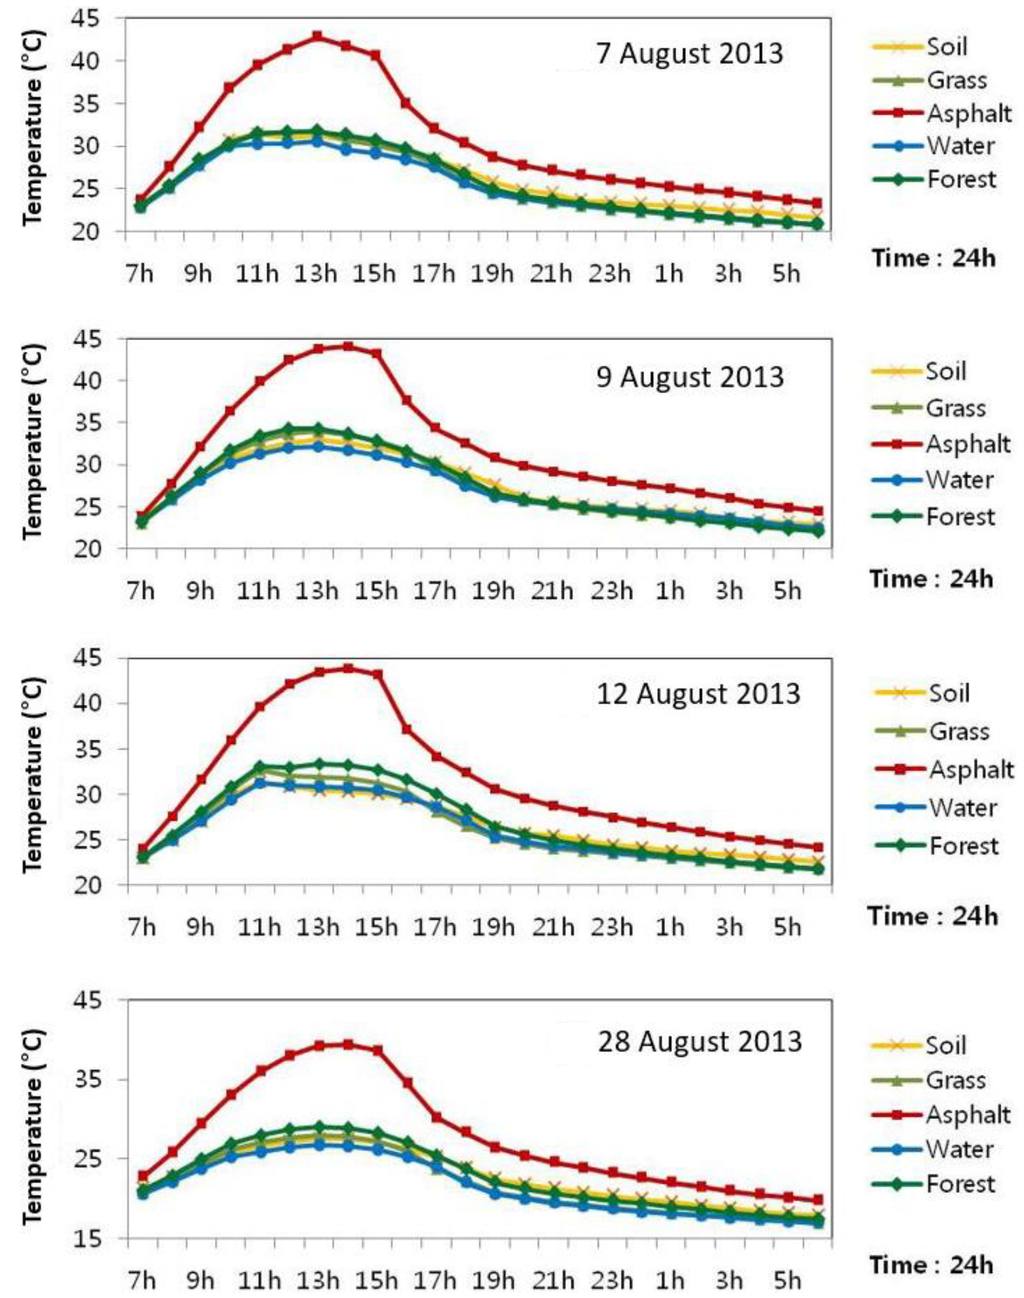
Figure 4.
Temporal distribution of surface temperature from ENVI-met model simulations during summer.
Figure 5 shows the spatial distribution of the surface temperature from the ENVI-met model simulation at 2:00 p.m. As mentioned above, the artificial LCT had higher temperature than natural ones across the domain. Taking a closer look at the case on 7 August 2013 (Figure 5a), surface temperatures above asphalt-covered roads were higher than above other LCTs (daily mean temperature of 33.0 °C). Water, grass and forest were lower than others (daily mean temperatures of 25.3 °C, 25.6 °C, and 25.8 °C, respectively). We also observed that low temperatures also appeared in some densely built-up areas with high buildings and little natural land cover. These were the result of effects from shadows cast by the high buildings.
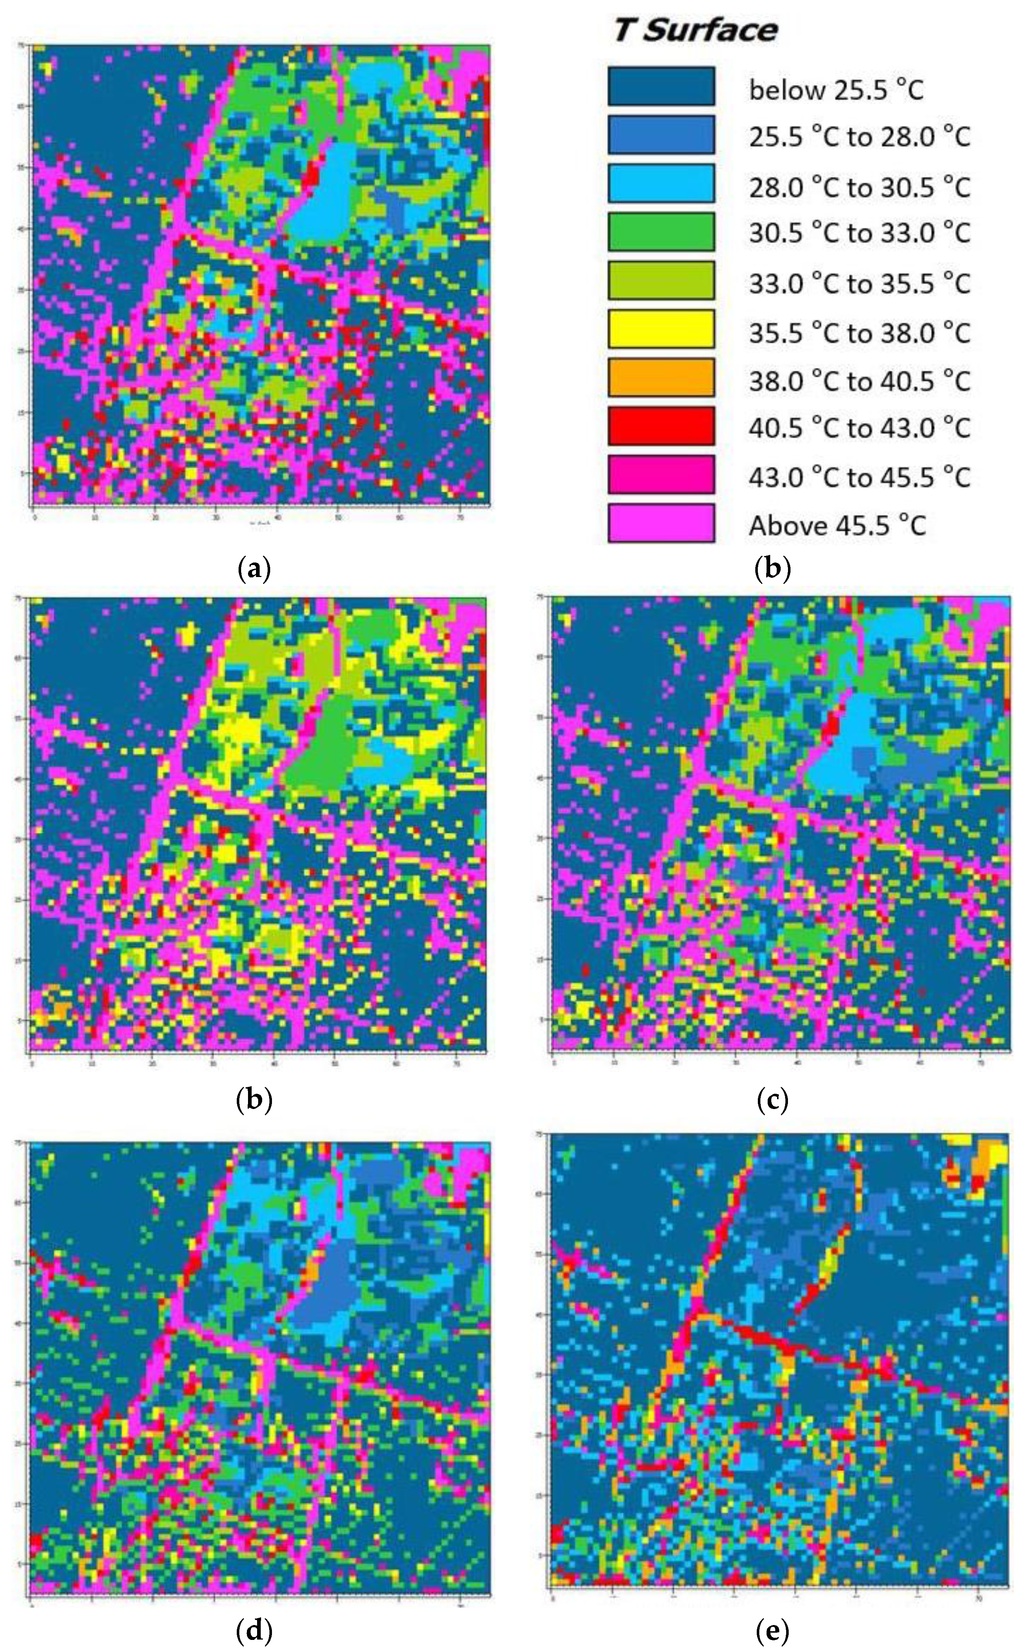
Figure 5.
Spatial distribution of surface temperature from ENVI-met model simulations at 2:00 p.m. during summer. (a)–(e) mean the target dates for the modeling: (a) 7 August 2013; (b) 9 August 2013; (c) 12 August 2013; (d) 28 August 2013; (e) 15 September 2013
The spatial distribution of surface temperatures during winter exhibits patterns similar to those of summer. Figure 6a shows the result of ENVI-met model simulation at 2:00 p.m. on 1 November 2012. Asphalt had the highest temperature (15.7 °C), while water and grass had the lowest (10.6 °C and 9.9 °C, respectively). The maximum temperature difference at 2:00 p.m. in winter was between asphalt and grass (5.8 °C). Compared to summer the difference was lower, but the spatial pattern of temperature variation by LCT was similar.
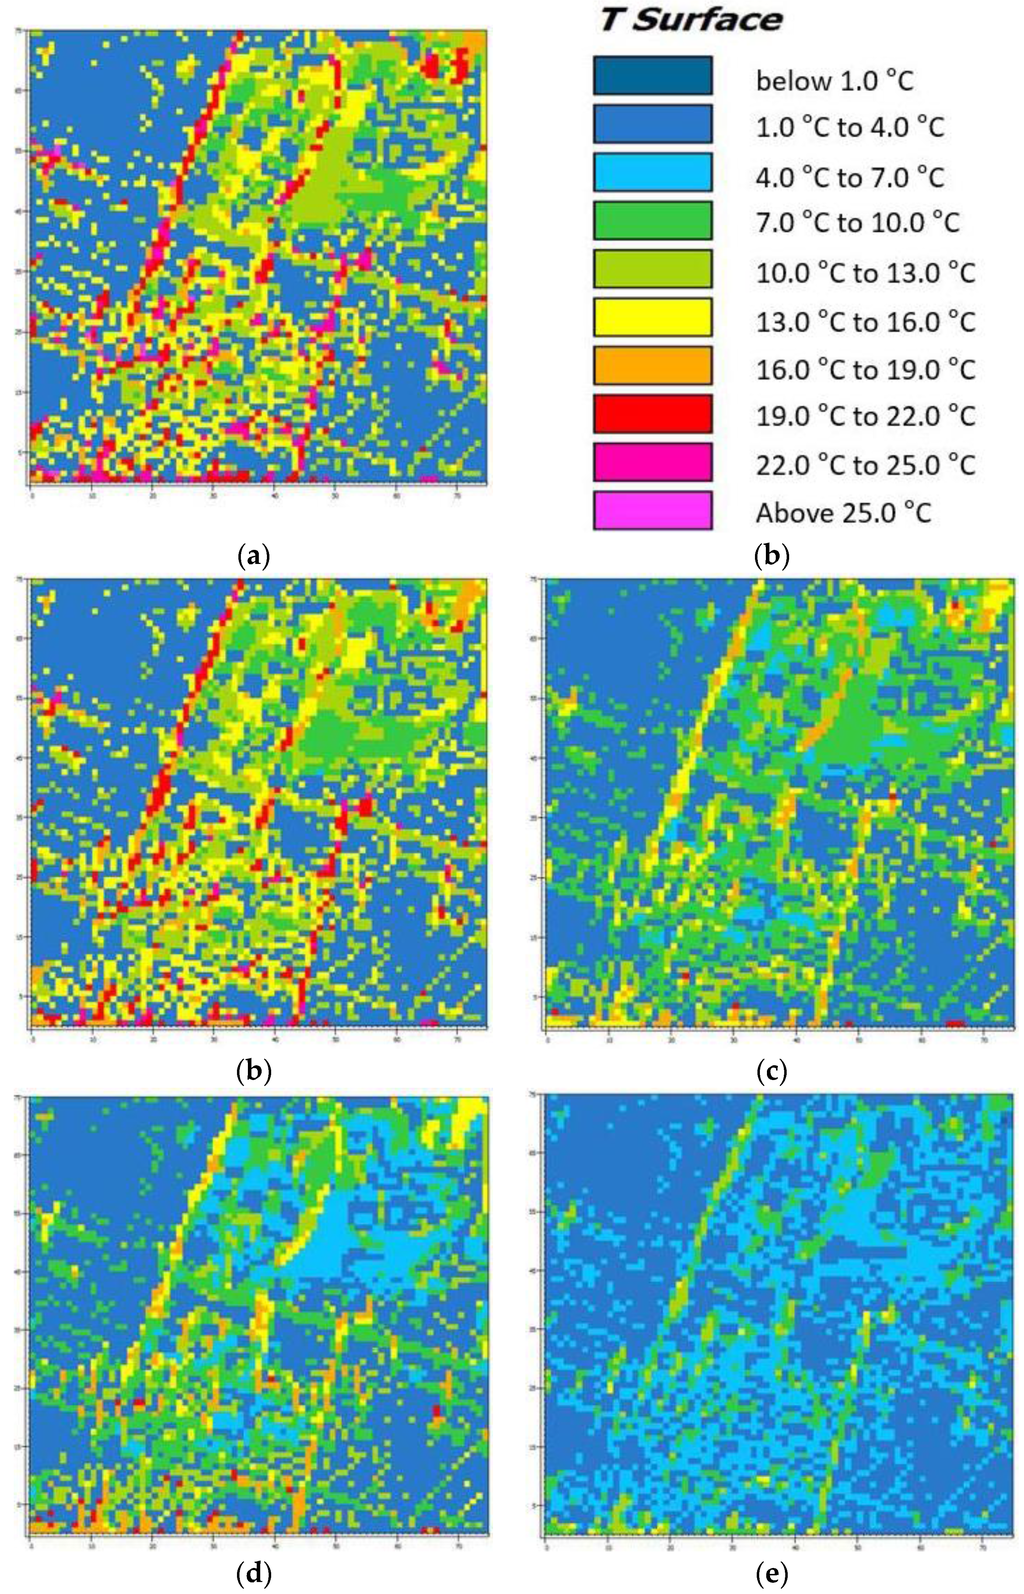
Figure 6.
Spatial distribution of surface temperature from ENVI-met model simulations at 2:00 p.m. during winter. (a)–(e) mean the target dates for the modeling: (a) 1 November 2012; (b) 12 November 2012; (c) 24 November 2012; (d) 2 December 2012; (e) 7 December 2012.
3.3. Correspondence Analysis between Microclimate Modeling and Measurement Data
The correspondence between microclimate modeling (using ENVI-met) and the temperature data (measured by portable measuring devices) was analyzed. The analysis was done using surface temperatures from modeling and measurement for each type of land cover at 2:00 p.m. in the summer and in the winter. The ratio of modeling data to measurement data ranged from 1.0 (9 August 2013) to 20.76 (7 December 2012). The median ratio for each LCT was 0.93 (asphalt), 0.96 (soil), 0.97 (grass), 1.01 (water), and 1.16 (forest). On average, a median ratio of 0.98 shows high correspondence between the modeling data and measurement data.
Figure 7 is the result of linear regression analysis of surface temperatures from modeling and measurement data for each LCT. The gradient of the trend line ranged from 1.06 (forest) to 1.30 (asphalt), and the R-squared values (R2) ranged from 0.94 to 0.96 (averaged 0.96), which indicates the model underestimates by 6%–30%. The correlations between modeling data and measurement data were strong for all LCTs. Compared with other studies used ENVI-met modeling such as [30] (slope: 1.7395 and y intercept: 24.132) and [35] (slope: −3.14–8.22 and y intercept: 0.76–1.20), we think the agreements showed in Figure 7 can be evaluated as a reasonably good modeling performance.
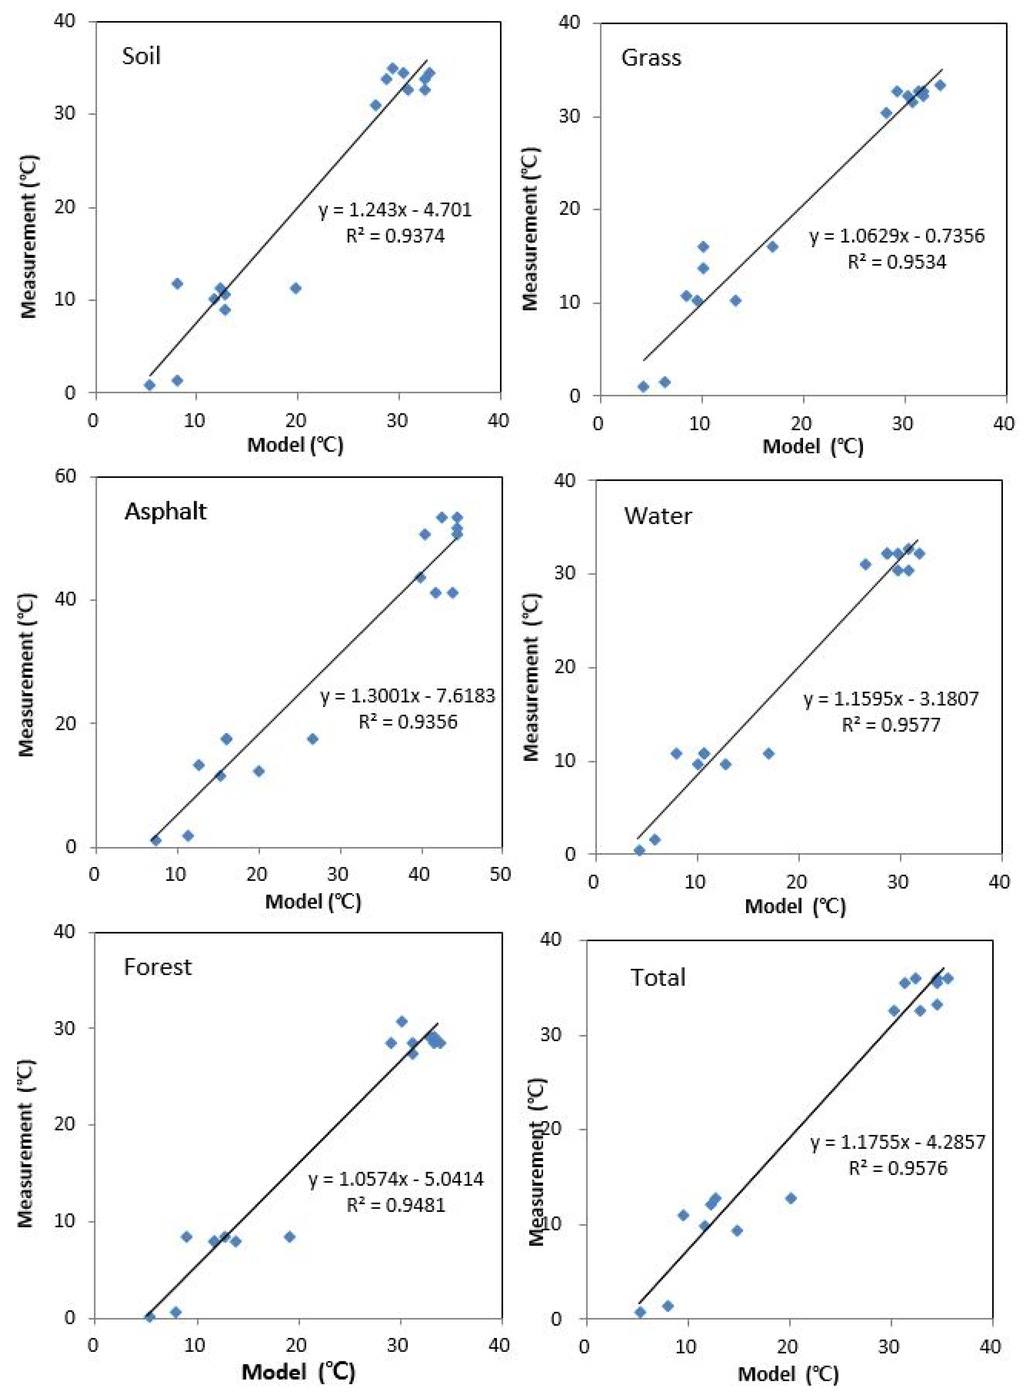
Figure 7.
Inter-comparison of surface temperature from ENVI-met modeling and direct measurements for 23 days of summer and winter.
3.4. Analysis of Cool Island Effects by Model Simulation and Measurement Data
As mentioned in the introduction, cool islands can mitigate damage from thermal extremes like heat waves. Hence, they are mostly important in summer, particularly in the mid-afternoons. Table 3 shows the minimum, maximum and average values of diurnal temperature of each land cover type, based on 33 samples from 11 measurement campaigns. According to measurements performed in mid-afternoon during August, the diurnal thermal variation at the ground surface of the five LCTs ranges from 27.6 °C to 53.1 °C. Using temperatures averaged over the entire measurement period, the temperature variation of forest had the lowest value (5.6 °C lower than the average), while that of asphalt had the highest value (12.6 °C higher than the average).
Table 3.
Comprehensive summary of diurnal temperature variation based on 33 samples from 11 measurement campaigns for five land cover types at different heights during summer period. The value in parentheses indicates the difference from the average value of five LCTs (Unit: °C).
Measures of daily thermal variation at the height of 0.1 m also indicate that the forest had the least variation (with minimum value of 30.5 °C) and that asphalt had the highest (with maximum value of 36.7 °C). Compared with the results at the ground surface, temperature variation at this height was greatly reduced; although, the hot-to-cold order by LCT remained unchanged. The temperature variation, averaged over the entire measurement period, ranged from 2.0 °C lower than the average in forest, to 2.1 °C higher in asphalt.
The daily thermal variation at the height of 1.5 m also indicated that the forest had the lowest variation (with minimum value of 30.8 °C) and asphalt had the highest (with maximum value of 35.6 °C). The temperature variation, averaged over the entire measurement period, ranged from 1.7 °C lower than the average in forest, to 1.4 °C higher over asphalt.
At all vertical measuring points, the average temperature over the entire measurement period had the same hot-to-cold order: asphalt > soil > grass > water > forest (Figure 8). This result substantiates that LCTs influence changes in air temperature, and that their effects are reduced with increasing distance from the surface that serves as the heat source. Furthermore, the phenomenon that at all vertical heights, hot spots formed over asphalt and cool spots formed in forest, plays an important role in urban micro-scale thermal environments.
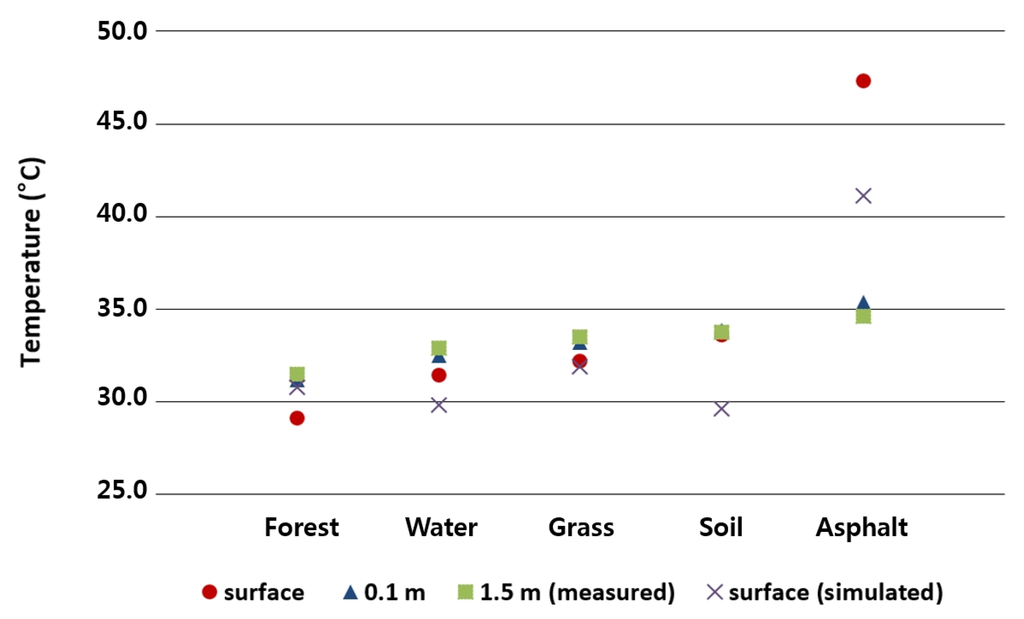
Figure 8.
Average temperature by land-cover types at three vertical measuring points and mean surface temperature from ENVI-met simulation.
Figure 9 shows daily mean surface temperature by LCT from the ENVI-met simulation during August. Similar to the measurement results, the highest temperatures were found for asphalt, which was clearly distinguished from the likes of grass and water. Unlike for the measurement results, the second highest temperature recorded was for grass. This cover type had a significantly higher maximum value (than measured), although the average value is definitely lower than asphalt, and similar to that of forest. The lowest values were those for soil and water.
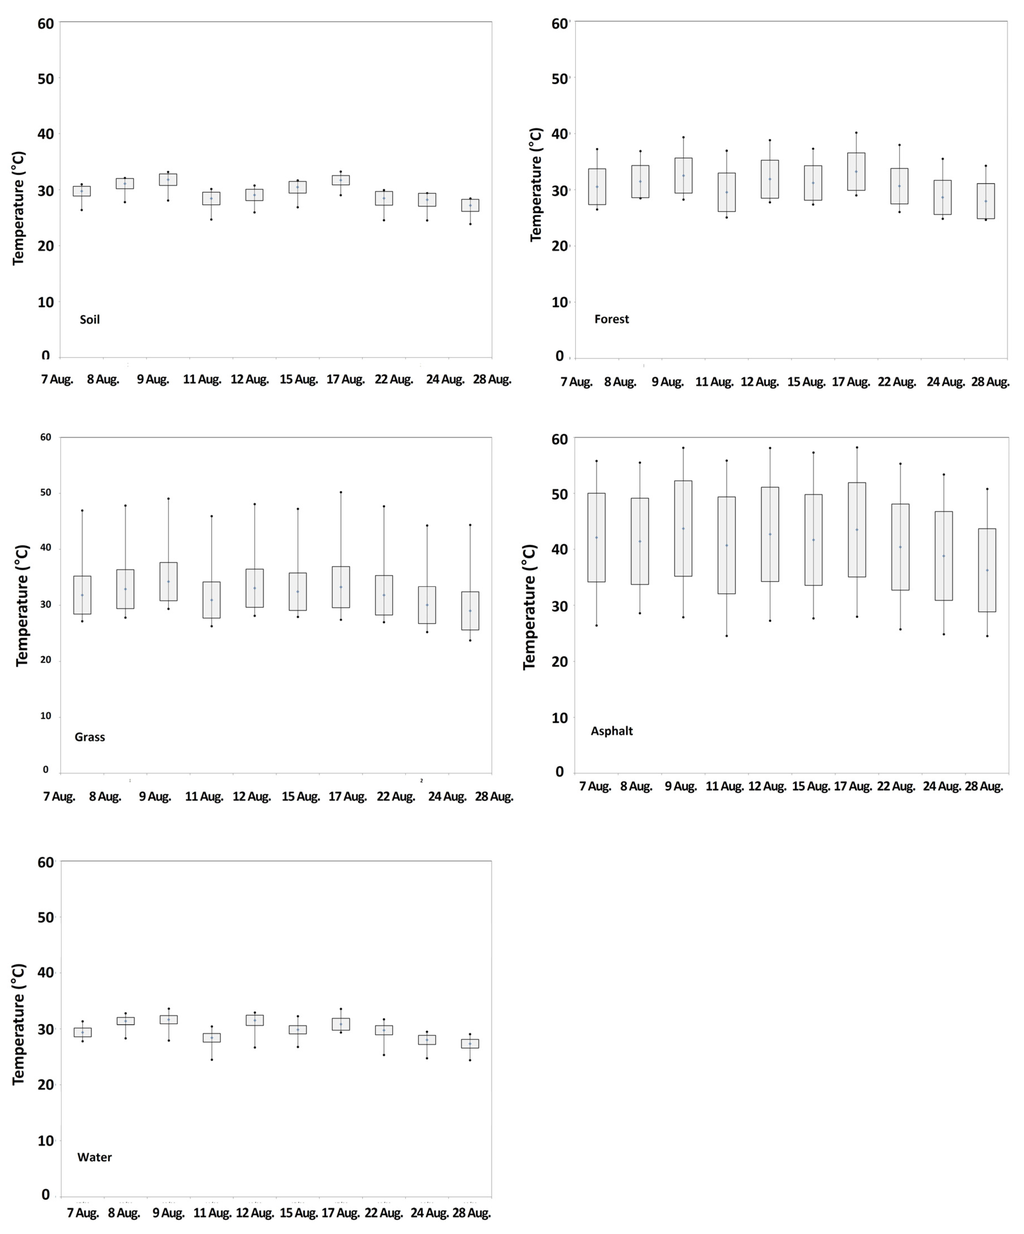
Figure 9.
Estimated distribution of mean surface temperature by land cover types from ENVI-met simulation during August.
Overall mean surface temperature by LCT from model simulation was inter-compared as shown in Figure 10. The highest mean surface temperature appeared in asphalt (41.1 °C), followed by grass (31.9 °C), forest (30.8 °C), water (29.8 °C), and soil (29.6 °C). The difference between artificial and natural LCTs was clearly identified (greater than 9.2 °C), but that among natural LCTs was less than 2.3 °C. This indicates that the greatest temperature reductions (i.e., cool island effects) occur when artificial land cover is changed to natural land cover (e.g., grass, forest, and water). Moreover, variation in cooling effect from switching among natural land covers appears to be relatively low; however, bioclimatic aspects of microclimate like humidity control within each LCT were not considered in this study.
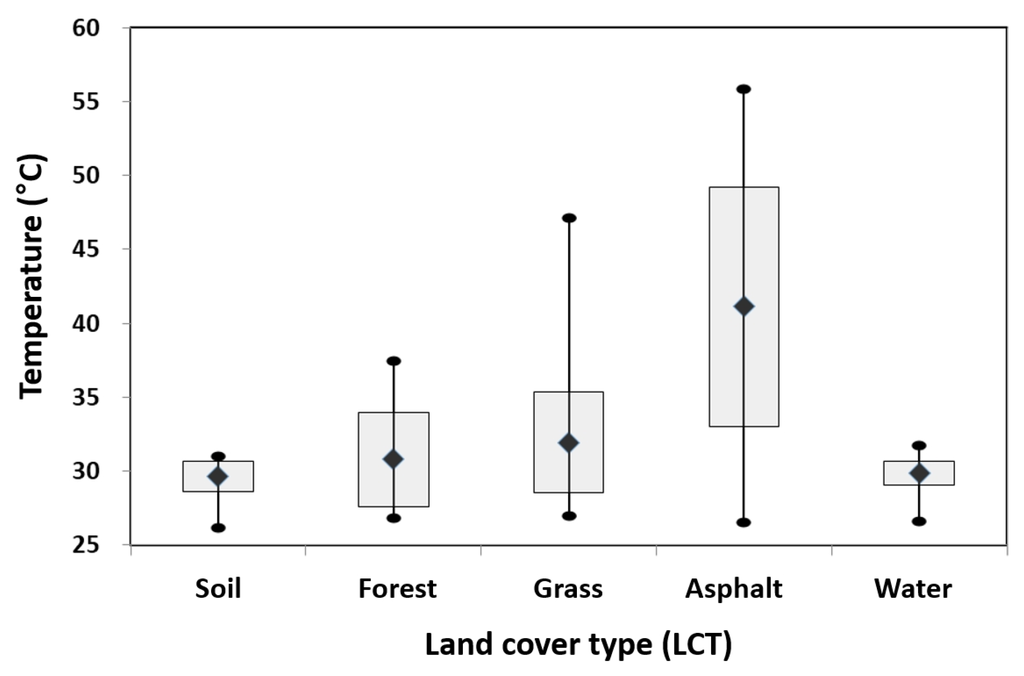
Figure 10.
Inter-comparison of overall mean surface temperature by land cover types from ENVI-met simulation during August.
4. Conclusions
The aim of this study was to understand the climatic effect of changes of land cover on surface and air temperatures in urban micro-scale thermal environments. To achieve this, the Konkuk University campus (Seoul, South Korea) was selected as a test bed, and five places were chosen to represent the five LCTs—asphalt, soil, grass, forest, and water. At these places, we measured surface temperatures, and air temperatures at the heights of 0.1 m and 1.5 m during summer and winter. Then we compared the measured temperatures with AWS-observed values and microclimate modeling results from ENVI-met.
At all vertical measuring points, the average temperature over the entire measurement period had the same hot-to-cold order: asphalt > soil > grass > water > forest. However, the value dramatically decreased as the measuring points became higher. This result substantiates that LCTs influence changes in air temperature, and that their effects are reduced with increasing distance from the surface that serves as the heat source and with the materials involved (solid and liquid surface vs. air).
The formation of hot and cool spots according to LCTs was also verified. Among the temperature patterns at three measuring heights, the temperature over asphalt was higher than over other types at all heights, and this created hot spots. Compared with the hot spots over asphalt, cool spots definitely formed at micro-scale in the forest. However, the intensity of hot and cool spots showed different characteristics. The average temperature difference among LCTs at the ground surface was 18.2 °C between asphalt (47.3 °C) and forest (29.1 °C). It was clearly lower at 0.1 m, with a difference of 4.1 °C between asphalt (35.3 °C) and forest (31.2 °C), and at the height of 1.5 m with 3.1 °C between asphalt (34.6 °C) and forest (31.5 °C).
Similar results were found in the ENVI-met model simulations. The natural LCTs such as grass and forest showed lower temperatures, whereas the artificial one (asphalt) showed a much higher surface temperature. During the daily change in temperature by land cover during summer, the maximum temperature difference appeared between asphalt and water at 2:00 p.m. (average of 12.8 °C), and the minimum appeared early in the morning before sunrise (average of 1.3 °C). These modeling results indicated that high temperatures during daytime are remarkably reduced at night, and verified that the well-known diurnal variation in surface insolation also occurred in our small domain, among the various LCTs.
From both measurements and microclimate modeling, we verified the formation of hot spots and cool spots according to LCTs in micro-scale thermal environments. The hot spots, which caused increases in air temperature, formed over artificial land covers such as asphalt, whereas the cool spots formed over natural LCTs. In particular, forest has a stronger influence on cool spot formation than do grass and water. Hence, artificial land cover should be changed to natural land cover like grass, forest, and water to obtain cooling effects. It is also recommended that changing asphalt and concrete land covers to forest would provide the greatest thermal effects by creating the most significant cool spots. Based on these findings, providing green infrastructure in densely built-up areas could be an effective way to improve urban micro-scale thermal conditions.
Our study focused on providing quantitative thermal information that can be used to find effective ways to improve urban micro-scale thermal conditions in the densely built-up areas, like Seoul. The results can provide real range of temperature differences, which can be used to assess the effectiveness of urban regeneration plans for old industrial zones and old residential areas. Series of modeling experiments to assess the effectiveness of those planning measures, from the microclimate viewpoint, should be conducted as follow-up research.
Acknowledgments
This paper was written as part of Konkuk University’s research support program for its faculty on sabbatical leave in 2014. It was also funded by the Climate Change Expert Program and by Basic Science Research Program through the National Research Foundation of Korea (NRF-2015R1C1A2A01052513).
Author Contributions
Jung-Hun Woo developed the study idea and design the research framework. Jeong-Hee Eum consulted on the overall data analysis and manuscript development. Seung-Man An supported the modeling experiments. Younha Kim performed overall research processes and wrote the manuscript.
Conflicts of Interest
The authors declare no conflict of interest.
References
- Basu, R.; Samet, J.M. Relation between elevated ambient temperature and mortality: A review of the epidemiologic evidence. Epidemiol. Rev. 2002, 24, 190–202. [Google Scholar] [CrossRef] [PubMed]
- Chang, C.R.; Li, M.H.; Chang, S.D. A preliminary study on the local cool island intensity of Taipei city parks. Landsc. Urban Plan. 2007, 80, 386–395. [Google Scholar] [CrossRef]
- Klenk, J.; Clemens, B.; Kilian, R. Heat-related mortality in resident of nursing homes. Age Ageing 2010, 39, 245–252. [Google Scholar] [CrossRef] [PubMed]
- Scheers-Masters, J.R.; Schootman, M.; Thach, B.T. Heat stress and sudden infant death syndrome incidence: A United States population epidemiologic study. Pediatrics 2004, 113, 586–592. [Google Scholar] [CrossRef]
- Kolokotroni, M.; Zhang, Y.; Watkins, R. The London heat island and building cooling design. Sol. Energy 2007, 81, 102–110. [Google Scholar] [CrossRef]
- Abreu-Harbich, L.V.; Labaki, L.C.; Matzarakis, A. Effect of tree planting design and tree species on human thermal comfort in the tropics. Landsc. Urban Plan. 2015, 138, 99–109. [Google Scholar] [CrossRef]
- Alavipanah, S.; Wegmann, M.; Qureshi, S.; Weng, Q.; Koellner, T. The Role of Vegetation in Mitigating Urban Land Surface Temperatures: A Case Study of Munich, Germany during the Warm Season. Sustainability 2015, 7, 4689–4706. [Google Scholar] [CrossRef]
- Brown, R.D.; Vanos, J.; Kenny, N.; Lenzholzer, S. Designing urban parks that ameliorate the effects of climate change. Landsc. Urban Plan. 2015, 138, 118–131. [Google Scholar] [CrossRef]
- Emmanuel, R.; Loconsole, A. Green infrastructure as an adaptation approach to tackling urban overheating in the Glasgow Clyde Valley Region, UK. Landsc. Urban Plan. 2015, 138, 71–86. [Google Scholar] [CrossRef]
- Norton, B.A.; Coutts, A.M.; Livesley, S.J.; Harris, R.J.; Hunter, A.M.; Williams, N.S.G. Planning for cooler cities: A framework to prioritise green infrastructure to mitigate high temperatures in urban landscapes. Landsc. Urban Plan. 2015, 134, 127–138. [Google Scholar] [CrossRef]
- Cao, X.; Onishi, A.; Chen, J.; Imura, H. Quantifying the cool island intensity of urban parks using ASTER and IKONOS data. Landsc. Urban Plan. 2010, 96, 224–231. [Google Scholar] [CrossRef]
- Jauregui, E. Influence of a large urban park on temperature and convective precipitation in a tropical city. Energy Build. 1990, 15, 457–463. [Google Scholar] [CrossRef]
- Skoulika, F.; Santamouris, M.; Kolokotsa, D.; Boemi, N. On the thermal characteristics and the mitigation potential of a medium size urban park in Athens, Greece. Landsc. Urban Plan. 2014, 123, 73–86. [Google Scholar] [CrossRef]
- Spronken-Smith, R.A.; Oke, T.R. The thermal regime of urban parks in two cities with different summer climates. Int. J. Rem. Sens. 1998, 19, 2085–2104. [Google Scholar] [CrossRef]
- Upmanis, H.; Eliasson, I.; Lindqvist, S. The influence of green areas on nocturnal temperatures in a high latitude city (Göteborg, Sweden). Int. J. Climatol. 1998, 18, 681–700. [Google Scholar] [CrossRef]
- Lin, W.; Yu, T.; Chang, X.; Wu, W.; Zhang, Y. Calculating cooling extents of green parks using remote sensing: Method and test. Landsc. Urban Plan. 2015, 134, 66–75. [Google Scholar] [CrossRef]
- Eum, J.H.; Scherer, D.; Fehrenbach, U.; Woo, J.H. Development of an urban landcover classification scheme suitable for representing climatic conditions in a densely built-up Asian megacity. Landsc. Urban Plan. 2011, 103, 362–371. [Google Scholar] [CrossRef]
- Kong, F.; Yin, H.; James, P.; Hutyra, L.R.; He, H.S. Effects of spatial pattern of greenspace on urban cooling in a large metropolitan area of eastern China. Landsc. Urban Plan. 2014, 128, 35–47. [Google Scholar] [CrossRef]
- Yokohari, M.; Brown, R.D.; Kato, Y.; Yamamoto, S. The cooling effect of paddy fields on summertime air temperature in residential Tokyo, Japan. Landsc. Urban Plan. 2001, 53, 17–27. [Google Scholar] [CrossRef]
- Cheng, K.-S.; Su, Y.-F.; Kuo, F.-T.; Hung, W.-C.; Chiang, J.-L. Assessing the effect of landcover changes on air temperature using remote sensing images—A pilot study in northern Taiwan. Landsc. Urban Plan. 2008, 85, 85–96. [Google Scholar] [CrossRef]
- Song, J.; Du, S.; Feng, X.; Guo, L. The relationships between landscape comparisons and land surface temperature: Quantifying their resolution sensitivity with spatial regression models. Landsc. Urban Plan. 2014, 123, 145–157. [Google Scholar] [CrossRef]
- Eum, J.H.; Scherer, D.; Fehrenbach, U.; Köppel, J.; Woo, J.H. Integrating urban climate into urban master plans using spatially distributed information—The Seoul example. Land Use Policy 2013, 34, 223–232. [Google Scholar] [CrossRef]
- Woo, J.H.; Kim, H.S.; Lim, S.B.; Kim, J.J.; Lee, J.; Ryoo, R.; Kim, H. AirScope: A micro-scale urban air quality management system. Lect. Notes Comput. Sci. 2010, 6081, 520–527. [Google Scholar]
- Shashua-Bar, L.; Hoffman, M.E. Vegetation as a climatic component in the design of an urban street. An empirical model for predicting the cooling effect of urban green areas with trees. Energy Build. 2000, 31, 221–235. [Google Scholar] [CrossRef]
- Shashua-Bar, L.; Pearlmutter, D.; Erell, E. The cooling efficiency of urban landscape strategies in a hot dry climate. Landsc. Urban Plan. 2009, 92, 179–186. [Google Scholar] [CrossRef]
- Mazhar, N.; Brown, R.D.; Kenny, N.; Lenzholzer, S. Thermal comfort of outdoor spaces in Lahore, Pakistan: Lessons for bioclimatic urban design in the context of global climate change. Urban Plan. 2015, 138, 110–117. [Google Scholar] [CrossRef]
- Barradas, V.L. Air temperature and humidity and human comfort index of some city parks of Mexico City. Int. J. Biometeorol. 1991, 35, 24–28. [Google Scholar] [CrossRef] [PubMed]
- Oliveira, S.; Andrade, H.; Vaz, T. The cooling effect of green spaces as a contribution to the mitigation of urban heat: A case study in Lisbon. Build. Environ. 2011, 46, 2186–2194. [Google Scholar] [CrossRef]
- Ng, E.; Chen, L.; Wang, Y.N.; Yuan, C. A study on the cooling effects of greening in a high-density city: An experience from Hong Kong. Build. Environ. 2012, 47, 256–271. [Google Scholar] [CrossRef]
- Bruse, M.; Fleer, H. Simulating surface-plant-air interactions inside urban environments with a three dimensional numerical model. Environ. Model. Softw. 1998, 13, 373–384. [Google Scholar] [CrossRef]
- Ketterer, C.; Matzarakis, A. Human-biometeorological assessment of heat stress reduction by replanning measures in Stuttgart, Germany. Landsc. Urban Plan. 2014, 122, 78–88. [Google Scholar] [CrossRef]
- Middela, A.; Häb, K.; Brazel, A.J.; Martin, C.A.; Guhathakurta, S. Impact of urban form and design on mid-afternoon microclimate in Phoenix Local Climate Zones. Landsc. Urban Plan. 2014, 122, 16–28. [Google Scholar] [CrossRef]
- Perini, K.; Magliocco, A. Effects of vegetation, urban density, building height, and atmospheric conditions on local temperatures and thermal comfort. Urban For. Urban Green. 2014, 13, 495–506. [Google Scholar] [CrossRef]
- Yang, X.S.; Zhao, L.H.; Bruse, M.; Meng, Q.L. Evaluation of a microclimate model for predicting the thermal behavior of different ground surfaces. Build. Environ. 2013, 60, 93–104. [Google Scholar] [CrossRef]
- Yang, S.R.; Lin, T.P. An integrated outdoor spaces design procedure to relieve heat stress in hot and humid regions. Build. Environ. 2016, 99, 149–160. [Google Scholar] [CrossRef]
© 2016 by the authors; licensee MDPI, Basel, Switzerland. This article is an open access article distributed under the terms and conditions of the Creative Commons by Attribution (CC-BY) license (http://creativecommons.org/licenses/by/4.0/).