
The Productivity Paradox in Green Buildings

1
School of Architecture, University of Lincoln, Lincoln LN6 7TS, UK
2
School of Engineering and Advanced Technology, Massey University, Palmerston North 4474, New Zealand
*
Author to whom correspondence should be addressed.
Sustainability 2016, 8(4), 347; https://doi.org/10.3390/su8040347
Submission received: 2 February 2016
/
Revised: 20 March 2016
/
Accepted: 28 March 2016
/
Published: 8 April 2016
(This article belongs to the Special Issue Advances in Post Occupancy Evaluation)
Abstract
:In this paper we challenge the notion that “green” buildings can achieve greater productivity than buildings that are not accredited as “green”. For nearly two decades, research has produced apparent evidence which indicates that the design of a “green” building can enhance the productivity of its occupants. This relationship between building design and productivity is claimed to be achieved through compliance with internal environmental quality (IEQ) criteria of Green rating tools. This paper reviews methods of measuring productivity and the appropriateness of the metrics used for measuring IEQ in office environments. This review is supported by the results of a survey of office building users which identifies social factors to be significantly more important than environmental factors in trying to correlate productivity and IEQ. It also presents the findings of observations that were discretely carried out on user-response in green buildings. These findings demonstrate that, despite a building’s compliance with IEQ criteria, occupants still resort to exceptional measures to alter their working environment in a bid to achieve comfort. The work has been carried out on “green” buildings in New Zealand. These buildings are rated based on the NZ “Green Star” system which has adopted the Australian “green star” system with its roots in BREEAM. Despite this, the results of this research are applicable to many other “green” rating systems. The paper concludes that methods of measuring productivity are flawed, that IEQ criteria for building design is unrepresentative of how occupants perceive the environment and that this can lead to an architecture that has few of the inherent characteristics of good environmental design.
1. Introduction
The claim of greater productivity from the occupants of a certified “green” building appeals to developers, commercial users, accrediting organisations and building professionals [1]. As more and more buildings are being designed and assessed based on the criteria of green rating tools, occupant productivity has become the central marketing characteristic of “green” office buildings [2,3,4]. However, the ontological security in the belief that “green” can be synonymous with productivity has left many questions unanswered. How can productivity in an office environment be robustly measured? How does productivity relate to internal environmental quality (IEQ)? Are the standard IEQ metrics (e.g., light levels and temperatures) representative of a good working environment? Without these questions being answered it cannot be claimed that a “green” building is any more productive than a reasonably well designed non-green building.
While a “green” building can be defined as one that achieves a given amount of credits under a certain rating system, “green” buildings are marketed by their design and their image as a complete building. The implication is that the architecture is “green” and that “greenness” is intrinsic in the very shape, envelope and even style of the building. This is also embedded in research on green buildings. For example, the cost benefit of green buildings is not measured by the cost of individual “green” initiatives but by the whole building costs [5]. The scope of this paper is to assess the relationship between the architecture of “green” office buildings and the claim that they enhance productivity. A claim that is based on the assumption that “green” accreditation results in a building where certain values of IEQ are achieved thereby produce comfort conditions that induce higher worker productivity [6].
The methods selected in this research analyse the relationship between building design and productivity by reviewing the literature that claims to relate IEQ criteria to comfort and also the literature that relates IEQ to the measurement of productivity. The research challenges the claimed link between IEQ and productivity by the self-appraisal method [7] and presents the results of an alternative questionnaire carried out on a sample of green’ building occupants. The results indicate that IEQ is not a significant factor in measuring productivity and this is supported by the literature review which identifies that a far broader range of IEQ standards, than those specified in green rating tools, provides comfort conditions and, potentially, greater productivity.
The surveys and fieldwork presented by the authors in this paper have been carried out on “green” buildings in New Zealand and the criteria for achieving “green” accreditation is based on the New Zealand Green Star rating tool (New Zealand Green Building Council). While New Zealand has some special characteristics, such a high proportion of renewable energy and a mild climate, the discussion and conclusions are likely to apply internationally.
It is important to point out that this research does not address the claimed relationship between productivity and the specification of internal materials, cleanliness or maintenance [8]. These are not an intrinsic part of architecture and the ability of a building’s IEQ to enhance productivity should not be confused with potential reduction in productivity due to poor specification or maintenance.
The principal architectural characteristics of a building that control the natural environment and have the capacity to enhance productivity by influencing IEQ are the distribution of natural light, natural ventilation (unless fully air-conditioned) and the control of solar gains (both beneficial and unwanted). These control systems are manifest in the proportions and type of glazing, the depth of rooms, thermal mass, solar protection and orientation of the building [9].
The difficulty arises when buildings can satisfy IEQ criteria, such as lighting and temperature standards, by the use of mechanical means only. Green buildings that are highly glazed, fully air conditioned, lightweight without solar protection do not achieve a good IEQ by virtue of the building design (architecture) but by the electromechanical services consuming unnecessary amounts of energy in order to compensate for a poor design [10]. In these circumstances, buildings tend to conform to environmental standards within a limited and prescribed “comfort” range which achieve accreditation as “green” but offer little opportunity for user adaptation. This will be discussed further in Section 5 below.
2. Measuring Productivity
Workforce productivity is the amount of goods or services that a worker produces in a given amount of time [11]. While the definition is simple, the means of measuring productivity of workers in a commercial building is fraught with problems. Much of the produce in an office is intangible and economic gain or loss may not reflect the amount of labour intensity. In brief, methods of measurement generally fall into two categories: psychometric tests or self-appraisal [12]. In contrast, the psychometrics test involves the use of various reasoning tests (diagrams, numerals or verbal) to measure the productivity of participants; self-appraisal relies on the respondent’s judgement of his/her productivity.
Psychometric tests have the weakness that they generally consider only one aspect of the environment (e.g., heat or light) at a time and do not consider the holistic interaction of participants with the environment [13]. They also tend to suffer from the Hawthorne effect; the responses are skewed by the participants’ awareness of being tested. A good example of this is Lan and Lian [14] who found that participants performed better at psychometric tests under uncomfortably high temperatures because they wanted to get the test over with quickly.
As an alternative to psychometric tests, self-assessment tests were introduced as a measure of “perceived productivity”, rather than actual productivity, and rely on participants responding to questionnaires that primarily attempt to correlate IEQ to productivity. The advantages and disadvantages of using “perceived productivity” as a surrogate for productivity are discussed by Leaman and Bordass [15] and while there are advantages in the economy of large samples and uses over a wide range of building types, there always remains the question of whether “perceived productivity” is an indicator of actual productivity. There is also the disadvantage, noted by Haynes [12], that a single question on productivity in a questionnaire is a weakness as there are no benchmarks for the participant to comprehend the concept of productivity. Haynes concludes that, “it is clear that the self-assessed measure of productivity is better than no measure of productivity” [12] (p. 153). Leaman and Bordass [15] also acknowledge that it is impossible to establish a meaningful productivity measure for office occupants, and propose that, in the absence of any other suitable measure, perceived productivity be used as a surrogate.
Clements-Croome [16] suggests a wider range of productivity indicators, such as health and well-being, interruptions to work and overtime but still excludes social factors that may come from outside the workplace (e.g., loss of sleep, personal and work relationships). What is lacking in the indicators for productivity is some idea of the magnitude of both social and environmental factors. For example, is a good breakfast more important than a 10% increase in daylight? While it may be argued that social factors are outside the control of building designers, the relative magnitude is of importance as social factors may reduce the validity of self-appraisal that focuses on environmental factors. For example, sleep deprivation alters cognitive function and can make even the best of environments intolerable [17].
To demonstrate this issue further a questionnaire was designed [18] to identify the relative importance of social and environmental factors and is described in more detail in Section 4. The importance of this survey is not only to show that social factors are often more important than environmental factors but that self-appraisal questionnaires, that attempt to relate productivity to IEQ, are in danger of prompting responses and producing biased responses on environmental issues. However, it is important to discuss what characteristics of the internal environment are relevant and can be used as a metric for productivity before describing the results of the questionnaire.
3. Measuring IEQ
If there is a link between productivity and IEQ, then it is important to establish which environmental indicators are relevant to productivity and what value, or range of values, these indicators should have. This section reviews the literature concerned with this topic and compares current research with the indicators used by “green” rating tools. Focus is placed on the thermal and visual environment since these are the main factors that are influenced by architecture and where most IEQ credits are given.
IEQ criteria considered by both psychometric and self-appraisal methods, include the thermal, visual and acoustic environments as well as air quality. As discussed above, this analysis focuses on those indicators that have implications on the architectural form of a building rather than the specification of materials to avoid poor IEQ. Issues concerning the acoustic environment are mainly concerned with internally generated noise [19] and have few implications for the building envelope. Similarly, controlling air-quality has little to do with the architecture of a building as it is either controlled by a mechanical ventilation system or, if naturally ventilated, the external air quality is outside the control of the designer.
3.1. IEQ Indicators for a Visual Environment
The Green Star criteria address both natural and artificial light (New Zealand Green Building Council). Version 1 recommends that average electric lighting levels are 400 lux on the working plane. It gives points for Daylight Factors (DF) that exceed 2.5% on the floor and these points are allocated proportionally to the area of floor where the DF is exceeded. To achieve a linear increase in DF across the floor results in an exponential increase in the area of glazing and it has been demonstrated [20,21] that to achieve the maximum number of points for daylighting requires the walls to be effectively fully glazed. The assumption that is made in these criteria is that there is increasing satisfaction with ever increasing levels of light on a working plane and that the quantity of light on a horizontal plane is the appropriate measure for the perception of light in an office.
These assumptions have been challenged for many decades [22] but more recent research has demonstrated the flaws in assuming that the appearance of lighting in a space can be measured by a level of light on a working plane and that more light necessarily results in improved appearance or performance [23]. This research exposes that there were no empirical studies carried out to justify the basis for commonly recommended light levels in offices; they were based on “reason rather than research” [23] (p. 77). The empirical work that has been carried out [24] indicates that, under normal conditions, 11 lux is a satisfactory level to perform office tasks such as reading and for ordinary purposes.
However, Cuttle [23] is clear that while this level of light may be sufficient for “performance” it is inadequate for “appearance”. Furthermore, using the level of light on a working plane is not a representative measure with which to assess appearance since perception of lighting is based on the light that “exits” all surfaces in a room (luminence) rather than the light level that “arrives” at a certain point in a room (illuminance). This research is then extended into clear methods of evaluating and prescribing lighting appearance [25].
The importance of this research for “green” building criteria is that precise levels of illumination on a working plane (400 lux) bear little or no relation to either performance of a task or perceived appearance of a room and are therefore poor indicators of productivity. The same principle can be extended to Daylight Factors: it is not so much the level of daylight on a working plane that is an indicator of appearance or performance, but the relative distribution of light reflected from room surfaces. Fully glazing walls of offices are unlikely to achieve this. However, it is likely to cause other problems such as glare or problems associated with excess direct sunlight which are discussed in Section 5.
Designing excessive areas of glazing is also supported by the Green Star criteria for “external views” which are based on calculating the direct line of sight through glazing. Early field studies on occupant’s appreciation of views appear to have been forgotten. In particular work by Keighley [26] who demonstrated that satisfaction of views was closely correlated with the percentage of glazing and that there was virtually no increased satisfaction as the percentage increased above 30% of the external wall area.
3.2. IEQ Indicators for the Thermal Environment
There is a strong parallel between research in the visual and thermal environments. That is to say, research that challenges the idea that specific and consistent levels of the environment are an appropriate measure of comfort and that adaptation to a wider range of conditions is not adequately considered.
The criteria used for thermal comfort in Green Star rating system are based on the Predicted Mean Vote (PMV) with more points being allocated for an ever narrower range of temperatures. This method of measurement dates back to the 1970s and is based on laboratory research on optimum thermal comfort [27]. The implications of this for green rating tools is that, in order to achieve increased numbers of “green” points, a greater control of the building’s temperature is required to achieve near isothermal conditions. Indeed, there are more points available for air-conditioning than for natural ventilation in the Green Star system [28].
The disadvantages of PMV as a measure of comfort have been described in detail [29] within the context of the high energy penalty that is incurred when near isothermal conditions are maintained. The important results of field trials described by Arens et al. indicate that spaces with tightly controlled temperatures do not provide higher acceptability than spaces with less control. As the authors conclude, “The theoretical basis of tight PMV/PPD building control is flawed.” [29] (p. 10).
3.3. Implications of IEQ Criteria on Building Design
The IEQ criteria for the thermal environment discussed above are based on the assumptions that a static, closely controlled and an unvarying environment will produce optimal comfort conditions which, in turn will result in greater productivity. The IEQ criteria for lighting are based on the assumption that light levels on a working plane should be maximised. The scientific basis for these is contentious and the evidence for a more varied environment where control is achieved by occupant adaptation is growing [25,29,30].
For building designers, the requirement for tightly controlled thermal environmental conditions and maximum light levels results in an architecture that has a highly glazed and sealed envelope with ventilation and temperature control achieved by air-conditioning. Once the decision is made to air-condition a building, the advantages of passive means of environmental control, such as thermal mass to smooth out diurnal changes in temperature, is negated. Furthermore, the need for solar protection is diminished as an increased size of air-conditioning plant to combat overheating is generally a cheaper initial option than the installation of effective solar shading. It is not surprising that the architecture of many “Green” commercial buildings in New Zealand appears is to be no different from their neighbours; highly glazed and air-conditioned with no consideration to orientation or solar protection [31].
4. The Accuracy of Measuring Productivity in “Green” Buildings
The methods of measuring both IEQ and productivity have led to an apparent precise science of measuring the benefits of “green” buildings. For example, using psychometric tests to relate lighting level to productivity has led researchers [13] to claim that: “Thus, a 20 footcandle (215.3 lux) increase in daylight at the high end of illumination levels from 80 to 100 footcandles (861 to 1076.4 lux), was reflected in only a 1% improvement in performance”.
Using the self-assessment method of measuring productivity has led other researchers [32], to claim that, “The productivity score at the Meridian building is plus 8.96%”.
The argument presented in Section 3 above, in the sections on measuring IEQ, indicate that the criteria used in both lighting and thermal environments are crude and inaccurate representations of comfort. Added to this is the problem that productivity has neither been adequately defined nor measured: there is a tension between the claims that are made for increased productivity and the science that lies behind such claims. The precision in the claims is not supported by current research referred to above in Section 3.3 and begs the question; how can productivity be measured to such accuracy; two significant figures or within 1% as the examples above suggest?
5. Relative Importance of IEQ to Productivity
Over the last decade or more, research into IEQ has moved away from models that assume comfort to be a precise physical measurement towards an acceptance that diversity within and adaptability to the physical environment are more conducive to comfort and possibly productivity [27]. This, by its very nature, leads to a less precise way of measuring both IEQ and productivity. For example, the requirement for a lighting level of 400 lux on a working plane could be reduced tenfold providing that other lighting indicators are achieved [23]. A similar finding was made by Healey and Webster-Mannison [33] in their survey on qualitative factors that influence thermal comfort: “the common theme among respondents was that as long as one was able to work at a satisfactory rate and without major distraction, there was no problem with the indoor conditions” [33] (p. 173).
If precise levels of IEQ are less important, then perhaps IEQ, in its present form, is not such an important measure of comfort and, therefore, less of an important indicator of productivity. To test this hypothesis, a questionnaire was designed [18], that asked office workers to rank a wide range of factors, both physical environmental and social, considered to be of significance to productivity. The aim was to ascertain whether IEQ is indeed an important indicator of productivity. The findings of this pilot study would, or not, establish the relevance of precise levels of IEQ (as prescribed in Green rating tools) to productivity.
The questionnaire was carried out on a group of office workers in a “green” building. Thirty five questions were asked of which seven were environmental (daylight, air quality, noise, artificial light, view, temperature, noise) and the remainder were social factors. The environmental factors were spread evenly throughout the questionnaire and responses were on a five-point Likert scale from “not at all important” at one end of the scale to “important” at the other end and with a balance point of “indifferent”. The survey was carried out immediately after a standard, internationally recognised, self-assessment productivity questionnaire had been carried out. This meant it was administered under the same protocol but it also meant that the participants had already been alerted to the importance of environmental factors which may have influenced their responses to overvalue these factors.
The questionnaire was given to 60 people, in several organisations within the same “green” building, of whom 49 responded. In assessing an overall value of importance, the responses were weighted such that “indifference” was multiplied by a factor of 0, “slightly important”, 1 and “important” by a factor of 2. The results are indicated in Figure 1.
The data analysis and protocol are extensive and reported elsewhere [34]. The results showed that social factors significantly outweighed the environmental factors in self-assessed productivity evaluation with the top five responses all being social factors. “Loss of sleep” was a clear leader followed by “workload”, being “undervalued at work” and “poor management”. The highest ranked environmental factor was “too hot/too cold” but this may have been influenced by the questionnaire being carried out on the coldest day of the year. The next environmental factor in the ranking was “air quality” coming in at nearly the same ranking as “relationships at work”, “underpaid” and “inadequate equipment”. Of the factors concerned with lighting, “glare” was just in the top 25% of the ranked factors while daylight and artificial light were in the lowest 25% and scored lower than “office décor” and “other financial stress”.
The survey is of limited value in its detail since it would need to be carried out in different building types and over different seasons in order to be more representative. However, what are of interest are the relative values of social to environmental factors. This has relevance to perceived productivity in several ways.
The responses to the environmental questions in self-assessment questionnaires may well be influenced by social factors. For example, there is a direct correlation between sleep deprivation and performance [17]. A response with a low scoring IEQ may be more representative of the individual’s state of mind than of the state of the office environment.
Questionnaires that focus on IEQ not only prompt ideas but also heighten the awareness of a participant to issues that may be of little or no consequence to productivity.
The published outputs of self-assessed productivity questionnaires, which focus on environmental factors, put undue emphasis on the accuracy of their results. The examples of precise perceived? productivity measurement above show that percentage productivity increase can be measured to two significant figures. For those not familiar with all the assumptions built into the subject, relating IEQ to productivity would appear to be a very precise science.
6. Post-Occupancy Evaluation from External Evidence
The apparent precision in the correlation between IEQ and productivity has armed “green” building accreditation schemes with tools that appear on the surface to have a strong scientific basis. Requiring specific light levels, Daylight Factors or temperatures within certain ranges based on “predicted mean votes” gives credence to the investment in building accreditation. The literature review above has indicated that this apparent precision is not well founded and that there is a gap between current research into the understanding of comfort in buildings and the IEQ standards being specified for “green” accreditation. If applied rigorously, current IEQ standards may not necessarily produce comfort conditions.
In order to analyse aspects of environmental performance, without intervention, a pilot study was set up to observe how occupants in a “green” accredited building responded to environmental conditions. There have been many post-occupancy evaluations (POEs) carried out on “green” buildings [35] but these have all been done from the inside of buildings. This has two main disadvantages: firstly, that the participants are aware of the evaluation (the Hawthorne Effect) and, secondly, it can be difficult to get access into buildings especially when the occupants or organisations are concerned about the publication of the findings.
To try and overcome this, a field study of two “green” buildings was set up to carry out a POE from external evidence. The controls systems available to the occupants were monitored from the outside without them being aware that they were being observed. The two main features observed were the window blinds and light switching. The buildings were air-conditioned, but had they not been, then observing window opening habits would also have been of interest.
Two “green” buildings were observed over a period of one year and a record kept of the number of window blinds that were being used and the extent to which they were closed as well as the number of lights that were on during daylight hours. Each visit entailed making a pictorial record of window blind closure and the windows and electric lights switched on at each elevation for the morning and afternoon time periods. The morning record was taken between 09:00 and 11:00, while the afternoon record was taken between 14:00 and 16:00. Other “green” buildings were also observed for their general patterns to ensure that the two buildings that were rigorously monitored were reasonably representative. With air-conditioning temperatures largely controlled by building management systems, switching of lights and closing of blinds were the only remaining means of occupant control of the building systems and, therefore, an indicator of visual and thermal comfort.
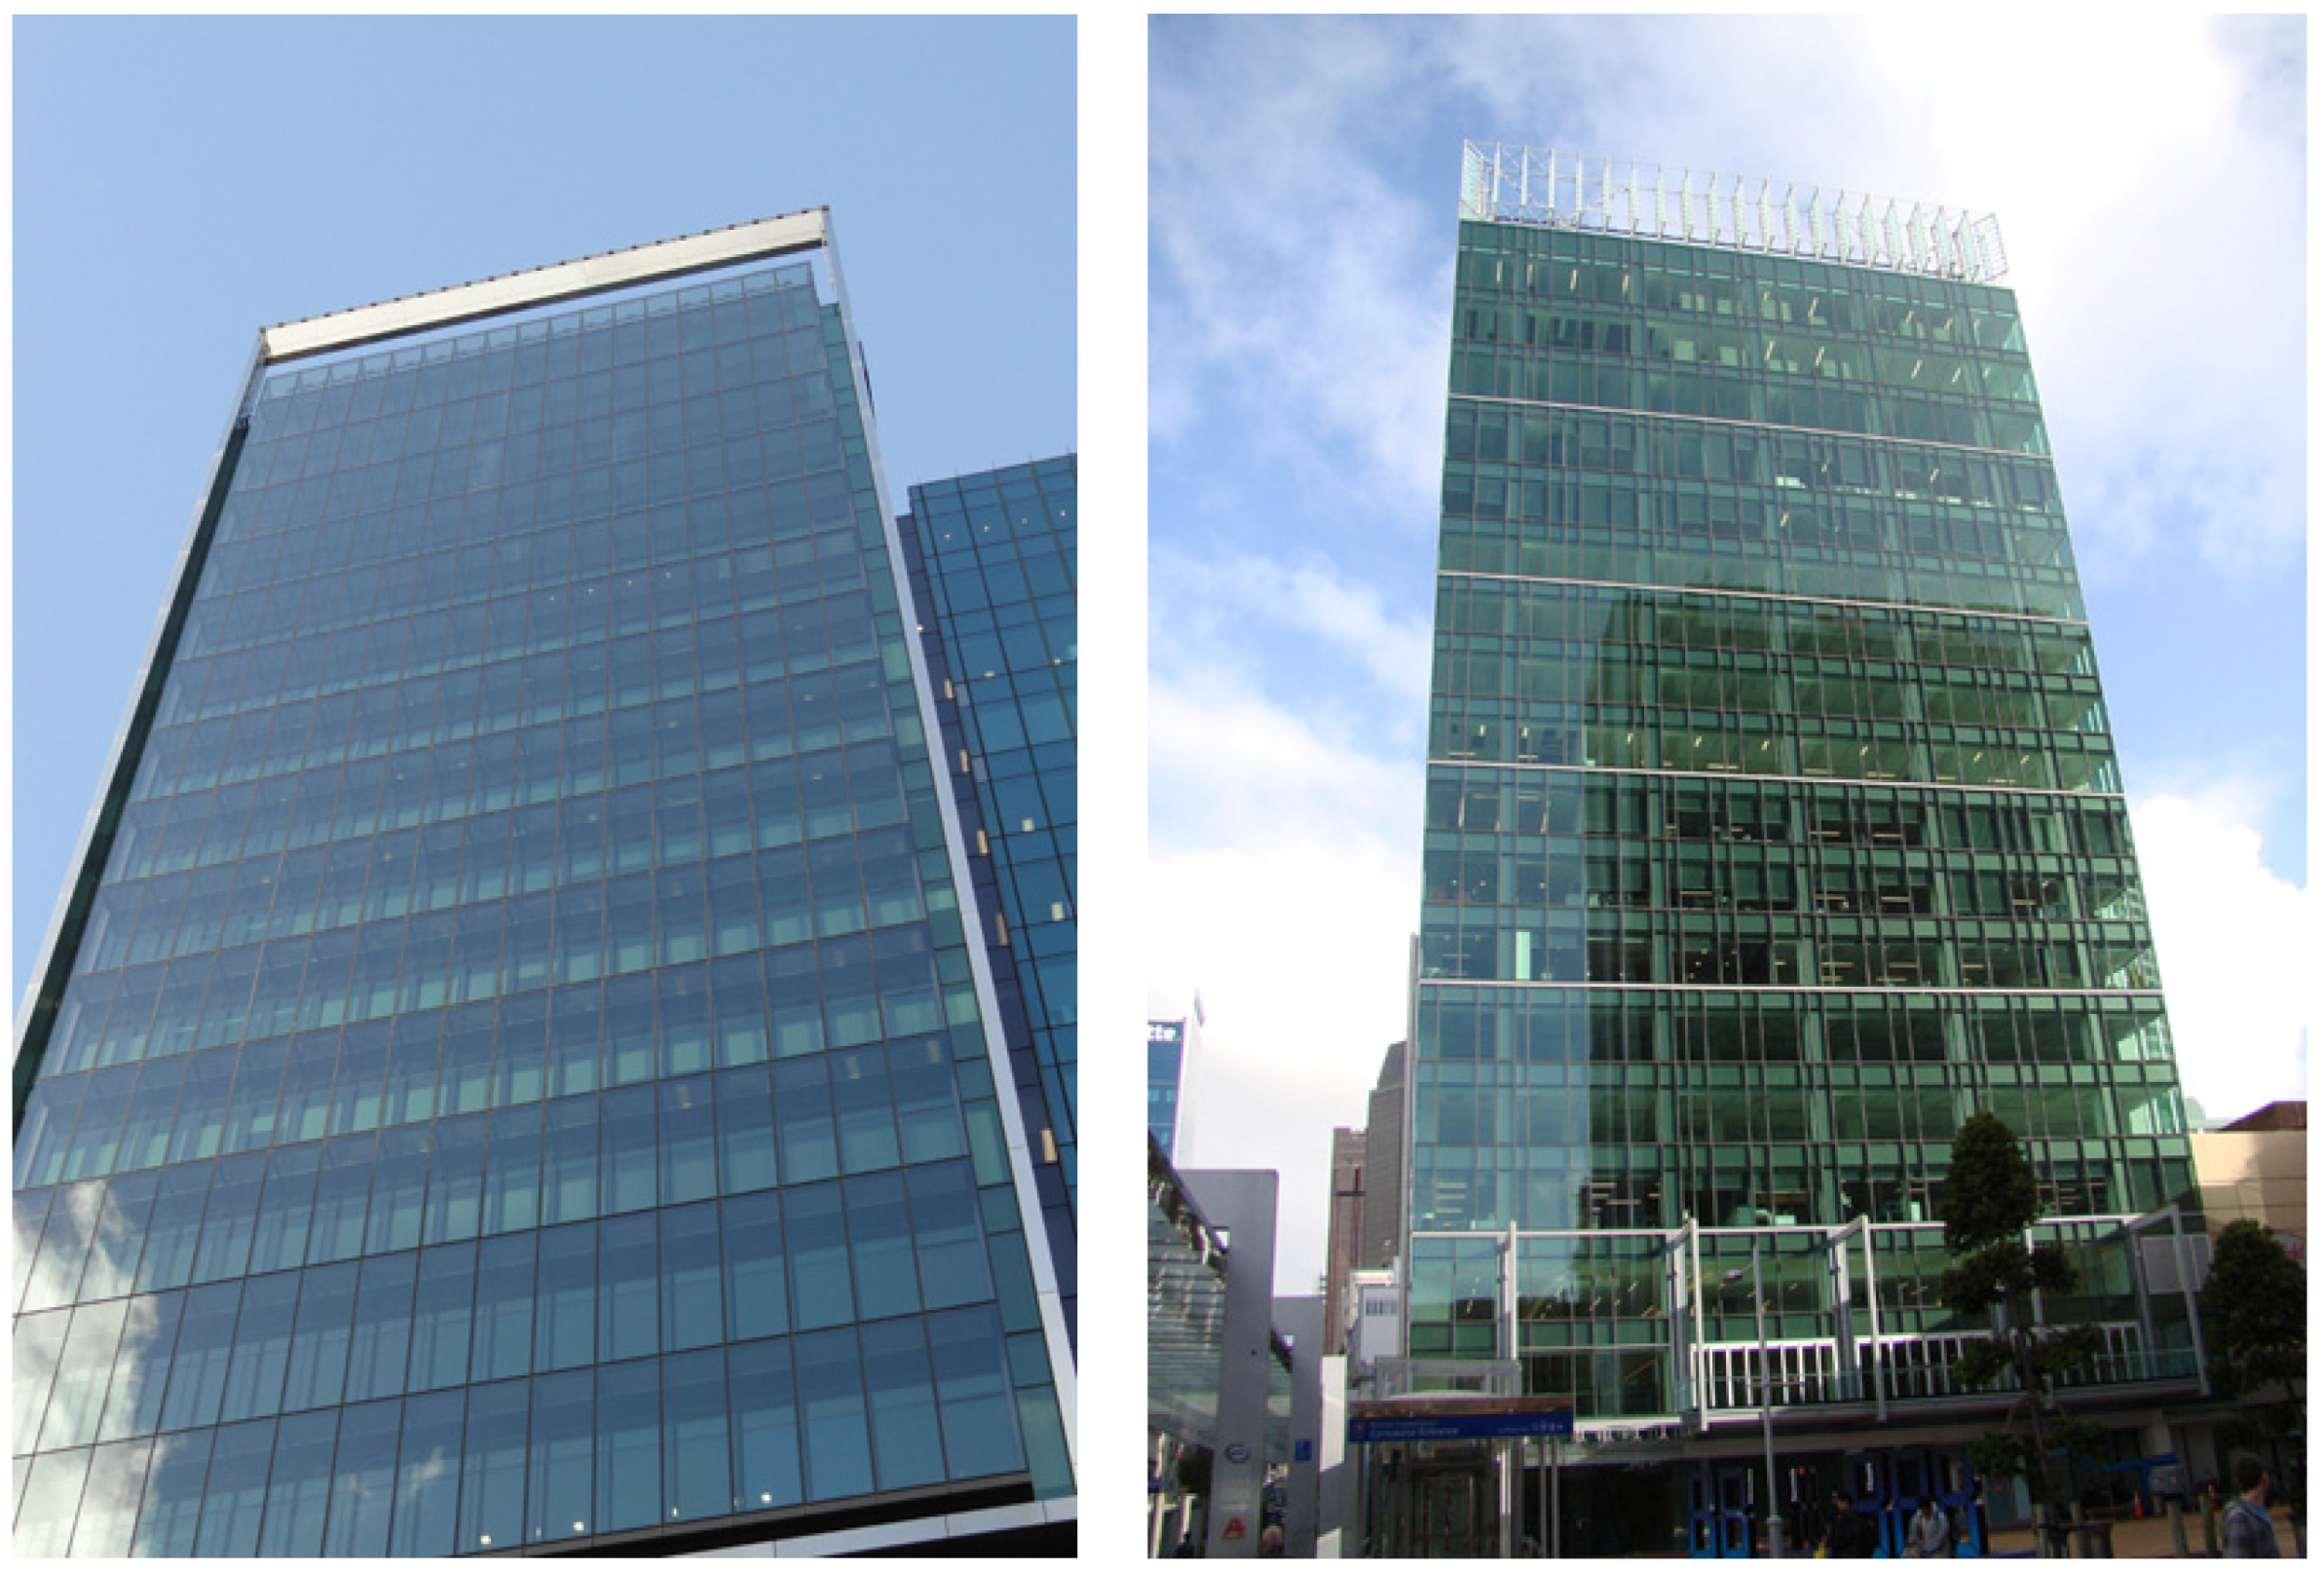
The two buildings are multi-storey office developments that are glazed evenly around all facades with all facades being approximately 80% glazed and all windows supplied with internal roller blinds (Figure 2). Each window on each of the four principal elevations was monitored for the extent to which the blinds were closed to the nearest 10%. So a fully closed blind scored 100%, half closed 50% and so on. The results for all the windows was averaged over an entire elevation (excluding unoccupied floors) so that if all the blinds were closed in all the windows the score would be 100% and if half of the windows had their binds half closed (50% 50%) the score would be 25% and so on.
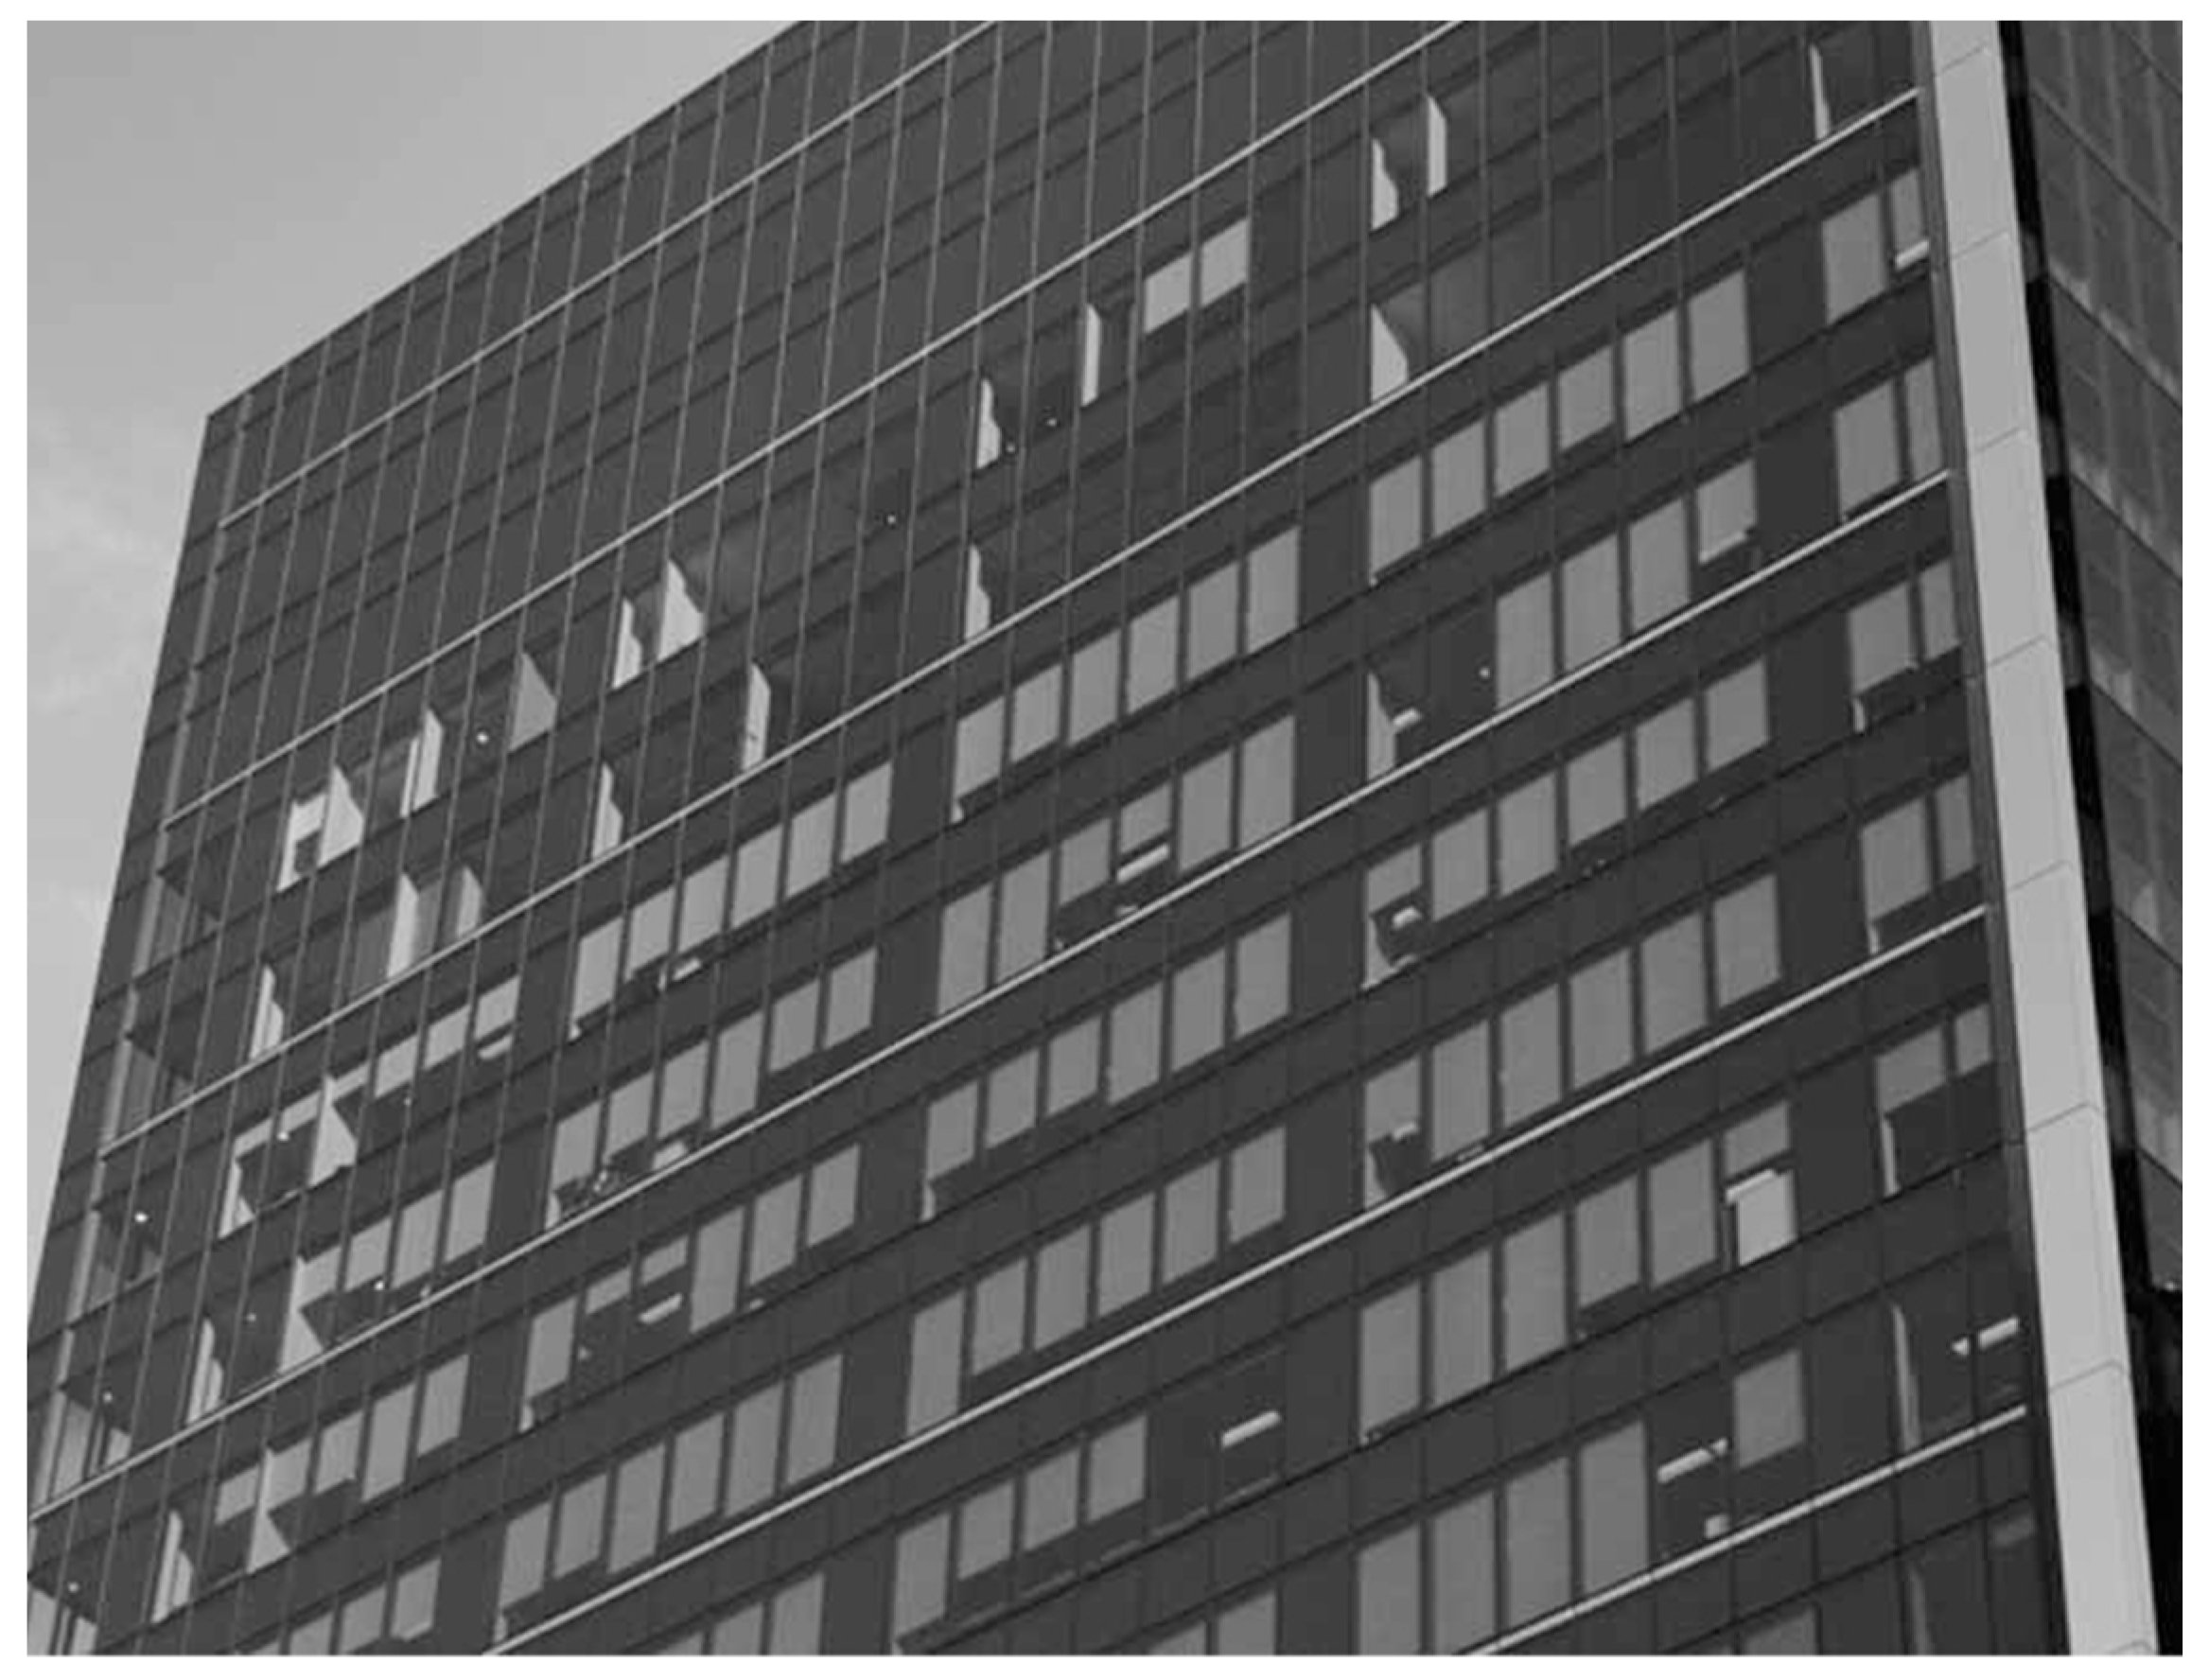
The results of the monitoring revealed an extraordinary high use of blinds and lights throughout the day (Figure 3). The opening/closing of blinds hardly varied across the course of a day. This may be because of habit or because of a continuous problem of glare or overheating. However, there were gradual, yet significant changes across the seasons.
The two main factors affecting the operation of blinds were the season and the orientation. On the north (equatorial facing) facade, the blinds were closed more in winter months than summer. The average closure of the blinds in July (winter) was 56% reducing to an average of 51% at the equinoxes and 35% in February (summer). This would imply that blinds are used more for visual comfort than thermal on this elevation.
Comparing the use of blinds on different facades in winter; the north elevation averaged 56% closure, the south (no direct solar access) averaged 31% and the west averaged 100%. The results for the west elevation can be explained by both the low sun in the later part of the day and also a double-skin facade on that elevation which increased the surface temperatures of the glazing [35]. A further characteristic of blinds being significantly closed was that the lights were turned on. On all elevations at all times of the year, lights were on when blinds were either fully or partially closed. This may be due to the blinds reducing daylight levels but it may also be due to the need for a more uniform lighting within rooms to overcome problems of glare.
The results of this pilot study are necessarily limited as permission to carry out any internal observations or interviews was not granted. However, there are several useful conclusions that can be drawn from this study. Firstly, highly glazed buildings are endorsed by the “green” rating system (see Section 3.1) on the basis of improved daylighting and, hence, productivity. However, with an overall average of almost half the building’s blinds being closed in the daytime, there is a clear signal that large areas of glazing introduce other problems such as glare, overheating and direct sunlight onto working spaces. While the blinds are very useful devices for the occupants, they are used to combat a discomfort which is likely to cause less productivity. Secondly, while closing blinds has a benefit of reducing glare it also introduces disadvantages such as reducing views out while not significantly reducing cooling loads. Thirdly, the need to turn lights on results in not only an additional and unnecessary use of artificial lighting but also an additional cooling load which has been shown [20] to almost double the energy use of the building.
7. Discussion
A study carried out in 2011 [31], observed that the majority of “green” accredited buildings in New Zealand were highly glazed, air-conditioned buildings with inadequate solar control. These are not characteristics that are usually associated with “green” buildings and subsequent field studies [20] indicated that these types of buildings were consuming about twice as much energy, compared with reference buildings with appropriate glazing and shading, in order to achieve comfort conditions (visual and thermal). However, it has been calculated [20] that energy costs of a building are of the order of one tenth of the monetary value of increased productivity that “green” buildings are claimed to achieve. Therefore, the poor energy performance of the building may be a small sacrifice to pay in comparison with the potential benefits in increased productivity, provided there is evidence of an increase.
Apparent evidence for an increase in productivity has been provided by both psychometric tests of performance as well as self-assessment of perceived productivity in office buildings and precise measures of increased productivity have been claimed for “green” buildings. While methods of measuring perceived productivity are useful tools for post-occupancy evaluation this paper challenges these claims of precision in measuring productivity by a review of literature of more recent research on comfort that indicates that the comfort conditions in buildings are achieved by far broader ranges of conditions than “green” rating tools recommend. Furthermore, the paper challenges the claimed precision in measuring productivity since there is no agreed definition of productivity in an office environment and the method of measurement not only excludes many important social factors but also prompts responses that heighten the awareness of participants above their normal perception.
This paper argues that methods of measuring perceived productivity are being wrongly used to endorse “green” rating criteria which not only result in inappropriate IEQs but also inappropriate architecture. The tenuous link between perceived and actual productivity combined with only a single question on productivity in the questionnaires and no definition of “productivity” makes this method of measurement unreliable.
In the Green Star rating tool, “energy, emissions and IEQ” comprise half of the points available for accreditation. The pilot study carried out on two “green” buildings has shown that the precise IEQ found in these building is not as comfortable as portrayed by the Green rating system. Rather, it creates an unconducive indoor environment that occupants seek various measures to overcome—the extensive use of window blinds and electric lights. The findings of the study described above indicates that highly glazed, air-conditioned buildings that have achieved accreditation are high energy users and have insufficient evidence to claim that they enhance productivity. It is debatable whether the “green” criteria have been the cause of this type of architecture. Irrespective of this, the criteria endorse this type of architecture.
8. Conclusions
This paper has focussed on the internal environmental quality of “green” buildings that can be achieved by architectural design. The concern of this research is whether or not “green” accreditation enhances architecture that in turn increases comfort and thereby increases productivity.
The literature review indicates that the criteria used for comfort in “green” accreditation are based on assumptions of visual and thermal comfort that are outdated and unrepresentative. This has resulted in criteria that favour large proportions of glazing and air-conditioning.
Methods of measuring productivity in offices, whether by psychometric testing or self-assessment, have been used to endorse the “green” rating criteria resulting in claims that the architecture of green buildings results in greater productivity. These claims are based on results that appear to be extremely precise and can measure the percentage increase in productivity to two decimal places.
This paper challenges these claims of precision in measuring productivity by a review of literature of more recent research on comfort that indicates that the comfort conditions in buildings are achieved by far broader ranges of conditions than “green” rating tools recommend. Furthermore, the paper challenges the claimed precision in measuring productivity since there is no agreed definition of productivity in an office environment and the method of measurement not only excludes many important social factors but also prompts responses that heighten the awareness of participants above their normal perception.
With inappropriate criteria for internal environmental quality and imprecise methods of measuring actual productivity, we conclude that “green” buildings cannot claim to be any more productive than any reasonably well designed non-green building.
Author Contributions
This study were carried out by Eziaku Onyeizu Rasheed (author 2) under the supervision of Hugh Byrd (author 1). This paper was written by Hugh Byrd and proof read by Eziaku Onyeizu Rasheed. The data was analysed by Eziaku Onyeizu Rasheed under the supervision of Hugh Byrd.
Conflicts of Interest
The authors declare no conflict of interest.
References
- Lasalle, J.L. Green Buildings Driving Employee Productivity. September 2011. Available online: http://www.us.jll.com/united-states/en-us/research/2969/green-buildings-drive-productivity (accessed on 3 February 2016).
- Baird, G. Sustainable Buildings in Practice—What the Users Think; Routledge: Abingdon, UK, 2010; p. 352. [Google Scholar]
- World Building Design Guide (WGBC). The Business Case for Green Building: A Review of the Costs and Benefits for Developers, Investors and Occupants. 2013. Available online: http://www.worldgbc.org/files/1513/6608/0674/Business_Case_For_Green_Building_Report_WEB_2013-04-11.pdf (accessed on 27 January 2016).
- Grady, S.; Singh, A.; Syal, M.; Korkmaz, S. Effects of Green Buildings on Employee Health and Productivity. Am. J. Public Health 2010, 100, 1665–1668. [Google Scholar]
- Rehm, M.; Ade, R. Construction costs comparison between “green” and conventional office buildings. Build. Res. Inf. 2013, 41, 198–208. [Google Scholar] [CrossRef]
- Heerwagen, J. Green Buildings, Organizational Success, and Occupant Productivity. Build. Res. Inf. 2000, 28, 353–367. [Google Scholar] [CrossRef]
- Leaman, A.; Bordass, W. Are users more tolerant of “green” buildings? Build. Res. Inf. 2007, 35, 662–673. [Google Scholar] [CrossRef]
- Kumar, S.; Fisk, W. The Role of Emerging Energy-Efficient Technology in Promoting Workplace Productivity and Health1: Final Report. Lawrence Berkeley National Laboratory. Available online: http://www.escholarship.org/uc/item/0sw558qr (accessed on 3 February 2016).
- Byrd, H. Energy, Climate, Buildings: An Introduction to Designing Future-Proof Buildings in New Zealand and the Tropical Pacific; Transforming Cities: Auckland, New Zealand, 2012; ISBN 9780992250904. [Google Scholar]
- Zainal, H.; Byrd, H. Highly overrated, highly glazed, high rises: The product of green rating systems. In Proceedings of the Fragmented Futures: the Built Environment in a Volatile World, University of South Australia, Adelaide, Australia, 4–5 December 2012.
- OECD Manual: Measuring Productivity, Measurement of Aggregate and Industry-Level Productivity Growth, 2001. Available online: http://www.oecd.org/std/productivity-stats/2352458.pdf (accessed on 3 February 2016).
- Haynes, B. An evaluation of office productivity measurement. J. Corp. Real Estate 2007, 9, 144–155. [Google Scholar] [CrossRef]
- California Energy Commission. Windows and Offices: A Study of Office Worker Performance and the Indoor Environment. October 2003. Available online: http://www.energy.ca.gov/2003publications/CEC-500–2003–082/CEC-500–2003–082-A-09.PDF (accessed on 3 February 2016).
- Lan, L.; Lian, Z. Use of neurobehavioral tests to evaluate the effects of indoor environment quality on productivity. Build. Environ. 2007, 44, 2208–2217. [Google Scholar] [CrossRef]
- Leaman, A.; Bordass, W. Productivity in Buildings: The Killer Variables. In Creating the Productive Workplace; Clements-Croome, D., Ed.; E & FN Spon: London, UK, 2000. [Google Scholar]
- Clements-Croome, D. Indoor Environment and Productivity. In Creating the Productive Workplace; Clements-Croome, D., Ed.; E & FN Spon: London, UK, 2000; pp. 3–17. [Google Scholar]
- Alhola, P.; Polo-Kantola, P. Sleep deprivation: Impact on cognitive performance. Neuropsychiatr. Dis. Treat. 2007, 3, 553–567. [Google Scholar] [PubMed]
- Onyeizu, E.; Byrd, H. Do green building’s IEQ improve productivity? In Proceedings of 47th International Conference of the ASA, Hong Kong, China, 13–16 November 2013.
- Mac, C. The Effect of Sound on Office Productivity. BSER&T 2012, 33, 339–345. [Google Scholar]
- Byrd, H. Post Occupancy Evaluation of Green Buildings: The Measured Impact of Over-Glazing. Arch. Sci. Rev. 2012, 55, 206–212. [Google Scholar] [CrossRef]
- Byrd, H.; Hildon, A. Daylighting: appraisal at the early design stages. Lighting Res. Technol. 1979, 11, 99–101. [Google Scholar] [CrossRef] [Green Version]
- Lynes, J. A Sequence for Daylight Design. Lighting Res. Technol. 1979, 11, 102–106. [Google Scholar] [CrossRef]
- Cuttle, C. Towards the third stage of the lighting profession. Lighting Res. Technol. 2010, 42, 73–93. [Google Scholar] [CrossRef]
- Weston, H.C. The Relation between Illumination and Visual Efficiency—The Effect of Brightness Contrast; Stationery Office: London, UK, 1945. [Google Scholar]
- Cuttle, C. A New Direction for General Lighting practice. Lighting Res. Technol. 2013, 45, 40–51. [Google Scholar] [CrossRef]
- Keighley, E.C. Visual requirements and reduced fenestration in office buildings—A study of window shape. Build. Sci. 1973, 8, 311–320. [Google Scholar] [CrossRef]
- Shove, E. Converging Conventions of Comfort, Cleanliness and Convenience. J. Consum. 2003, 26, 395–418. [Google Scholar]
- Cichy, M. Energy Efficiency of Tall Buildings: Practical Methodology for Integrated Design. Ph.D. Thesis, The University of Auckland, Auckland, New Zealand, 2011. [Google Scholar]
- Arens, E.; Huphreys, M.; de Dear, R.; Zhang, H. Are “Class A” temperature requirements realistic or desirable? Build. Environ. 2010, 45, 4–10. [Google Scholar] [CrossRef]
- Chappells, H.; Shove, E. Debating the future of comfort: Environmental sustainability, energy consumption and the indoor environment. Build. Res. Inf. 2005, 33, 32–40. [Google Scholar] [CrossRef]
- Byrd, H.; Leardini, P.M. Green Buildings: issues for New Zealand. In Procedia Engineering; Elsevier: Bologna, Italy, 2011; Volume 21, pp. 481–488. [Google Scholar]
- Ecubed Building Workshop. The Meridian Office Wellington-Productivity (2008). Available online: http://www.e3bw.co.nz/journal/green-buildings-proof-will-be-performance (accessed on 3 February 2016).
- Healey, K.; Webster-Mannison, M. Exploring the influence of qualitative factors on the thermal comfort of office occupants. Archit. Sci. Rev. 2012, 55, 169–175. [Google Scholar] [CrossRef]
- Onyeizu, E. Can Architecture Increase Productivity? The case of Green Certified Buildings. Ph.D. Thesis, The University of Auckland, New Zealand, 2014. [Google Scholar]
- Safamanesh, B.; Byrd, H. The two sides of a double-skin facade: built intelligent skin or brand image scam? In Proceedings of the Building on Knowledge: Theory and Practice. 46th Annual Conference of the Architectural Science Association (ANZAScA), Griffith University, Gold Coast, Australia, 14–16 November 2012.
Figure 1.
Questionnaire results showing the relative importance of environmental and social factors to perceived productivity.
Figure 1.
Questionnaire results showing the relative importance of environmental and social factors to perceived productivity.
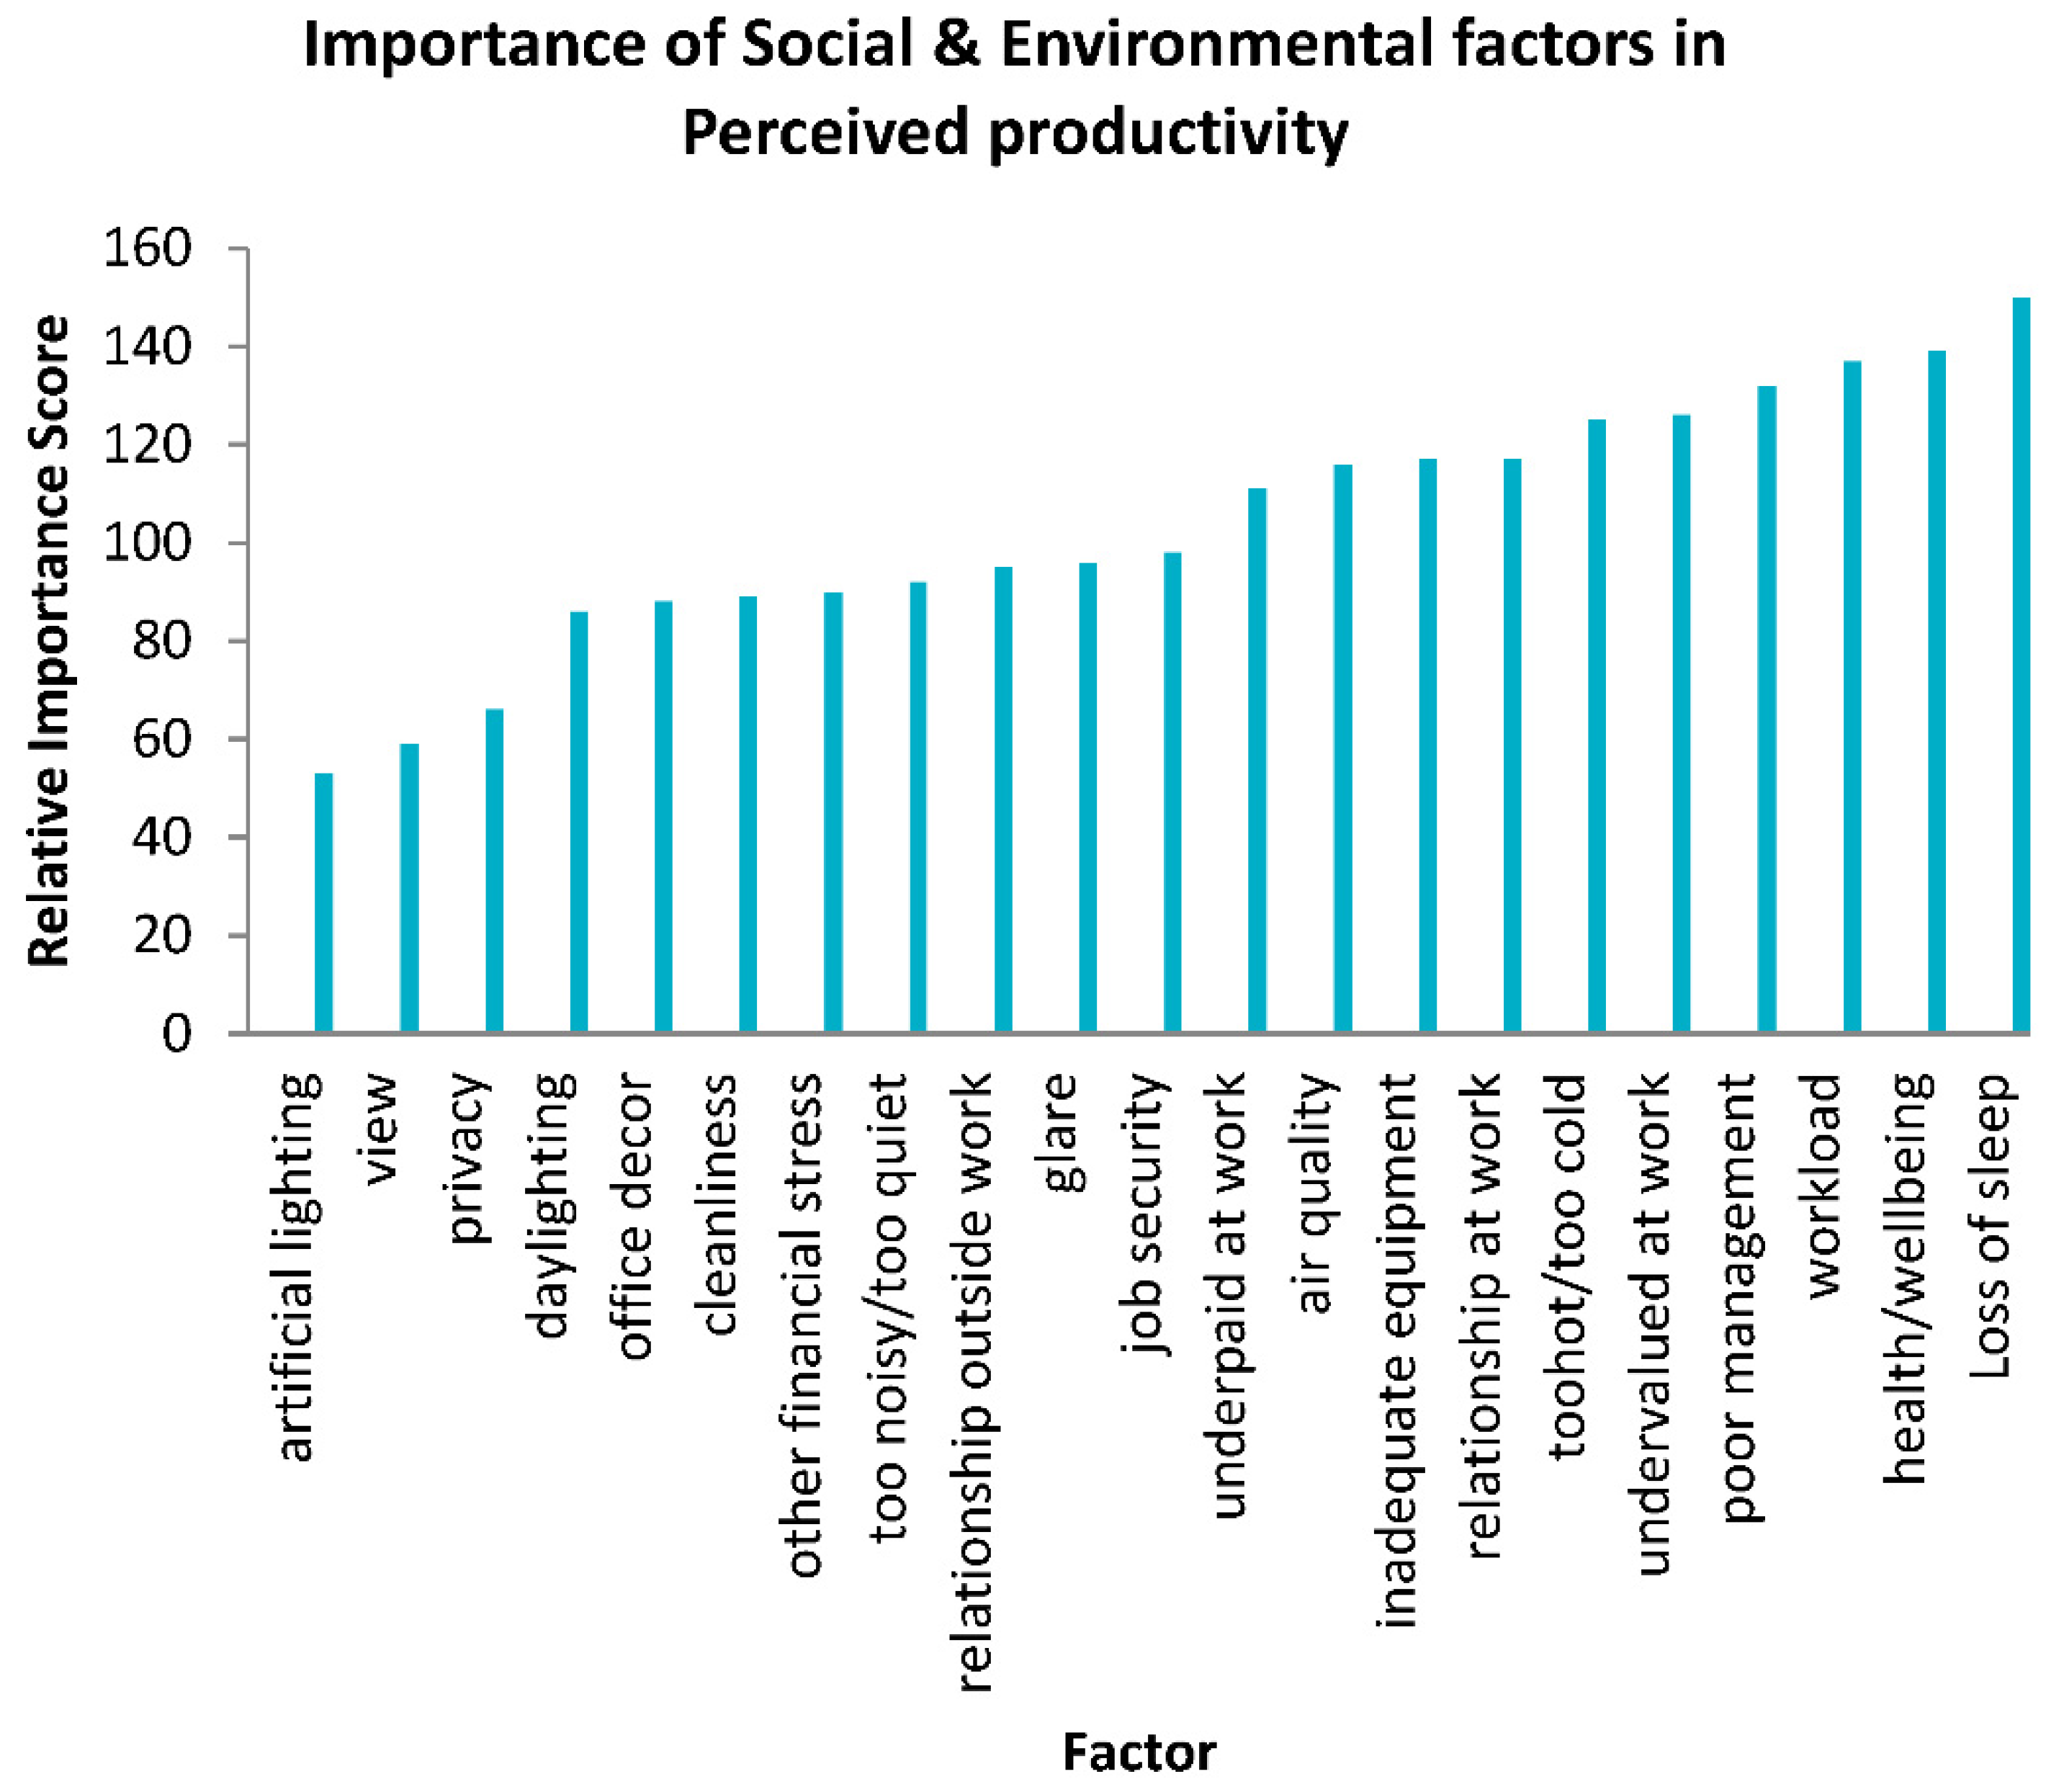
Figure 2.
“Green” accredited Case study buildings.

Figure 3.
Window blinds closed and lights turned on during the day.
© 2016 by the authors; licensee MDPI, Basel, Switzerland. This article is an open access article distributed under the terms and conditions of the Creative Commons by Attribution (CC-BY) license (http://creativecommons.org/licenses/by/4.0/).
Share and Cite
MDPI and ACS Style
Byrd, H.; Rasheed, E.O. The Productivity Paradox in Green Buildings. Sustainability 2016, 8, 347. https://doi.org/10.3390/su8040347
AMA Style
Byrd H, Rasheed EO. The Productivity Paradox in Green Buildings. Sustainability. 2016; 8(4):347. https://doi.org/10.3390/su8040347
Chicago/Turabian StyleByrd, Hugh, and Eziaku Onyeizu Rasheed. 2016. "The Productivity Paradox in Green Buildings" Sustainability 8, no. 4: 347. https://doi.org/10.3390/su8040347
Note that from the first issue of 2016, this journal uses article numbers instead of page numbers. See further details here.