
Are Australian and United States Farmers Using Soil Information for Soil Health Management?


Abstract
:1. Introduction
- (1)
- the amount of farmer participation that exists in soil testing and farm planning;
- (2)
- the nature of soil testing and farmer motivation to capture information on soil health;
- (3)
- whether farmers use soil testing for decision-making, including the adoption of soil building practices;
- (4)
- limitations to widespread use of soil information and soil testing for soil health management; and
- (5)
- approaches to improving farmers’ access to soil information, and its potential use for the adaptive management of agroecosystems.
2. Approach
3. Farmer Participation in Soil Testing and Farm Planning
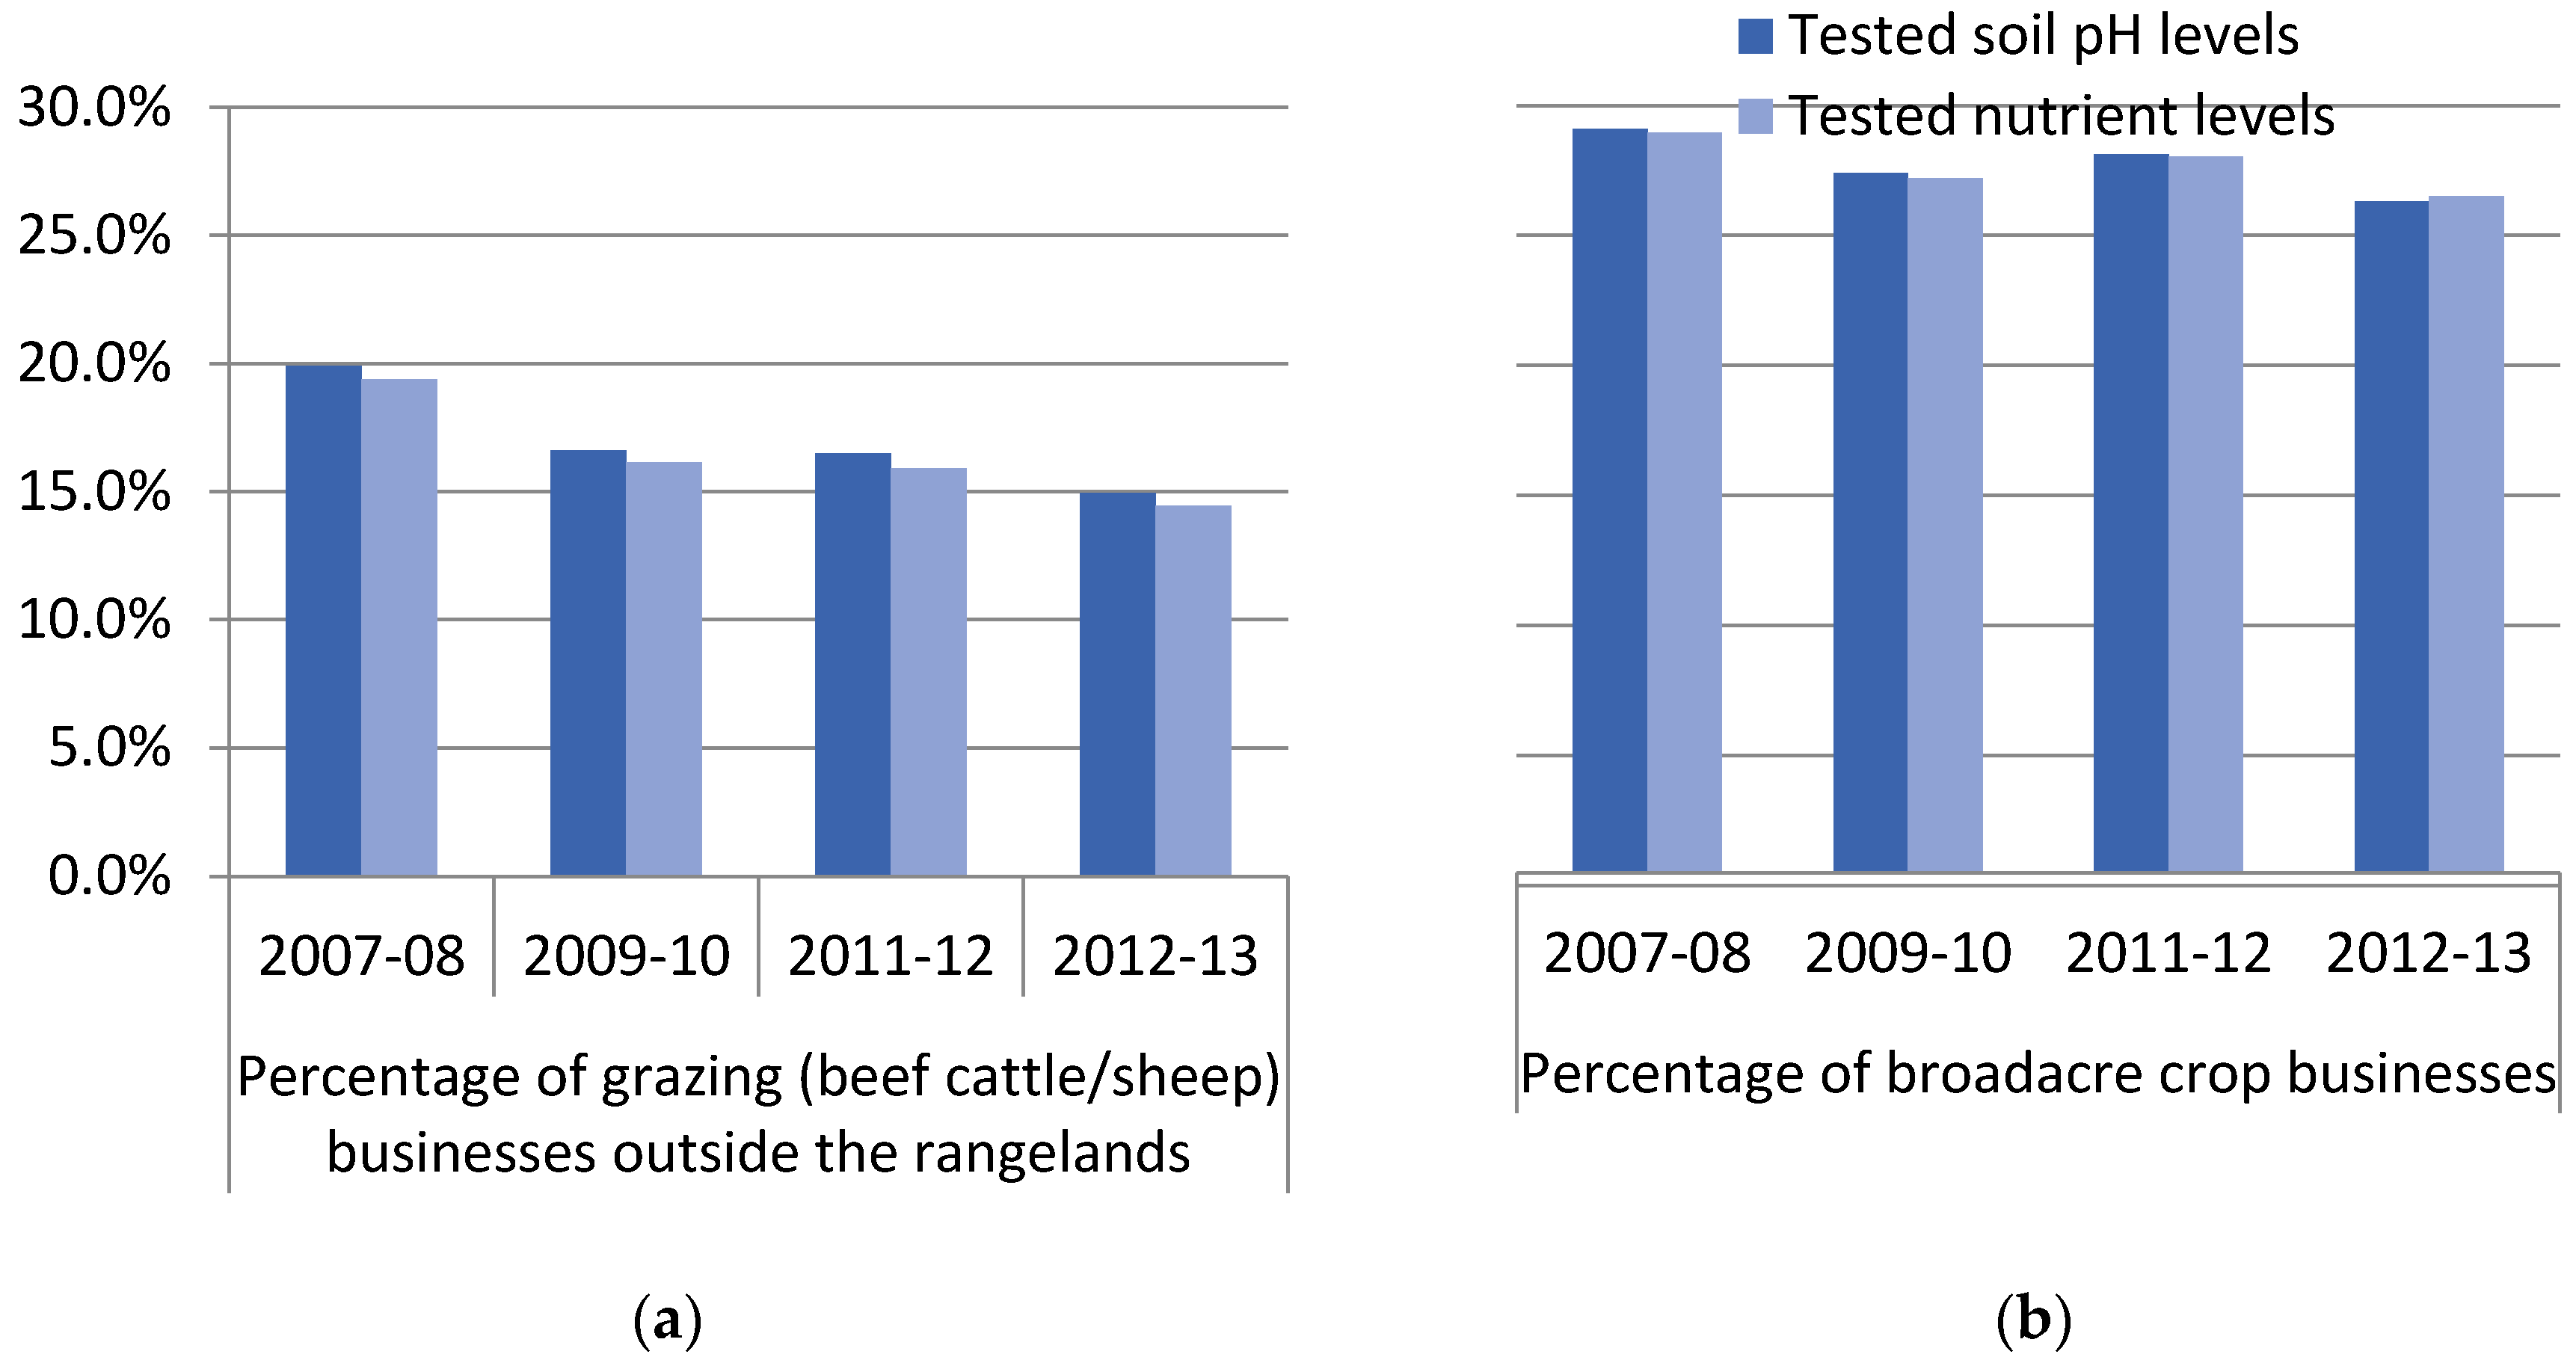
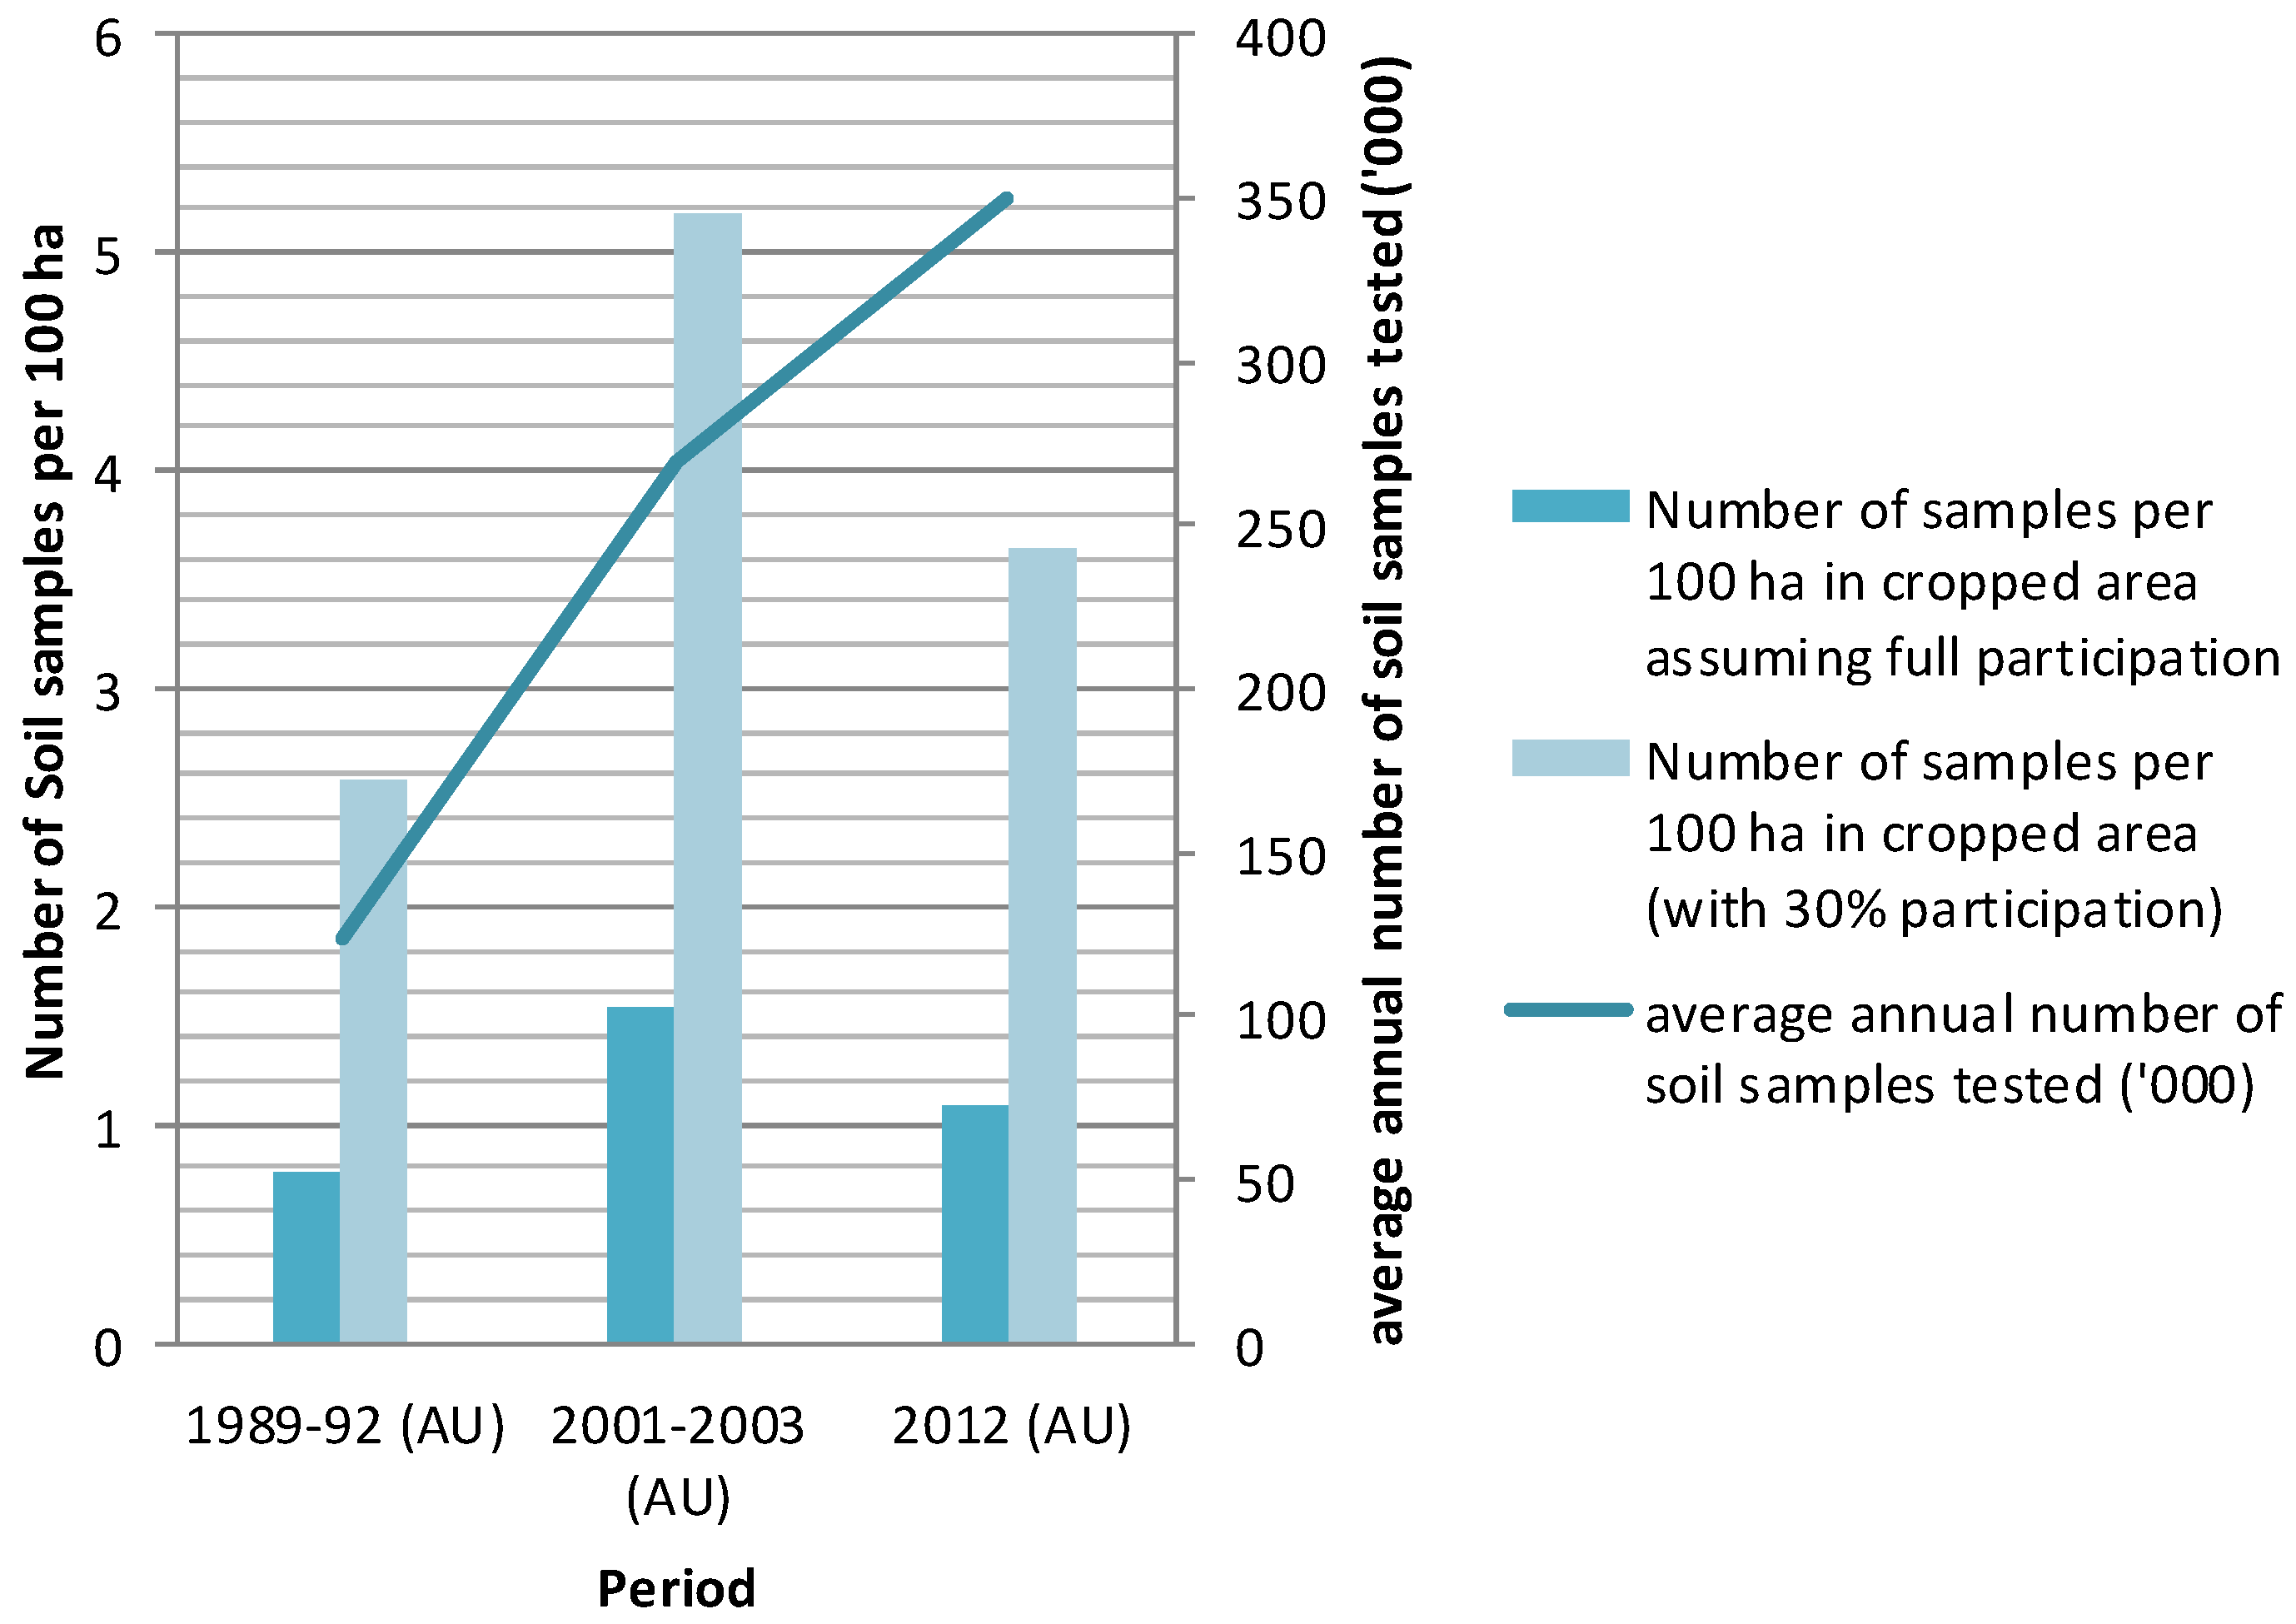
3.1. Soil Testing Trends
“I think the more and more farming becomes tougher economically, then everybody continues to look shorter and shorter term. … So, sometimes that limits what you think might be the optimum, long-run approach.”—CA farmer
3.2. Farm Planning and Conservation Plans
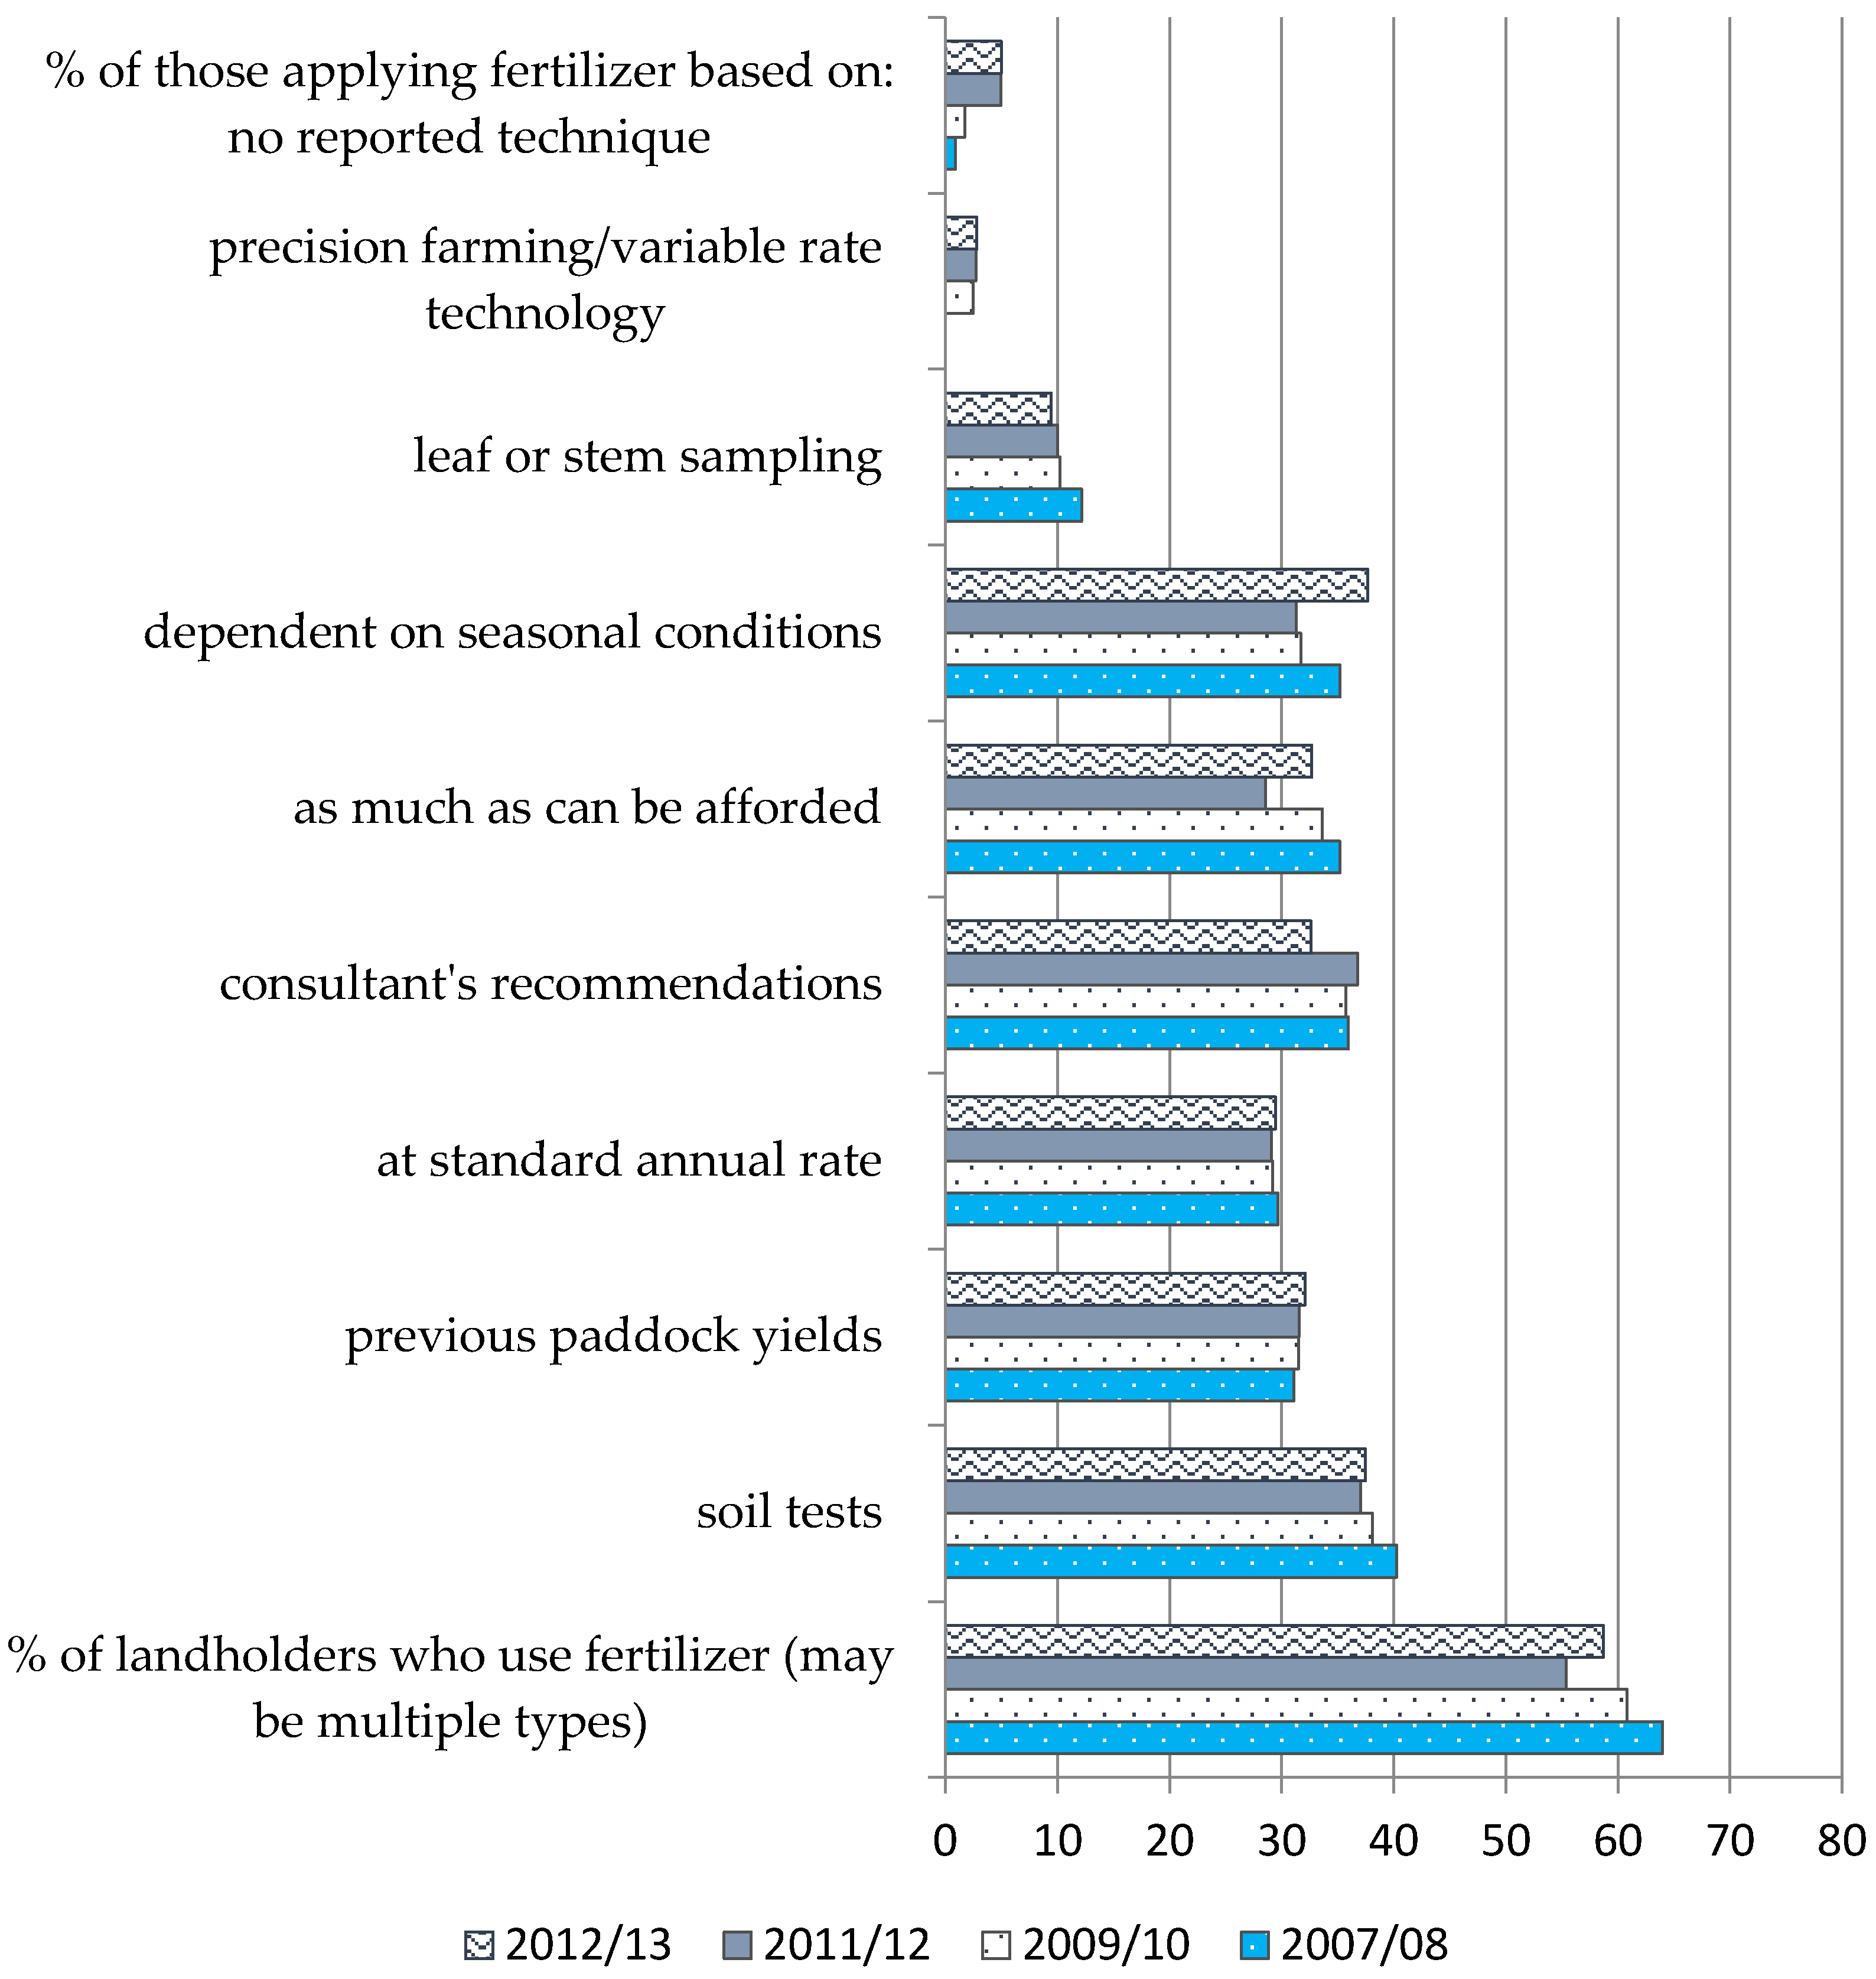
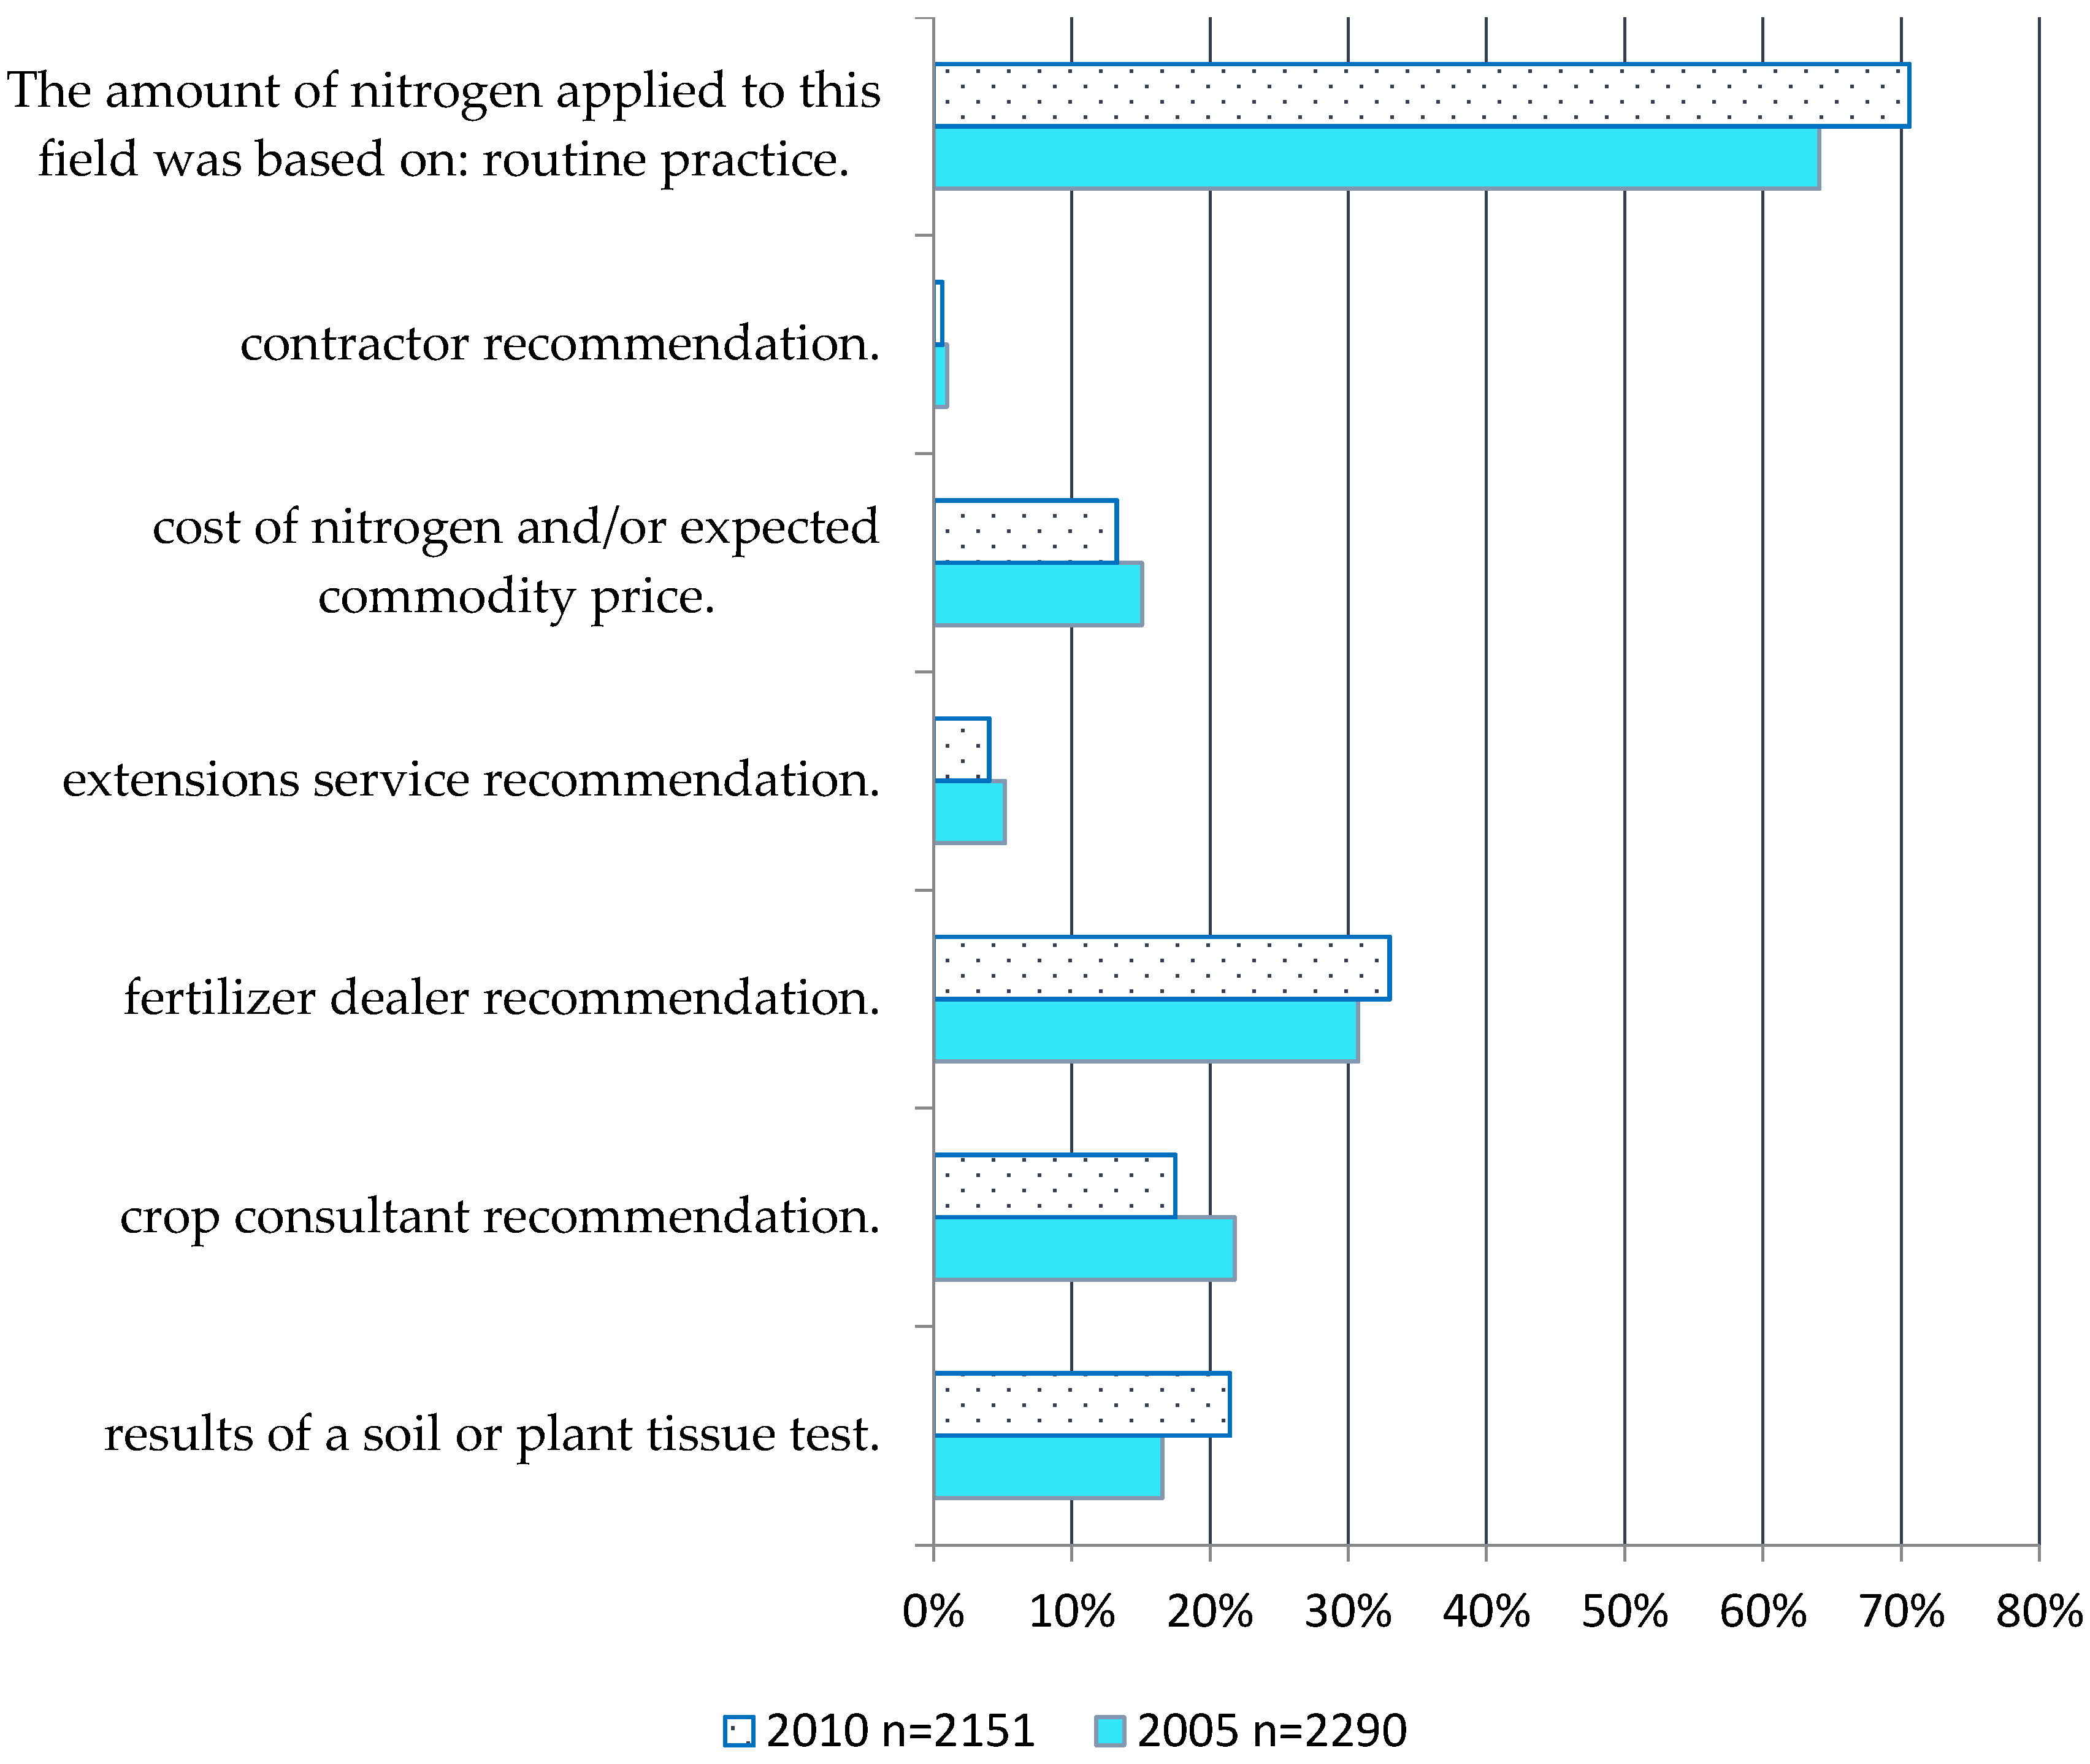
4. Nature of Soil Testing and Farmer Motivation to Participate
By 2005 there should be a 75 per cent increase in the number of landholders and regional communities actively monitoring resource condition—for example, by soil testing and water and biodiversity monitoring—to guide their management practices.
“It is astonishing to me after all the years I’ve been doing this that they’re still only giving me a one page soil test. … You need a more sophisticated tool than that.”—CA farmer
“I might as well be speaking to [crop advisors] in Russian, about worrying about carbon levels or this or that, or C to N ratios, I mean they don’t care.”—CA farmer
“You get your samples and you take some of the recommendations, you put what they say and it doesn’t really help you.”—CA farmer
“I don’t really know if I’m going in the right direction or the wrong direction on everything I’m doing. … it takes a long time to impact your soil.”—CA farmer
5. Evidence of Farmers Using Soil Information at the Farm Level
5.1. Can Soil Testing Be Linked to Decision-Making?
5.2. Links Between Soil Information and Adoption of Soil-Building Practices for Soil Health Management
“Soil to me is the key to the whole system. I wanted to change the system to improve the soil”—AU farmer
“A lot of times it will be less expenses. And [healthy soils] will be more manageable, soil structure is better... Your plants are healthier. You need less inputs. Your plants just grow better.”–CA farmer
“…whatever you’ve done to that field or whatever condition it’s in, it requires probably the least input and gives you the best results.”–CA farmer
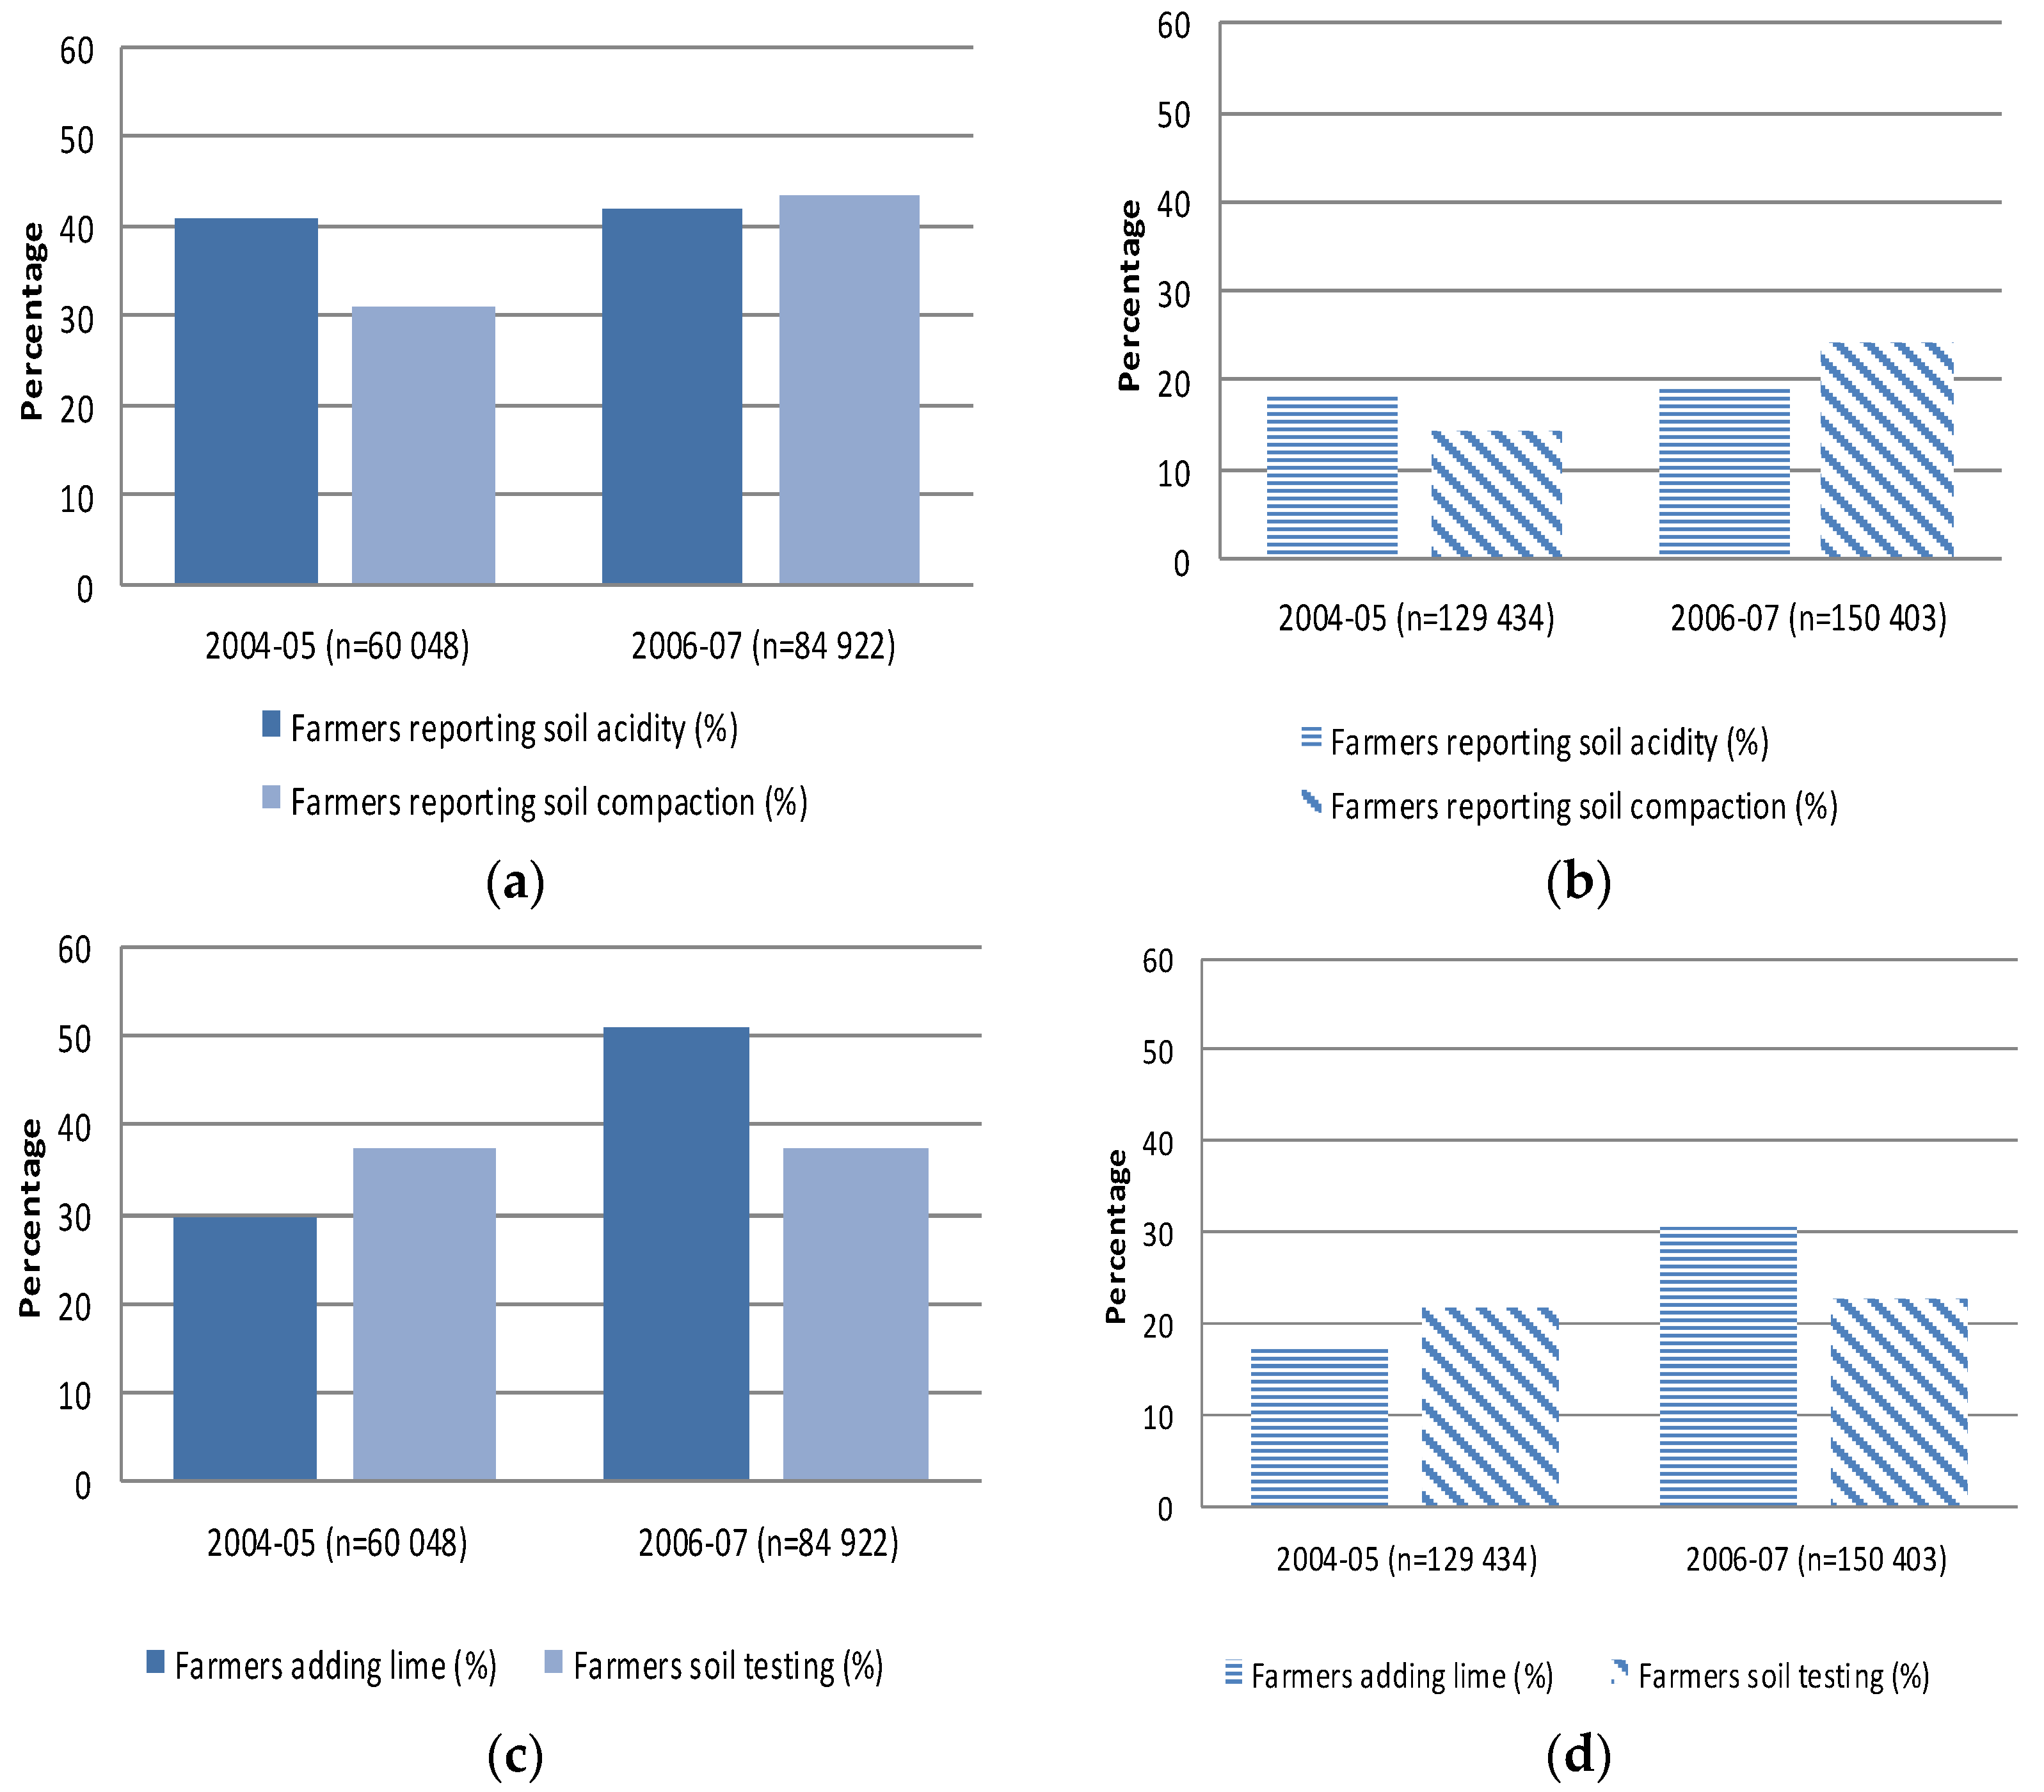
5.3. Use of Soil Testing Data in Application of Lime
6. Limitations to Widespread Use of Soil Information for Soil Health Management
“I think the more and more farming becomes tougher economically, then everybody continues to look shorter and shorter term. … So, sometimes that limits what you think might be the optimum, long-run approach.”—CA farmer
“We have leases anywhere from one year to maybe five years. That’s about as long as it gets. ... I know of several farmers in England and they have 30- and 40-year leases over there. …And you have a different attitude and you can do different things.”—CA farmer
“Instead of a [grass] waterway, you surface cut that channel to the ditch or to the river and farm it. Because I’m paying cash rent on ground and by God I’m going to I’m going to something out of it.”—IL-IA farmer
6.1. Specific Impediments to Soil Testing
- (1)
- Soil sampling intensity:
- Site-specific issues are missed with bulked or zonal sampling [106].
- Standard soil sampling depth (0–20 cm) by farmers can be too deep to identify changes in soil surface properties, or equally too shallow to detect sub-soil changes.
- (2)
- Soil sampling frequency:
- Soil testing may be too infrequent [112] for adaptive management uses.
- The trajectory of change may be difficult to plot with only a few sampling points over time
- Records of soil tests are not retained to allow comparisons to be made over time [64].
- Soil testing may be conducted every three to five years but not necessarily in the same paddock.
- The slow rate of soil change in certain soil properties, coupled with the lack of outward visibility of some types of soil health loss, such as declining soil pH, can be misleading [11].
- Monitoring soil health is difficult without a baseline taken before management changes were implemented.
- (3)
- Lack of holistic focus:
- Conventional soil testing does not monitor the changing nature of soil structure or soil architecture in terms of water availability and habitat for soil biota, a major source of soil health improvement [113].
6.2. Missed Opportunities for National Surveys
7. Improving Farmers Connection to Soil Information
7.1. Information Availability for Farmers
7.2. Connecting Farmers to Soil Information Sources
7.3. Developing Social Networks for Knowledge Exchange
8. Conclusions
Acknowledgments
Author Contributions
Conflicts of Interest
Abbreviations
| ABARES | Australian Bureau of Agricultural Resource Economics and Sciences |
| ABS | Australian Bureau of Statistics |
| ASPAC | Australasian Soil and Plant Analysis Council |
| ARMS | Agricultural Resource Management Survey (in Australia) |
| ARMS | Agricultural Resource Management Study (in United States) |
| ARS | Agricultural Research Service |
| AU | Australia |
| BRG | Border Rivers Gwydir |
| CEAP | Conservation Effects Assessment Project |
| CMA | Catchment Management Authority |
| CoA | Commonwealth of Australia |
| CSP | Conservation Security Program, Conservation Stewardship Program |
| CSREES | Co-operative State Research Education and Extension Services |
| CRES | Co-operative Research and Extension Services |
| ERS | Economic Research Service |
| EQIP | Environmental Quality Improvement Program |
| FAO | Food and Agricultural Organization of the United Nations |
| HEL | Highly Erodible Land |
| IPNI | International Plant Nutrition Institute |
| LAMPS | Land and Management Practices Survey |
| N | nitrogen |
| NASS | National Agricultural Statistical Service |
| NIFA | National Institute of Food and Agriculture |
| NRCS | National Resources Conservation Service |
| NRI | National Resources Inventory |
| NSW | New South Wales |
| RD & E | Research, Development and Extension |
| REAACS | Rural Environment and Agricultural Commodities Survey |
| SOE | State of the Environment |
| US | United States |
| USDA | United States Department of Agriculture |
| WSS | Web Soil Survey |
Appendix


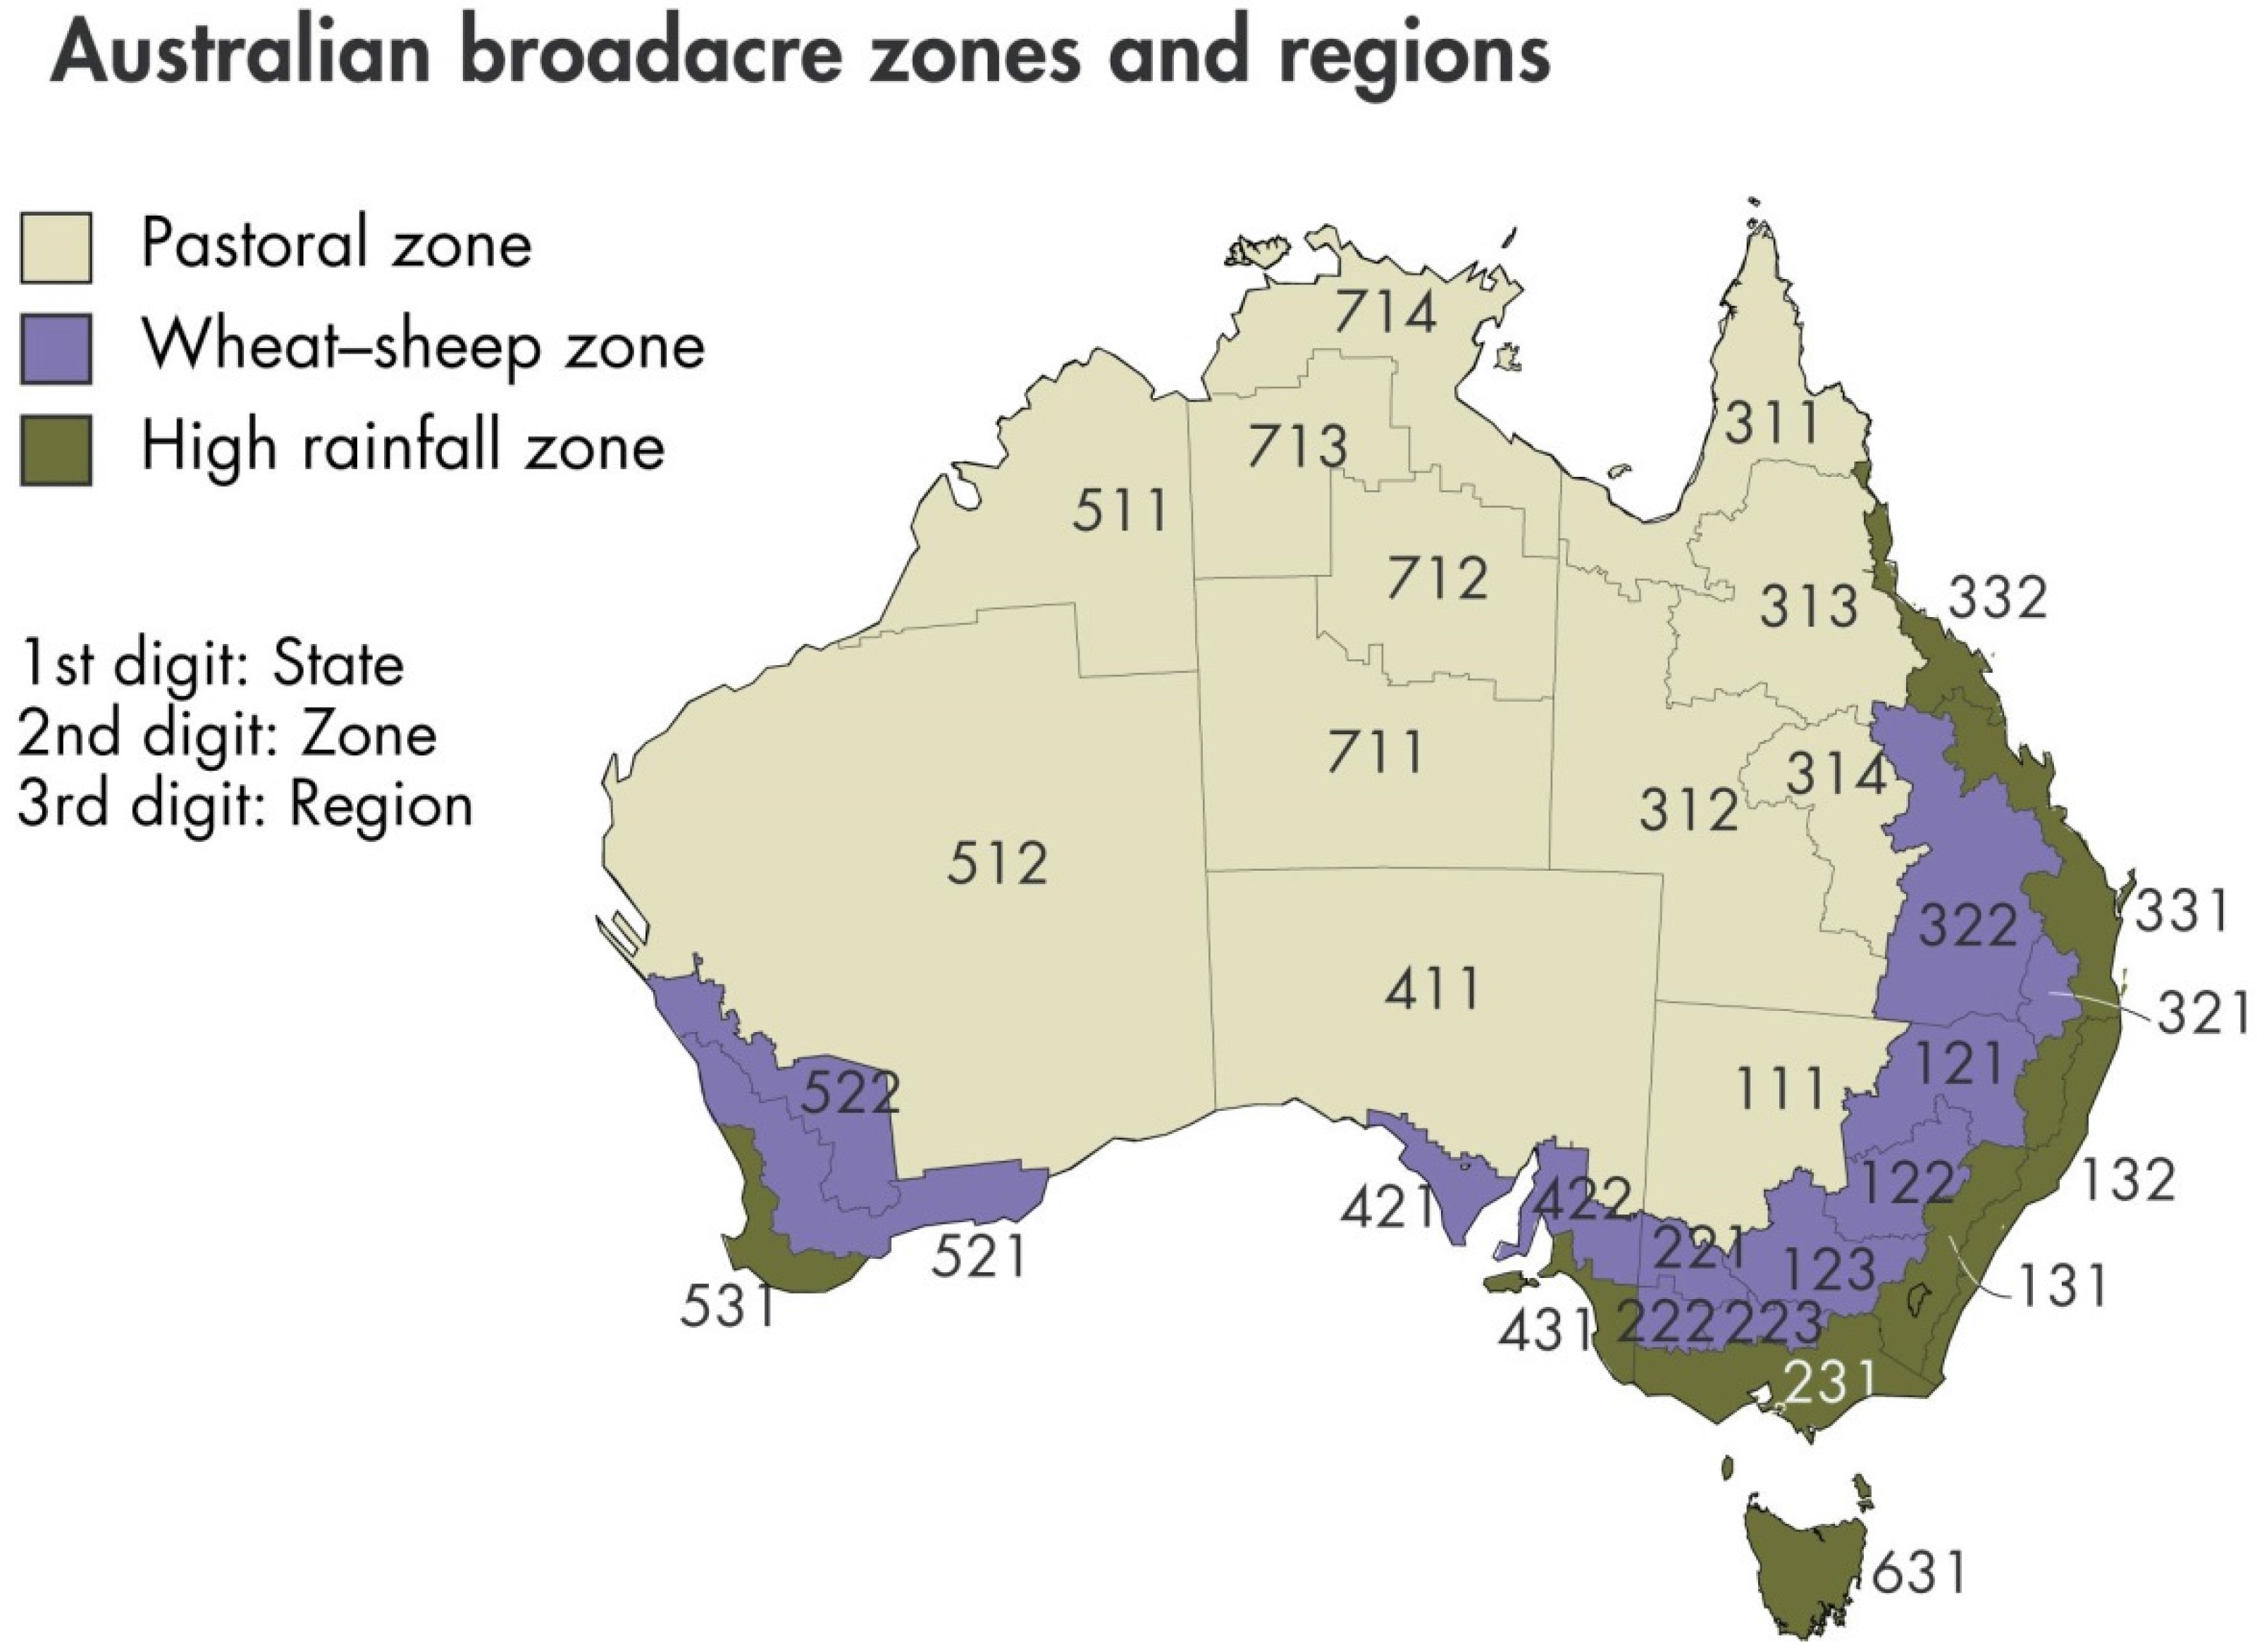
| Zone | Membership within Zone a | Survey Dates | Population within Membership | Sample Size | Have a Documented Farm Plan? | RSE | Farm Plan with Land Capability (% of Farm Plans) | RSE | Soil/Tissue Test b | RSE | Plan Refers to Region or Catchment Plan | RSE | Reference |
|---|---|---|---|---|---|---|---|---|---|---|---|---|---|
| (No of Farms) | (No of Farms) | (%) | % | (%) | % | (%) | % | (%) | % | ||||
| All zones | All Broadacre Farms | 1992–1993 | 78,127 | 1611 | 30 | 6 | 66 | 5 | 31 | 6 | - | [56] | |
| All zones | All Broadacre and Dairy Farms | 1995–1996 | 85,800 | 1528 | 36 | 5 | 69 | 4 | - | 44 | 7 | [55] | |
| Wheat Sheep and High Rainfall zone | Wheat Sheep and High Rainfall Zone Intersection | 1998–1999 | 85,874 | 1470 | 27 | 6.5 | 68 | 4.6 | 52 | 4.4 | - | - | |
| All zones | All Broadacre and Dairy Farms | 2001–2002 | 79,925 | 1329 | 19 | 8 | 72 | 5 | 65 | 4 | 44 | - | [141] |
| All zones | All Broadacre and Dairy Farms | 2004–2005 | 73,302 | 1686 | 20 | - | 75 | - | 59 | 3 | 23 | - | [57] |
| All zones | All Broadacre and Dairy Farms | 2004–2005 | 75,505 | 20,000 | - | - | - | - | 37 | 6.3 | - | - | [105] |
| All zones | Livestock and Grain farmers | 2006–2007 | 50,483, 10,715 | 1458 | 16.5 | - | - | - | 41, 54 | - | 34, 32 | - | [54] |
| All zones | All Broadacre and Dairy Farms | 2007–2008 | 106,974 | 20 | - | - | - | 29 | - | - | - | [30,88] | |
| Wheat Sheep zone | Grain farms | 2009 | 27,000 | 1300 | - | - | - | - | 30 | - | - | - | [36] |
| Broadacre Cropping | 2009–2010 | 64,600 | - | - | - | - | 27 | - | - | - | [88] | ||
| Wheat Sheep zone | Grain farms | 2011 | 30,316 | 1312 | - | - | - | - | 29 | - | - | - | [37] |
| All zones | All Broadacre and Dairy Farms | 2010–2011 | 52,907 | 1329 | 31 | - | - | - | - | - | - | [59] |
| Variable | Unit | Owner | Renter | ||
|---|---|---|---|---|---|
| Estimate | RSE ª | Estimate | RSE ª | ||
| Planted hectares | 1000 ha | 15,139 | 4.3 | 17,939 | 3.6 |
| Conservation program participation (cost-share/incentive received) | percent of planted ha | 16 | 15.3 | 10 | 14.9 |
| Cost-share or incentive from EQIP | percent of ha receiving payments | 28 | 50.5 | 12 * | 41.6 |
| Cost-share or incentive from CSP | percent of ha receiving payments | 31 | 26.2 | 38 | 23.3 |
| Cost-share or incentive from CRP | percent of ha receiving payments | 25 | 30.2 | 29 * | 27.8 |
| Cost-share or incentive received from other programs | percent of ha receiving payments | 14 | 39.0 | 16 | 24.0 |
| Written conservation plan for soil erosion | percent of planted ha | 24 | 10.9 | 18 | 7.9 |
| Cost-share or incentive received (erosion plan) | percent of ha w/erosion plan | 49 | 12.0 | 32 | 17.5 |
| Soil erosion controls used | percent of planted ha | 16 | 12.6 | 19 | 11.5 |
| Cost-share or incentive received (erosion controls) | percent of ha w/soil erosion controls | 39 | 14.5 | 22 | 29.7 |
| Written conservation plan for nutrient management | percent of planted ha | 8 | 16.9 | 6.5 | 26.9 |
| Cost-share or incentive received (nutrient plan) | percent of ha w/nutrient plan | 35 | 27.6 | 30 * | 27.3 |
| Conservation buffers used | percent of planted ha | 13 | 20.0 | 9 | 13.0 |
| Cost-share or incentive received for conservation buffers | percent of ha w/conservation buffers | 77 | 10.6 | 61 | 13.0 |
| Written conservation plan for pest management | percent of planted ha | 5 | 30.7 | 2.3 | 40.2 |
| Cost-share or incentive received (pest plan) | percent of ha w/pest mgmt plan | 25 * | 50.9 | 34 * | 38.7 |
| Written conservation plan for irrigation management | percent of planted ha | 2.4 * | 33.4 | 2.1 * | 38.4 |
| Cost-share or incentive received (irrigation plan) | percent of ha w/water mgmt plan | 55 * | 32.3 | 69 | 19.1 |
| Water control structures used | percent of planted ha | 27 | 7.6 | 29 | 10.6 |
| Cost-share or incentive received (water control structures) | percent of ha w/water control structures | 4.5 * | 37.9 | 1.3 * | 27.6 |
| Other conservation practices used | percent of planted ha | 1.1 * | 36.2 | 2.9 * | 37.3 |
| Cost-share or incentive received (other conservation practices) | percent of ha w/other conservation practices | 99 | 1.1 | 100 | 0.0 |
| Received technical assistance for conservation practices | percent of planted ha | 5.5 | 24.8 | 4.7 | 25.0 |
References
- Pimentel, D.; Harvey, C.; Resosudarmo, P.; Sinclair, K.; Kurz, D.; McNair, M.; Crist, S.; Shpritz, L.; Fitton, L.; Saffouri, R.; et al. Environmental and economic costs of soil erosion and conservation benefits. Science 1995, 267, 1117–1123. [Google Scholar] [CrossRef] [PubMed]
- Food and Agricultural Organization of the United Nations (FAO). Revised World Soil Charter; FAO: Rome, Italy, 2015; pp. 1–7. [Google Scholar]
- Dobbs, T.L.; Pretty, J.N. Agri-environmental stewardship schemes and multifunctionality. Appl. Econ. Perspect. Policy 2004, 26, 220–237. [Google Scholar] [CrossRef]
- Karlen, D.L.; Andrews, S.S.; Doran, J.W. Soil quality: Current concepts and applications. In Advances in Agronomy; Academic Press: Waltham, MA, USA, 2001; Volume 74, pp. 1–40. [Google Scholar]
- Pretty, J.; Brett, C.; Gee, D.; Hine, R.; Mason, C.; Morison, J.; Rayment, M.; van der Bijl, G.; Dobbs, T. Policy challenges and priorities for internalizing the externalities of modern agriculture. J. Environ. Plann. Manag. 2001, 44, 263–283. [Google Scholar] [CrossRef]
- Soil and Water Conservation Society (SWCS). Beyond T: Guiding Sustainable Soil Management; SWCS: Ankeny, IA, USA, 2008; p. 18. [Google Scholar]
- Committee on Long-Range Soil and Water Conservation; Board on Agriculture; National Research Council. Soil and Water Quality: An Agenda for Agriculture; National Academy Press: Washington, DC, USA, 1993; p. 519.
- Larson, W.E.; Pierce, F.J. Conservation and the enhancement of soil quality. In Evaluation for Sustainable Land Management in the Developing World; International Board for Soil Research and Management: Bangkok, Thailand, 1991; Volume 2, pp. 175–203. [Google Scholar]
- Tugel, A.J.; Herrick, J.E.; Brown, J.R.; Mausbach, M.J.; Puckett, W.; Hipple, K. Soil change, soil survey, and natural resources decision making: A blueprint for action. Soil Sci. Soc. Am. J. 2005, 69, 738–747. [Google Scholar] [CrossRef]
- Food and Agricultural Organization of the United Nations (FAO) and Intergovermental Panel on Soils (ITPS). Status of the World’s Soil Resources—Main Report; FAO/ITPS: Rome, Italy, 2015; pp. 1–648. [Google Scholar]
- Food and Agricultural Organization of the United Nations (FAO) and Intergovermental Panel on Soils (ITPS). 8 governance and policy responses to soil change. In Status of the World’s Soil Resources—Main Report; FAO/ITPS: Rome, Italy, 2015; pp. 223–241. [Google Scholar]
- Food and Agricultural Organization of the United Nations (FAO) and Intergovermental Panel on Soils (ITPS). 14 regional assessment of soil changes in North America. In Status of the World’s Soil Resources—Main Report; Pennock, D., Ed.; FAO/ITPS: Rome, Italy, 2015; pp. 442–475. [Google Scholar]
- Food and Agricultural Organization of the United Nations (FAO) and Intergovermental Panel on Soils (ITPS). 15 regional assessment of soil change in the southwest pacific. In Status of the World’s Soil Resources—Main Report; McKenzie, N.J., Ed.; FAO/ITPS: Rome, Italy, 2015; pp. 476–516. [Google Scholar]
- Folke, C.; Carpenter, S.R.; Walker, B.; Scheffer, M.; Chapin, T.; Rockström, J. Resilience Thinking: Integrating Resilience, Adaptability and Transformability. Available online: http://www.ecologyandsociety.org/vol15/iss4/art20/ (accessed on 24 March 2016).
- Walker, B.H.; Carpenter, S.R.; Rockstrom, J.; Crépin, A.S.; Peterson, G.D. Drivers, “slow” variables, “fast” variables, shocks, and resilience. Ecol. Soc. 2012. [Google Scholar] [CrossRef]
- Williams, J. Soils governance in Australia: Challenges of cooperative federalism. Int. J. Rural Law Policy 2015, 1, 1–12. [Google Scholar]
- Baumhardt, R.L.; Stewart, B.A.; Sainju, U.M. North American soil degradation: Processes, practices and mitigating strategies. Sustainability 2015, 7, 2936–2960. [Google Scholar] [CrossRef]
- Cary, J.; Roberts, A. The limitations of environmental management systems in Australian agriculture. J. Environ. Manag. 2011, 92, 878–885. [Google Scholar] [CrossRef] [PubMed]
- Benton, J. Soil analysis (testing). In Laboratory Guide for Conducting Soil Tests and Plant Analysis; CRC Press: Boca Raton, FL, USA, 2001; pp. 11–190. [Google Scholar]
- Rayment, G.E.; Higginson, F.R. Australian Laboratory Handbook of Soil and Water Chemical Methods; Inkata Press: Melbourne, Australia, 1992. [Google Scholar]
- Rayment, G. Soil and plant testing in Australia—The players, clients, methods and issues. In Tools for Nutrient and Pollutant Management—Applications to Ariculture and Environmental Quality; Currie, L.D., Hanly, J.A., Eds.; Fertlizer and Lime Research Centre: Massey University, New Zealand, 2004; pp. 9–23. [Google Scholar]
- Westerman, R.L. Soil Testing and Plant Analysis; Soil Science Society of America: Madison, WI, USA, 1990. [Google Scholar]
- Peverill, K.I. Soil testing and plant analysis in Australia. Aust. J. Exp. Agric. 1993, 33, 963–971. [Google Scholar] [CrossRef]
- Peverill, K.I.; Sparrow, L.A.; Reuter, D.J. Soil Analysis: An Interpretation Manual; CSIRO Publishing: Melbourne, Australia, 1999. [Google Scholar]
- Department of Agriculture and Water Resources. Monitor. Available online: http://data.daff.gov.au/monitor/explore.html (accessed on 24 March 2016).
- Australian Bureau of Statistics (ABS). 4627.0-Land Management and Farming in Australia. Available online: http://www.abs.gov.au/ausstats/[email protected]/mf/4627.0 (accessed on 24 March 2016).
- United States Department of Agriculture, Economic Research Service. ARMS Farm Financial and Crop Production Practices. Available online: http://www.ers.usda.gov/data-products/arms-farm-financial-and-crop-production-practices/tailored-reports-farm-structure-and-finance.aspx (accessed on 24 March 2016).
- Andrews, S.S.; Flora, C.B.; Mitchell, J.P.; Karlen, D.L. Growers’ perceptions and acceptance of soil quality indices. Geoderma 2003, 114, 187–213. [Google Scholar] [CrossRef]
- National Resource Conservation Service National Soil Survey Center. Soil quality for environmental health. Available online: http://soilquality.org/home.html (accessed on 24 March 2016).
- Australian Bureau of Statistics (ABS). 4627 Land Management and Farming in Australia 2007–2008; ABS: Canberra, Australia, 2009.
- Australian Bureau of Statistics (ABS). 4627 Land Management and Farming in Australia, 2009–2010; ABS: Canberra, Australia, 2011.
- Australian Bureau of Statistics (ABS). 4627 Land Management and Farming in Australia 2011–2012; ABS: Canberra, Australia, 2013.
- Australian Bureau of Statistics (ABS). 4627 Land Management and Farming in Australia 2012–2013; ABS: Canberra, Australia, 2014. [Google Scholar]
- Bennett, J.M.; Lobry de Bruyn, L.A.; University of Southern Queensland, Towoomba, Australia. Personal Communication, 2015.
- Bennett, J.M. Combating sodicity in the Lachlan and Macquarie valleys of New South Wales; Sydney University: Sydney, Australia, 2011. [Google Scholar]
- Kearns, S.; Umbers, A. GRDC Farm Practices Baseline Report 2010; GRDC: Canberra, Australia, 2010. [Google Scholar]
- Edwards, J.; Umbers, A.; Wentworth, S. GRDC Farm Practices Survey Report 2012; GRDC, Kingston, ACT: Barton, Australia, 2012. [Google Scholar]
- Australian Bureau of Statistics (ABS). 4627 Land Management and Farming in Australia 2013–2014; ABS: Canberra, Australia, 2015.
- Lambert, D.; Sullivan, P.; Claassen, R.; Foreman, L. Conservation-Compatible Practices and Programs: Who Participates? Economic Research Service/United States Department of Agriculture: Washington, DC, USA, 2006; pp. 1–42.
- Foreman, L. Characteristics and production costs of U.S. Corn farms. In Statistical Bulletin 974; United States Department of Agriculture, Economic Research Service: Washington, DC, USA, 2001; pp. 1–28. [Google Scholar]
- Foreman, L. Characteristics and production costs of U.S. Corn farms, 2001. In Economic Information Bulletin, No 7; United States Department of Agriculture, Economic Research Service: Washington, DC, USA, 2006; pp. 1–47. [Google Scholar]
- Foreman, L. Characteristics and production costs of U.S. Corn farms, including organics, 2010. In Economic Information Bulletin 128; United States Department of Agriculture, Economic Research Service: Washington, DC, USA, 2014; pp. 1–37. [Google Scholar]
- Huang, W.; Beckman, J. Agricultural production management. In Agricultural Resources and Environmental Indicators, 2012 ed.Osteen, C., Gottlieb, J., Vasavada, U., Eds.; USDA, ERS: Washington, DC, USA, 2012; pp. 25–28. [Google Scholar]
- Plank, O.C. Soil, Plant and Animal Waste Water Analysis: Status Report for the United States; Soil and Plant Analytical Council Incorporated: Lincoln, NE, USA, 1998. [Google Scholar]
- United States Department of Agriculture, NASS. 2012 Census of Agriculture: Preliminary Report Highlights: U.S. Farms and Farmers; United States Department of Agriculture, National Agricultural Statistics Service: Washington, DC, USA, 2014; pp. 1–4.
- Fixen, P.E. Soil test levels in North America. Better Crop. 2002, 86, 12–15. [Google Scholar]
- United States Department of Agriculture (USDA). Summary Report: 2010 National Resources Inventory; Natural Resources Conservation Service: Washington, DC, USA; Center for Survey Statistics and Methodology: Iowa State University, Ames, IA, USA, 2013.
- Miller, R.; Lobry de Bruyn, L.A.; Colorado State University, Fort Collins, CO, USA. Personal Communication, 2016.
- Australian Bureau of Statistics (ABS). 7121.0 Agricultural Commodities, Australia, 1997–1998; ABS: Canberra, Australia, 1999.
- Australian Bureau of Statistics (ABS). 7121.0 Agricultural Commodities, Australia, 2002–2003; ABS: Canberra, Australia, 2004.
- Commonwealth of Australia. The National Soil Research, Development and Extension Strategy, Securing Australia’s Soil, for Profitable Industries and Healthy Landscapes; Department of Agriculture Forestry and Fisheries DAFF: Canberra, Australia, 2014; p. 75.
- Reuter, D.J.; Hannam, R.J. Soil and Plant Testing in Australia; Australian Society of Agronomy: Melbourne, Australia, 1987; pp. 34–46. [Google Scholar]
- Wilson, B.; Lobry de Bruyn, L.A.; University of New England, Armidale, Australia. Personal Communication, 2015.
- Oliver, M.; Ashton, D.; Hodges, A.; Mackinnon, D. Farmers’ Use of Sustainable Management Practices; ABARE Report for the National Land and Water Resources Audit: Canberra, Australia, 2009.
- Mues, C.; Chapman, L.; Van Hilst, R. Promoting Improved Land Management Practices on Australian Farms: A Survey of Landcare and Land Management Related Programs; ABARE: Canberra, Australia, 1998.
- Mues, C.; Roper, H.; Ockerby, J. Survey of Landcare and Land Management Practices: 1992–1993; ABARE: Canberra, Australia, 1994.
- Hodges, A.; Goesch, T. Australian Farms: Natural Resource Management in 2004–2005; ABARE: Canberra, Australia, 2006.
- Campbell, A. Managing Australia’s Soils: A Policy Discussion Paper. National Committee on Soils and Terrain; DAFF: Canberra, Australia, 2008.
- Ecker, S.; Thompson, L.; Kancans, R.; Stenekes, N.; Mallawaaraachchi, T. Drivers of Practice Change in Land Management in Australian Agriculture: Results of a National Farm Survey; ABARES: Canberra, Australia, 2012; p. 63.
- Ribaudo, M. Conservation policies: Working-lands conservation programs. In Agricultural Resources and Environmental Indicators, 2012 ed.Osteen, C., Gottlieb, J., Vasavada, U., Eds.; United States Department of Agriculture, Economic Research Service: Washington, DC, USA, 2012; pp. 47–48. [Google Scholar]
- National Wildlife Federation (NWF). A Roadmap to Increased Cover Crop Adoption; NWF: Merrifield, VA, USA, 2012; pp. 1–12. [Google Scholar]
- Romig, D.E.; Garlynd, M.J.; Harris, R.F.; McSweeney, K. How farmers assess soil health and quality. J. Soil Water Conserv. 1995, 50, 229–236. [Google Scholar]
- Liebig, M.A.; Doran, J.W. Evaluation of farmers’ perceptions of soil quality indicators. Am. J. Altern. Agric. 1999, 14, 11–21. [Google Scholar] [CrossRef]
- Lobry de Bruyn, L.A.; Abbey, J.A. Characterisation of farmers’ soil sense and the implications for on-farm monitoring of soil health. Aust. J. Exp. Agric. 2003, 43, 285–305. [Google Scholar] [CrossRef]
- Speirs, S.D.; Reuter, D.J.; Peverill, K.I.; Brennan, R.F. Making better fertiliser decisions for cropping systems in Australia: An overview. Crop Pasture Sci. 2013, 64, 417–423. [Google Scholar] [CrossRef]
- Ingram, J.; Fry, P.; Mathieu, A. Revealing different understandings of soil held by scientists and farmers in the context of soil protection and management. Land Use Policy 2010, 27, 51–60. [Google Scholar] [CrossRef] [Green Version]
- Ingram, J. Are farmers in England equipped to meet the knowledge challenge of sustainable soil management? An analysis of farmer and advisor views. J. Environ. Manag. 2008, 86, 214–228. [Google Scholar] [CrossRef] [PubMed] [Green Version]
- Kelly, B.; Allan, C.; Wilson, B.P. Soil indicators and their use by farmers in the Billabong catchment, southern New South Wales. Soil Res. 2009, 47, 234–242. [Google Scholar] [CrossRef]
- Commonwealth of Australia. Managing Natural Resources in Rural Australia for a Sustainable Future: A Discussion Paper for Developing a National Policy; Department of Agriculture, Fisheries and Forestry, Australia: Canberra, Australia, 1999.
- Bennett, J.M.; Cattle, S.R. Adoption of soil health improvement strategies by Australian farmers: I. Attitudes, management and extension implications. J. Agric. Educ. Ext. 2013, 19, 407–426. [Google Scholar] [CrossRef]
- Bennett, J.M.; Cattle, S.R. Adoption of soil health improvement strategies by Australian farmers: II. Impediments and incentives. J. Agric. Educ. Ext. 2014, 20, 107–131. [Google Scholar] [CrossRef]
- Australian Bureau of Statistics (ABS). 4627 Land Management and Farming in Australia, 2010–2011; ABS: Canberra, Australia, 2012.
- Fixen, P.E. Soil test levels in North America. Better Crop. 1998, 82, 16–18. [Google Scholar]
- Fixen, P.E.; Bruulsema, A.M.; Johnston, T.W.; Mikkelsen, R.L.; Murrell, T.S.; Snyder, C.S.; Stewart, W.M. The Fertility of North American Soils; Potash & Phosphate Institute: Norcross, GE, USA, 2006. [Google Scholar]
- Fixen, P.E.; Bruulsema, T.W.; Jensen, T.L.; Mikkelsen, R.; Murrell, T.S.; Phillips, S.B.; Rund, Q.; Stewart, W.M. The fertility of North American soils. Better Crop. 2010, 94, 6–8. [Google Scholar]
- Potash and Phosphate Institute (PPI). Soil test summaries: Phosphorus, Potassium and pH. Better Crop. 1990, 74, 16–18. [Google Scholar]
- Potash and Phosphate Institute (PPI). Soil test summaries: Phosphorus, Potassium, and pH. Better Crop. 1994, 78, 14–17. [Google Scholar]
- International Plant Nutrition Institute (IPNI). Soil Test Levels in North America; IPNI: Peachtree Corners, GA, USA, 2010. [Google Scholar]
- Fixen, P.E. Soil test levels in North America. Better Crop. 2006, 90, 4–7. [Google Scholar]
- Ward Laboratories Incorporated. Ward laboratories, Inc. Available online: https://producers.wardlab.com/default.aspx (accessed on 24 March 2016).
- United States Department of Agriculture Natural Resources Conservation Service. CSP Enhancement Activity Job Sheets. Available online: http://www.nrcs.usda.gov/wps/portal/nrcs/detailfull/national/programs/financial/csp/?cid=stelprdb1265825 (accessed on 24 March 2016).
- Cornell University College of Agriculture and Life Sciences. Comprehensive Assessment of Soil Health-The Cornell Framework Manual. Available online: http://soilhealth.cals.cornell.edu/ (accessed on 21 March 2016).
- USDA NRCS. Soil Quality Enhancement Activity—SQL15—Utilize the Soil Health Nutrient Tool to Assess Soil Nutrient Pools; USDA: Washington, DC, USA, 2014.
- Porsborg, D.; Lobry de Bruyn, L.A.; Farmer, Oliver County, ND, USA. Personal Communication, 2015.
- Martin, P.; Riley, D.; Ashton, D.; Delforce, J.; Loggia, D. Australian Grains Industry 1998: Report of the Australian Agricultural and Grazing Industries Survey of Grain Producing Farms; ABARE: Canberra, Australia, 1998.
- Bosch, O.J.H.; Allen, W.J.; Gibson, R.S. Monitoring as an integral part of management and policy making. In Proceedings of the Symposium on Resource Management: Issues, Visions, Practice, Lincoln, New Zealand, 5–8 July 1996; pp. 12–21.
- Brown, R.; USDA ERS, Washington, DC, USA. Unpublished work. 2015.
- Barson, M.; Mewett, J.; Paplinksa, J. Land Management Practice Trends in Australia’s Broadacre Cropping Industries; DAFF: Canberra, Australia, 2012.
- Pannell, D.J.; Marshall, G.R.; Barr, N.; Curtis, A.; Vanclay, F.; Wilkinson, R. Understanding and promoting adoption of conservation practices by rural landholders. Aust. J. Exp. Agric. 2006, 46, 1407–1424. [Google Scholar] [CrossRef]
- Kancans, R.; Ecker, S.; Duncan, A.; Stenekes, N.; Zobel-Zubrzycka, H. Drivers of Practice Change in Land Management in Australian Agriculture, Synthesis Report—Stages I, II and III; ABARES: Canberra, Australia, 2014.
- Llewellyn, R.S.; D’Emden, F. Adoption of No-Till Cropping Practices in Australian Grain Growing Regions; Australian Government, Grains Research and Development Corporation: Kingston, Australia, 2010.
- D’Emden, F.H.; Llewellyn, R.S.; Burton, M.P. Factors influencing adoption of conservation tillage in Australian cropping regions. Aust. J. Agric. Resour. Econ. 2008, 52, 169–182. [Google Scholar] [CrossRef]
- Mitchell, J.; Andrews, S.S.; Kearney Agricultural Research and Extension Center, Parlier, CA, USA. Personal Communication, 2010.
- Department of Primary Industries Victoria. Soil Heallth Management Plan: Concept, Process and Pilot Study with Mid-Loddan Sub-Catchment Group; Department of Primary Industries: Melbourne, Australia, 2009.
- Tiemann, L.K.; Grandy, A.S.; Atkinson, E.E.; Marin-Spiotta, E.; McDaniel, M.D. Crop rotational diversity enhances belowground communities and functions in an agroecosystem. Ecol. Lett. 2015, 18, 761–771. [Google Scholar] [CrossRef] [PubMed]
- Wallander, S. While crop rotations are common, cover crops remain rare. In Amber Waves; USDA ERS: Washington, DC, USA, 2013. [Google Scholar]
- Conservation Effects Assessment Project (CEAP). Assessment of the Effects of Conservation Practices on Cultivated Cropland in the Upper Mississippi River Basin; United States Department of Agriculture, Natural Resources Conservation Service: Washington, DC, USA, 2012.
- Singer, J.W. Cover Crops in the Corn Belt: Survey Finds Underused Potential as Conservation Tool; Leopold Center for Sustainable Agriculture: Ames, IA, USA, 2006; p. 3. [Google Scholar]
- Conservation Technology Innovation Centre/Sustainable Agriculture Research and Extension CTIC/SARE. 2012–2013 Annual Report—Cover Crop Survey; CTIC/SARE: West Lafayette, IN, USA, 2014; pp. 1–50. [Google Scholar]
- Conservation Technology Innovation Centre/Sustainable Agriculture Research and Extension CTIC/SARE. 2014–2015 Annual Report—Cover Crop Survey; CTIC/SARE: West Lafayette, IN, USA, 2015; pp. 1–45. [Google Scholar]
- Australian Bureau of Statistics (ABS). Australian Social Trends December 2012: Australian Farming and Farmers; Commonwealth of Australia: Canberra, Australia, 2012.
- Cary, J.; Webb, T.; Barr, N. Understanding Landholders’ Capacity to Change to Sustainable Practices; Bureau of Rural Sciences: Canberra, Australia, 2002.
- Gazey, C.; Oliver, Y.; Fisher, J.; Andrew, J.; Carr, S. 20 Years of soil Acidity RD and E in Western Australia: What Have We Learnt? Western Australia Department of Agriculture: Perth, Australia, 2014; pp. 1–5.
- Australian Bureau of Statistics (ABS). 4620 Natural Resource Management on Australian Farms; ABS: Canberra, Australia, 2008.
- Australian Bureau of Statistics (ABS). 4620 Natural Resource Management on Australian Farms 2004–2005; ABS: Canberra, Australia, 2007.
- Bramley, R.; Cook, S. Some comments on the utility of soil test data for fertility management and resource assessment. In ACLEP Newsletter; CSIRO: Canberra, ACT, 2000; pp. 27–34. [Google Scholar]
- Nickerson, C.M.; Morehart, T.; Kuethe, J.; Beckman, J.; Ifft, J.; Williams, R. Trends in U.S. Farmland values and ownership. In Economic Information Bulletin Number 92; USDA Economics Research Service: Washington, DC, USA, 2012. [Google Scholar]
- Soil Health Partnership. Tim Smith Eagle Grove, Iowa. Available online: http://www.soilhealthpartnership.org/meet-tim-smith.html (accessed on 24 March 2016).
- Rogers, E.M. Diffusion of Innovations; Free Press: New York, NY, USA, 2003. [Google Scholar]
- Johnson, G.V.; Westerman, R.L. Improving soil testing credibility. Commun. Soil Sci. Plant Anal. 1980, 11, 251–255. [Google Scholar] [CrossRef]
- Loescher, H.; Ayres, E.; Duffy, P.; Luo, H.; Brunke, M. Spatial variation in soil properties among North American ecosystems and guidelines for sampling designs. PLoS ONE 2014. [Google Scholar] [CrossRef] [PubMed]
- Cook, S.; Bramley, R. Coping with variability in agricultural production—Implications for soil testing and fertiliser management. Commun. Soil Sci. Plant Anal. 2000, 31, 1531–1551. [Google Scholar] [CrossRef]
- Lehman, R.; Cambardella, C.; Stott, D.; Acosta-Martinez, V.; Manter, D.; Buyer, J.; Maul, J.; Smith, J.; Collins, H.; Halvorson, J.; et al. Understanding and enhancing soil biological health: The solution for reversing soil degradation. Sustainability 2015, 7, 988–1027. [Google Scholar] [CrossRef]
- Wall, D.H.; Nielsen, U.N.; Six, J. Soil biodiversity and human health. Nature 2015, 528, 69–76. [Google Scholar] [CrossRef] [PubMed]
- USDA ARS NRCS SQI. Soil Quality Test Kit; USDA: Washington, DC, USA, 2001; p. 82.
- USDA NRCS SQI. Soil Quality Card Design Guide: A Guide to Develop Locally Adapted Conservation Tools; USDA: Washington, DC, USA, 1999; p. 115.
- United States Department of Agriculture, National Resources Conservation Service. Soil Health Card. Available online: http://www.nrcs.usda.gov/wps/portal/nrcs/detail/soils/health/assessment/?cid=nrcs142p2_053871 (accessed on 24 March 2016).
- Liebig, M.A.; Doran, J.W.; Gardner, J.C. Evaluation of a field test kit for measuring selected soil quality indicators. Agron. J. 1996, 88, 683–686. [Google Scholar] [CrossRef]
- Karlen, D.L.; Wienhold, B.J.; Kang, S.; Zobeck, T.M.; Andrews, S.S. Chapter 3: Indices for soil management decisions. In Soil Management: Building a Stable Base for Agriculture; Hatfield, J., Sauer, T.J., Eds.; American Society of Agronomy and Soil Science Society of America: Madison, WI, USA, 2011. [Google Scholar]
- McKenzie, N.; Lobry de Bruyn, L.A.; CSIRO Land and Water, Canberra, Australia. Personal Communication, 2015.
- United States Department of Agriculture Natural Resources Conservation Service. Web Soil Survey. Available online: http://websoilsurvey.sc.egov.usda.gov/App/HomePage.htm (accessed on 24 March 2016).
- USDA NASS. Farm Computer Usage and Ownership; USDA NASS: Washington, DC, USA, 2013; pp. 1–29.
- eXtensionAUS. Australia’s Research-Based Learning Network. Available online: http://www.extensionaus.com.au/ (accessed on 24 March 2016).
- eXtension. For extension Professionals and the Public They Serve. Available online: https://extension.org/ (accessed on 24 March 2016).
- Beange, L.; Lobry de Bruyn, L.A.; Department of Primary Industries, NSW, Dubbo, Australia. Personal Communication, 2015.
- Land & Water Australia. Knowledge for Managing Australian Landscapes 1990–2009. Available online: http://lwa.gov.au/ (accessed on 24 March 2016).
- Land & Water Australia. National Land and Water Resources Audit. Available online: http://lwa.gov.au/programs/national-land-and-water-resources-audit (accessed on 24 March 2016).
- Food and Agricultural Organization of the United Nations (FAO). FAOKnowledge. Available online: https://twitter.com/FAOKnowledge (accessed on 24 March 2016).
- United States Department of Agriculture Natural Resources Conservation Service North Dakota. Unlock the Secrets in the Soil. Available online: http://www.nrcs.usda.gov/wps/portal/nrcs/main/nd/soils/health/ (accessed on 24 March 2016).
- United States Department of Agriculture Natural Resources Conservation Service. Minnesota Farm Uses Conservation to Make Each Acre Count. Available online: http://www.nrcs.usda.gov/wps/portal/nrcs/detail/national/newsroom/features/?cid=stelprdb1249011 (accessed on 24 March 2016).
- UCDavis California Soil Resource Lab. Soil Web Apps. Available online: http://casoilresource.lawr.ucdavis.edu/soilweb-apps/ (accessed on 24 March 2016).
- Soil Quality Pty Ltd. Welcome to the Soil Quality Website. Available online: http://www.soilquality.org.au/ (accessed on 24 March 2016).
- Hoover, D.; Lobry de Bruyn, L.A.; USDA National Soil Survey Centre, Lincoln, NE, USA. Personal Communication, 2015.
- Hunt, W.; Birch, C.; Vanclay, F.; Coutts, J. Recommendations arising from an analysis of changes to the Australian agricultural research, development and extension system. Food Policy 2014, 44, 129–141. [Google Scholar] [CrossRef]
- Thuo, M.; Bell, A.; Bravo-Ureta, B.; Lachaud, M.; Okello, D.; Okoko, E.; Kidula, N.; Deom, C.; Puppala, N. Effects of social network factors on information acquisition and adoption of improved groundnut varieties: The case of uganda and kenya. Agric. Hum. Values 2014, 31, 339–353. [Google Scholar] [CrossRef]
- Soils for Life Pty Ltd. Soils for Life. Available online: http://www.soilsforlife.org.au/about.html (accessed on 24 March 2016).
- SoilCare Inc. Available online: http://www.soilcare.org/about.html (accessed on 24 March 2016).
- Soil Health Partnership. Available online: http://www.soilhealthpartnership.org/ (accessed on 24 March 2016).
- USDA NASS. Conservation Effects Assessment Project (CEAP) 2004 Survey; USDA NASS: Washington, DC, USA, 2004.
- Arbuckle, J.G.; Ferrell, J. Attitudes toward Cover Crops in Iowa: Benefits and Barriers; Iowa State University Extension and Outreach: Ames, IA, USA, 2012. [Google Scholar]
- Nelson, R.; Alexander, F.; Elliston, L.; Blias, A. Natural Resource Management on Australian Farms; ABARE: Canberra, Australia, 2004.


© 2016 by the authors; licensee MDPI, Basel, Switzerland. This article is an open access article distributed under the terms and conditions of the Creative Commons by Attribution (CC-BY) license (http://creativecommons.org/licenses/by/4.0/).
Share and Cite
Lobry de Bruyn, L.; Andrews, S. Are Australian and United States Farmers Using Soil Information for Soil Health Management? Sustainability 2016, 8, 304. https://doi.org/10.3390/su8040304
Lobry de Bruyn L, Andrews S. Are Australian and United States Farmers Using Soil Information for Soil Health Management? Sustainability. 2016; 8(4):304. https://doi.org/10.3390/su8040304
Chicago/Turabian StyleLobry de Bruyn, Lisa, and Susan Andrews. 2016. "Are Australian and United States Farmers Using Soil Information for Soil Health Management?" Sustainability 8, no. 4: 304. https://doi.org/10.3390/su8040304