Article

Who is Next? Identifying Communities with the Potential for Increased Implementation of Sustainability Policies and Programs

1
U.S. Environmental Protection Agency, Office of Research and Development, National Exposure Research Laboratory, Denver, CO 80202, USA
2
U.S. Environmental Protection Agency, Office of Research and Development, National Health and Environmental Effects Laboratory, Atlantic Ecology Division, Narragansett, RI 02882, USA
*
Author to whom correspondence should be addressed.
Sustainability 2016, 8(2), 182; https://doi.org/10.3390/su8020182
Submission received: 18 November 2015 / Revised: 29 January 2016 / Accepted: 15 February 2016 / Published: 19 February 2016

Abstract

:
Understanding the system of connections between societal contexts and policy outcomes in municipal governments provides important insights into how community sustainability happens, and why it happens differently in various communities. A growing body of research in recent years has focused on understanding the socio-economic characteristics of communities and cities that are recognized as policy leaders in sustainability. In this paper, we expand the focus beyond the leaders in sustainability as we apply a selection of socio-demographic influences of community sustainability to a large sample of U.S. communities using community classification analytics to identity a range of community types and levels of engagement with sustainability. Our typology presents an integrated and comprehensive perspective on the structure of community sustainability in the United States, highlighting key points of comparison between human capital factors such as population size and density, affluence, home ownership, and adoption of sustainability policy. The analysis provides new insights not only about community leaders in sustainability, but also communities with the civic and social capacity to do more, and the challenges that may inhibit sustainability efforts in others.

1. Introduction

Over the past two decades, the pursuit of community sustainability has received increasing attention as a means of improving quality of life, environmental integrity, and community resilience to environmental and social change. Coupled with this is the need for national, state and regional planning and environmental organizations and agencies to understand the unique challenges and opportunities that different communities face in this pursuit. Those challenges and opportunities need to be systematically compared to understand what programs and policies are or are not effective, and what are the enabling or inhibiting social capacity characteristics of different communities [1].
Community sustainability is now a familiar, although still somewhat amorphous, concept, commonly characterized as improvements in the three environmental, social and economic “pillars.” Symbiotic advances in all three pillars are often idealized as simultaneously achievable (although see Campbell [2] for debate on this point), and the general consensus is that true community sustainability cannot be achieved unless all three pillars are addressed (see Mazmanian and Kraft [3], Wheeler and Beatley [4], Bulkeley and Betsill [5], and Breheny [6]). Nevertheless, there is also a significant body of work that suggests that although U.S. communities are generally interested in pursuing broad-based “sustainability,” the practical or policy-based manifestation of the concept is often more narrowly focused on the environment and less on economy and society (see, in particular, Feiock and Bae [7], Sharp et al. [8], Saha [9], Littig and Griessler [10], and Warner [11]).
Comparing and explaining the relative sustainability or unsustainability of different cities across the United States has attracted a considerable amount of research attention in recent years. A cornerstone of that work is Portney’s [1] index of city sustainability (the “Index of Taking Sustainability Seriously”), which is a composite index of 34 variables, including: smart growth activities, land-use planning, public transportation, pollution reduction, energy conservation, governance efforts, and more. The index was developed using environmental policy and program data from 23 U.S. cities with existing sustainability plans. Interestingly, in their analysis of the cities, traditional relationships expected between city characteristics and sustainability (such as wealth, liberalness, and population size) were not found. Instead, Portney found inverse correlations for seriousness about sustainability with reliance on manufacturing and percent African American and Hispanic populations. His analysis also showed positive correlations between seriousness about sustainability with age of the population (where increased seriousness correlates with older populations) and educational levels. This mix of patterns indicated that there was not a single “type” of sustainable city, but rather that there was a complex set of factors that influenced a given community’s capacity and willingness to pursue and implement sustainability policies or programs. It is important to note that all of the communities analyzed by Portney had existing sustainability plans, which puts them ahead of most communities in terms of sustainability efforts in local governance.
Subsequent analyses of the characteristics of cities pursuing sustainability and innovative environmental programs (in particular climate policy and resilience) expanded the range of influencing factors, with emphasis on the structures that underpin communities and the stressors and opportunities that drive innovation and change. Recent examples include examinations of the role of social capital and civic capacity (e.g., Portney and Berry [12], Zahran et al. [13]); government finances and the influence of state-level or subnational initiatives and policies (e.g., Krause [14], Kwon et al. [15]); and governance institutions and structures (e.g., Lubell et al. [16]).
By their nature, these more sharply-focused analyses involve the assembly and examination of specialized and topic-dependent datasets, but most of them also include some examination of aligned socio-demographic variables drawn from national level datasets such as the U.S. Census or American Community Survey. For example, Lubell and coworker’s [16] analysis of sustainable cities in California found that larger cities with higher per capita tax revenues, populations with higher socioeconomic status and education levels, and, to a lesser extent, percentage of Democratic voters, correlated with a larger number of sustainability policies. Similarly, Krause [14] found that, in addition to form of governance and revenue levels, educational attainment, median income, and population size are important predictors for municipal innovation in the name of sustainability (see also Saha and Paterson [17] and Portney and Berry [12] for similar findings).
More recently, Opp and Saunders [18] performed a detailed analysis of a large group of respondents (n = 1340) to the 2010 International Community Management Association (ICMA) sustainability policy survey, finding that cities that were more engaged from a policy standpoint with sustainability tended to be larger (population-wise), more affluent, urban, and ethnically diverse. Kwon et al. [15] used the same ICMA data to test and explore the relationship between a number of demographic and social factors and climate policies in California cities, finding that (among other factors), levels of home ownership, and education have a positive influence on climate and energy oriented sustainability programs at the community level.
Studies of the characteristics of sustainable places draw interesting parallels to a longer established body of work, primarily in urban geography and planning, that seeks to classify place or community types (e.g., Weden et al. [19], Orfield [20], Schwarz [21], Hanlon [22], and Mikelbank [23]). One of the more familiar classifications that arises here is the “Edge City,” which stems from Garreu’s [24] seminal work on the subject. Socio-demographic variables, particularly race or ethnicity, affluence/poverty, level or type of employment, and population size/density again feature heavily in these studies as readily obtainable and understandable points of comparison between places. Of particular interest to this paper, multivariate cluster analyses have been introduced in a range of environmentally- and geographically-oriented social science research ranging from classifying differentiations in types of suburbs (e.g., Hanlon [22] and Mikelbank [23]) to creating typologies of community opportunity and vulnerability (e.g., Stimson et al. [25]) or municipal governance regimes (e.g., Stone [26,27]).
We argue that building a typology of sustainability communities using these same methods could yield a methodologically robust, yet simplified structure for characterizing and comparing sustainability implementation and socio-demographic variation across a broad sample of U.S. communities. Techniques such as factor and cluster analysis allow us to query a wide range of possible defining elements, and to combine those elements into a smaller number of intuitively meaningful groupings that are statistically and functionally distinct from one another. Those groupings can reveal important differences in defining elements between groups that may have otherwise been missed or misrepresented. For instance, Hanlon’s [22] typology of neighborhoods revealed significant socio-demographic variation amongst broadly defined “inner-ring suburbs” that was previously unrecognized.
We focus our attention in this paper on the relationship between sustainability implementation and social and demographic characteristics for two primary reasons. Firstly, although the list of known influences of community sustainability has expanded dramatically in recent years, socio-demographic variables continue to feature prominently as key influences and predictors in almost every study or model, providing a common ground of analysis despite the broadened focus. Broadly speaking, communities with higher levels of human capital as defined by factors such as household wealth, ethnic diversity, educational attainment, and population size are more likely to pursue innovative sustainability programs (see for example Zahran et al. [13]). There are parallels here to wider socio-institutional phenomena not reviewed in this paper, such as social capital and community adaptive capacity. Secondly, socio-demographic data are collected at fine scales for every community in the United States and can be easily matched to other datasets containing place-level data. Thus, these variables lend themselves well to the assembly of the larger-scale datasets necessary for the robust statistical comparison and cluster analysis employed in this study.
Our analysis draws from the same ICMA sustainability policy data set [28,29] used in other recent studies (see Opp and Saunders [18], Kwon [15], and Feiock at al [30]), but it employs different analytical techniques and incorporates a much larger set of socio-demographic and urban form variables drawn from the complementary streams of research on community sustainability and community/neighborhood classification reviewed above. The aim of our analysis is not to rank different places, but rather to group them meaningfully, such that the structure and connections between different mixes of socio-demographic contexts and policy outcomes are more easily distinguishable and comparable across a broad range of place types. Our typology frames a given community’s level of implementation of sustainability programs and policies within the context of socio-demographic similarity or dissimilarity to other communities. We can use the typology to identify groups or “types” of communities with different levels of social potential for implementing different sustainability programs.

2. Research Methodology

2.1. Socio-Demographic Data

Possible socio-demographic variables for analysis were identified in consultation with research into the relevant themes discussed in the opening section including: community resilience and adaptive social capacity [31,32,33,34] measures of community vulnerability [35,36], sustainability indicators [37,38,39], and previously referenced work on socio-demographic correlates of sustainable plans and policies [1,9,17,18,31] and urban form and community or neighborhood classification [19,20,21,22,23,40].
Although there is some variation by theme and discipline, these studies generally point to a common set of socio-demographic factors that mediate social, economic, and environmental conditions for communities and drive policy goals to improve quality of life. These include: measures of affluence and income equality, educational attainment, population and population density, spatial development pattern, age and family structure, ethnicity, diversity of the local economy, health, home ownership, and cost of living. In this study, our aim was to cover as comprehensively as possible all of the dimensions listed above using measures that translated well across the disciplines and research themes reviewed. See Table 1 below for the complete list and description of variables examined in this work. All socio-demographic variables included in our analysis were drawn from the 2010 U.S. Census or 2010 American Community Survey (ACS) five-year estimate at the Census Place (municipal) level. Census/ACS data were linked to the ICMA survey data using Federal Information Processing Standard (FIPS) place codes that were included in the ICMA data for each respondent. Natural log values were used for population size, population density, median income, and median house value to control for skewness (skewness > 2; kurtosis > 4; Kolmogorov-Smirnov p < 0.0001 in all cases).

2.2. Policy Data: 2010 ICMA Community Sustainability Survey

The ICMA sustainability survey was developed in a collaboration among ICMA, the Arizona State University’s Global Institute of Sustainability, and the Alliance for Innovation. The survey was sent to 8569 local government officials and 2176 responses were received [28]. For a generalized discussion of the ICMA survey responses, see Svara et al. [29]. For the purpose of this analysis, we have defined a community as a “Census Place” with designated administrative boundaries and a population greater than 2500. Limiting the data to places with population greater than 2500 as reported in the 2010 Census yields a subset of 1629 communities in 49 states (information about sample size by state is available in Table 2; Hawaii did not have any communities with complete data by these standards). As discussed in Opp and Saunders [18], the ICMA data has some limitations including self-selection bias for communities electing to respond to the survey, a somewhat small number of large, more sustainability-active respondents (16 of the 50 largest cities in the United States responded, but notable sustainability leaders such as Seattle and San Francisco in this group did not respond), and an overall response rate of only 25.4%. Despite these limitations, to our knowledge, the ICMA data represent the most comprehensive data available on community sustainability in the United States in terms of topical and geographic coverage.
The ICMA survey can be categorized roughly into questions about policy priorities and policy actions for sustainability. Priorities are measured using Likert scale scores (strength of priority on a scale of 1–4) for eight separate aspects of sustainability. Our initial analysis revealed that reported priorities generally do not match well to the predictor or action variables analyzed in this paper (which is probably due to the imprecise Likert ranking system where respondents tended to indicate every option as at least a “medium priority”) and thus are not analyzed in this paper. Policy actions are measured with tick marks for listed policies and programs grouped by themes. Reported policy actions can be internal to the local government (e.g., greening the fleet of government vehicles) or external to the government (e.g., promoting recycling in the community). See Table 1 for a more detailed summary of specific data utilized in this analysis. Reported policy actions are represented in our analysis with a policy action category score created by summing ticked policy actions under a broader theme. A listing of the policy action categories explored is also included in Table 1 along with the variables names used in analysis and notes on the composition of each.

2.3. Controlling for Response Bias and State-Level Mandates

Approximately 50% of our sample ticked 15 or fewer policy action boxes across all of the policy action categories (out of approximately 85 possible actions depending on responsibility for water policies and programs, which are not analyzed here). The mean number of reported policy actions is 18.5 (SD = 5.9, median = 16). As shown in Table 2, a state-level means comparison reveals a high degree of variation in reported actions between states ranging from a mean of 32.5 (n = 2, SD = 17.68) for Massachusetts and 32.1 (n = 158, SD = 13.56) for California to 7.3 (n = 6, SD = 5.99) for Louisiana and 9.1 (n = 7, SD = 7.22) for West Virginia.
The distribution by region appears to be non-random; southern states generally tend to report doing less, and the West Coast states generally tend to report doing more. State level regulation and fiscal support for programs covered in the ICMA survey is a likely cause of much of this geographic variation, which is particularly evident in states with higher numbers of environmental regulations such as California or Oregon [16]. The ICMA survey does not distinguish between what is voluntary action and what is mandated. Without controlling for geography, most communities in California would automatically fall into the highest sustainability action category in our analysis. Kwon et al. [15] explore the implications and origins of this effect on greenhouse gas programs using the ICMA data for respondents from California. Whereas nearly 50% of the California cities examined by Kwon et al. had established greenhouse gas emissions limits, only about 10% of cities in other states had done so.
To control for the impact of geography, and in particular state membership, we standardized reported ICMA actions using predicted scores from a linear regression model using state membership as the predictor and the sum of all reported action scores for each respondent community (SUMALLACTION) as the dependent variable. The latter provides a measure of the overall “volume” of a community’s sustainability portfolio as measured by ICMA, and this value is used in much of our analysis. We used SPSS’s Automatic Linear Modeling (ALM) feature for this procedure, which allows for categorical data to be inserted directly into the regression model without dummy coding. ALM also merges sparse categories to maximize association with the target variable: categories that are not significantly different (p-value greater than 0.05) are merged. The results of the ALM analysis are displayed below in Table 3. The adjusted R squared value is 19.7. A total of five merged categories were retained. Note that the signs for the coefficients for the merged categories generally reflect the patterns observed in Table 2. A graph of estimated mean policy action scores for each group is also provided. We also performed a stepwise regression using dummy coded state membership without merging to check compatibility with the ALM model. The results (not displayed here) were similar. R Square was 17.8% and the coefficients for individual states had the same sign as their respective groups in ALM.
The regression analysis yielded a predicted value for each state group that can be used to control for the impact of state membership on a given community’s ICMA score, such that the relative performance of a community compared to its most immediate neighbors in the state is better accounted for. Figure 1 confirms that communities in California, Massachusetts, Maine, New Hampshire, and Rhode Island generally report much higher levels of policy action than communities from Alabama, Kentucky, Louisiana, and West Virginia. We used the predicted sum policy action scores for each state group to standardize total reported actions for all ICMA respondents so that communities that report doing more relative to others in their state group score higher and vise-versa. Total reported actions for each respondent were standardized by multiplying total reported actions by the ratio of total reported actions to predicted total actions, as follows:
STATESTDSUMACTION = SUMALLACTION × (SUMALLACTION/STATEPREDICTEDVAL)
where SUMALLACTION = sum reported actions value for a given community from the ICMA survey and STATEPREDICTEDVAL = predicted sum reported actions value for a given community from the state membership regression model. We chose to take the additional step of multiplying the sum of reported actions by the ratio of reported to predict values rather than just using the ratio itself to preserve comparability between reported and predicted scores):

2.4. Analytical Approach

The primary analytical approach employed in this paper was the creation of community groupings (types) based on cluster analysis. Factor analysis was also used to reduce the number of predictor variables inserted into the cluster model. A similar approach was employed in the previously referenced work by Hanlon [22] to develop typologies of U.S. suburbs, but not within the context of sustainability policies and programs. All of the statistical analyses presented in this paper were performed in SPSS. The specific analytical steps presented and discussed in the remainder of this paper are as follows:
Step 1: Perform a Principal Components (PCA) analysis to explore socio-demographic structure and identify factors for insertion in the cluster model. An exploratory principal components analysis was performed using all socio-demographic variables listed in Table 1 to derive a clearer picture of underlying structure in the data. No ICMA policy action data were included in the PCA analysis. Factor scores were retained for use in cluster analysis.
Step 2: Create a regression model for use in standardizing ICMA scores. A Pearson correlation analysis was performed using the socio-demographic, urban form variables and policy action category scores (listed in Table 1) to create an overall assessment of the relationships between variables, and to identify variables for removal from further analysis on the basis of multi-collinearity. A linear regression was then performed (as described above) using state membership, and a sum total policy action variable to identify and control for the impact of state membership on policy engagement with sustainability. The results of the regression analysis were used to standardize total reported actions for each community.
Step 3: Build a cluster model using PCA component scores and standardized ICMA scores to produce community types. A Two Step cluster analysis was performed using cluster scores and the results are interpreted by component importance. The cluster output is further differentiated using selected socio-demographic variables identified using pearson correlation analysis.

3. Results

3.1. Principle Components Analysis

An exploratory principal components analysis (PCA) of all socio-demographic and policy action categories listed in Table 1 was performed using varimax rotation to condense the number of socio-demographic variables. The results are displayed in Table 4 below. Variable loadings have been cut off at 0.20 to make the structure easier to interpret. PCTPUBASST (percent receiving public assistance) was removed from the factor model because of poor communality (h2 = 0.341). All other variables were entered. The ratio of cases (n = 1629) to variables is greater than 50:1 so we should expect a stable estimation of components, and cross validation is not required. Components were retained with eigenvalues greater than one. An exploratory factor analysis using the same methods (not displayed here) produced approximately similar results.
A seven-component model emerges in which the components account for a combined 70.67% of the variance between the variables inserted. Each of the columns in Table 4 represents a principle component, ranked in order from left to right in terms of eigenvalue, and all displaying individual variable loadings greater than 0.20. The first component represents elements of affluence, as suggested by strong loadings from house values, professional employment, high education ratios and lack of reported disability. The affluence component is followed by components representing elements of: Hispanic ethnicity and agricultural employment; African-American ethnicity; rapid suburban growth, urban-ness (higher populations and population density) and economic stress reflected in high housing costs compared to AGI; older age, economic stress and vacant homes; and residential stability/owner occupancy. Component scores for each community were computed and saved using the SPSS regression feature, which predicts the location of each community on the component using least squared regression.

3.2. Regression and Correlation Analysis

The results of the regression analysis were presented in the preceding section. Prior to the regression analysis, a Pearson correlation matrix was produced for all variables listed in Table 1 to explore the overall structure of the data and, in particular, the relationship between socio-demographic variables and policy actions in different categories from the ICMA survey. The correlation matrix reveals strong intra-group correlations between the policy action categories listed in Table 1 (mean correlation r = 0.427, p < 0.01). The correlations between policy action categories and socio-demographic variables are weaker in all cases. This suggests that communities who report doing more in one single policy action category will also tend to report doing more across all of the policy action categories listed in Table 1. Subsequent exploratory PCA analysis (not presented here) confirms these variables represent a single factor. In short, action correlates strongly with action. These findings justify the use of a combined policy action score (SUMALLACTION) in our regression analysis, standardization efforts, and cluster models.

3.3. Cluster Analysis

The next step in our analysis was to perform a Two-Step cluster analysis using the eight components generated from the PCA analysis. Letting SPSS select an optimal cluster solution by BIC (Bayesian information criterion) scores yields a nine-cluster solution (see Table 5). The ratio of smallest to largest clusters is 6.75 (largest n = 493, smallest n = 73). Table 5 presents the cluster model of community types, grouped in order from left to right by median number of reported actions on the ICMA survey, and displaying mean component scores for the two most important PCA components for determining the cluster. Names have been added to each of the clusters. A comparison of median values for key socio-demographic predictors identified in prior research and confirmed in our correlation analysis has been provided to further differentiate the output and for use in discussing the characteristics of each named type. Median values are displayed in Table 5 for socio-demographic predictors to reduce the apparent influence of extreme values.
ANOVA of group means was also performed between the clusters and the predictor variables listed in Table 5. Bonferroni and Tukeys Hinges were employed as post hoc tests. The ANOVA reveals significant mean differences (p < 0.001) between types for all of the predictor variables in Table 5. The post hoc tests show pairwise differences and homogeneous subsets that are intuitive and consistent with the variation and similarities between types for median values displayed in Table 5. For instance, there are strongly significant pairwise differences between the Rural and/or Urban, Ethnically Diverse types and all other place types in terms of population density. Conversely, the Older, Hispanic, African American, High Growth and Smaller Towns types are not significantly different from one another in terms of population density. More detailed comparison and discussion of these differences could be taken up in a future paper.

3.4. Characteristics of Different Community Types

Identifying similarities and differences in a broad range of communities, not just sustainability leaders, is a critical component for understanding how and why sustainability happens everywhere. The results from the cluster analysis presented in Table 5 revealed nine distinct sustainable community types that were heavily influenced by socio-demographic characteristics. The difference in median number of sustainability policies and programs varied greatly from 10.5 actions to 38 by cluster. The following is a description of the nine clusters broken up into three categories: (1) communities with a large number of sustainability policies and programs, which we call the highest policy/most likely to implement; (2) communities with a medium number of sustainability policies and programs, which we call the communities more likely to expand existing sustainability programs; and (3) communities with the least number of sustainability programs, which we call communities that may need alternative programs or additional resources.

3.4.1. Highest Policy/Most Likely to Implement

This category contains the group of 168 communities that are differentiated from their peers primarily by level of effort in terms of the breadth of their sustainability policy portfolios. Consistent with the past work on sustainable communities reviewed earlier, this community type exhibits the highest median population value (note that the median population values in Table 5 reflect the census-place level of our analysis and that many of the communities in this type are located within much larger metropolitan areas). However, it is also interesting that communities in this group are not especially ethnically diverse or affluent overall. We return to a discussion of this point later in the paper. The median number of 38 reported policy actions for this type is more than twice the median for the entire sample (16), and is more than three times the value of the community type with the lowest median value for reported actions (ethnically Hispanic, rural communities, median = 10.5). This type had the lowest overall percent of owner occupied housing, indicating the possibility that these communities contain a large number of renters. A quick examination of the outputs suggests that this type consists of a small number of very large, urban communities (for example, Philadelphia, PA, USA), and a large number of college or university towns (for example, Fort Collins, CO, USA).

3.4.2. Communities More Likely to Expand Existing Sustainability Programs

Communities that fall within this category all report higher numbers of policy action than the overall median number of actions (overall median = 16) although there is a considerable range between them (17.5 to 27). Communities in this category also exhibit sharp differences on key socio-demographic measures such as population size and density, affluence, average age, and owner occupancy levels. From a human capital perspective, these communities have a greater level of “in house” potential to expand their sustainability portfolios on their own.
The Urban, Ethnically Diverse, Economically Stressed (n = 182) type represents communities with the second largest median population size (36,882), and a high median population density. These are predominantly large cities or suburbs in major metropolitan areas. For example, Fort Worth, TX and Providence, RI fall into this type. Communities in this type report far more policy actions than other types in this category (median = 27), although they are still well below the median value of the Highest Action type. Interestingly, this type also exhibits high levels of economic stress and lower levels of homeowner occupancy similar to those observed in the Highest Action type, which is partly reflective of incomes not keeping pace with housing prices in these communities. This type has a much larger Hispanic population (median value = 29.4%) than other types, and tends towards younger and larger families overall.
The Affluent, Established, Professional cluster (n = 136) seems to represent established urban/suburban areas in major metropolitan areas populated by working professionals and commuters who can afford high housing costs. Fairfax, VA and Sammamish, WA fall into this category. Education ratios are extremely high (median = 10.39 as compared with an overall median of 1.18), rates of reported disability are the lowest in our dataset (7.4% with an overall median for the dataset of 12.0%), and a higher percentage (2.1%) of residents commute via public transit than all types except for the urban, diverse type (overall median = 0.78%). The median reported sustainability actions for this community type are the third highest in our dataset at 18.
The Older, Retiree (n = 108) type is very unique. It is defined by high median age (48.1) and correspondingly small family size (2.2), which suggests communities with large proportions of older, retired individuals or couples. Property values are high, but vacancy rates are also high (median = 19.6%), which suggests areas with large numbers of second homes that may have been hit hard by the collapse of the housing bubble. Communities in this type report higher than median levels of policies (17.5 reported actions). These communities have a lower population size than the other communities in this category, with a median population of 7779. A sizeable proportion are located in sun-belt, mountain, or coastal areas, for instance, Estes Park, CO and Ocean City, NJ.

3.4.3. Communities that May Need Alternative Programs or Additional Resources

Communities that fall into this category share relatively smaller population sizes and house values, but also exhibit important variations on other key socio-demographic predictors. These community types have median reported sustainability actions that range from 10.5 to 15, all of which are below the median for the overall dataset (median = 16). Communities in this category face socio-economic challenges that may inhibit their potential to pursue sustainability expansion without additional help.
The High Growth, Suburban, Middle Class, Younger (n = 168) type contains a group of communities that are defined first and foremost by rapid, predominantly lower density, housing growth in recent years. Waconia, MN, a fast growing outer suburb of Minneapolis, is a good example of this subtype. This type has a median percent of houses built after 2005 of 12.2%, which is almost 10% higher than the overall median (2.7%), and is more than 8% higher than the next closest type (highest action communities, median = 3.5%). The median density value (1129) for this type is one of the lowest in Table 5. These communities tend to be populated by larger, younger, and more affluent families, although housing is not especially expensive. Education levels are the second highest of any type (2.03) and overall ethnic diversity appears relatively low. Communities in this type have a slightly depressed level of sustainability policy activity with a median value of 15.
The Ethnically African-American type (n = 134) represents lower density suburban areas which are defined primarily by high levels of African American ethnicity (45.6%) compared with other communities in our dataset (overall median 2.5%). New Carrolton, MD and Fairburn, GA fall within this type. Many communities in this type exhibit elevated levels of unemployment and economic hardship, lower educational attainment, and low levels of residential stability/homeowner occupancy. Median house values are the second lowest of any type ($97,200) and median levels of reported disability (16.1%) are higher than in any other community type. This type reports a median of 12 policy actions aimed at sustainability.
The Smaller Towns, Less affluent type (n = 493) is the largest grouping of communities in our dataset and represents a broad range of American small–medium cities and towns with moderate population density and lower ethnic diversity. Corning, NY and Kallispell, MT are examples of communities within this type. Median household sizes are somewhat low (2.33) and the median age is slightly high (38.3). Property values are low alongside income and education ratios, which indicates less affluence overall. The level of home ownership is also lower than in the most rural type. Although not shown in Table 5, this type has the highest percent (14.4%) of residents employed in manufacturing professions. The median number of reported sustainability policies is 12.
The Most Rural, Less Diverse, Owner Occupiers (n = 73) type represents the smallest typographic grouping in our dataset and is comprised of small towns, often located some distance from major population centers, with the lowest median population size (3936) and population density (687) in our dataset. Homer, AK is an example of a community that falls in this type. Unsurprisingly, given the rural nature of these communities, residents do not commute to work by public transit. The median age is the second highest of all of the types at 41.6 (after the retiree communities). Residents tend to be owner occupiers (78.9% as compared with the overall median of 66.0%) and homes are older with less new or recent build developments.
The Ethnically Hispanic type represents one of the smaller groupings in our dataset (n = 102), but it is also one of the more unique in terms of its extremes. Nogalez, AZ is an example of a community that falls within this type. Communities in this type exhibit the highest median levels of agricultural employment, the smallest education ratio and lowest median age, and a large median household size (2.77) suggesting that these communities are composed of young, working class families. Median house values ($95,600) are the lowest in our sample. Interestingly, although not affluent, these communities do not show especially high levels of economic stress, which probably reflects lower than average levels of unemployment and relatively affordable housing for residents. Communities in this type report the lowest median number of sustainability actions (10.5).

4. Discussion and Conclusions

The analysis presented in this paper reveals significant structural co-dependencies between socio-demographic characteristics and implementation of sustainability programs. Few studies of community sustainability have approached a sample size as large as the one employed here, with the notable exception of Opp and Saunders [18], which employs the same policy dataset. Other relevant comparisons can be found in classifications of urban-suburban place types, which employ similar socio-demographic variables and derive similar factors, but which do not engage directly with sustainability [20,22,23,41]. Our work extends these and other earlier analyses into a meaningful matchup of community characteristics and sustainability plans and policies that controls for the effects of state level policy mandates. Our cluster model identifies unique groupings of key characteristics that have otherwise been blended together in prior regression-based analyses of community sustainability.
Looking across all of the types in Table 5, from the Highest Action type on the left-hand-side to the lowest action type on the right (Ethnically Hispanic) it would appear that larger and denser (population-wise), more affluent (higher home values and education levels), and more ethnically diverse communities tend to fall within the four types of communities that reported above-median-level actions on the ICMA survey. This is generally consistent with the literature reviewed earlier in the paper [14,15,18]. However, our cluster analysis also reveals a number of interesting, and occasionally unexpected, socio-demographic variations between community types. Perhaps chief among these is that, apart from a high median population size driven by the presence of some of the largest respondents to the ICMA survey, our Highest Action type actually looks fairly “average” on most other key socio-demographic characteristics, thereby bucking some of the trends associated with high performing cities from prior studies. This finding underscores the difficulty of predicting which specific communities will step up to become effective outliers compared to their peers in sustainability implementation. The communities in the Highest Action type are a hodgepodge of larger-than-average communities that have otherwise differentiated themselves primarily by level of policy effort. Instead, our results suggest that efforts to predict sustainability implementation using socio-demographic variables may be better served by focusing on communities with less exceptional, but still elevated, levels of sustainability implementation. For instance, our Urban, Ethnically Diverse type, which exhibits a respectable 27 median policy actions, represents a close match to many of the characteristics of high performing communities identified in prior studies, particularly in terms of elevated median population size, levels of ethnic diversity, and house values.
It is of course probable that a social or attitudinal variable not analyzed here, such as civic participation, or voting patterns, could account for a large portion of the variance in median number of policy actions between the Highest Action and other types (as has been found in prior studies using smaller datasets [12,18]). For this analysis, we chose to focus on a set of easily comparable sociodemographic predictors for which there is broad data coverage that matches the breadth and scale of the ICMA policy data. An in-depth, qualitative examination of how sustainability is problematized and implemented in each place type could also yield even more meaningful, “real world” distinctions between types in all categories, especially where information not captured in our datasets is pertinent to differentiation, or where the statistically-derived groupings just do not make sense for a specific case. This hybrid classification strategy has been employed elsewhere with success [42], and a further extension of this research is heading in a similar direction.
In the meantime, our analysis offers a helpful new perspective on the linkages between familiar characteristics of people and place and policy outputs for sustainability. Evidence for the importance of traits like higher home values, educational attainment, ethnic diversity, and population size/density can be found throughout the groupings in Table 5, but our analysis also suggests that these traits manifest in scattered and/or more nuanced ways that reflect the social and economic diversity of communities across the United States. The use of the term “scattered” is important because our findings do not suggest the presence of a gradient of sustainability implementation based on these characteristics (gradual, consistent changes in key values across consecutive levels of policy implementation) but rather unique combinations of elevated or reduced key characteristics that both help to define places, and contribute in unique ways to greater (or lesser) implementation of sustainability programs in those places. For example, the component we have termed “affluence,” represented in our study as a combination of things like high median house values, levels of professional employment, and educational attainment (see Table 4), strongly defines our third-highest sustainability implementation type (Affluent, Established, Professional) and is also somewhat evident in the high house values in our second highest implementation type (Urban, Ethnically Diverse). However, the affluence component is not strongly represented in the Highest Action type, and both the Highest Action and Urban, Ethnically Diverse types exhibit high levels of housing cost burden that are not overly characteristic of affluent communities. Larger relative population sizes could help push communities in these groups towards higher policy implementation despite some level of economic hardship for residents.
The scattered nature of key traits also holds true at the lower end of the sustainability implementation spectrum. With the exception of the Older, Retiree type that also exhibits a low median population value, the five community types with the lowest number of sustainability policies and programs (those in the Communities That May Need Alternative Programs or Additional Resources category in Table 5) exhibit the lowest median population values in our sample. Smaller population size has long been recognized as a limitation on the administrative capacity (in terms of things like available staff and funds for operations) of a community for pursuing sustainability [14}. However, when combined within our PCA and cluster analyses, a more complete picture of the relationship between sustainability policy, population size and density, and social and economic challenges emerges. The more rural, less diverse community types (Smaller Towns and Most Rural) may simply have less political drive and/or capacity for pursuing sustainability, whereas in Ethnically Hispanic and Ethnically African American communities the economic and social pillars of the sustainability policy portfolio (such as policies to facilitate affordable housing and home ownership) may be especially underrepresented given the depressed economic conditions [9,43]. Communities that fall within any of the groupings in this category may need alternative or additional (exogenous) resources to enable sufficient civic capacity for sustainability policy and program development.
On the other hand, communities that fall within one of the three types that make up our Communities More Likely to Expand Existing Sustainability Programs category represent places with higher levels of “in house” human/civic capital, and thus greater potential for doing more relative to others. While our typology shows that these types do not currently represent the very top of the sustainability implementation scale, from a human capital perspective, they represent the place types where increased “movement towards sustainability” (see Saha and Paterson [17]) is arguably more probable and predictable based on the characteristics examined in this study. The differentiation of key traits in our typology offers some clues as to how increased implementation might happen or be facilitated within each. For instance, the Older, Retirees type contains communities with higher-than-average property tax revenue per-capita due to second home ownership, as well as large numbers of retired professionals with the intellectual capital and social network connections to foster innovative initiatives. Many of the communities that fall into this type also have strong ties to the natural landscape due to location on coasts or in mountain areas with associated tourism-based economies. Targeted funding for volunteer-based programs oriented toward improving and promoting environmental quality as a brand selling point would probably make sense to both full time residents and second home owners, and could significantly expand the range of sustainability activities and programs in these areas. Future extensions of this research could develop tailored implementation pathways for each of the four types in this category that play to their social strengths, and their ability or willingness to integrate the three pillars of sustainability into their sustainability programs (see Saha and Paterson [17] on this latter point). Our typology could be used as generalized roadmap for these efforts, and as a tool for identifying key focal groups for specific regions.
It is important to emphasize before closing that the implementation of sustainability programs and/or the adoption of sustainability policies does not necessarily equate to desirable sustainability outcomes such as a better quality of life for residents or a cleaner environment. The efficacy of the individual policies and programs reported on the ICMA survey are not investigated here, and we do not claim that a large number of reported policies or programs is a prerequisite for true sustainability. Our typology is meant as a guide to understanding the range of sustainability implementation in the United States, and the impact of socio-demographic structure on local level sustainability efforts. Whereas it appears difficult to predict which specific communities will step up to become leaders in implementing sustainability policy, the communities in our Communities More Likely to Expand Existing Sustainability programs category represent places where above average movement towards sustainability policy and programs is already happening, and where increased movement is more feasible and probable. Uncovering and understanding these community types on the basis of socio-demographic traits helps to elucidate the complex structure of sustainability at a local level and provides some new insights for promoting effective sustainability expansion in different places.

Acknowledgments

The authors would like to thank participants from two separate feedback sessions held at the 2015 American Planning Association Conference held in Seattle, Washington and the 2015 Smart Growth Conference held in Baltimore, Maryland for their valuable advice on the typology development. We also appreciate Daniel Vallero for his constructive review of this work. We are grateful to the two anonymous reviewers for their helpful feedback on this work.

Author Contributions

Both authors contributed equally to this manuscript and approved the final version.

Conflicts of Interest

The authors declare no conflict of interest.

References

  1. Portney, K.E. Taking Sustainable Cities Seriously: Economic Development, the Environment, and Quality of Life in American Cities; MIT Press: Cambridge, MA, USA, 2003. [Google Scholar]
  2. Campbell, S. Green cities, growing cities, just cities? Urban planning and the contradictions of sustainable development. J. Am. Plan. Assoc. 1996, 62, 296–312. [Google Scholar]
  3. Mazmanian, D.A.; Kraft, M.E. (Eds.) Toward Sustainable Communities: Transition and Transformations in Environmental Policy; MIT Press: Cambridge, MA, USA, 2009.
  4. Wheeler, S.; Beatley, T. The Sustainable Urban Development Reader; Routledge Press: New York, NY, USA, 2009. [Google Scholar]
  5. Bulkeley, H.; Betsill, M.M. Cities and Climate Change: Urban Sustainability and Global Environmental Governance; Routledge: London, UK, 2003. [Google Scholar]
  6. Breheny, M.J. Sustainable Development and Urban Form; Pion: London, UK, 1992. [Google Scholar]
  7. Feiock, R.; Bae, J. Politics, institutions and entrepreneurship: City Decisions Leading to Inventoried GHG Emissions. Carbon Manag. 2011, 2, 443–453. [Google Scholar] [CrossRef]
  8. Sharp, E.B.; Daley, D.M.; Lynch, M.S. Understanding local adoption and implementation of climate change mitigation policy. Urban Aff. Rev. 2010. [Google Scholar] [CrossRef]
  9. Saha, D. Empirical research on local government sustainability efforts in the USA: Gaps in the Current Literature. Local Environ. 2009, 14, 17–30. [Google Scholar] [CrossRef]
  10. Littig, B.; Griessler, E. Social sustainability: A Catchword between Political Pragmatism and Social Theory. Int. J. Sustain. Dev. 2005, 8, 65–79. [Google Scholar] [CrossRef]
  11. Warner, K. Linking local sustainability initiatives with environmental justice. Local Environ. 2002, 7, 35–47. [Google Scholar] [CrossRef]
  12. Portney, K.E.; Berry, J.M. Participation and the pursuit of sustainability in U.S. cities. Urban Aff. Rev. 2010, 46, 119–139. [Google Scholar] [CrossRef]
  13. Zahran, S.; Brody, S.D.; Vedlitz, A.; Grover, H.; Miller, C. Vulnerability and capacity: Explaining Local Commitment to Climate-Change Policy. Environ. Plan. C Gov. Policy 2008, 26, 544–562. [Google Scholar] [CrossRef]
  14. Krause, R.M. Policy innovation, intergovernmental relations, and the adoption of climate protection initiatives by US cities. J. Urban Aff. 2011, 33, 45–60. [Google Scholar] [CrossRef]
  15. Kwon, M.; Jang, H.S.; Feiock, R.C. Climate protection and energy sustainability policy in California cities: What Have We Learned? J. Urban Aff. 2014, 36, 905–924. [Google Scholar] [CrossRef]
  16. Lubell, M.; Feiock, R.; Handy, S. City adoption of environmentally sustainable policies in California’s Central Valley. J. Am. Plan. Assoc. 2009, 75, 293–307. [Google Scholar] [CrossRef]
  17. Saha, D.; Paterson, R.G. Local government efforts to promote the “Three Es” of sustainable development survey in medium to large cities in the United States. J. Plan. Educ. Res. 2008, 28, 21–37. [Google Scholar] [CrossRef]
  18. Opp, S.M.; Saunders, K.L. Pillar talk: Local Sustainability Initiatives and Policies in the United States—Finding Evidence of the “three E’s”: Economic Development, Environmental Protection, and Social Equity. Urban Aff. Rev. 2013. [Google Scholar] [CrossRef]
  19. Weden, M.M.; Bird, C.E.; Escarce, J.J.; Lurie, N. Neighborhood archetypes for population health research: Is there no Place like Home? Health Place 2011, 17, 289–299. [Google Scholar] [CrossRef] [PubMed]
  20. Orfield, M. American Metropolitics.: The New Suburban Reality; Brookings Institution Press: Washington, DC, USA, 2011. [Google Scholar]
  21. Schwarz, N. Urban form revisited—Selecting indicators for characterising European cities. Landsc. Urban Plan. 2010, 96, 29–47. [Google Scholar] [CrossRef]
  22. Hanlon, B. A Typology of Inner—Ring Suburbs: Class, Race, and Ethnicity in US Suburbia. City Commun. 2009, 8, 221–246. [Google Scholar] [CrossRef]
  23. Mikelbank, B.A. A Typology of US Suburban places. Hous. Policy Debate 2004, 15, 935–964. [Google Scholar] [CrossRef]
  24. Garreau, J. Edge City: Life on the New Frontier; Anchor Books: New York, NY, USA, 1991. [Google Scholar]
  25. Stimson, R.; Baum, S.; Mullins, P.; O’Connor, K. A typology of community opportunity and vulnerability in metropolitan Australia. Papers Reg. Sci. 2001, 80, 45–66. [Google Scholar] [CrossRef]
  26. Stone, C.N. Regime Politics: Governing Atlanta 1946–1988; University Press of Kansas: Lawrence, KS, USA, 1989. [Google Scholar]
  27. Stone, C.N. Urban regimes and the capacity to govern. J. Urban Aff. 1993, 15, 1–28. [Google Scholar] [CrossRef]
  28. ICMA (International City/County Management Association). Local Government Sustainability Policies and Programs, 2010; International City/County Management Association: Washington, DC, USA, 2010. [Google Scholar]
  29. Svara, J.H.; Watt, T.C.; Jang, H.S. How Are US Cities doing sustainability? Who is getting on the sustainability train, and why? Cityscape 2013, 15, 9–44. [Google Scholar]
  30. Feiock, R.; Krause, R.; Hawkins, C. The Integrated City Sustainability Database, Urban Aff. Rev. 2014, 50, 577–589. [Google Scholar]
  31. Wang, X.; Hawkins, C.V.; Lebredo, N.; Berman, E.M. Capacity to sustain sustainability: A Study of US Cities. Public Adm. Rev. 2012, 72, 841–853. [Google Scholar] [CrossRef]
  32. Tobin, G.A. Sustainability and community resilience: The Holy Grail of Hazards Planning? Global Environ. Change Part B Environ. Hazards 1999, 1, 13–25. [Google Scholar] [CrossRef]
  33. Brooks, N.; Adger, N.W.; Kelly, M.P. The determinants of vulnerability and adaptive capacity at the national level and the implications for adaptation. Global Environ. Change 2005, 15, 151–163. [Google Scholar] [CrossRef]
  34. Brody, S.D.; Highfield, W.; Carrasco, V. Measuring the collective planning capabilities of local jurisdictions to manage ecological systems in southern Florida. Landsc. Urban Plan. 2004, 69, 33–50. [Google Scholar] [CrossRef]
  35. DeFur, P.L.; Evans, G.W.; Hubal, E.A.C.; Kyle, A.D.; Morello-Frosch, R.A.; Williams, D.R. Vulnerability as a function of individual and group resources in cumulative risk assessment. Environ. Health Perspect. 2007, 115, 817–824. [Google Scholar] [CrossRef] [PubMed]
  36. Downing, T.E.; Butterfield, R.; Cohen, S.; Huq, S.; Moss, R.; Rahman, A.; Stephen, L. Vulnerability Indices: Climate Change Impacts and Adaptation; UNEP Policy Series; UNEP: Nairobi, Kenya, 2001. [Google Scholar]
  37. Gallagher, J.E.; Hubal, E.C.; Jackson, L.; Inmon, J.; Hudgens, E.; Williams, A.H.; Wade, T. Sustainability, Health and Environmental Metrics: Impact on Ranking and Associations with Socioeconomic Measures for 50 US Cities. Sustainability 2013, 5, 789–804. [Google Scholar] [CrossRef]
  38. Bell, S.; Morse, S. Sustainability Indicators: Measuring the Immeasurable? Earthscan: London, UK, 2008. [Google Scholar]
  39. Innes, J.; Booher, D.E. Indicators for sustainable communities: A strategy Building on Complexity Theory and Distributed Intelligence. Plan. Theory Practice 2000, 1, 173–186. [Google Scholar]
  40. Ewing, R.; Pendall, R.; Chen, D. Measuring sprawl and its transportation impacts. Transp. Res. Rec. J. Transp. Res. Board 2003, 1831, 175–183. [Google Scholar] [CrossRef]
  41. Hanlon, B.; Vicino, T.; Short, J.R. The new metropolitan reality in the US: Rethinking the Traditional Model. Urban Stud. 2006, 43, 2129–2143. [Google Scholar] [CrossRef]
  42. California OPR. Strategies for Sustainable Communities: A Guidebook on California Community Types. State of California; Governor’s Office of Planning and Research: Sacramento, CA, USA, 2010. Available online: http://opr.ca.gov/docs/StrategiesforSustainableCommunities.pdf (accessed on 17 February 2016).
  43. Littig, B.; Griessler, E. Social sustainability: A Catchword between Political Pragmatism and Social Theory. Int. J. Sustain. Dev. 2005, 8, 65–79. [Google Scholar] [CrossRef]
Figure 1. Estimated Policy Action Means for State Groupings.
Sustainability 08 00182 g001
Table 1. Variables and data sources examined in this research.
Variable NameDescriptionData Source
Sustainable Policies and Programs (Action Category Scores)
SUMALLACTIONSum of all individual policy action category scores to provide “volume” of a community’s sustainability portfolio2010 ICMA
SUMENERGYInternal energy conservation (e.g., installing LEDs in govt buildings)2010 ICMA
SUMENVPROGEnvironmental programs and actions (mostly related to greenhouse gases; includes air quality and tree planting)2010 ICMA
SUMLANDPOLLand use and development policies (e.g., design standards, zoning codes)2010 ICMA
SUMLANDPROGLand use programs (e.g., brownfield development grants)2010 ICMA
SUMOTHERMiscellaneous reported actions 2010 ICMA
SUMRECYCLERecycling programs2010 ICMA
SUMSOCINCSocial inclusion programs (e.g., affordable housing)2010 ICMA
SUMSUSPLANPOLSustainable planning policy and institutional support (e.g., dedicated staff, plans, policy goals)2010 ICMA
SUMTRANSTransport programs (e.g., bike lanes, bus system)2010 ICMA
Socio-Demographic and Urban Form
AVEHHSIZEMedian household size2010 Census
EDUCRATIORatio of % adults >25 years with Bachelor’s degree or higher vs. adults >25 years with less than high school education2010 ACS 5 years
GINIGini coefficient of income equality2010 ACS 5 years
MEDAGEMedian age2010 Census
MEDHSEVALMedian house value (Natural log)2010 ACS 5 years
MEDINCOMEMedian income (Natural log)2010 ACS 5 years
OWNEROCC% Houses owner occupied2010 ACS 5 years
PCTAGFOR% Residents agriculture, forestry, mining, fishing employment2010 ACS 5 years
PCTBLACK% African American Ethnicity2010 Census
PCTBUILTAFT2005% Houses built after 20052010 ACS 5 years
PCTCOMMPUBTRANS% Residents commute to work by public transport2010 Census
PCTDISABLE% Indicating disability2010 ACS 5 years
PCTENGLISH% Population 5 and over speaking only English2010 ACS 5 years
PCTHISPANIC% Hispanic Ethnicity2010 Census
PCTHSECOST35% Households (renters and mortgage holders) with monthly ownership costs >35% of AGICalculated from 2010 ACS 5 years
PCTMANUF% Residents manufacturing employment2010 ACS 5 years
PCTNOINSURE% Without health insurance2010 ACS 5 years
PCTPOV% Families below Federal poverty line2010 ACS 5 years
PCTPROFF% Residents professional employment2010 ACS 5 years
PCTPUBASST% Households receiving public assistance (i.e., SNAP)2010 ACS 5 years
PCTRURAL% Area classified as Rural2010 Census
PCTUNEMP% Unemployed2010 ACS 5 years
PCTVACANT% Houses Vacant2010 ACS 5 years
PCTWHITE% White2010 Census
POPTotal population (Natural log)2010 Census
POPDENPopulation density/sq mile (Natural log)2010 Census
STABILITYRatio of households who lived in the same house or moved within the same county 1 year ago vs. new residentsCalculated from 2010 ACS 5 years
Table 2. Sample sizes and unstandardized mean reported actions by state.
STATENMeanMinMaxStDevSTATENMeanMinMaxStDev
AK815.7563811.34MT1016.0014313.91
AL2110.570237.27NC5320.5325012.86
AR722.7184116.52ND320.33123512.74
AZ3121.3535013.37NE2016.704388.70
CA15832.0516413.56NH530.8094416.90
CO2924.8326015.08NJ2420.7904010.23
CT522.0054617.22NM1420.0754010.62
DE412.506185.20NV1121.4566115.03
FL8019.7304910.78NY3914.2604410.34
GA5114.941429.76OH7114.580348.41
HINo complete dataOK3212.090299.46
IA5017.900479.56OR4421.0705213.64
ID914.6723310.93PA6214.500469.42
IL11815.6205410.59RI330.33184614.29
IN2216.2713911.19SC2016.802359.22
KS3713.730389.39SD613.173278.95
KY1910.471327.80TN2114.570399.70
LA67.330165.99TX11415.2506211.00
MA232.50204517.68UT2616.6234610.12
MD1417.504337.35VA3519.8935913.97
ME530.4023458.44VT226.00153715.56
MI8716.9906211.20WA4621.2035213.05
MN6619.5505710.79WI5421.0215311.29
MO5512.930438.92WV79.140207.22
MS1311.692288.06WY1015.6014913.95
Total162918.5406412.35
Table 3. Regression outputs.
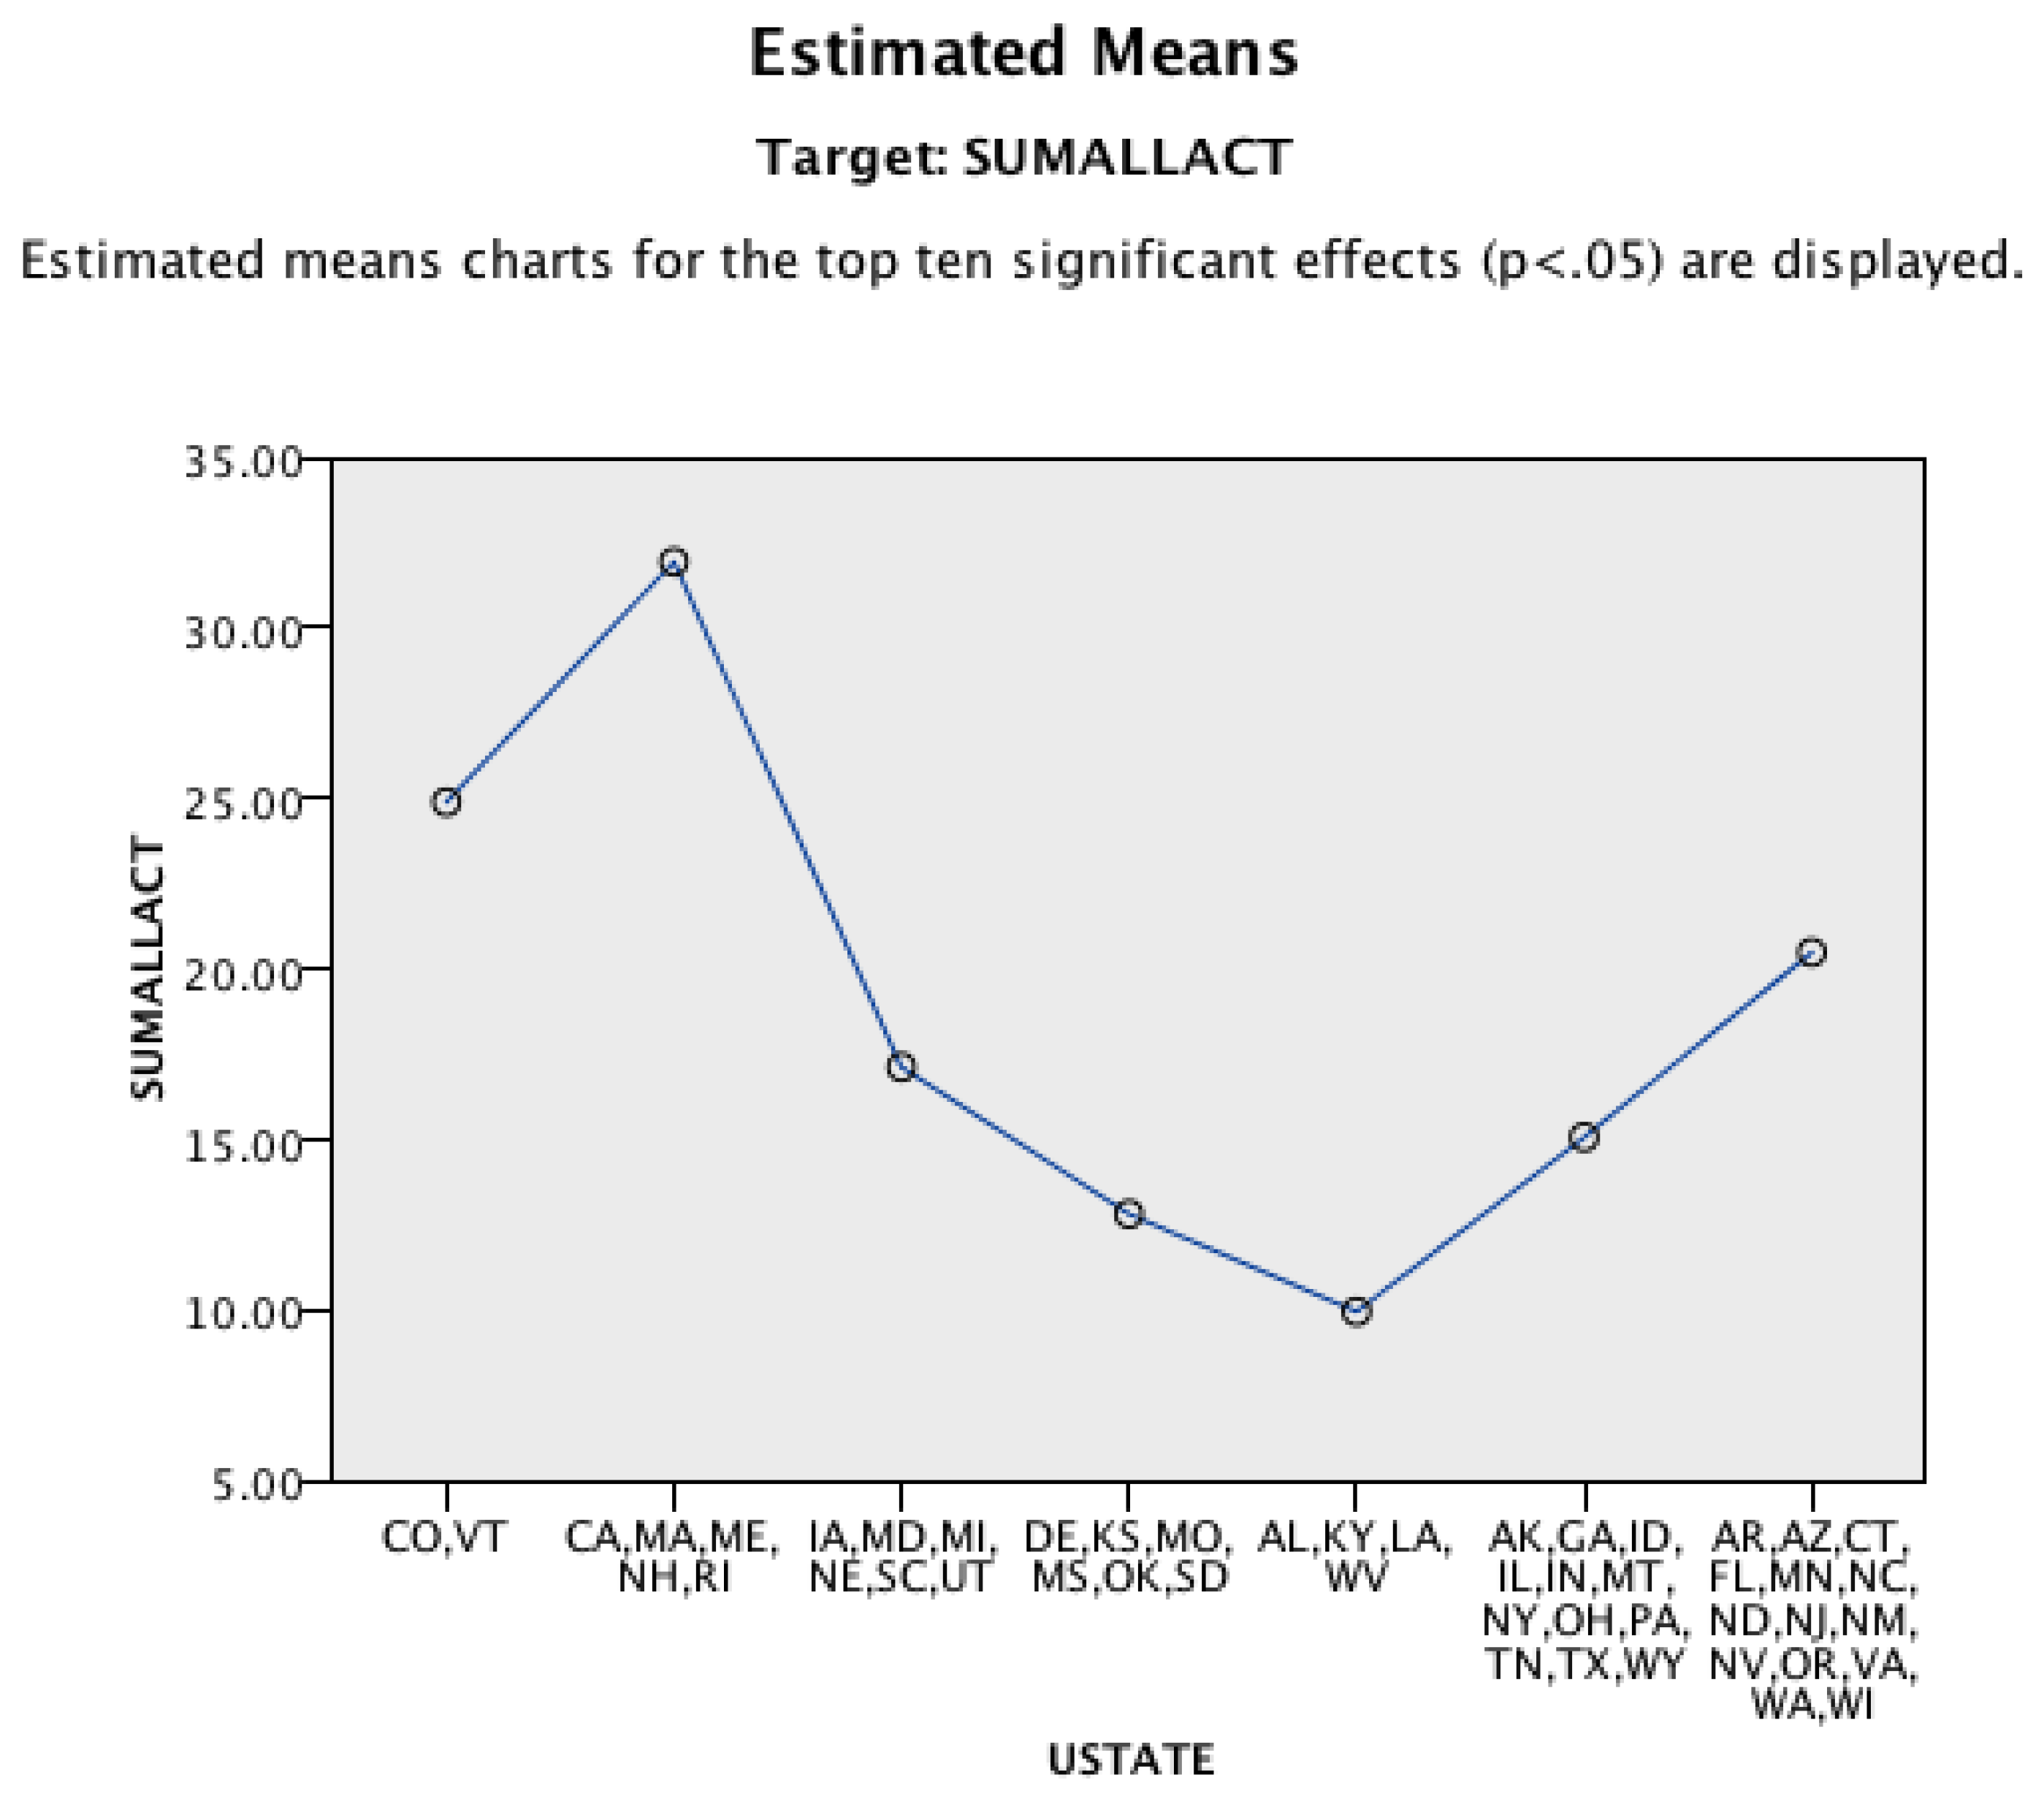
Automatic Linear Modeling Output
CoefficientSEtSig
Intercept20.5010.50940.269<0.001
STATE0 CO, VT4.4022.0532.1450.032
STATE1 CA, MA, ME, NH, RI11.4410.98411.63<0.001
STATE2 IA, MD, MI, NE, SC, UT−3.3580.908−3.699<0.001
STATE3 DE, KS, MO, MS, OK, SD−7.6641.046−7.33<0.001
STATE4 AL, KY, LA, WV−10.521.604−6.559<0.001
STATE5 (all remaining)−5.4130.669−7.746<0.001
Table 4. Principal Components Analysis (PCA) output.
Rotated Component Matrix a
Component
AFFLUENTHISPANICAF AMERSUBURBAN GROWTHURBAN, ECON STRESSOLDER 2ND HOMESTABLE OWN OCC
ntlogMEDINCOME0.887
natlogPOP0.286 0.278 0.489 −0.272
natlogPOPDENS0.243 −0.2700.767
PCTCOMMPUBTRAN0.459 0.332−0.2580.285
PCTPOPCHANGE 0.878
PCTRURAL −0.759
PCTBUILT2005 0.895
PCTVACANT−0.208 0.733
STABILITY 0.759
natlogMEDHSEVALUE0.821 0.245
PCTPROFF0.801
PCTOWNOCC0.408 −0.3410.248−0.323 0.443
EDUCR250.708
PCTPOV−0.6570.2500.449
PCTHSECOST35 0.2460.376 0.3850.4660.313
GINI 0.223−0.322 0.598−0.317
PCTNOINSURE−0.3820.6530.285 0.231
PCTDISABLE−0.712 −0.215 0.369
PCTAGFOR 0.650 −0.353
PCTMANUF−0.355−0.208 −0.500
PCTUNEMP−0.362 0.539 0.215
MEDAGE −0.381−0.323−0.227 0.5250.347
AVEHHSIZE 0.658 0.325 −0.392
PCTWHITE −0.322−0.863
PCTBLACK 0.899
PCTHISPANIC 0.919
PCTENGLISH −0.870 −0.251
Extraction Method: Principal Component Analysis; Rotation Method: Varimax with Kaiser Normalization. a Rotation converged in 7 iterations.
Table 5. Cluster model (community sustainability types) output.*
Highest Policy/Most Likely to Implement to ImplementCommunities More Likely to Expand Existing Sustainability ProgramsCommunities That May Need Alternative Programs or Additional Resources
TypesHighest Action, Innovators, Large CitiesUrban, Ethnically Diverse, Economically StressedAffluent, Established, ProfessionalOlder, RetireesHigh Growth Suburban, Middle-Class, YoungerEthnically African AmericanSmaller Towns, Less AffluentMost Rural, Less Diverse, Owner OccupiersEthnically HispanicOverall
Cluster Size/% of total sample168/10.3%182/11.2%136/8.3%108/6.6%168/10.3%134/8.2%493/30.3%73/4.5%102/6.3%1564
Most important PCA inputs for cluster (mean score)StandardizedSumaction (84.80)Urban Econ Stress (0,90)Affluence (1.87)Older, Second Home (2.35)Suburban Growth (1.68)African American Ethnicity (2.35)Affluence (−0.64)Urban, Econ Stress (−1.89)Hispanic Ethnicity (2.31)
Urban Econ Stress (0.62)Hispanic Ethnicity (1.00)Hispanic Ethnicity (−0.35)African American Ethnicity (−0.67)Older, Second Home (−0.55)Hispanic Ethnicity (−0.35)African American Ethnicity (−0.50)Residential Stability (1.72)Affluence (−0.59)
Population Size5278036882143527779135541183373103936716011097
Population Density237335882355115211291281150868713441685
Education Ratio1.781.1510.391.742.030.560.960.940.381.18
House Value1815503339503642502737001942509720011750015120095650161400
Income45140607059092846116652853196741913503583911348025
Median Age35.535.240.148.133.934.938.341.633.036.9
% African American5.754.52.51.153.3545.61.40.91.02.5
% Hispanic8.229.43.76.76.65.03.53.045.96.2
% Commute w/Public Transport1.73.22.10.60.51.10.40.00.10.8
% Owner Occupied58.264.177.867.878.954.865.178.864.366.0
Median Number of Actions (standardized)38271817.51512121110.516
Model Summary: Algorithm: Two Step (Distance measure: Log Likelihood); Inputs: 8; Clusters: 9; Average Silhouette: 0.3. Cluster Selection: Shwarz’s Bayesian Criterion (BIC); Criteria: Initial Threshold (0), Max Branch (8); Max level (3).* Cluster types are grouped in order from left to right by the standardized median number of sustainability actions per type. The categorical groupings (first row) in the table reflect cut points in median standardized policy values. Specifically: the highest median value (Highest Policy/Program Action/Most Likely to Implement), above the median, but not highest (More Likely to Expand) and those below the median (Alternative Programs/Additional Resources). There are significant pairwise differences in number of reported policy actions between types (Mann-Whitney U) consistent with this structure (most notably between Highest Action and all others), but the categories presented in the first row of thse table should be interpreted qualitatively.

