Article

A Multi-Objective Input–Output Linear Model for Water Supply, Economic Growth and Environmental Planning in Resource-Based Cities

1
School of Humanities and Economic Management, China University of Geosciences, Beijing 100083, China
2
Key Laboratory of Carrying Capacity Assessment for Resource and Environment, Ministry of Land and Resource, Beijing 100083, China
3
Institute of Economic and Trade, Shijiazhuang University of Economics, Shijiazhuang 050031, China
4
Department of Finance and Accounting, Yango College, Fuzhou 350015, China
*
Authors to whom correspondence should be addressed.
Sustainability 2016, 8(2), 160; https://doi.org/10.3390/su8020160
Submission received: 11 October 2015 / Accepted: 2 February 2016 / Published: 6 February 2016

Abstract

:
Water resource and environment capacity have become two of the most important restrictions for sustainable development in resource-based cities whose leading industries are the exploitation and processing of resources. Taking Ordos in China as an example, this article constructs an integrated model combining a multi-objective optimization model with input–output analysis to achieve the tradeoffs between economic growth, water utilization and environmental protection. This dynamic model includes socioeconomic, water supply–demand, water quality control, air quality control, energy consumption control and integrated policy sub-models. These six sub-models interact with each other. After simulation, this article proposes efficient solutions on industrial restructuring by maximizing the Gross Regional Product of Ordos from 394.3 in 2012 to 785.1 billion RMB in 2025 with a growth rate of 6.4% annually; and presents a water supply plan by maximizing the proportion of reclaimed water from 2% to 6.3% through sewage treatment technology selection and introduction, and effective water allocation. Meanwhile, the environmental impacts are all in line with the planning targets. This study illustrates that the integrated modeling is generic and can be applied to any region suffering uncoordinated development issues and can serve as a pre-evaluation approach for conducting early warning research to offer suggestions for government decision-making.

1. Introduction

With the continuous development of socioeconomics, water resource and environment capacity [1] have become the most important constraints for sustainable development in many regions [2], especially in Chinese resource-based cities whose leading industries are the exploitation and processing of local natural resources [3]. In China, most of the resource-based cities are located in semi-arid or arid regions [4] that suffer from water scarcity. In addition, under the current process of national development, resource-based cities should give priority to developing the resource and energy industry so as to meet national energy demands, which will aggravate burdens on water utilization, pollutant reduction and energy conservation. The contradictions among sustainable socioeconomics, water resource and environment protection are particularly difficult.
In this article, we take Ordos as a case study. Ordos, located in the southwest of Inner Mongolia, is China’s key energy and chemical base, and its resource industries occupied more than 60% of total output. Tracing back from 2001, Ordos has experienced Gross Domestic Product (GDP) growth rates of 33.4% annually [5]. However, after 2010, the falling price of coal and the urgent requirement of energy saving and emissions reduction have confronted Ordos with new opportunities and the industrial structure needs to be transformed and upgraded urgently. Meanwhile, the economic development in Ordos is restricted by water resources and ecological environmental capacity. According to Water Resource Bulletin, in 2012, the ratio of sewage treatment was 71%, the reuse rate of reclaimed water was 57% and the removal rate of water pollutants was only 26%. According to the current industrial structure and water utilization strategy, the water deficit will reach 809 million cubic meters in 2020 [6]. Water resources cannot guarantee the sustainable development of socioeconomics in Ordos. Moreover, the intensity of energy consumption is 2.1 times the national average and atmospheric pollutants emissions are beyond the limited standards of Inner Mongolia [7]. Accordingly, Ordos municipal government has drawn specific planning goals on socioeconomics development, water utilization, energy conservation and pollutants reduction. Therefore, how to achieve the tradeoffs between economic growth, water utilization and environmental protection in resource-based cities is a very significant task that needs to be addressed.
Regarding the sustainable development of resource-based cities, the corresponding impact of industrial development on water utilization, energy consumption and pollutants emissions should be taken into consideration. In the area of macroeconomics, the input–output (IO) model can describe the economic transactions between final consumers and productive sectors in a region [8,9,10,11]. One of the main advantages of the input–output model is that, in addition to revealing the macroeconomic structure of an economy, it can assess the environmental impacts by using “pollution or consumption intensity” vectors associated with the production level, which is a very suitable method for conducting environmental assessment [12]. IO model has been applied to the study of the environmental influences of industrial development, including the assessment of greenhouse gas emission related to resource sectors in a specific region [13]; the evaluation of water pollution during the process of resource exploitation [14]; and the assessment of energy consumption and environmental pollution discharge according to regional economic growth [15,16,17]. These studies provide valuable quantitative information on the anthropogenic environmental loads of economic activities; however, the resource and environmental capacity cannot serve as restrictions if they affect industrial transformation and upgrading. Furthermore, the results of these studies, being only static evaluations, offer no exercisable suggestions on how to reduce environmental pressures.
A possible manner to overcome such limitation is coupling IO model with linear programming model. Linear programming model is a useful approach for comprehensive decision making since it can help identify the efficient strategy to control the environmental impact related to different economic activities. Linear programming models have already been mixed with input–output analysis for solving environmental problems [18]. A large body of literature has set one single objective to mitigate environmental pressure, such as minimizing greenhouse gas (GHG) emissions through specific policy [19], minimizing water pollution through waste management [20,21], or maximizing the reclaimed water utilization with a given set of alternative engineering technologies [22,23]. Other studies have combined IO model with multi-objective linear programing to simultaneously realize economy-energy-environment-social tradeoffs [24]. This latter approach has been applied to optimize the water supply plan concerning water supply maximization, cost minimization and environmental hazards minimization [25]; optimizing future electricity supply by minimizing system costs and global warming potential [26]; and optimizing the total economic output and the GHG emissions related to energy consumption [27,28]. The literature above combines relationships between multiple objectives to finally come up with detailed exercisable suggestions. However, the target areas of previous research have mainly been developed regions. There are few works that focus on resource-based cities, and the created models do not reflect the characteristics of resource-based cities.
According to the actual situation, the study of sustainable development of resource-based cities should not only consider the water supply capacity, but also ensure that the local economic activities do not exceed the scope of the local environment’s capacity. Therefore, this paper presents an integrated approach combining the multi-objective linear programming model with IO model. The use of IO model with “pollution or consumption intensity” vectors allows identifying specific social and economic activities that are responsible for the overall environmental impacts, including water and energy consumption, and air and water pollution. A multi-objective linear programming model can endogenously put forward the efficient solution for industrial restructuring by maximizing the economic output within the constraints of specific energy conservation and emission reduction goals, and present an exercisable water resource recycling plan by maximizing local water supply through sewage treatment technology selection, introduction, and installation and water allocation.
The structure of the remainder of this paper is as follows. 
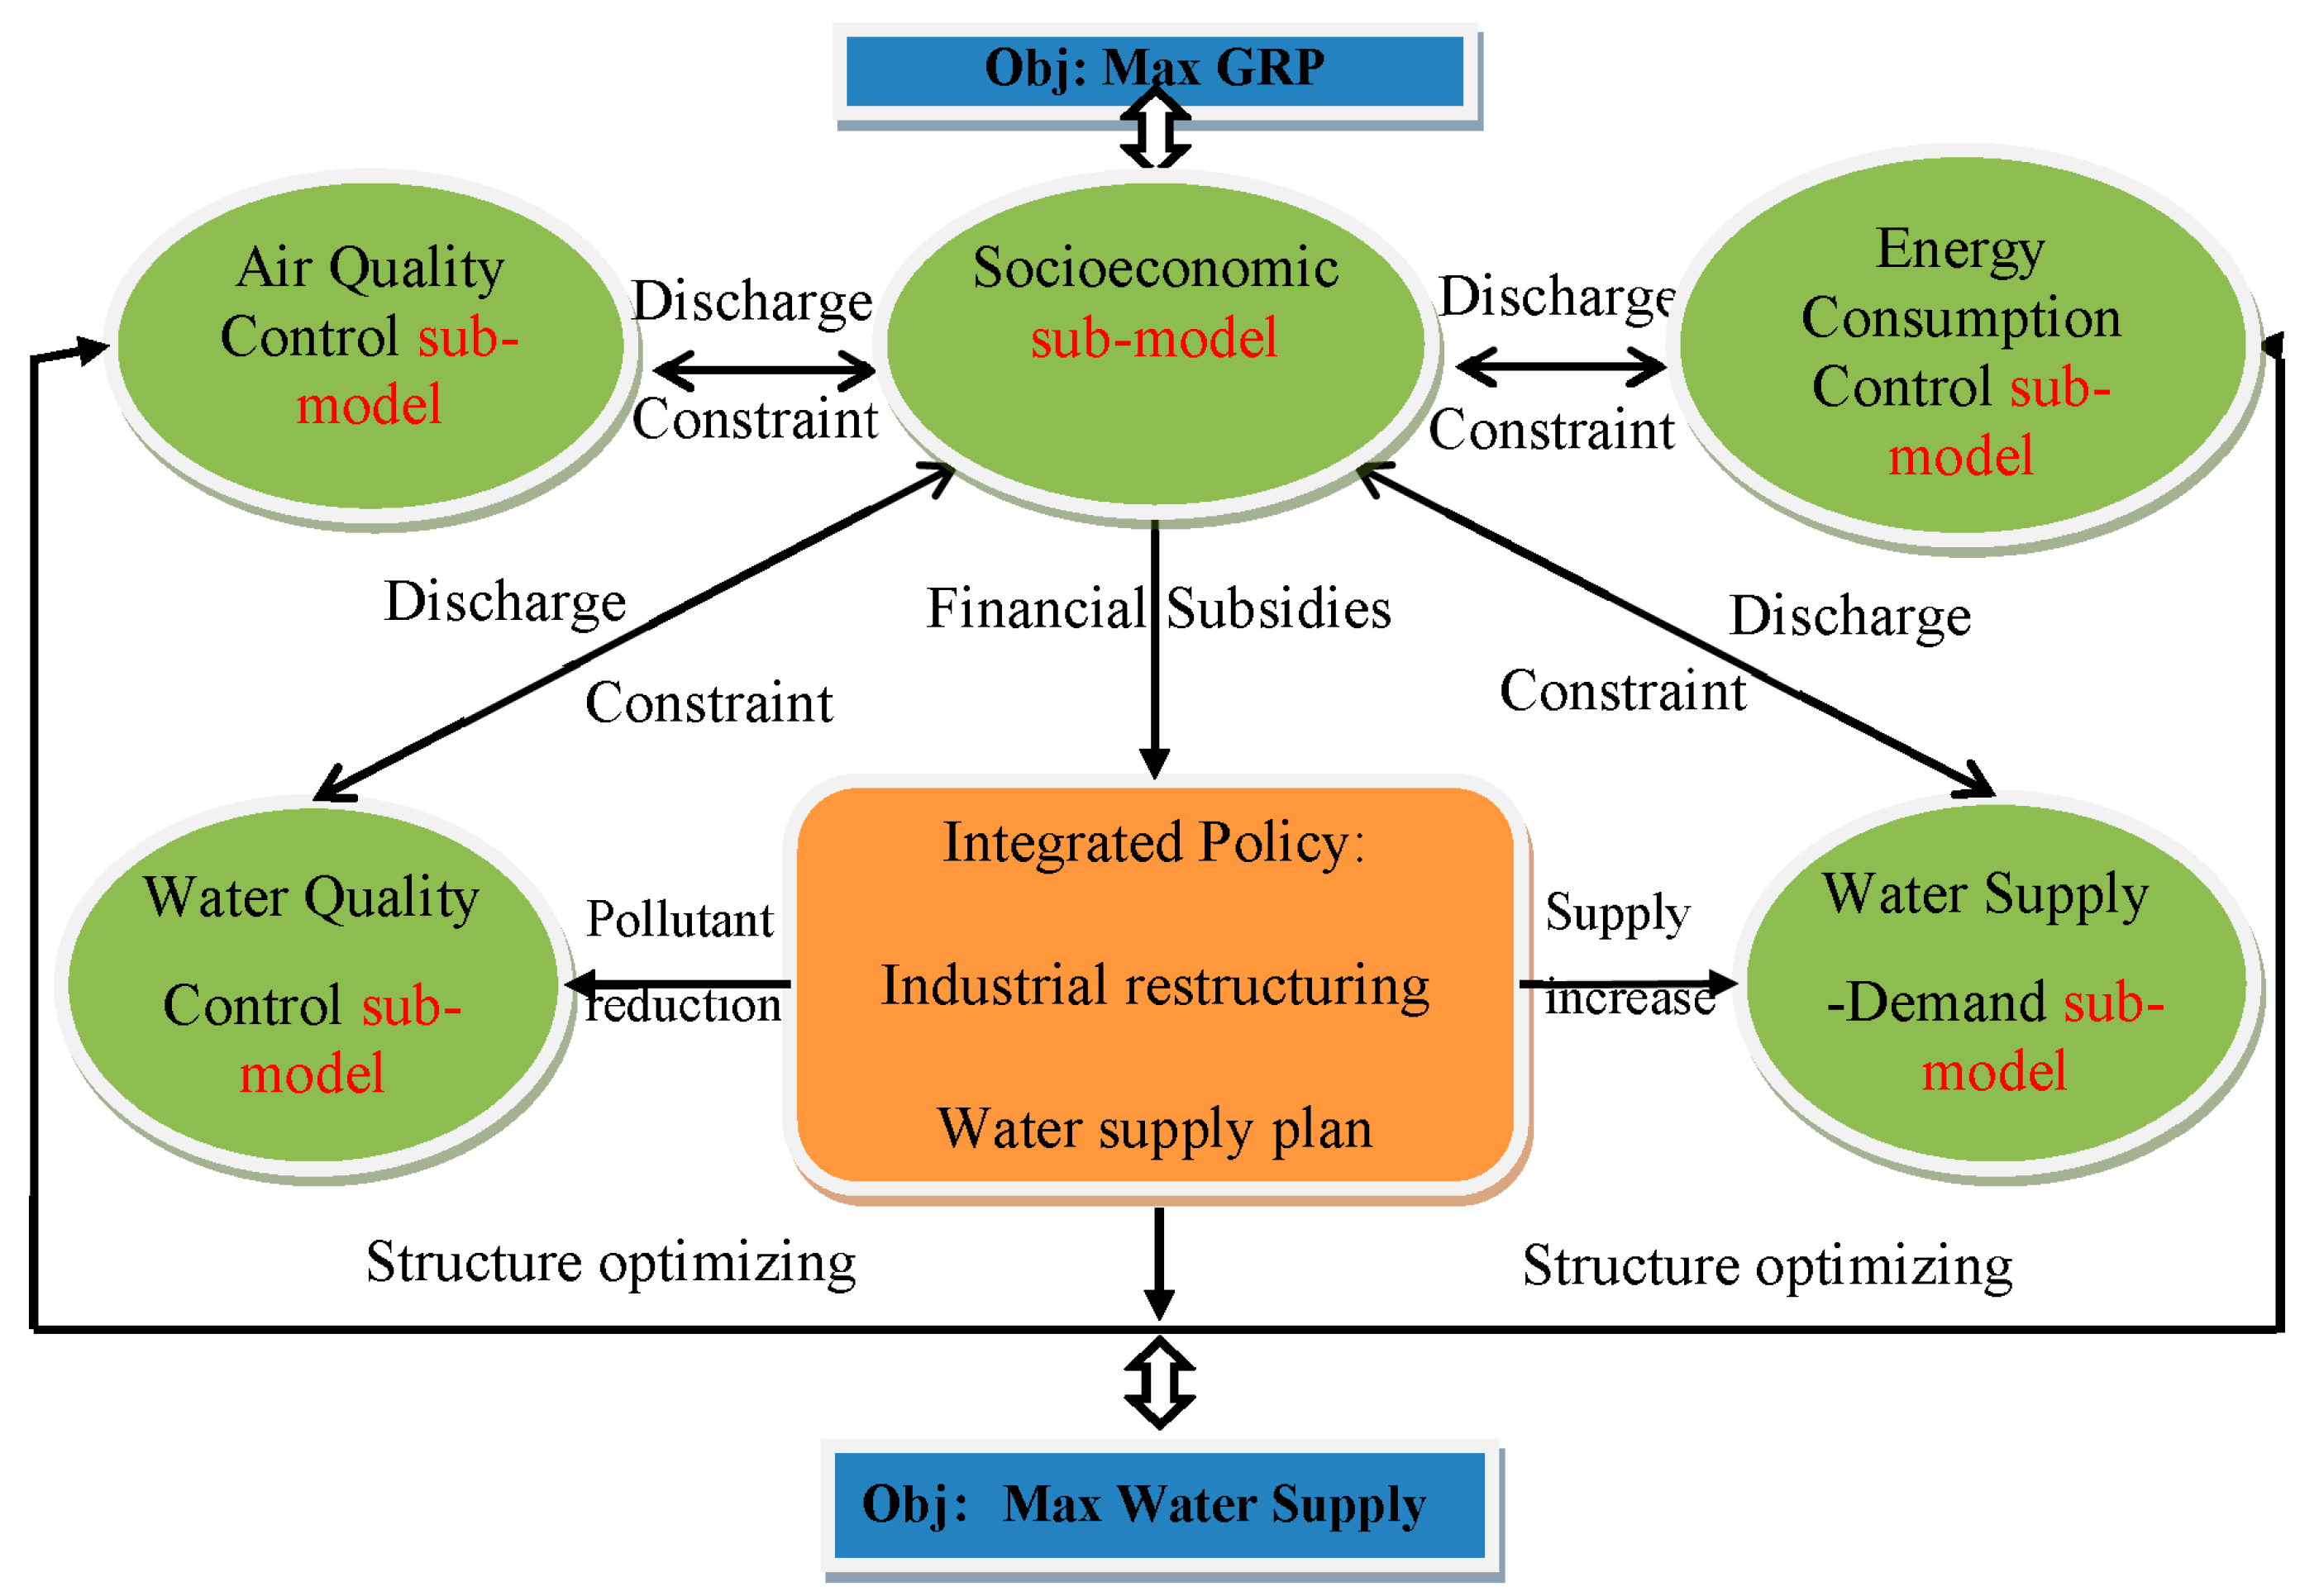
Section 2 explains the model framework with the introduction of integrated policy. Section 3 formally illustrates the modeling and simulation with corresponding mathematical formulation. Section 4 discusses the empirical results obtained from simulation. The brief conclusion and the main policy implications are finally presented in Section 5.

2. Model

In this paper, we design a comprehensive dynamic model by integrating the multi-objective programing method and IO model. According to our field survey and data collection, we construct a model to suit the sustainable development of resource-based cities.

2.1. Model Framework

The economic activity described in this study is the flow of commodities using an input–output (IO) table with the macroeconomic indicators of production, consumption, investment, capital stock and value added, which is called value balance rule [29,30,31,32]. The relationship between resource consumption and pollution emissions related to economic activities abide by the rule of material balance, which means that the mass of residuals returned to natural environment must be equal to the mass of basic fuels, minerals and other raw materials entering the processing and production system plus gases taken from the atmosphere [33]. Based on these rules, this model shown in Figure 1 includes two objectives, to maximize the Gross Regional Production (GRP) and maximize the amount of water supply, and six sub-models, which are socioeconomic sub-model, water supply–demand sub-model, water quality control sub-model, air quality control sub-model, energy consumption control sub-model and integrated policy sub-model.
Within the model, these six sub-models interact with each other. The socioeconomic sub-model simulates GRP via input–output coefficient and impact factor of integrated policy, while the other sub-models calculate the environmental pollutants and resource depletion based on the IO model via industrial output, emission factors and resource consumption factors. Then, a series of goals for resource conservation and emission reduction will modulate the economic activity in reverse so as to realize the tradeoffs among them.
Figure 1. Model framework.
Sustainability 08 00160 g001
As outlined in Table 1, the integrated policy includes industrial restructuring and a water supply plan. First, the economic structure should be optimized subjected to the reduction goals of atmosphere pollutants, water pollutants and the energy saving goals; second, the water supply plan is divided into two aspects: (1) effective water allocation should consider the intensities of both water resource utilization and water pollutants emission; and (2) the introduction of sewage water treatment technologies should be based on treatment demand of different districts, the treatment capacity, and the construction costs of different technologies, so as to increase the recycled water supply. Government finances should provide subsidies to assist the implementation of the integrated policy.
Table 1. Integrated policy.
PolicyIndexMeasures
Industrial restructuring1Water pollutants control
2Water consumption control
3Energy consumption control
4Air pollutants control
Water supply plan5Water reallocation
6Sewage water treatment technologies introduction

2.2. Hypothesis of the Model

The model is composed of two objective functions and six sub-models. In order to observe the influence of integrated policy on different economic sectors in Ordos, we assume that the value flow and material flow are limited within the city; the resource consumption and waste emissions are linearly dependent on the level of the socioeconomic activities and the coefficients remain unchanged during the simulation period; and the input–output coefficients and value added rate are fixed, as we assume the level of technology will stay the same.

3. Mathematical Formulation of Model

The model developed in this work enables maximization of both GRP and total water supply within the restrictions of planning targets on industrial restructuring, water utilization, energy saving and emissions reduction. The simulation period ranges from 2012 to 2025. Because the model includes more than 80 mathematical functions with 8828 variables and 7878 constraints, only the most important functions are shown here. In this work, we used the mathematical software package LINGO [34,35,36] to translate the mathematical formulation with exogenous variables into programming language, and then the endogenous derivation of global efficient solution is obtained.

3.1. Objective Function

As mentioned above, Ordos is confronted with water shortages. In order to ensure socioeconomic development despite the limited water resources, we set the first objective as maximizing the total water supply (TWS). Moreover, as Ordos is currently being industrialized, the sustainable development should not deteriorate from the economic growth; thus, the maximization of GRP considering the social discount rate over the target term is simultaneously set as another objective:
Max { T W S ( t ) , t 1 ( 1 + ρ ) t 1 G R P ( t ) }
where T W S ( t ) is total water supply at time t, G R P ( t ) is the Gross Regional Product in time t, and ρ is the social discount rate considering the net present value (NPV) of future income (=0.05) [21,37].

3.2. Socioeconomic Sub-Model

The socioeconomic sub-model describes the population growth, land expansion and flow of commodities. Ordos city is divided into eight districts, according to the administrative division: Dongsheng District, Dalad Qi, Jungar Qi, Etuokeqian Qi, Etuoke Qi, Haggin Qi, Uxin Qi, and Ejin Horo Qi.

3.2.1. Population Growth

Because the eight districts are different, their populations grow at different annual rates:
P j city/country ( t + 1 ) = ( 1 + γ j ) · P j city/country ( t )
where P j city/country ( t ) is the population of city/country in district j at time t, and γ j is the population growth rate in district j.

3.2.2. Land Expansion

The built-up area expands annually according to the urban planning of Ordos, while others reduce proportionally:
L construction ( t + 1 ) = ( 1 + θ ) · L construction ( t )
where L construction ( t ) is the construction area at time t, and θ is the growth rate.

3.2.3. Flow Balance of the Commodity Market

Based on the characteristics of production, the industry is divided into 10 categories: primary industry, coal mining industry, non-coal mining industry, petroleum and chemical industries, metal and nonmetal manufacturing industries, equipment manufacturing industry, other manufacturing industries, electricity and water production industries, construction industry, and tertiary industry.
The total product of each industry should meet the balance between supply and demand for the commodity market. The products are decided by a Leontief input–output matrix, consumption, investment and net export. Considering the sectoral influence brought by these new investments, an impact coefficient related to the investment of new reclaimed water technologies is added in order to evaluate the influence on industrial output:
X m ( t ) A · X ( t ) + C ( t ) + I m ( t ) + β · I sp ( t ) + N E ( t )
where X m ( t ) is the total production of industry m at time t, A is the input–output coefficient matrix, C ( t ) is the total consumption at time t, I m ( t ) is the total investment, and N E ( t ) is the net export at time t. Since we introduced new sewage treatment technologies to reduce water pollutant and increase water supply, I sp ( t ) presents the investment of new sewage treatment technologies, whereas β is the coefficient associated with the production induced by the new investment.
In addition, the industrial product is restricted by the capital stock and subsidies, and the industries can be restructured by residual capital and subsidies for industrial shrinkage:
X m ( t ) α m · ( K m S m )
where α m is the capital ratio of output in industry m at time t, K m is the available capital of industry m at time t, and S m is the subsidy for curtailment for industry m at time t.
The capital accumulation depends on investment and capital depreciation:
K m ( t + 1 ) = K m ( t ) + I m ( t + 1 )   d m · K m ( t )
where d m is the depreciation rate of industry m.
The GRP is the index to reflect the socioeconomic development, which is the summation of the product of all 10 industries considering the value-added rate during the target term:
G R P ( t ) = m δ m · X m ( t )
where δ m is the value-added rate of industry m.

3.3. Water Supply–Demand Sub-Model

Water supply–demand sub-model describes the balance between supply and demand, and water recycling with sewage treatment technologies. To meet water demand and safeguard the security of supply, the water supply must be equal to or exceed water demand. During the target term, the groundwater, local surface water, transfer water and other water resources remain unchanged because conventional water resources are limited in the short term [38]. In this work, we intend to provide sufficient water supply to match demand through optimizing water allocation and introducing sewage treatment technologies.

3.3.1. Water Supply and Demand

In Ordos, the total water supply comes from groundwater, local surface water, transfer water from the Yellow River, reclaimed water, and other water resources. Because the exploitation of groundwater is under restriction and conventional water sources are limited, groundwater, local surface water, transfer water and other water resources are assumed to remain unchanged, and the water demand of the environment is fixed according to the predicted amount announced by the local government,
T W S ( t ) = j G W j ( t ) + j L S W j ( t ) + j T W j ( t ) + j R W j ( t ) + j O W j ( t )
where G W j ( t ) , L S W j ( t ) , T W j ( t ) , R W j ( t ) and O W j ( t ) are groundwater, local surface water, transfer water from the Yellow River, reclaimed water, and other water resource in district j at time t, respectively.
The water resources are distributed to households, industry, and environmental maintenance:
T W D ( t ) = j e w c i t y · P j c i t y ( t ) + j m e w m · X j m ( t ) + E W D ( t )
where T W D ( t ) is the total water demand at time t, e w city/country is the water demand coefficients of city/country, e w m is the water demand coefficient of industry m, and EWD is the water demand for urban environmental maintenance.

3.3.2. Water Recycling

With the utilization of water resources, sewage water is also generated from households, industrial activities and environmental maintenance:
S W G ( t ) = j e s city/country · P j city/country ( t ) + j m e s m · X j m ( t ) + E W D ( t ) ,
where S W G ( t ) is the sewage water generated at time t, e s city/country is the coefficient of sewage water discharged from urban/country population, and e s m is the coefficient of sewage water discharge from industry m, m = 2–10 [39].
To ensure water supply and improve water quality, more and more sewage water treatment with the introduction of new sewage treatment facilities should be encouraged. In Ordos, there are eighteen sewage treatment plants with the traditional activated sludge treatment technology that is widely used in China now. Considering the technology change, our model introduced three kinds of advance sewage water treatment technologies. All three kinds of Membrane Bio-Reactor technologies are expected to be chosen (Table 2), Double Membrane Bio-Reactor (DMBR) [40], Ceramic Membrane Bio-Reactor (CMBR) [41] and Extractive Membrane Bio-Reactor (EMBR) [37], because they are currently considered the most promising options for resource-based cities. The construction and operation cost, productivity, and environmental and investment efficiencies have been specified, which dictates where, and how much of, a particular technology can be utilized. The capacity factors and cost are based on current designs and assumed to be constant over the target period.
Table 2. Sewage water treatment technologies.
TechnologyConstruction Cost (Million RMB)Operation Cost (RMB/Ton)Productivity of Reclaimed Water (%)Environmental Efficiency (Removal Ability/Million Tons)Investment Efficiency (Treatment Capacity/RMB)
ADMBR1653803450.22
BCMBR703.6853540.16
CEMBR51.8955600.3
The gross volume of treated sewage water includes the existing capacity and the added amount of the new sewage water treatment plan:
S W T ( t ) = j E S W T j ( t ) + j ( N S W T j A ( t ) + N S W T j B ( t ) + N S W T j C ( t ) )
where S W T is the treated sewage water at time t, E S W T j is the existing capacity of sewage water treatment, and N S W T j A , N S W T j B and N S W T j C are sewage water treated by new technology A, B and C, respectively.
Reclaimed water comes from treated sewage water. Following the introduction of a new technology, reclaimed water is increased to support the water supply:
R W ( t ) = j E R W P j ( t ) + j ( ρ · N S W T j A ( t ) + ϕ · N S W T j B ( t ) + ω · N S W T j C ( t ) )
where E R W P j ( t ) is the reclaimed water produced by existing sewage water treatment plants in region j at time t, and ρ , ϕ and ω are the coefficients of reclaimed water produced by technology A, B and C, respectively.
According to the Urban Overall Planning of Ordos (2011–2013), in the year 2025, the ratio of sewage treatment should be higher than 95%, while the reuse rate of reclaimed water should exceed 80% [42]. This policy will determine how new technologies are introduced.
RATE_wt(t) = SWT(t)/SWG(t)
RATE_rw(t) = RW(t)/SWT(t)
In Equations (13) and (14), RATE_wt(t) is the ratio of sewage treatment at time t, and RATE_rw(t) is the reuse rate of reclaimed water at time t.

3.4. Water Quality Control Sub-Model

The water quality control sub-model describes the emission and disposal of water pollutants, and also sets the goal for emission reduction. In Ordos, the emission of chemical oxygen demand (COD) accounts for 91.1% of total water pollutants; thus, COD is selected as an indicator for measuring water quality in Ordos. COD is generated from the wastewater of industries and households, and also comes from the non-point sources (farmland, orchards, grassland, construction land and others) and rainfall:
TP_cod(t) = IWP_cod(t) + HWP_cod(t) + NWP_cod(t) + RP_cod(t) - DP_cod(t)
where TP_cod is the total COD discharged at time t; IWP_cod(t), HWP_cod(t), NWP_cod(t), and RP_cod(t) are the COD emitted from industries, households, non-point sources and rainfall at time t, respectively; and DP_cod is the disposed pollutant at time t.
However, with the treatment of existing and new reclaimed water technologies, the amount of disposed pollutants increases gradually:
DP_cod ( t ) = j e p e x · E S W T j ( t ) + j ( α · N S W T j A ( t ) + β · N S W T j B ( t ) + γ · N S W T j C ( t ) )
where e p e x is the disposed coefficient for existing water treatment, while α , β and γ are the coefficients for the pollutant removal of technologies A, B and C, respectively.
According to the Energy Conservation and Emission Reduction Plan, water pollution should continually decrease by 3.3% annually [42]:
TP_cod(t + 1) = TP_cod(t)·(1 - 3.3%)

3.5. Air Quality Control Sub-Model

The air quality control sub-model describes the emissions of air pollutants, and sets the goal for emissions reduction. According to the characteristics of industrial emission in Ordos, we found that the emission of Sulfur-dioxide (SO2) and Oxynitride (NOx) account for 36.6% and 35.2%, respectively, of the total output of industrial waste gas, while 80.2% of SO2 emission and 86.9% of NOx emission were discharged from the electricity and water production industry and the downstream of coal mining industry, which illustrates that SO2 and NOx are typical air pollutants in Ordos. Therefore, we choose SO2 and NOx as the indicators for measuring air quality. SO2 and NOx are mainly emitted from industrial manufacturing and households:
TAP_SO2/NOx(t) = IAP_SO2/NOx(t) + HAP_SO2/NOx(t)
where TAP_SO2/NOx(t) is the total SO2/NOx discharged at time t, and IAP_SO2/NOx(t) and HAP_SO2/NOx(t) are the air pollutant emitted from industries and households at time t, respectively.
Driven by the planning goals of emissions reduction, Ordos has an obligation to reduce SO2 and NOx by 2.5% and 3% annually, respectively [42]:
TAP_SO2/NOx(t) = TAP_SO2/NOx(t)·(1 - 2.5/3 %)

3.6. Energy Consumption Control Sub-Model

The energy consumption control sub-model describes the energy consumption, and sets the goal for energy conservation. Energy demand comes from industrial activities and the final consumption of local residents. Constraints on energy demand can restrict the amount of energy consumption, so as to optimize the industrial structure. As formulated in the Energy Conservation and Emission Reduction Plan, energy consumption per unit GRP should decrease at an annual rate of 3.3% during the target term and sustainable industrial development needs to control energy consumption [42]:
TED(t)= IED(t) + CED(t)
EC_grp (t)= TED(t) / GRP (t)
Where TED(t) is the total energy demand at time t; IED(t) is energy demand for industrial activities, which are based on industrial output and their energy consumption coefficients (see Appendix Table A2 and Table A5); CED(t) is the final consumption of resident at time t; and EC_grp (t) is the energy consumption per unit GRP.

3.7. Financial Budget

Choosing which technologies to install depends on the following: removal efficiency, investment efficiency, productivity and maintaining cost of each technology. Moreover, the total subsidy for industrial restructuring and water supply plan is limited by the financial budget:
j I j a/b/c ( t ) + j MC j a/b/c ( t ) = j S_SP j a/b/c ( t ) ,
FB ( t ) S_SP j a/b/c ( t ) + S m ( t ) ,
where I j a/b/c is the total investment of technology A, B or C in region j at time t; MC j a/b/c is the maintenance cost of technology A, B or C in region j at time t; and S_SP j a/b/c is the subsidy for new reclaimed water technologies in region j at time t. The total subsidy cannot exceed the financial budget (FB) at time t.

4. Simulation and Discussion

In this study, the data have been sourced from Statistical Bureau, Municipal Water Resources Bureau, Environmental Protection Agency, and Land and Resources Bureau to calculate the coefficients of industrial input–output, water demand, sewage water discharge, pollutant emission, and different sewage water treatment technologies. All of these collected data are considered exogenous variables (see Appendix) during the process of simulation, while the simulation results turned are the endogenous variables. Moreover, this simulation model has passed the consistency test, validity test and sensitivity test, and the result shows that this model is completely feasible and reliable. After simulation, this paper intends to reach the maximum GRP and water supply within the constraints of specific energy conservation and emission reduction goals, then put forward the efficient solution for industrial restructuring and water resource recycling plan through sewage treatment technology selection, installation, and water allocation with financial subsidies.

4.1. Industrial Restructuring

Constrained by the planning control on water consumption, energy consumption, water pollution and air pollution, the industrial structure should be adjusted so that to achieve the objective of GRP maximization.

4.1.1. GRP Maximization

During the target period, GRP in Ordos rises from 394.3 billion RMB in 2012 to 785.1 billion RMB in 2025, with an average annual growth rate of 6.4% (see Figure 2). The industries with high water and energy consumption and/or high pollutant emissions are reduced, but the regional output continues to increase, which illustrates that industrial restructuring can ensure environmental quality without impeding regional economic development.
Figure 2. Gross Regional Product (GRP) growth and industrial restructuring from 2012 to 2025.
Sustainability 08 00160 g002
As demonstrated in Figure 2, the proportion of primary industry descends form 2.17% in 2012 to 1.15% in 2025 due to more water consumption and inefficient sewage collection and recycling. The percentage of secondary industry constantly falls from 64.3% to 47.8%, especially the coal mining industry drops from 33.5% to 24.7% because of the falling price and overcapacity of coal, and national guidance on energy saving and emission reduction; meanwhile, the industries with high water consumption and severe pollution, such as non-coal mining industry, metal and nonmetal manufacturing industries, other manufacturing industries, and electricity and water production industry, should be cut, respectively, from 6.43%, 3.65%, 2.65%, and 3.42% in 2012 to 0.79%, 0.96%, 0.02%, and 0.45% in 2025.
In contrast, the industries with higher added value products, less pollution discharge and lower energy consumption, such as petroleum and chemical industry, equipment manufacturing industry, and construction industry are encouraged to expand from 7.2%, 0.34% and 7.3% in 2012 to 10.3%, 0.59%, and 9.9% in 2025, respectively. The growth of tertiary industry is more significant, from 33.5% in 2012 to 51.1% in 2025, which will become the pillar industry of Ordos in the near future.

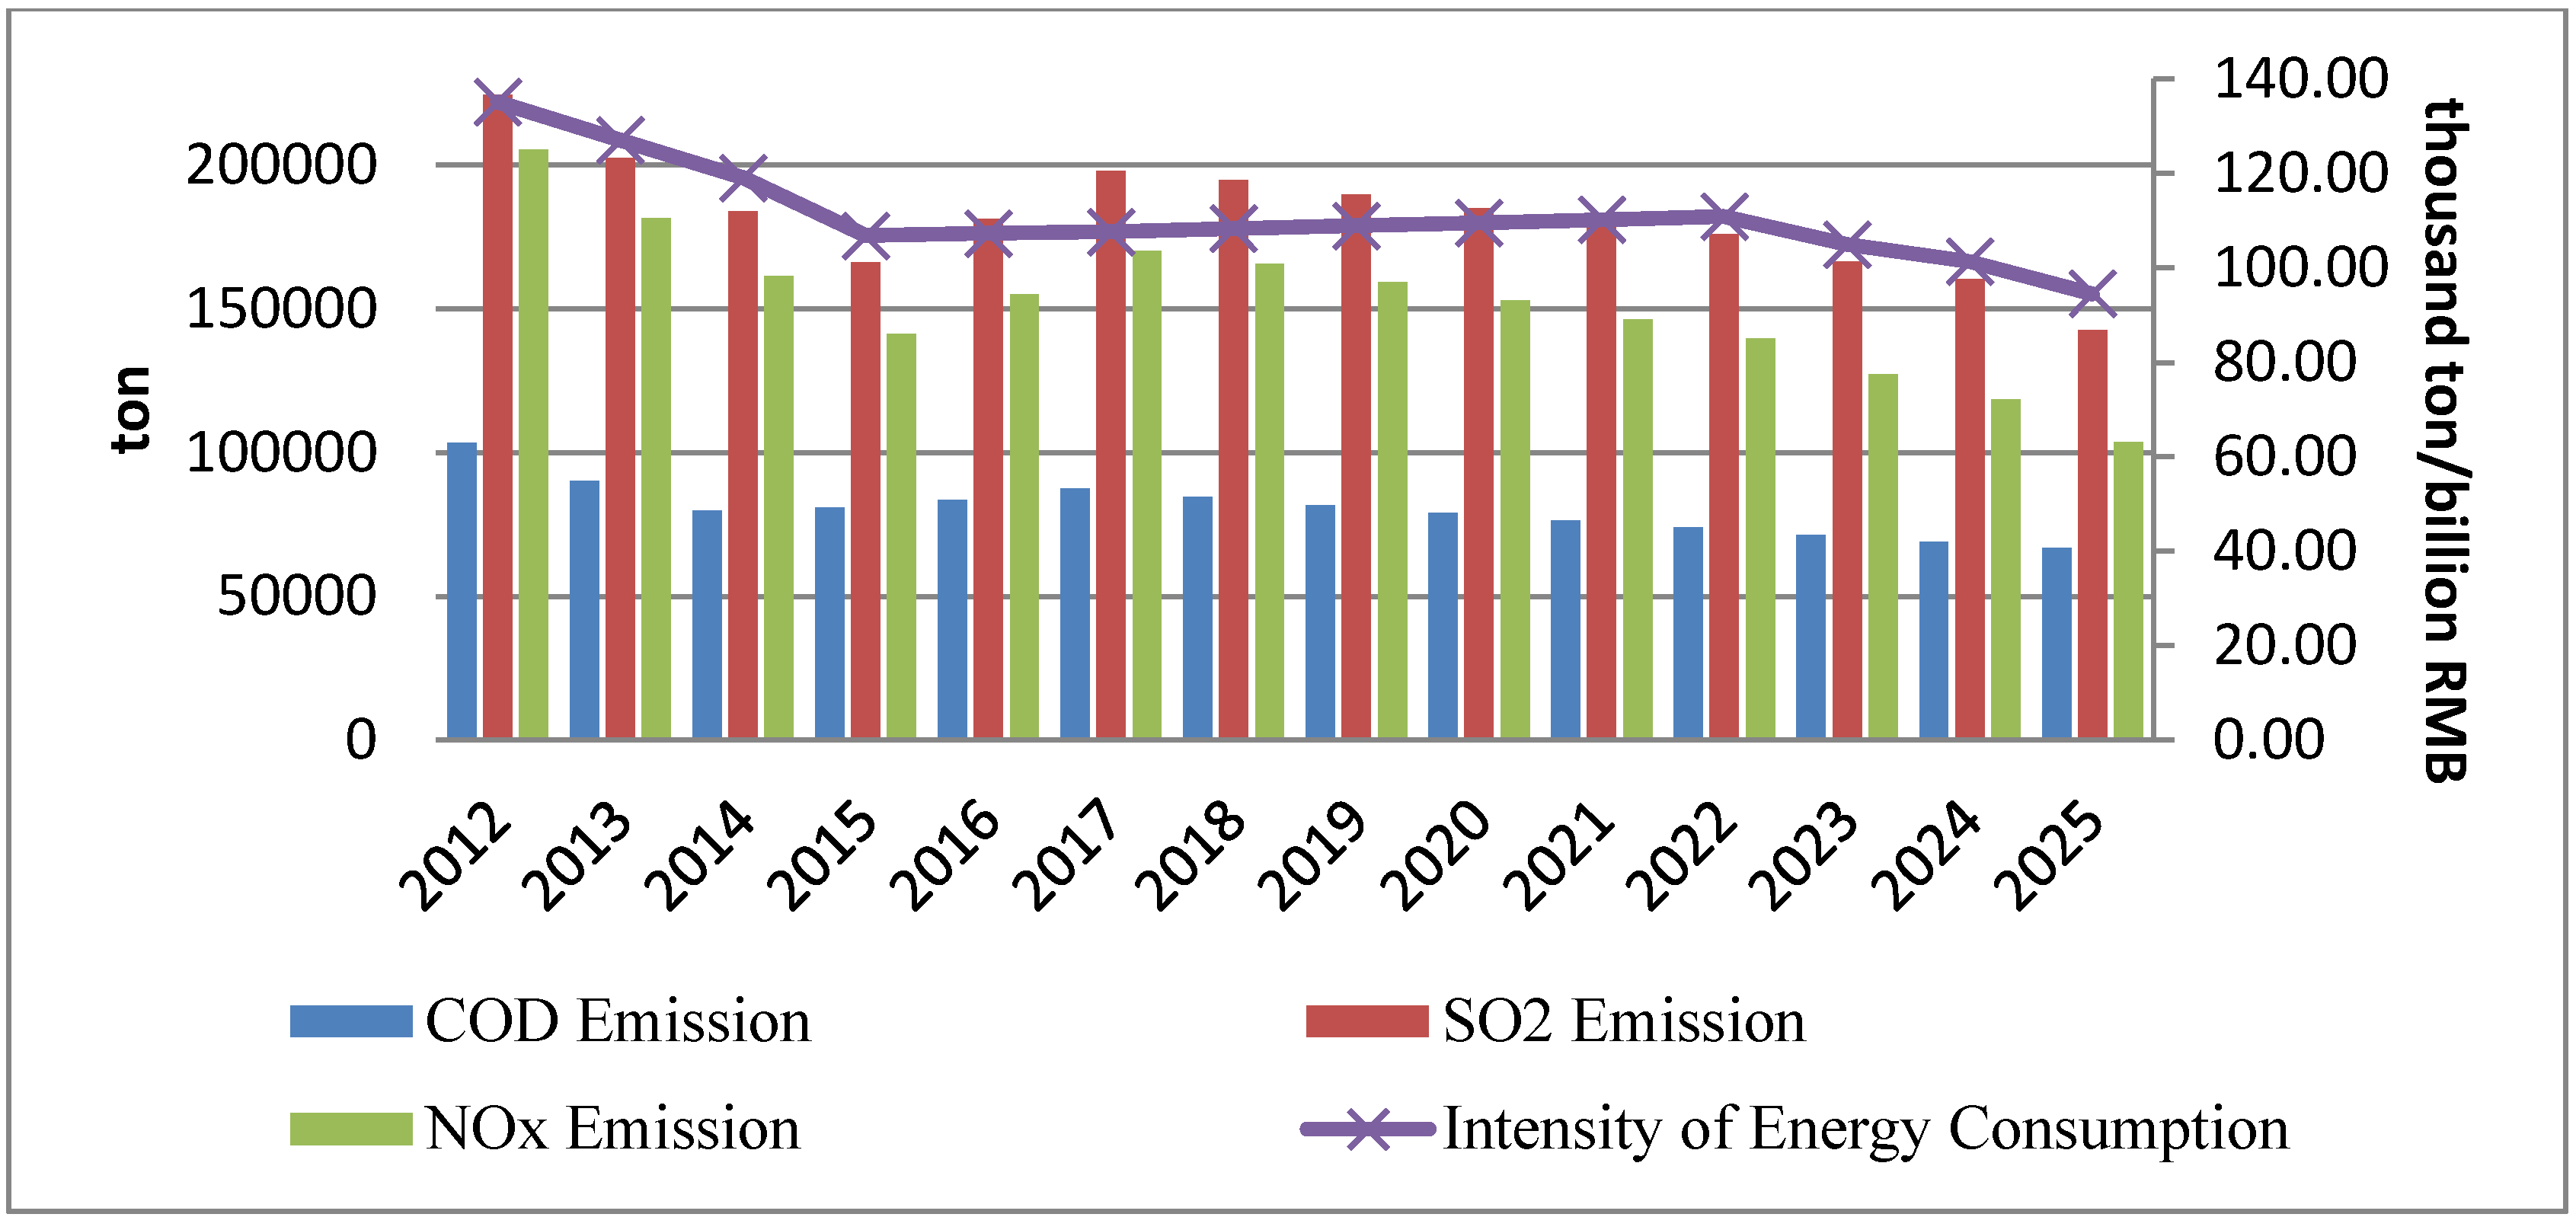
4.1.2. Environmental Impact Control

At the early stage of the target period, the amount of pollution declines obviously, first due to strict constraints on emission control, then owing to the adjustment of industrial structure, the environmental burden is reduced, and the pollution emissions may increase slightly within the emission standards. However, under the multi-constraints of energy conservation and emissions reduction, the pollution emissions still decline overall by 2025.
As shown in Figure 3, the intensity of energy consumption declines from 135.1 thousand ton per billion RMB in 2012 to 94.5 thousand ton per billion RMB in 2025; the emission of water pollutant COD falls from 103,400 ton to 66,845 ton with a reduce rate of 3.3% annually; the emission of air pollutant SO2 and NOx decrease from 224,424 ton and 205,440 ton to 142,583 ton and 103,697 ton with annual reduce rates of 3.3% and 4.9%, respectively, which are all in line with the planning.
Figure 3. Environmental improvement from 2012 to 2025.
Sustainability 08 00160 g003

4.2. Water Supply Plan

In this work, water supply plan focuses on water reallocation and water supply maximization with new sewage treatment technologies introduction to improve the utilizing efficiency of limited water resources, so as to make up the water shortage in Ordos.

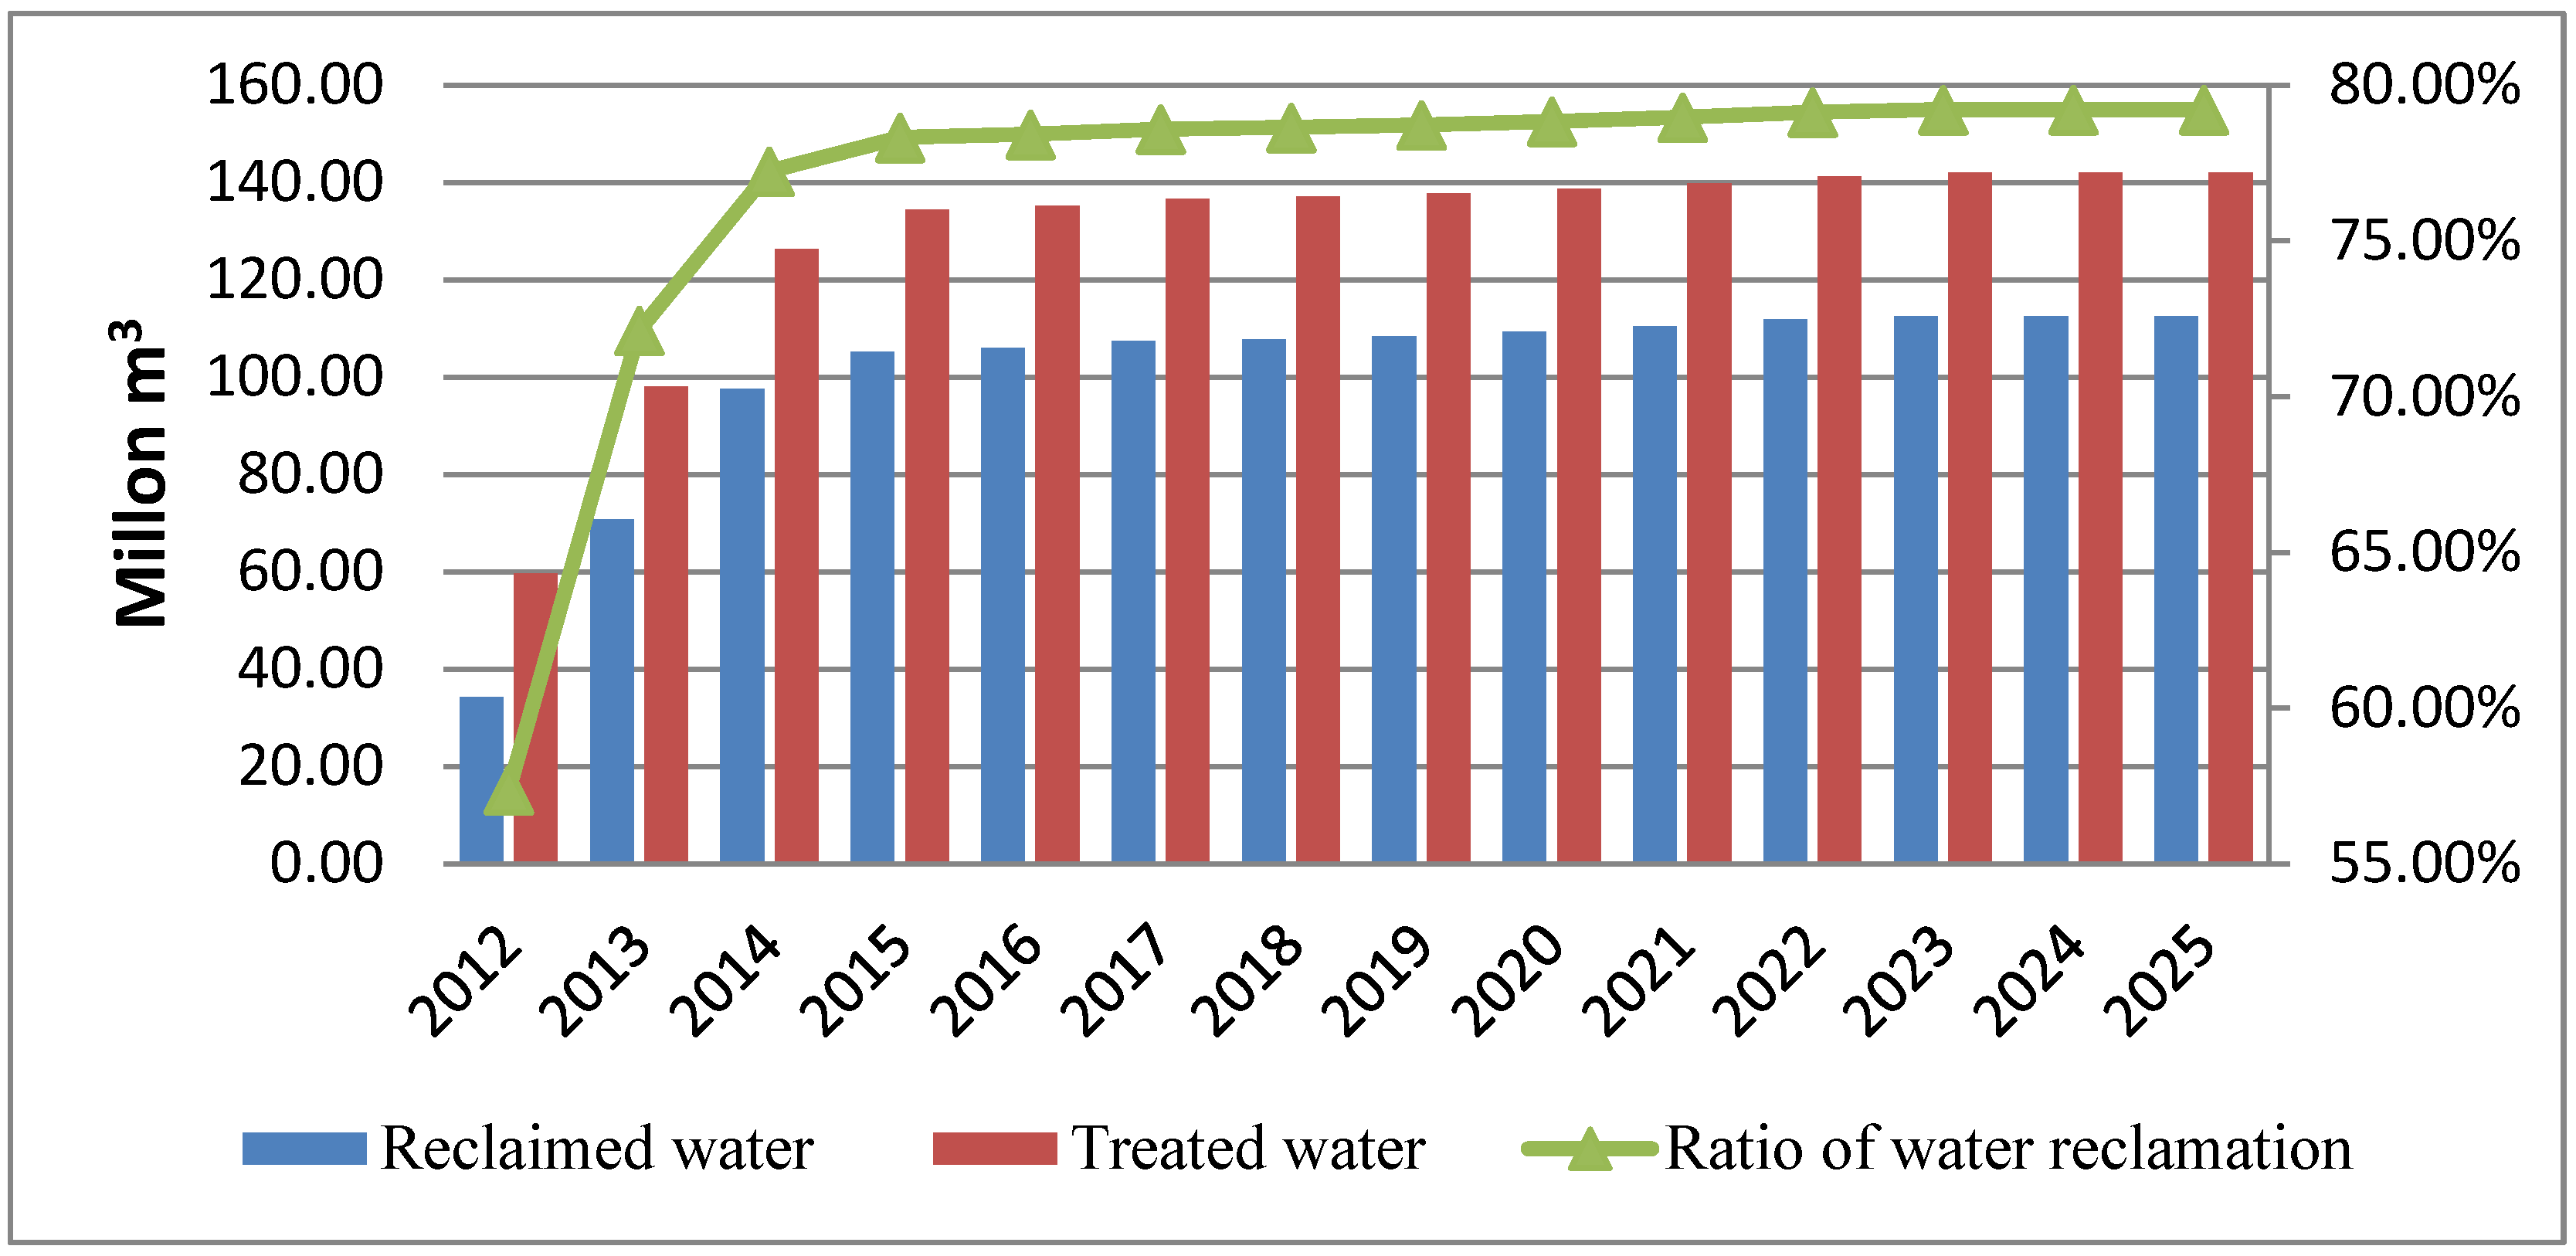
4.2.1. Water Supply Maximization

Since the groundwater, local surface water, transfer water and other water resources remain unchanged, improving the efficiency of water reclamation is the most suitable measure to maximize water supply. After the introduction of the new sewage treatment technology and newly built sewage treatment plants, the municipal sewage treatment capacity will increase gradually. As demonstrated in Figure 4, the amount of treated water rises from 59.61 million m3 in 2012 to 142.01 million m3 in 2025; the output of reclaimed water shoots up from 34.20 million m3 in 2012 to 105.28 million m3 in 2014 and then increases to 112.48 million m3 in 2025. The reuse rate of reclaimed water will be improved significantly form 57.37% in 2012 to 79.21% in 2025. By then, reclaimed water accounts for 6.3% of the water supply in 2025, which is relatively higher than that of 2% in 2012, releasing the stress between water supply and demand in Ordos.
Figure 4. Water recycling from 2012 to 2025.
Sustainability 08 00160 g004

4.2.2. Water Reallocation

Reallocating the limited water resources between different industries can save water resources and improve the utilization efficiency of water resources. As shown in Figure 5, the utilizing intensity of water resources decreases from 4.189 million m3 per billion RMB in 2012 to 2.273 million m3 per billion RMB in 2025. In addition, according to industrial restructuring, the primary industry still holds a large proportion, above 70%, during the target period due to its poor agricultural water-saving engineering; the industries with large coefficients of water consumption and pollutant emission, such as other manufacturing industries and electricity and water producing industry cut their water demand from 3.7% and 4.0% in 2012 to 0.1% and 1% in 2025, respectively; under the multiple constraints on economic efficiency, energy conservation and emissions reduction, water utilization of coal mining industry, non-coal mining industry, and metal and nonmetal manufacturing industries first increase, then decrease by 2025, with the proportions of 11.6%, 0.1% and 0.4%, respectively.
Figure 5. Water reallocation and utilizing intensity from 2012 to 2025.
Sustainability 08 00160 g005
On the other hand, water resources curtailed from the industries mentioned above will be assigned to industries with higher production efficiency, better energy conservation and emissions reduction effect, such as petroleum and chemical industry, equipment manufacturing industry, construction industry and the tertiary industry, so the percentages of water consumption of these industries rise from 2.7%, 0.06%, 0.8%, and 0.7% in 2012 to 7.1%, 0.2%, 1.9%, and 0.75% in 2025, respectively.

4.2.3. Sewage Treatment Technologies Introduction

In order to achieve GRP maximization and water supply maximization, EBMR technology is chosen as the dominant one because of its smallest size of construction scale, highest efficiency of pollutant removal and best water quality compared to the others. As we can see from Table 3, in total, 53 EBMR sewage treatment plants should be built during the target period, which will greatly alleviate environmental pollution and improve the efficiency of water utilization, realizing the balance between water supply and demand in Ordos.
Table 3. Regional installation plan and efficiency improvement.
EBMRDongsheng DistrictDalad QiJungar QiEtuokeqian QiEtuoke QiHaggin QiUxin QiEjin Horo Qi
01912172210
Ratio of sewage treatment (%)2012100%47%91%6%42%23%34%71%
2025100%100%94%85%100%85%99%100%
Reuse rate of reclaimed water (%)201286%0%80%0%85%0%0%0%
202586%70%80%50%94%50%69%70%
To be specific, Dongsheng district and Jungar Qi are the most developed area in Ordos. During the target period, the existing sewage treatment capacity in Dongsheng district can satisfy the water recycling and water pollutant reduction requirement in the long term, and there is no need to introduce new sewage treatment plants in Dongsheng district. Jungar Qi, however, is famous for its energy industry, the fast development of which will make the water environmental burden more serious; thus, one sewage treatment plant will need to be built in Jungar Qi.
The economic aggregate of Dalad Qi, Etuoke Qi, and Ejin Horo Qi ranks second in Ordos. Their rapid development in the coal mining industry, chemical industry, and metal and non-metal manufacturing industries have caused a great demand on water resources, and resulted in inefficient water utilization and poor water quality. In order to realize the planning targets on water resources management, there are, respectively, 19, 17 and 10 new sewage treatment plants that will need to be built in Dalad Qi, Etuoke Qi and Ejin Horo Qi. After that, the ratio of sewage treatment will achieve 100%, and the reuse rate of reclaimed water will attain 70% in Dalad Qi, 94% in Etuoke Qi and 70% in Ejin Horo Qi.
Etuokeqian Qi, Haggin Qi and Uxin Qi are located in the desert and semi-arid areas and as such they have a less developed economy and fragile ecological environment. In order to protect the water environment and achieve water management planning targets, two kinds of new sewage treatment plants are suggested to be built in each district. By the year 2025, the ratios of sewage treatment of Etuokeqian Qi, Haggin Qi, and Uxin Qi will rise from 6%, 23%, and 34% to 85%, 85%, and 99%, respectively, as well as the reuse rate of reclaimed water from 0% to 50%, 50% and 69%, respectively.

5. Conclusions and Policy Implication

An integrated model combining the multi-objective optimization model with input–output analysis has been developed to help achieve the tradeoffs among economic growth, water utilization and environmental protection. To illustrate the application of the model, possible pathways for sustainable development in the resource-based city of Ordos have been considered. This dynamic model includes socioeconomic sub-model, water supply–demand sub-model, water quality control sub-model, air quality control sub-model, energy consumption control sub-model and integrated policy sub-model, and these six sub-models interact with each other. After the simulation, this study proposes an efficient solution of industrial restructuring by maximizing economic output under the constraints of specific energy conservation and emissions reduction goals, and presents the exercisable water resource recycling plan by maximizing the local water supply through sewage treatment technology selection, introduction and installation. The key conclusions and implications for sustainable development are summarized below.
Concerning the industrial restructuring, the local government is suggested to provide financial subsidies worth 1.759 billion RMB to curtail the industries with high water and energy consumption and high pollution emissions, while encouraging the industries with higher added value products, less pollutant discharge and lower energy consumption. Therefore, during the target period, the proportion of primary industry, coal mining industry, non-coal mining industry, metal and nonmetal manufacturing industries, other manufacturing industries, and electricity and water producing industry should decrease 8.8%, 1.02%, 5.64%, 2.69%, 2.63%, and 2.97%, respectively; while the petroleum and chemical industry, equipment manufacturing industry, construction industry, and tertiary industry should expand 3.1%, 0.25%, 2.6% and 17.6%, respectively. When we adopt the plan of industrial restructuring, the GRP in Ordos will increase 690.8 billion RMB, with an average annual growth rate of 6.4%. Furthermore, all energy conservation and emission reduction planning targets are achieved.
From the aspect of water supply plan, a financial subsidy of 3.791 billion RMB is needed to support the construction of 53 new sewage treatment plants with EBMR technology in Ordos during the target period. To be specific, 1, 19, 17, 10, 2, 2, and 2 new sewage treatment plants should be built in Jungar Qi, Dalad Qi, Etuoke Qi, Ejin Horo Qi, Etuokeqian Qi, Haggin Qi and Uxin Qi, respectively, utilizing subsidies of 22 million RMB, 759 million RMB, 724 million RMB, 363 million RMB, 63 million RMB, 50 million RMB and 51 million RMB. The water allocation should be consistent with industrial restructuring. After that, the amount of treated water will increase by 82.4 million m3; the output of reclaimed water will increase by 78.28 million m3; the reuse rate of reclaimed water will be improved from 57.37% to 79.21%; and reclaimed water accounts for 6.3%, more than the 2% in 2012. The planning goals on sewage treatment and water reclamation in each district have been achieved.
However, there are still some limitations that need to be considered for future extensions. First, the introduction and investment in municipal sewage treatment plants only consider the function of public finance; the roles of enterprises, residents and other stakeholders are not included in the model, and there is no cost and benefit analysis of different stakeholders when new sewage treatment plants are introduced. Second, this model only set energy consumption and air pollution emissions as constraints, the key technologies and controlling measures for improving energy consumption intensity and environmental quality are not embedded in the model. However, as more data become available, they can easily be incorporated into the model.
In summary, this work shows that realizing sustainable development in resource-based cities will require careful planning and consideration of different objectives, such as water resources, economic growth and environmental impacts. Such an integrated model can serve as a pre-evaluation approach for conducting early warning research for resource-based cities to avoid a series of inharmonious problems, offering concrete and feasible suggestions for government decision-making. Moreover, this model is generic and can be applied to any country or region suffering uncoordinated development issues, including socioeconomic, resource and environmental factors.

Acknowledgments

This study is supported by grants from Technical Evaluation of Mineral Resources in Ordos Basin (No. G1100303), Key Laboratory of Carrying Capacity Assessment for Resource and Environment, Ministry of Land and Resource (CCA2012.11), National Natural Science Foundation of China (No. 41101559), Beijing Social Science Foundation (No. 14JGC116), Fundamental Research Funds for the Central Universities (No. 2652015156) and Doctoral. Scientific Research Foundation of Shijiazhuang University of Economics (No. BQ201504). The authors would also like to thank the editor of Sustainability and the anonymous referees for their precious time and constructive comments on the paper.

Author Contributions

Jinghua Sha, Wenlan Ke and Jingjing Yan jointly conceived the study and designed the theoretical model. Wenlan Ke collected and calculated the data, compiled the linear equations, and constructed the simulation model with the help of Guofeng Zhang and Rongrong Wu. Wenlan Ke is responsible for preparing the manuscript and analyzing the results while the other co-authors supervised its analysis, discussed the simulation results and commented on the manuscript.

Conflicts of Interest

The authors declare no conflict of interest.

Appendix

Table A1. Input–output coefficients of 10 industries.
12345678910
10.1510.0010.0010.0130.0000.0000.2380.0000.0030.010
20.0030.0400.0050.0960.0290.0010.0070.1090.0030.003
30.0000.0000.1990.0020.0080.0000.0000.0000.0010.000
40.0780.0570.0200.1590.0440.0200.0230.0020.0150.064
50.0080.0210.0230.0160.2210.1840.0050.0050.1840.004
60.0070.0000.0010.0010.0040.2610.0020.0010.0120.003
70.1120.0010.0000.0090.0050.0050.1470.0010.0040.021
80.0100.0050.0000.0250.0450.0130.0100.1730.0020.009
90.0030.0010.0000.0000.0000.0000.0000.0000.0000.008
100.1070.1800.1210.1770.1260.1690.1610.1270.0540.227
Table A2. Output of 10 industries in eight districts (2012) (Million RMB).
Dongsheng DistrictDalad QiJungar QiEtuokeqian QiEtuoke QiHaggin QiUxin QiEjin Horo QiValue Added Ratio (%)
Primary industry25948311485172411812555196911930.49
Coal mining industry31,4919873101,128273622,58921628865,5280.63
Non-coal mining industry194867164141131639,42890.51
Petroleum and chemical industry475510,8946916399517,072154100757140.29
Metal, nonmetal manufacturing industries907872712179336789299478618570.35
Equipment manufacturing industry50086740440311119780.15
Other manufacturing industries240113,75158221200444820.37
Electricity and water production industry48986179522049226143023389000.49
Construction industry34,7264648861611544348255410040.32
Tertiary industry84622,34458,024493011,9454709950937,9170.61
Table A3. Coefficients of 10 industries on water demand and pollutant emission.
IndustryWater Demand Coefficient (kt/Million RMB)Sewage Water Discharge Coefficient (kt/Million RMB)COD Emission Coefficient (kt/Million RMB)
Primary industry81.24750.158488.15
Coal mining industry0.56660.0088235.07
Non-coal mining industry0.15040.0625387.14
Petroleum and chemical industry0.83850.144216.9758
Metal, nonmetal manufacturing industries0.44680.02769.9297
Equipment manufacturing industry0.42160.26175.8559
Other manufacturing industries3.16460.3459476.1258
Electricity and water production industry2.80950.410518.9016
Construction industry0.2338--
Table A4. Coefficients of 10 industries on Air pollutant emission.
IndustrySO2 Emission Coefficient (t/Million RMB)NOx Emission Coefficient (t/Million RMB)
Coal mining industry0.056640.01726
Non-coal mining industry0.373630.07383
Petroleum and chemical industry0.399660.24126
Metal, nonmetal manufacturing industries1.750491.8149
Equipment manufacturing industry-0.01095
Other manufacturing industries0.520480.10004
Electricity and water production industry10.1925710.23891
Table A5. Coefficients of 10 industries on energy consumption.
IndustryEnergy Consumption (Tons of Standard Coal/Million RMB)
Primary industry210.24
Coal mining industry70.21
Non-coal mining industry49.67
Petroleum and chemical industry580.33
Metal, nonmetal manufacturing industries74.7
Equipment manufacturing industry140.39
Other manufacturing industries11.76
Electricity and water production industry2244.63
Construction industry82.04
Tertiary industry123.87

References

  1. Arquiola, J.P.; Álvarez, J.A.; Monerris, M.M.; Solera, A. Water Quantity and Quality Models Applied to the Jucar River Basin, Spain. Water Resour. Manag. 2010, 24, 2759–2779. [Google Scholar] [CrossRef]
  2. Buytaert, W.; Friesen, J.; Liebe, J.; Ludwig, R. Assessment and Management of Water Resources in Developing, Semi-Arid and Arid Regions. Water Resour. Manag. 2012, 26, 841–844. [Google Scholar] [CrossRef]
  3. The State Council. Sustainable Development Planning of National Resource-Based Cities (2013–2020). Available online: http://zfs.mep.gov.cn/fg/gwyw/201312/t20131204_264360.htm (accessed on 16 January 2014).
  4. Grundmann, J.; Schütze, N.; Schmitz, G.H.; Shaqsi, S.A. Towards an integrated arid zone water management using simulation-based optimization. Environ. Earth Sci. 2012, 65, 1381–1394. [Google Scholar] [CrossRef]
  5. Ordos Statistics Bureau. Ordos Statistical Yearbook 2013; China Statistics Press: Beijing, China, 2013. [Google Scholar]
  6. Li, H.P. Research on Gordian Technologies for Regional Water Highly Utilization and Sustainable Development; China Water Conservancy and Hydropower Press: Beijing, China, 2011. [Google Scholar]
  7. The Twelfth Five-Year Plan for National Economic and Social Development in Ordos. 2011. Available online: http://www.ordos.gov.cn/xxgk/ghjh/fzgh/201108/t20110820_461913.html (accessed on 20 May 2011).
  8. Leontief, W.W. Quantitative Input and Output Relations in the economic System of the US. Rev. Econ. Stat. 1936, 8, 105–125. [Google Scholar] [CrossRef]
  9. Leontief, W.W. The Structure of American Economy, 1919–1939: An Empirical Application of Equilibrium Analysis; Oxford University Press: New York, NY, USA, 1941. [Google Scholar]
  10. Leontief, W.W. Environmental repercussions and the economic structure—An input-output approach. Rev. Econ. Stat. 1970, 52, 262–271. [Google Scholar] [CrossRef]
  11. Leontief, W.W.; Ford, D. Air pollution and the economic structure: Empirical results of input-output computations. In Input-Output Techniques; Brody, A., Carter, A., Eds.; North-Holland Publishing Company: Amsterdam, The Netherlands, 1972; pp. 9–30. [Google Scholar]
  12. McKenzie, E.C.; Durango-Cohen, P.L. An input-output approach for the efffcient design of sustainable goods and services. Int. J. Life Cycle Assess. 2010, 15, 946–961. [Google Scholar] [CrossRef]
  13. Norgate, T.; Haque, N. Energy and greenhouse gas impacts of mining and mineral processing operations. J. Clean. Prod. 2010, 18, 266–274. [Google Scholar] [CrossRef]
  14. Xu, L.J.; Yan, J.P.; Xu, S.W.; Makowsky, L. Water Environmental Assessment and Comprehensive Utilization of Subsided water Area in Panji coal mining Area of Huainan city. Procedia Environ. Sci. 2012, 12, 252–257. [Google Scholar] [CrossRef]
  15. Nuriye, P.S.; Muzaffer, Y. Energy consumption and CO2 emissions in Turkey: Empirical analysis and future projection based on an economic growth. Energy Policy 2006, 34, 3870–3876. [Google Scholar]
  16. Kojo, M.; Yemane, W.R. Energy consumption, pollutant emissions and economic growth in South Africa. Energy Econ. 2010, 32, 1374–1382. [Google Scholar]
  17. Abdul, J.; Mete, F. The impact of growth, energy and ffnancial development on the environment in China: A cointegration analysis. Energy Econ. 2011, 33, 284–291. [Google Scholar]
  18. Vogstad, K.O. Input-output analysis and linear programming. In Handbook of Input-Output Economics in Industrial Ecology. Eco-Efffciency in Industry and Science; Suh, S., Ed.; Springer: New York, NY, USA, 2009; pp. 801–818. [Google Scholar]
  19. Hondo, H.; Moriizumi, Y.; Sakao, T. A method for technology selection considering environmental and socio-economic impacts input-output optimization model and its application to housing policy. Int. J. Life Cycle Assess. 2006, 11, 383–393. [Google Scholar] [CrossRef]
  20. Mizunoya, T.; Sakurai, K.; Kobayashi, S.; Piao, S.; Higano, Y. A simulation analysis of synthetic environment policy: Effective utilization of biomass resources and reduction of environmental burdens in Kasumigaura basin. Stud. Reg. Sci. 2006, 36, 355–374. [Google Scholar] [CrossRef]
  21. Yan, J.J.; Sha, J.H.; Chu, X.; Xu, F.; Higano, Y. Endogenous derivation of optimal environmental policies for proper treatment of stockbreeding wastes in the upstream region of the Miyun Reservoir, Beijing. Pap. Reg. Sci. 2014, 93, 477–500. [Google Scholar] [CrossRef]
  22. Chu, J.Y.; Chen, J.N.; Wang, C.; Fu, P. Wastewater reuse potential analysis: Implications for China’s water resources management. Water Res. 2004, 38, 2746–2756. [Google Scholar] [CrossRef] [PubMed]
  23. Xiang, N.; Yan, J.J.; Sha, J.H.; Yan, J.; Xu, F. Dynamic modeling and simulation of water environment management with a focus on water recycling. Water 2014, 6, 17–31. [Google Scholar] [CrossRef]
  24. Oliveira, C.; Coelho, D.; Antunes, C.H. Coupling input-output analysis with multiobjective linear programming models for the study of economy-energy-environment-social (E3S) tradeoffs: A review. Ann. Oper. Res. 2014. [Google Scholar] [CrossRef]
  25. Mahdi, Z. Urban Water Management Using Fuzzy-Probabilistic Multi-Objective Programming with Dynamic Efficiency. Water Resour. Manag. 2010, 24, 4491–4504. [Google Scholar]
  26. Christian, B.H.; Ioannis, B.; Michael, B.; Constantinos, T.; Adisa, A. A multi-period mixed-integer linear optimisation of future electricity supply considering life cycle costs and environmental impacts. Appl. Energy 2014, 133, 317–334. [Google Scholar]
  27. Hristu-Varsakelis, D.; Karagianni, S.; Pempetzoglou, M.; Sfetsos, A. Optimizing production with energy and GHG emission constraints in Greece: An input-output analysis. Energy Policy 2010, 38, 1566–1577. [Google Scholar] [CrossRef]
  28. Cortés-Borda, D.; Ruiz-Hernández, A.; Guillén-Gosálbez, G.; Llop, M.; Guimerà, R.; Sales-Pardo, M. Identifying strategies for mitigating the global warming impact of the EU-25 economy using a multi-objective input-output approach. Energy Policy 2015, 77, 21–30. [Google Scholar] [CrossRef]
  29. Leontief, W.W. The Future of the World Economy; Oxford University Press: New York, NY, USA, 1977. [Google Scholar]
  30. Lee, K.S. A generalized input-output model of an economy with environmental protection. Rev. Econ. Stat. 1982, 64, 466–473. [Google Scholar] [CrossRef]
  31. Forsund, F.R. Input-output models: National economic models and the environment. In Handbook of Natural Resource and Energy Economics; Kneese, A.V., Sweeney, J., Eds.; Elsevier: Philadelphia, PA, USA, 1985. [Google Scholar]
  32. Perrings, C. Economy and Environment; Cambridge University Press: New York, NY, USA, 1987. [Google Scholar]
  33. Freeman, A.M.; Havemen, R.H.; Kneese, A.V. The Economics of Environmental Policy; Wiley: New York, NY, USA, 1973. [Google Scholar]
  34. Wagner, H.M. Linear programming techniques for regression analysis. J. Am. Stat. Assoc. 1959, 57, 206–212. [Google Scholar] [CrossRef]
  35. Hadley, G. Linear Programming; Addison-Wesley Press: New York, NY, USA, 1962. [Google Scholar]
  36. Hillier, F.S.; Gerald, J.L. Introduction to Operations Research; Holden-Day: San Francisco, VA, USA, 1967. [Google Scholar]
  37. Zhang, G.F.; Sha, J.H.; Wang, T.Y.; Yan, J.J.; Higano, Y. Comprehensive Evaluation of Socio-Economic and Environmental Impacts Using Membrane Bioreactors for Sewage Treatment in Beijing. J. Pure Appl. Microbiol. 2013, 7, 553–564. [Google Scholar]
  38. Tan, Q.; Huang, G.H.; Cai, Y.P. Multi-Source Multi-Sector Sustainable Water Supply under Multiple Uncertainties: An Inexact Fuzzy-Stochastic Quadratic Programming Approach. Water Resour. Manag. 2013, 27, 451–473. [Google Scholar] [CrossRef]
  39. China Pollution Source Census. Emission Coefficient Manuals of Industrial and Urban Residents. 2008. Available online: http://cpsc.mep.gov.cn/ (accessed on 15 January 2014). [Google Scholar]
  40. Song, X.M.; Kong, F.Z.; Zhan, C.S. Assessment of water resources carrying capacity in Tianjin city of China. Water Resour. Manag. 2010, 25, 857–873. [Google Scholar] [CrossRef]
  41. Peng, J. MBR Technology Propels China into Water Reuse Era. 2010. Available online: http://www.waterworld.com/articles/wwi/print/volume-26/issue-3/regulars/creative-finance/mbr-technology-propels-china-into-water.html (accessed on 20 October 2010).
  42. Ordos City Planning Board. Urban Overall Planning of Ordos (2011–2030). 2011. Available online: http://www.ordosgh.gov.cn/ghzss/ztgh/201110/t20111031_497090.html (accessed on 12 December 2013). [Google Scholar]

