1. Introduction
Sustainable development was defined in the Brundtland Report [
1] as “development that meets the needs of the present without compromising the ability of future generations to meet their own needs”. This leads to the need for transport systems to be developed in sustainable ways. However, one of the effects of transport systems has been the continuous growth of greenhouse gas (GHG) emissions, among which carbon dioxide (CO
2) is the main one. GHG released into the atmosphere by nature and by human action absorbs part of the infrared radiation reflected by the earth, which makes it difficult for it to escape into space and increases the planet’s warming. The amount of these gases, especially CO
2, resulting from human activity has dramatically grown, leading to an annual increase of average global temperature of 0.85 °C in the period from 1880 to 2012. The 30 years between 1983 and 2012 were warmer than any previous 30-year period in the last 1400 years. In a worst-case scenario, without efforts to reduce the GHG emissions by nations, it is predicted that the average temperature may increase up to 4.8 °C in the next century [
2]. The emissions of CO
2 by transport systems accounts for about 23% of total global emissions coming from fossil fuel consumption, with road transport being responsible for most of these emissions [
3]. It is estimated that, until 2050, fossil energy used in transport systems will double (based on data from 2009), which would increase even more the emission of GHG unless mitigation actions are implemented [
4]. In Brazil, the energy consumed by the transport sector in 2013 represented 32% of the total energy, with an increase of 5.2% in relation to 2012 [
5]. The amount of GHG emitted in that year by the transport sector in Brazil reached 215 million tonnes, measured in CO
2 equivalent (CO
2e), corresponding to 46.9% of total emissions related to the Brazilian energy matrix [
5]. CO
2 emission, given its importance, has been defined by many authors [
6,
7,
8] as one of the indicators of sustainability.
The full sustainability of a transport system, in the sense of zero emissions and impacts, is currently not a realistically achievable goal [
9]. However, the international community agrees that efforts must be made to reduce carbon emissions. Due to this comprehension of the problem, many countries and cities around the world have established emission reduction goals. In preparation for the adoption of the 2015 International Agreement at Paris climate conference in December 2015, several governments were to submit an “intended nationally determined contribution” (INDC).
Table 1 shows the GHG reduction goals of some nations that submitted an INDC.
Table 1.
Intended Nationally Determined Contribution to the Paris Agreement. Source: Climate Action Tracker (CAT) [
10].
Table 1.
Intended Nationally Determined Contribution to the Paris Agreement. Source: Climate Action Tracker (CAT) [10].
| Country | Intended Nationally Determined Contribution |
|---|
| EU | 40% below the 1990 level by 2030 |
| USA | 26%–28% below the 2005 level by 2025 |
| Japan | 26% below the 2013 level by 2030 |
| China | 60%–65% below the 2005 level by 2030 |
| Australia | 26%–28% below the 2005 level by 2030 |
| India | 33%–35% below the 2005 level by 2030 |
| Brazil | 37% below the 2005 level by 2025 |
| Russian Federation | 25% to 30% below the 1990 level by 2030 |
| Indonesia | 26% below the BAU emissions level by 2020 |
| Canada | 30% below the 2005 level by 2030 |
Some cities also established emission reduction goals, with the transport sector having been considered an active contributor to this reduction. London established a carbon emission reduction program to cut emissions by 60% until 2025, based on the year 1999, and the transport sector has made commitments towards this objective [
11]. In Portugal, the city of Porto has established a reduction goal of 45% until 2020, in relation to 2004 [
12], while the city of Lisbon has established a reduction target of 20% between 2013 and 2020, based on the year 2012 [
13]. In New York City, a plan was made to cut emission by 30% until 2030, compared to 2005 [
14]. In Brazil, the city of Rio de Janeiro and the state of São Paulo approved (in 2011 and 2012, respectively) legislation [
15,
16] establishing reduction goals of 20% in transport emissions between 2005 and 2020. In order to reach these goals, many strategies have been applied, such as the use of alternative fuels. The implementation of electric rail systems is also among these strategies [
17]. Generally, these systems have lower level of emissions per passenger kilometer (PKM) than other means of transport. Calculations for high speed rail (HSR) using the average European electricity mix, a load factor of 75% and the consumption of an Alstom train show emissions of around 17 gCO
2/PKM [
18], compared to 30 gCO
2/PKM for a bus. In Brazil, the predominance of renewable energy sources, such as hydroelectric and wind, means an even more favorable electricity matrix, allowing rail system emissions, such as those of the metros of the two biggest cities in the country (São Paulo and Rio de Janeiro), to be around 6 gCO
2/PKM [
19,
20]. These cities have established plans to implement new lines in the metro systems and also light rail transit systems, as strategies to achieve the reduction goals established by legislation.
The purpose of this article is to present and apply a procedure to estimate the energy and CO
2 emissions avoided due to the implementation of passenger rail systems, using the mode shift effect. This procedure is different from others in several aspects: (a) it considers the rail system individually, not the public transportation system as whole, enabling it to be compared with the other private or public transportation systems, such as cars and buses; (b) it uses the real transport profile of the studied region, according to its vehicle fleet; and (c) it considers the vehicles and their fuels, removing from the emission calculations the amount of renewable fuels, used exclusively or in blends with fossil fuels—a reality which has been stimulated in Brazil by government policies. The procedure was applied to the future Line 4 of the Rio de Janeiro Metro (L4), which is 15 km long and has seven stations. L4 will be opened in July 2016 and will connect the downtown area to the western region of the city, a region of high demographic density. The city of Rio de Janeiro will host the Olympic Games in 2016 and the implementation of this metro line, besides being a part of the city’s emission reduction plan, was also deemed mandatory to improve urban mobility during the event [
21], since many events will take place in the region served by the system. For the application of the procedure, a detailed demand forecast prepared by the school/think tank Getulio Vargas Foundation (FGV) was used covering the period from the second half of 2016 to 2040, a total of 24.5 years. Another objective is to find parameters that influence the results of energy and emissions by conducting analyses of different scenarios.
2. Emissions Avoided by Passenger Rail Systems
Passenger rail systems can be large consumers of electricity. The London Metro consumes more than 1 TWh per year, making it the largest individual consumer in London, corresponding to 2.8% of all consumption in the city [
22]. Other systems consume even more electricity, such as those of New York with 3.4 TWh [
23] and Hong Kong with 1.4 TWh [
24]. The generation of this amount of electricity may produce more or less GHG emissions according to the share of fossil fuels in the electricity matrix used. However, it is necessary to compare this amount of emission with that which would have been produced by the transport system in case the rail system had not been implemented. The implementation of this system causes profound changes in the region’s transit. Without the passenger rail system, the region would have a more intense car and bus traffic, and possibly greater amount of carbon emissions. Therefore, the system produces emissions due to the use of electricity and, at the same time, avoids the emissions that would have been produced had it not been implemented.
The emissions produced by the system may be considered as a debit to the system itself. The emissions avoided by the implementation of the passenger rail system become a credit to the system. It can be verified, by the comparison between the debit and the credit, whether the transport system has a positive value of net avoided emissions. For that to happen, the credit must be higher than the debit, with the difference between the two being the net avoided emissions.
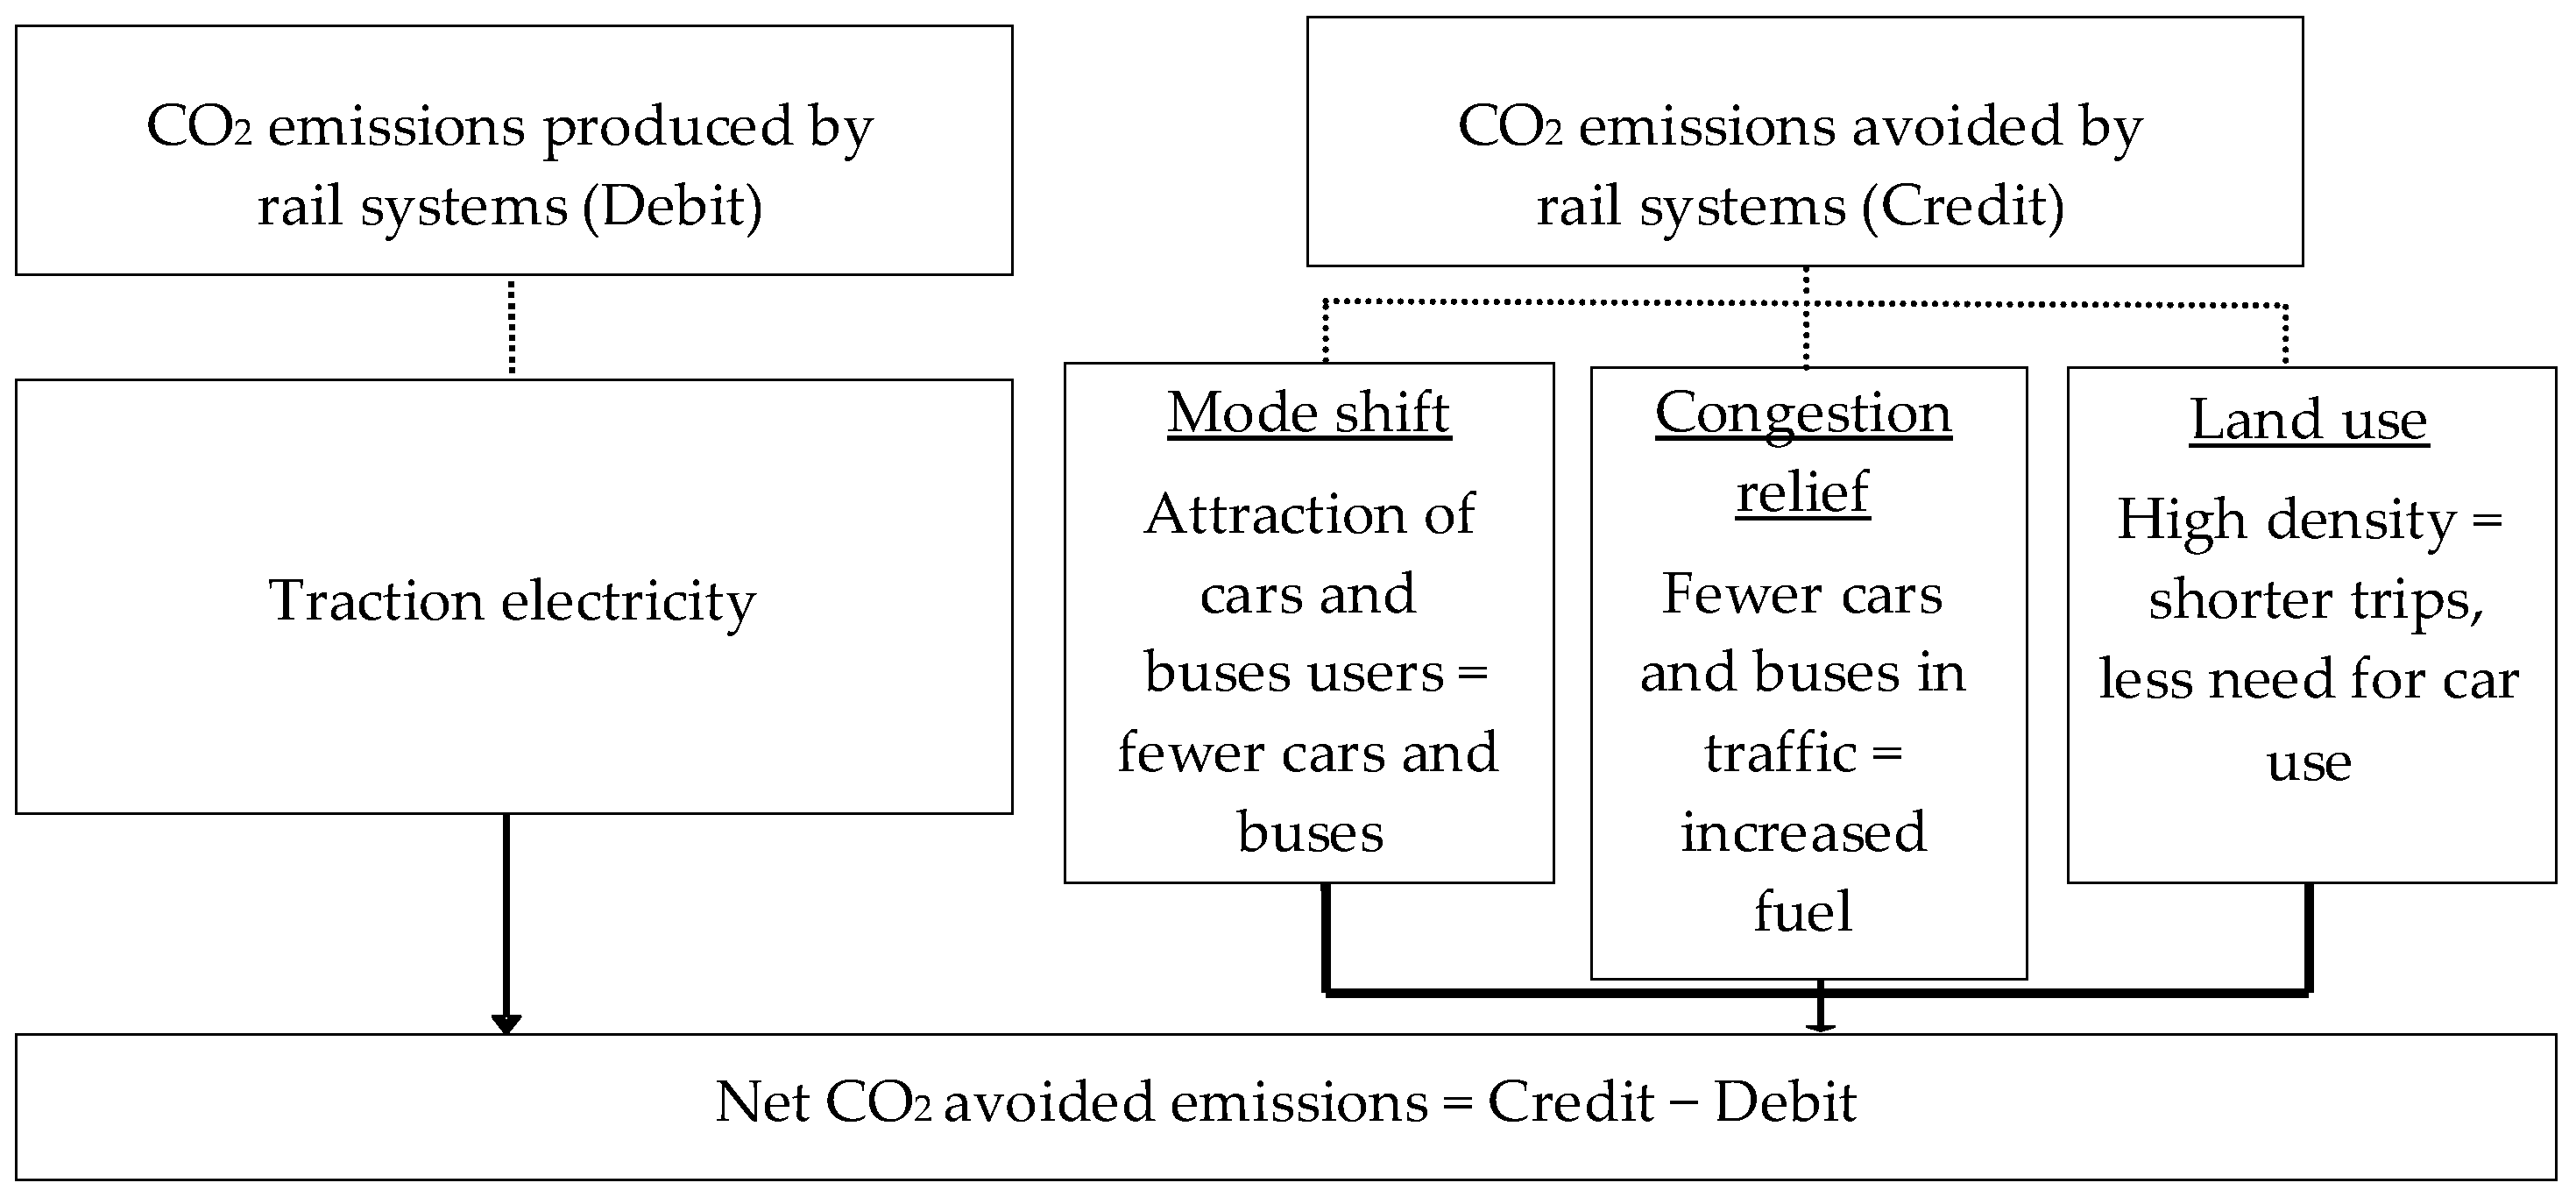
This approach was recommended by the American Public Transportation Association (APTA), which presented a model for determining emissions avoided by public transportation systems. The model adapted to passenger rail systems is presented in
Figure 1. The logic of this approach is to consider that the implementation of the system transforms the traffic profile in the region, thus favoring its use and reducing the use of cars and buses. Fewer cars and buses in traffic mean less CO
2 emissions, not only due to the absence of such vehicles, but also due to the better performance of the remaining vehicles, since there is less traffic congestion. The passenger rail system favors an increase in population density in the region served by it and may encourage users to complement their itinerary with bicycles or short walks, which contributes to a lower use of cars and buses. On the other hand, the absence of this system leads to sprawl in the region, favoring the construction of larger houses and buildings, stimulating greater use of cars for longer trips. The city layouts would then be totally different, with implications to the economy and transport, among other aspects.
The model considers the following elements:
(a) Debit: The emission produced by the generation of electricity used by the passenger rail system. There are two alternatives: considering the value of all the electricity consumed in the operation of the system or only the electric traction energy, responsible for the movement of the trains. Electric traction energy usually ranges from 65% to 75% of total electric energy [
23,
26].
(b) Credit: The emission avoided by the system, which can be divided into the following.
- (1)
Mode shift, which represents the gains achieved by the fact that users of private cars and other means of transport causing higher emissions shift their transport mode of choice and use the system, leading to fewer trips with these higher-emission vehicles.
- (2)
Congestion relief, which represents the gains obtained by less traffic congestion due to the smaller number of vehicles on the streets, leading to better fuel performance by the vehicles still in traffic.
- (3)
Land use, which represents the gains obtained by a higher population density. In this situation, people need shorter trips and use fewer cars. The use of bicycles and walking is increased since they can complement rail trips.
Figure 1.
Impacts of a passenger rail system on CO
2 emissions [
25].
Figure 1.
Impacts of a passenger rail system on CO
2 emissions [
25].
2.1. Mode Shift
If the public transportation system did not exist, its users would choose another option. In APTA’s study [
25], the options were: using cars, giving up the trip, or carrying it out on foot or by bicycle. The mode shift factor represented, therefore, the percentage of public transportation users that would begin to use cars. Thus, the value 0.47 means 47% of the users would choose cars and 53% would either not make the trip, or make it on foot or by bicycle.
There are four ways that are most commonly used to estimate the mode shift factor [
27]: The first is to simulate the absence of the public transportation system in trip demand models. This requires a great amount of data and complex algorithms that take into consideration many factors, such as level of utility of transport mode choices for the users, socioeconomic conditions of the users, and others. A preliminary study was used by the New York Metropolitan Transport Authority (MTA) [
25,
27], collecting New York trip data between 2000 and 2006. Quantifying the growth in transit trips from 2000 to 2006, a mode shift factor of 0.29 was found in the central region of New York, which can be explained by the higher population density, favoring walking and the use of bicycles and lower car ownership. As for Long Island, the mode shift factor reached 0.92, showing the lower population density and the higher car ownership.
The second is to verify the effect of long interruptions in the public transportation system’s service, such as strikes [
25,
27]. This approach was used during the public transportation strikes in New York in 2005 and Los Angeles in 2003.
The third is to survey users’ trip preferences [
25,
27]. It is recommended to ask users which option they would choose in the absence of the public transportation system, offering the options: driving individually, using a vehicle with a driver, carpooling with shared vehicles, using taxi, walking, using bicycles, and not making the trip.
Finally, the fourth is to use a set of standards built based on the size of the population. This last alternative is used when the others are not viable. It is assumed there is a direct connection between the users that migrate to car use and the population served by the system [
25,
27].
2.2. Congestion Relief
In the absence of the public transportation system, many users would use private vehicles, increasing the traffic on roads. The effect produced would be an increase in congestion, decreasing average speed, consuming more fuel and increasing CO2 emissions. The concept of congestion implies the determination of a limiting point, which if surpassed defines the existence of congestion. This limiting point is a value defined by the volume/capacity ratio. The segments of roads that present a value above this one are considered congested. The congestion effect, then, can be estimated by the additional quantity of consumed fuel. In order to do this estimation, it is necessary to have a large database of the main roadways, with data on speed collected for time ranges.
2.3. Land Use
In regions with high population density, diverse land use and an efficient integrated public transportation system, people have less need to use cars than in regions with low population density. Increasing population density and at the same time implementing a good public transportation system is, therefore, an efficient way to minimize carbon emissions.
The MTA model [
28] suggests two methods for the assessment of land use impact: (a) a method that is based on geospatial analysis of proximity to public transportation; and (b) a method that uses a series of comparisons between land use and the value of vehicle kilometers (VKM) in regions with diverse land use.
The MTA applied APTA’s model to the public transportation system of New York in 2008, using mathematical models and a large database. According to this study, supposing the public transportation system is absent, the traffic pattern was simulated in three scenarios: (a) the pattern would be the same as that of New York and New Jersey suburban areas; (b) it would be the same as the average pattern of cities in the country; and (c) it would be the same as that of an emerging southern transit city (
i.e., Atlanta). In the most conservative result, the MTA emitted around two million tonnes of GHG, but it avoided the emission of 17 million tonnes. This result shows that 4717 grams of GHG emission per passenger-trip were avoided [
28,
29].
2.4. Results of Emissions Avoided by Passenger Rail Systems
Congestion relief and land use are less used techniques due to their greater complexity. It is more common to use only mode shift.
Table 2 presents the results of emissions avoided released by selected passenger rail systems. The differences in the results are due to different characteristics of the systems and methods used.
Table 2.
Emissions avoided by passenger rail systems.
Table 2.
Emissions avoided by passenger rail systems.
| Rail System | Avoided Emissions (t CO2) | References |
|---|
| MTA-New York a | 15,000,000/year | [29] |
| Los Angeles Metro | 12,997,000/year | [26] |
| RENFE-Spain | 2,460,488/year | [30] |
| Lisbon Metro-Portugal | 130,275/year | [31] |
| Porto Metro-Portugal | 46,996/year | [32] |
| Sao Paulo Metro-Brazil | 820,000/year | [20] |
| California High Speed Rail (Project) | 1,150,000/year | [33] |
| LGV Mediterranean (Valence-Marseille) (Project) | 237,000/year | [34] |
| HSR-4500 km-France (Project) | 1,000,000/year | [35] |
| Bangalore Metro-India (Project) | 2200/km-year | [36] |
3. Emissions Avoided by L4 in the Period from Second Half of 2016 to 2040
We used well to wheel (WTW) for energy and CO2 emissions of L4, cars and buses. WTW is the sum of well to tank (WTT) and tank to wheel (TTW). WTT refers to the production of energy/fuel and transport to the vehicle. TTW refers to the use of the vehicle. For L4 trains, powered by electricity, WTW = WTT, since there is no direct combustion (TTW = 0).
In order to estimate emissions avoided by L4 it is necessary to:
1. Estimate the transport performance of L4 in PKM. This is related to the L4’s capacity of attracting users. The greater the number of users, the greater will be the amount of PKM. Each user will travel from an origin (a rail station) to a destination (another rail station). For a given origin–destination (O–D) pair, PKM will be obtained by multiplying the number of users traveling by the distance between this O–D pair. Thus, for a given time period, total PKM can be expressed by the summation of PKM of all O–D pairs:
where
pij is the number of passengers traveling from an origin
i to a destination
j and
dij is the distance between origin
i and destination
j.
2. Calculate L4 energy and CO
2 emission debit. This is a function of train scheduling and load. The train load affects the train weight. In a given time period, the greater the train load or the number of train departures, the greater will be the amount of electricity consumed. A train usually consists of a number of individual parts (cars). Each car has a consumption value for electricity depending on its passenger load. Consideration is only given to the traction electricity with transmission and losses. The emission factor is given by the Brazilian government, since the electricity network is nationally integrated. In this way, for a given time period, energy can be estimated by:
where
En is the Energy consumption;
c is the number of car-km and
Ec is the Energy consumption per car-km.
The number of car-km can be expressed as:
where
c is the number of car-km;
d is the number of train departures;
l is the distance traveled per departure and
n is the number of cars per train.
CO
2 emissions can be expressed by:
where
Em is the CO
2 emissions;
En is the Energy consumption as per Equation (2) and
Ef is the CO
2 emission factor per unit of energy.
3. Estimate the L4 energy and CO
2 emissions credit by assuming that the expected transport performance is split between cars and buses based on the proposed modal shift values. Several parameters influence the estimation. The first one is the L4 transport performance, that is, the value of PKM. Other parameters are: the percent of cars and buses where PKM will be split, leading to VKM of each type of vehicle; the fuels used in these vehicles according to the vehicle fleet of the city; the vehicles’ load and efficiency. The emission factors of fuels refer only to the TTW phase; that is, CO
2 emissions during its burning. For a given time period, the quantity of VKM by each kind of vehicle can be expressed by:
where
PKM is the PKM summation according to Equation (1);
% vehicle is the % of PKM shifted from a kind of vehicle and
l is the number of passengers by kind of vehicle (load).
For a given time period, the quantity of each fuel consumed (
Qf) by each kind of vehicle can be expressed by:
where
VKM is calculated by Equation (5) and
e is the fuel efficiency, that is, units of distance traveled per unit volume of fuel burned.
The corresponding energy is:
where
Qf is the quantity of fuel, as in Equation (6), and
Ed is the energy density per unit of fuel.
The corresponding CO
2 emission is:
where
Qf is the quantity of fuel, as in Equation (6), and
Ef is the CO
2 emission factor per unit of fuel.
3.1. Transport Performance of L4 in PKM in the Period from Second Half of 2016 to 2040
The demand forecast study for L4 [
37] was carried out with a methodological approach that used revealed and stated preference survey techniques, together with the specification of logit mode choice mathematical models, commonly used in transport planning to estimate market share; that is, mode transfers between buses and metro or cars and metro, among others. It is therefore perfectly adequate to model the introduction of a metro line in a market. Aiming to forecast the demand attracted by L4, that study applied a system of discrete mode choice mathematical models, opting for the use of data obtained by stated preference.
Discrete choice modeling using data from stated preferences involves the presentation to the consumer of hypothetical scenarios in which the product or service in question is described as a combination of attributes (for example, trip time, cost, number of transfers, probability of available seating). The consumers, in each scenario, choose the alternative that best meets their needs, given the proposed context of choice. The choices made in these hypothetical scenarios, as well as specific data on each consumer, are used to estimate an econometric model that enables the analyst to determine, among other factors, the value given to each attribute of the product or service, and the impact that changes in the configuration of attributes have on the demand for the product or service.
Data collection for this survey was carried out with transport system users during trips that were being made by car or bus between an O–D pair located inside the metro’s catchment area. The future projections were based on urban and socioeconomic growth data.
Data collection considered the three morning peak hours on business days. O–D matrices were created for the three morning peak hours (6:30 a.m. to 9:30 a.m.) on business days for the years 2016, 2026, 2036 and 2040. The O–D matrix provides the number of passengers that embarked at a given “A” station and disembarked at a given “B” station, enabling, based on the distance between “A” and “B”, calculation of the system’s PKM. The matrices were formulated with the purpose of fully separating the load of L4 from that of the other lines of the rail system.
Based on these data, the procedure developed to determine the value of PKM was:
- (1)
Estimate the value of PKM for the three morning peak hours on business days in the year 2016. For that, the O–D matrix and the matrix of distances between stations [
38] were used. Applying Equation (1), the total PKM, in 2016 reached 643,638 PKM during the three morning peak hours on business days.
- (2)
Estimate the value of PKM for the three evening peak hours and the remaining hours of business days. For that, the same proportion observed for the remaining lines of the system was used between these time ranges. The proportions observed were: morning peak hours are equivalent to 20.70% of the day, evening peak hours are equivalent to 25.80% of the day, and remaining off-peak hours are equivalent to 53.50% of the day [
38]. That way, the total PKM value of one business day is obtained; in 2016, this was estimated to be 3,109,362 PKM.
- (3)
Estimate the value of PKM on Saturdays, Sundays and holidays, using the same proportion known for these days, in relation to business days, for the other lines of the system. The proportions observed were: Saturdays are equivalent to 39% of a business day, Sundays are equivalent to 21% of a business day and holidays are equivalent to 23% of a business day [
38]. With that, the values obtained were 1,212,651 PKM on Saturdays, 652,966 PKM on Sundays and 715,153 PKM on holidays.
- (4)
Estimate the annual value of PKM considering the values for business days, Saturdays, Sundays and holidays in 2016. The value obtained was 887,007,658 PKM in 2016. However, as L4 will begin operation in the second half of 2016, half of the above value was used, which is 443,503,829 PKM.
- (5)
Repeat the procedures from 1 to 4 for the years 2026, 2036 and 2040.
- (6)
Calculate the average increase in PKM between 2016 and 2026 and apply it to the intermediate years from 2017 to 2025.
- (7)
Calculate the average increase in PKM between 2026 and 2036 and apply it to the intermediate years from 2027 to 2035.
- (8)
Calculate the average increase in PKM between 2036 and 2040 and apply it to the intermediate years from 2037 to 2039.
Having obtained the value of PKM for each year, the sum of these values provides the value of PKM for the analyzed period (second half of 2016 to 2040), reaching 30,504,632,189 PKM.
3.2. L4 Energy and CO2 Emission Debit in the Period from Second Half of 2016 to 2040
A detailed departure schedule, with 15 trains, was established [
38] in order to meet the demands of L4, enabling the calculation of the offer of PKM. Each train has a fixed number of six cars. The reference load is: all seats used and 6 passengers/m
2 in the free areas = 1820 passengers per train. The average load in the period (PKM demand ÷ PKM offer) results in 29.09%. The departure schedule also enables the estimation of the number of car kilometers traveled, which was 14,107,891 car-km per year by applying Equation (3). This figure is important to enable the estimation of electricity needed to operate the trains. Tests carried out by the Rio de Janeiro Metro [
38] indicated that the average energy consumption of each car varies from 2.97 to 4.80 kWh per kilometer traveled, with the first value representing an empty car and the second value representing the car during peak hours, with 357 passengers (the reference load for each car is 1820/6 = 303 passengers, so that load is about 118% of the reference load). The values of the energy consumption are proportional to passenger load [
38]. The consumption per car-km “
c” for “
n” passengers is, therefore:
The consumption can also be expressed as a load function:
The value corresponding to the average passenger load of 29.09% is, applying Equation (10), 3.42 kWh per car-km [
38]. Applying Equation (2) results in a total energy consumption value per year of 14,107,891 × 3.42 = 48,248,987 kWh.
We assume that the losses in the Brazilian interconnected network are 4% in transmission losses [
39] and 8% in distribution losses [
40], with a total of 12%, which will increase generated energy per year to 54,828,394 kWh. In the period from the second half of 2016 to 2040, the total energy will be 24.5 × 54,828,394 = 1,343,296 MWh.
Applying the Brazilian electrical energy emission factor of 0.1355 tCO
2/MWh [
41], the operational emissions due to energy use forecast for the period from the second half of 2016 to 2040 will reach a total value of 182,017 t CO
2, according to Equation (4). This value can be higher or lower according to the future variation of the energy emission factor. The future estimation of this value is a complex task that depends on how the Brazilian electricity matrix composition will behave. This composition will depend on the available resources, exploitation costs of these resources, and investments effectively applied, besides other factors, such as the governmental commitments regarding the generation of clean energy and environmental factors, in particular the higher or lower incidence of rain and wind. The Brazilian government’s Ten-Year Energy Plan [
42] envisions that by 2021 the Brazilian electricity matrix should increase its share of renewable sources. The matrix in 2015 had 74.60% of the energy coming from renewable sources [
43]. The hydroelectric power share will decrease, but the wind power share will increase. The plan, therefore, assumes that the matrix will remain clean, which means that the emission factor should not increase significantly.
3.3. Energy and Emissions Avoided by L4 in the Period from Second Half of 2016 to 2040
According to [
37], of the users attracted by L4, 28% would shift from cars and 72% from buses. Brazil has different technological options to make transport more sustainable [
44], such as the use of alternative fuels in cars and buses, which in a certain way reduces the emissions from these vehicles. Nevertheless, in general they continue to emit more per PKM than rail systems powered by electricity, since the Brazilian electricity system has high participation of renewable sources and a low emission factor.
Based on these data, the procedure developed was:
- (1)
Calculate, for all years of the analyzed period, the quantity of VKM corresponding to the PKM of each replaced transport mode, that is, buses and cars. The passenger loads assumed for buses were 80 passengers during peak hours and 40 passengers at other times, and for cars the value assumed was 1.4 passengers. Equation (5) was applied.
- (2)
Determine, based on the VKM of each replaced transport mode, the quantity of each fuel that would be consumed and the subsequent energy and emission that would be avoided. Equations (6)–(8) were applied.
Nearly all the cars circulating in the city were manufactured to use either gasoline only, hydrous ethanol only, or a blend of gasoline and hydrous ethanol, in any proportion (flex-fuel). It is also possible to adapt cars to run on compressed natural gas (CNG), which has been done by a portion of users. The use of diesel cars is not allowed (only buses and trucks). The proportion of each car type and its fuel was obtained from the vehicle database of the Rio de Janeiro municipal government [
45]. Gasoline supplied has a mandatory portion of anhydrous ethanol and diesel has a portion of biodiesel, in blends regulated by the government. The study did not take into consideration the emissions (TTW) from the amounts of anhydrous ethanol present in gasoline, and biodiesel present in diesel, according to the proportions effective in 2015 (27% anhydrous ethanol and 7% biodiesel) because these emissions are considered neutral, since they have already been absorbed during the growth of the plant sources. Likewise, hydrous ethanol emissions were not included in the calculations. For vehicles that also use CNG, we assumed that this fuel will be used, since it is much cheaper.
For the flex-fuel vehicles, we assumed that the main parameter influencing choice by the user is the relative price of ethanol and gasoline. This occurs because on average, ethanol’s efficiency is worse than gasoline. If the ethanol price is greater than 70% of gasoline’s price, it will be more expensive to use ethanol. To find the percentage of ethanol use in flex-fuel vehicles, COPPETEC [
46] developed Equation (11), valid for a price relation between ethanol and gasoline between 60% and 80%.
According to the Brazilian National Agency of Petroleum, Natural Gas and Biofuels (ANP) [
47], the prices of these fuels in the municipality of Rio de Janeiro have been inside this range in all years, therefore justifying the use of Equation (11) in this study.
In order to determine the energy consumed, we used energy density with values of 40.82 MJ/L for diesel, 43.07 MJ/L for biodiesel [
46,
48], 36.36 MJ/L for gasoline, 33.71 MJ/L for hydrous ethanol, 24.60 MJ/L for anhydrous ethanol and 39.82 MJ/m
3 for CNG [
46,
49].
For the definition of CO
2 emissions, the emission factors of diesel (2.95 kgCO
2/L) and gasoline (2.57 kgCO
2/L) were calculated based on the Intergovernmental Panel on Climate Change (IPCC) [
50], ANP [
47] and D’Agosto [
48,
49]. The CNG emission factor used was 2.16 kgCO
2/m
3 [
46,
49]. We used 0.02 kgCO
2/L for anhydrous ethanol, 0.09 kgCO
2/L for hydrous ethanol [
49] and 0.40 kgCO
2/L for biodiesel [
48].
The results obtained for fuels, energy and emissions for the analyzed period (by applying the Equations (5)–(7), respectively) are presented in
Table 3.
Table 3.
Fuels, energy and CO2 emissions avoided by Rio de Janeiro Metro Line 4 (second half of 2016–2040).
Table 3.
Fuels, energy and CO2 emissions avoided by Rio de Janeiro Metro Line 4 (second half of 2016–2040).
| Avoided |
|---|
| Fuel Variables | Gasoline | Diesel | CNG | Biodiesel | Anhydrous Ethanol | Hydrous Ethanol |
|---|
| Quantity a | 307 | 170 | 109 | 13 | 114 | 68 |
| Energy (TJ) | 11,165 | 6956 | 4334 | 552 | 2794 | 2292 |
| CO2 Emissions (t CO2) | 789,198 | 502,683 | 235,118 | 5130 | 2272 | 6119 |
In fact, the avoided emissions are higher, since this model does not consider that the O–D matrix of FGV found that many trips that begin or end in L4 have as destination or origin a station from other lines, that is, these trips will have PKM and VKM values higher than those found in the calculations, where only the segments traveled in L4 were considered. Other factors that were not considered, due to the lack of available data in Brazil, but that would increase the value of emissions avoided, were congestion relief and land use. The use of L4 reduces congestion of road segments, which will result in benefits from less burned fuel.
3.4. Energy and Net Emissions Avoided by L4 in the Period from Second Half of 2016 to 2040
Table 4.
Rio de Janeiro Metro Line 4-Energy and CO2 emissions results (second half of 2016–2040).
Table 4.
Rio de Janeiro Metro Line 4-Energy and CO2 emissions results (second half of 2016–2040).
| Avoided (Credit from Mode Shift) |
| Total Energy | 28,094 TJ |
| Total Non-Renewable Energy | 22,456 TJ |
| Total Renewable Energy | 5638 TJ |
| Total CO2 Emissions | 1,540,519 t CO2 |
| Produced (Debit from Rail System) |
| Total Energy | 4836 TJ |
| Total Non-Renewable Energy | 1228 TJ |
| Total Renewable Energy | 3608 TJ |
| Total CO2 Emissions | 182,017 t CO2 |
| Net Avoided (=Credit − Debit) |
| Total Energy | 23,258 TJ |
| Total Non-Renewable Energy | 21,227 TJ |
| Total Renewable Energy | 2031 TJ |
| Total CO2 Emissions | 1,358,503 t CO2 |
Results per year and per PKM are shown in
Table 5.
Table 5.
Rio de Janeiro Metro Line 4-Energy and CO2 emissions per year and passenger kilometer (PKM) (second half of 2016–2040).
Table 5.
Rio de Janeiro Metro Line 4-Energy and CO2 emissions per year and passenger kilometer (PKM) (second half of 2016–2040).
| Net Avoided per Year |
| Total Energy | 949 TJ |
| Total Non-Renewable Energy | 866 TJ |
| Total Renewable Energy | 83 TJ |
| Total CO2 Emissions | 55,449 t CO2 |
| Net Avoided per PKM |
| Total Energy, PKM | 0.76 MJ/PKM |
| Total Non-Renewable Energy | 0.70 MJ/PKM |
| Total Renewable Energy | 0.07 MJ/PKM |
| Total CO2 Emissions, PKM | 44.53 gCO2/PKM |
4. Analysis of Alternative Scenarios
There are some key parameters that influence the results. In order to analyze the influence of these parameters, the calculations were redone considering six scenarios. In each scenario, one parameter varies while the others remain constant, unless they are interdependent. A comprehensive analysis was performed. The goal was to analyze, for each scenario, the changes in net energy and CO2 emissions avoided per year.
The fist scenario was proposed to investigate parameters related to L4 transport performance:
Scenario A: The PKM value will increase, making passenger load equal to 50%. In this case, debit and credit will be affected. The PKM increases without changing the schedule. Keeping the same number of train departures, the increase in load will be due to the higher number of passengers using the service. This affects the debit, increasing the energy consumption due to the train’s higher total weight because it will be carrying more passengers. The importance of the passenger load in GHG emissions per PKM has been shown in other studies [
51,
52]. Credit is also affected because the greater PKM will result in more car and bus trips.
To investigate parameters related to debit, two scenarios were assumed:
Scenario B: Train departures decrease 30%, increasing passenger load.
Scenario C: The electricity mix has higher carbon intensity. The average European emission factor of 2015 (0.35047 kgCO
2/kWh) was used [
53].
Parameters related to credit were approached in three scenarios:
Scenario D: There is no consumption of alternative fuels. All cars use gasoline and all buses use diesel.
Scenario E: The passenger load of cars increases to three passengers.
Scenario F: The proportion of cars and buses changes from 28% to 42% for cars (50% increase) and from 72% to 58% for buses.
Table 6 presents the results found for the six alternative scenarios compared to the result of the main study.
Table 6.
Rio de Janeiro Metro Line 4 Net energy and CO2 emissions avoided per year in Scenarios A, B, C, D, E and F (second half of 2016–2040).
Table 6.
Rio de Janeiro Metro Line 4 Net energy and CO2 emissions avoided per year in Scenarios A, B, C, D, E and F (second half of 2016–2040).
| Net Avoided per Year | Study Results | Scenario A | Scenario B | Scenario C | Scenario D | Scenario E | Scenario F |
|---|
| Total Energy | 949 TJ | 1754 TJ | 1001 TJ | 949 TJ | 1013 TJ | 501 TJ | 1310 TJ |
| Total Non-Renewable Energy | 866 TJ | 1520 TJ | 880 TJ | 787 TJ | 1161 TJ | 529 TJ | 1128 TJ |
| Total Renewable Energy | 83 TJ | 234 TJ | 121 TJ | 162 TJ | −147 TJ | −28 TJ | 182 TJ |
| Total CO2 Emissions | 55,449 t CO2 | 99,921 t CO2 | 57,389 t CO2 | 43,663 t CO2 | 78,630 t CO2 | 32,968 t CO2 | 72,494 t CO2 |
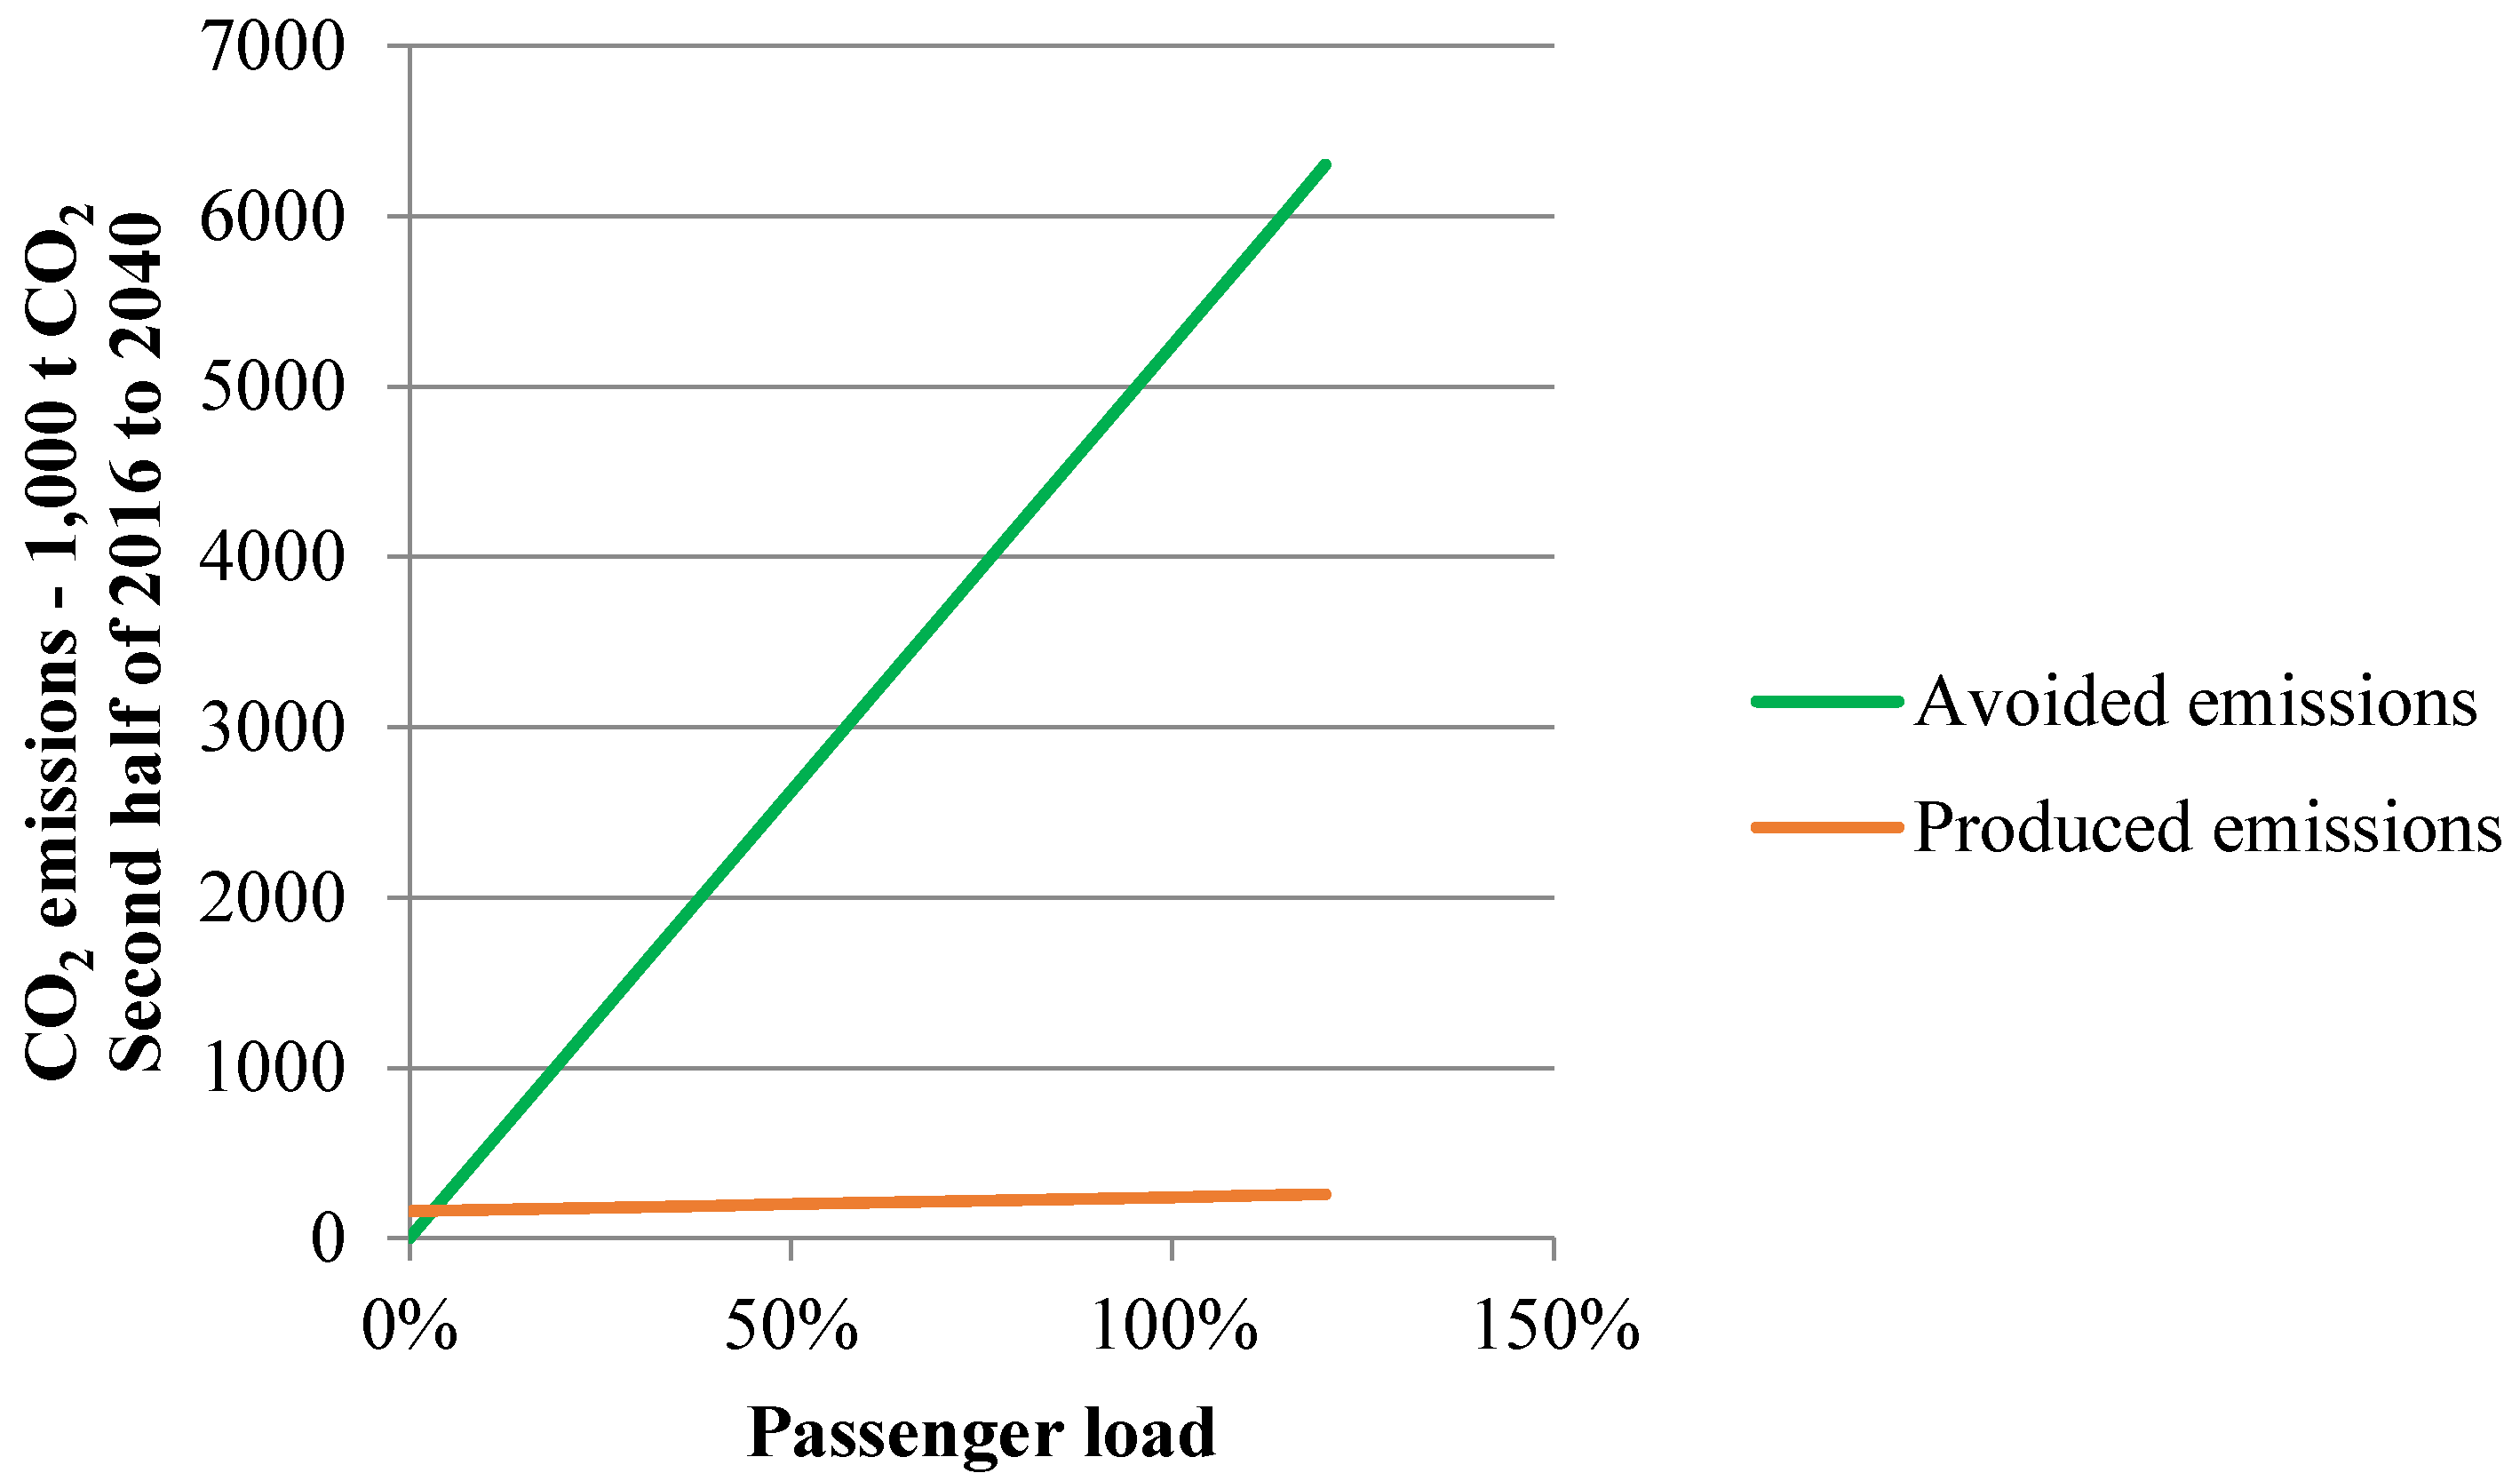
In scenario A, the net avoided energy increases because the increase in avoided energy is much greater than the increase in electricity consumed. The net avoided emissions increase significantly (80%) because the system managed to attract a greater number of users, avoiding higher burning of fossil fuels. Therefore, the greater the passenger load, the greater the avoided emissions, thus increasing the advantage of rail systems.
As this parameter changes the debit and credit values, a sensitivity analysis was performed, for the period from second half of 2016 to 2040, as shown in
Figure 2. It can be seen that as passenger load increases, avoided emissions increase more than produced emissions. This is a crucial parameter. While produced emissions grow, but remain below 300 thousand t CO
2, avoided emissions grow from zero to more than 6000 thousand t CO
2.
Figure 2.
Sensitivity analysis of L4 transport performance.
Figure 2.
Sensitivity analysis of L4 transport performance.
If the system has low passenger load, the avoided emissions will decrease. There is a minimum passenger load, corresponding to a neutral effect (net avoided emissions = 0). Below this level, the rail system will not reduce emissions. This minimum passenger load is determined by:
where
Lmin is the minimum % passenger load value;
Ep is the produced emissions (debit);
Lb is the base load (load for known values of produced and avoided emissions);
Ea is the avoided emissions (credit).
The values of Ep, Lb and Ea were calculated in Items 3.2 and 3.3, therefore:
Lmin = (182,017 × 29.09%)/1,540,519 = 3.44%. This value corresponds to 147,085,834 PKM per year. Below this minimum passenger load, L4 will not be able to produce net avoided emissions.
In Scenario B, the schedule is decreased by 30% and PKM remains the same. Passenger load will increase. This affects debit in two ways: fewer train departures reduce energy but high load increases. Credit is not affected, since PKM does not change. In the end, energy and emissions increase slightly (around 5% and 3%, respectively).
In Scenario C, only the electricity matrix changes, being one of higher emissions. With that, energy use maintains the same value, but the avoided non-renewable energy decreases, since the matrix is more carbon intensive. The values of renewable and non-renewable energy were defined by approximation, since the emission factor used is an average estimated for Europe. We considered proportionality to the Brazilian electricity matrix. The emissions avoided decreased 21%, reducing the advantage of rail systems over cars and buses. The higher the share of fossil sources in the generation of electricity, the lower will be the emissions avoided. Hence, there may theoretically be a point at which the emissions avoided equal zero, thus nullifying the advantage of the rail system. In fact, this point corresponds to an emission factor estimated by:
where
Ef is the electricity emission factor, in kgCO
2/kWh, where net avoided emissions is equal to zero;
ae is the avoided emissions in kgCO
2;
n is the number of years; and
E is the electric energy in kWh/year.
Applying Equation (13) with values calculated in Item 3.2:
Ef = 1,540,519 × 1000/(24.5 × 54,828,394) = 1.14682 kgCO2/kWh. With electricity emission factors above this value, the rail system will not produce positive net avoided emissions in the analyzed period.
In Scenario D, since there is no use of alternative fuels by cars and buses, the use of fossil fuels increases and, with that, the net avoided emissions increase by 42%. There is also an increase in energy, which in this context is totally non-renewable in cars and buses. This implies a negative value for net avoided renewable energy. This scenario is useful when the intent is to show the environmental advantages of rail systems compared to vehicles running on fossil fuels.
In Scenario E, the average passenger load of cars is set at three. Avoided energy and emissions have a large decrease, around 68% for emissions and 89% for energy. Net avoided renewable energy has a negative value because its credit value is lower than the debit value. If the load were five passengers, the decrease in emissions would be around 121%. This highlights the importance of carpooling.
In Scenario F, the proportion of cars and buses changes to 42% for cars (growth of 50%) and 58% for buses (against 28% and 72%, respectively). This could happen if more car users are attracted by L4. As cars are usually higher emitters per PKM than buses, increasing attraction of car users will increase net avoided energy (38% more) and emissions (31% more).
5. Conclusions
Passenger rail systems powered by electricity can contribute to the reduction of GHG emissions of the transport system and make it more sustainable. The condition for that result is that the rail system emission per PKM be lower than that of the replaced transport modes. The procedure developed to determine energy and net avoided emissions was applied to Rio de Janeiro Metro Line 4 and resulted in an annual net reduction of 55.45 thousand tonnes of CO2 and 949 million MJ, with 91% of this energy corresponding to non-renewable energy. Each passenger kilometer resulted in net avoided emissions of 44.53 gCO2 and avoided non-renewable energy consumption of 0.70 MJ.
The main factors involved in this analysis are the electricity matrix used, the system’s passenger load and the level of alternative fuel use in the replaced transport modes, fuels such as ethanol, biodiesel and electricity.
The study was limited by lack of data in Brazil about traffic congestion and land use. If these effects were considered in addition to mode shift, certainly the net avoided emissions would increase. The uncertainties inherent to demand forecast studies were treated through scenario analysis. We showed for L4 that even with lower passenger load (greater than 3.44%) or high electricity emission factor (lower than 1.14682 kgCO2/PKM), its operation will have a positive effect on emissions. However, the growing use of alternative fuels in cars and buses can, in the near future, reduce the advantage of rail systems.
The study may be expanded with the inclusion of other greenhouse gases found in the operation of cars and buses and generation of electricity. Further research in Brazil is necessary to determine more accurate emission factors according to Brazilian fuels and vehicles.
Another improvement would be the inclusion of life cycle assessment, considering the energy and emissions beyond WTW, that is, including phases like vehicle manufacturing, maintenance and final disposal, and, in the case of electricity generation, the life cycle phases associated with each kind of source (hydro, wind, nuclear, fossil, etc.).


