Article

Variations in the Use of Resources for Food: Land, Nitrogen Fertilizer and Food Nexus

by
María José Ibarrola-Rivas
1,* and
Sanderine Nonhebel
2
1
Instituto de Geografía, Universidad Autónoma de México, Investigación Científica S/N, Ciudad Universitaria, CP 04510 Ciudad de México, Mexico
2
Center for Energy and Environmental Sciences, University of Groningen, Nijenborgh 6, 9747 AG Groningen, The Netherlands
*
Author to whom correspondence should be addressed.
Sustainability 2016, 8(12), 1322; https://doi.org/10.3390/su8121322
Submission received: 16 September 2016 / Revised: 31 October 2016 / Accepted: 6 December 2016 / Published: 15 December 2016
(This article belongs to the Special Issue Food-Energy-Water Nexus: Towards New Thinking and Action)

Abstract

:
Future dietary changes will increase the global demand for agricultural resources per person. Food production requires several resources which are interrelated: land, water, nutrients and energy. Other studies have calculated the per capita requirements of only one resource (nitrogen or land). In this paper, we combine several parameters (diets, production systems and nitrogen-land trade-off) in one analysis in order to provide a more integrated assessment of the impacts of the use of agricultural resources for food. We estimated the trade-off between the per capita use of synthetic nitrogen fertilizer and crop land. With our methodology, we are able to identify separately the impacts of the type of diet and of the type of production system. We use national level data of five countries as examples of global extremes: from extensive to highly intensive systems, and from very basic diets to very affluent diets. The present differences in diets and production systems result in large differences in the per capita use of resources which ranges from 3 to 30 kg of nitrogen fertilizer use per person, and from 1800 to 4500 m2 of arable land use per person. As the results show, in 2050, the average per capita availability of crop land will not be enough to produce food for affluent diets with present production systems. Our results are useful to assess future requirements of nitrogen fertilizer for the limited land available on the planet.

1. Introduction

In the coming decades, more food will be needed due to global population growth and dietary changes in line with affluent consumption patterns [1,2]. Currently, the largest share of food is produced in arable land which has the highest quality soils [3], and most of the global area suitable for arable land is already in use. The FAO projects that a future increase of food production will result mainly from increasing crop yields and not from agricultural expansion [3]. Alexandratos et al. [3] show that agricultural expansion has been slowing down in the last decades and it is expected to slow down further from 28% in the period of 1961–2007 to 10% in the period of 2007–2050. Crop yields on a global scale have doubled in the last 50 years in combination with a strong increase in artificial nitrogen fertilizer [4]. From the 60s to nowadays, the global use of artificial nitrogen fertilizer has increased 10 fold: from 11 Mtones to 120 Mtones [4]. Therefore, future increase of crop yields will come in combination with the increase of yield-related-inputs such as fertilizer use and irrigation, especially in developing countries [5,6].
The use of nitrogen fertilizer has had enormous consequences on the global nitrogen cycle [7,8,9,10,11]. Between 1950 and 2000, the nitrogen surplus on arable land has increased globally by a factor of 7 [8] causing major local environmental problems. However, differences exist throughout the world in which some regions experience strong local pollution (e.g., eutrophication in Eastern Asia) [12] due to nitrogen surpluses, and other regions are experiencing nitrogen scarcity causing soil depletion (e.g., in Africa) [13]. Future increase in crop yields would require an efficient use of nitrogen and land to minimize potential environmental problems.
Recently, several papers have been published about food production and its use of resources [14,15]. A special type of research are footprint studies based on measuring the use of resources per person [16,17,18,19,20,21,22]. These studies calculate the amount of resources needed to produce one food item or the food that a person consumes in one year. These studies have shown the strong impact of type of diet on the use of agricultural resources. In general, diets with large consumption of animal products require more resources than vegetarian diets. This type of studies requires very detailed analysis since they determine the amount of resources for each individual food product. As a result, these studies are able to analyze a limited set of parameters: only one resource (land [17,18], water [16] or nitrogen [19,21]), only one country and, as a result, only one dietary pattern (affluent diets from developed countries [20,22]).
The production of food requires several inputs: land, water, nutrients, energy, labor and others. These inputs are related and their use results in trade-offs among each other. For instance, the use of fertilizer results in an increase of crop yield and, therefore, in a lower use of land: trade-off between land and nitrogen. The use of machinery reduces the use of human labor, but results in a higher energy use per kilogram of food produced: trade-off between energy and labor. In this paper, we are interested in analyzing these trade-offs in combination with the impact of dietary patterns and production systems. We focus on the trade-off between land and synthetic nitrogen fertilizer.
Earlier land use footprint studies have shown that the use of land per person strongly differs throughout the world [17,18]. In general, the increase of crop yields has decreased the use of land per person. However, in some regions, the changes to affluent consumption have overruled this pattern and has resulted in an increase in land use per person (e.g., Easter Asia [18], Philippines [17]). Further, Lassaletta et al. [23] studied the nitrogen related with food over a period of time (1960–2050). These studies have shown differences among countries where the use of nitrogen per person could differ by a factor larger than 2 [19,21].
Our main goal is to identify the global extremes in the use of land and nitrogen fertilizer per person. This will depend on the type of production system and on the type of diet. To illustrate the global differences, in relation with the production systems, we analyze, in one extreme, extensive systems with no (or very low) use of synthetic nitrogen fertilizer and low crop yields; and, in the other extreme, we analyze intensive systems with high use of nitrogen fertilizer and high crop yields. In relation to the type of diet: in one extreme, basic diets with low consumption of animal food products; and in the other extreme, affluent diets with large consumption of animal food products. Simplification was needed in the methodology to estimate the per capita use of land and nitrogen in order to identify the impact of all these parameters and the trade-off between nitrogen and land use. We chose five countries as examples to illustrate the global variations. France and the USA as examples of intensive systems and affluent consumption, Tanzania as an example of extensive systems and a basic diet, and the Philippines and Mexico as examples of the transition between the extremes of both production systems and food consumption. Furthermore, we analyze the individual impact of the type of diet and of the type of production system. To do this, we combine the data of production systems and diets among the five countries. We discuss the global variations and the drivers for the use of land and nitrogen fertilizer for food. Finally, we combine the different types of production systems and diets to assess the impact on land and nitrogen fertilizer use in terms of future dietary changes and changing production systems.

2. Materials and Methods

We follow a similar methodology to the footprint studies mentioned above to calculate the per capita use of nitrogen fertilizer and arable land. Food consumption data in kilograms of food per person per year are linked with agricultural production data, specifically nitrogen fertilizer use per ton of food and arable land per ton of food. The methodology is summarized in Equations (1)–(6).
We used national level data of crop yields from FAOSTAT [4], nitrogen fertilizer application rate per crop from FertiStat [24] and food supply per capita from the Food Balance Sheets of the FAO [4] of five countries: France, USA, Mexico, the Philippines and Tanzania. The selection of these countries was based on national data availability of crop’s production (both crop yield and Fertilizer’s application) and food supply; and on the type of production system (covering the range from extensive to intensive systems). FAOSTAT data of crop yield and food supply is widely available (for all countries, crops and food items, and years 1960–2003). However, data on fertilizer application per crop is more limited. Fertistat [24] gives data on fertilizer application for 94 countries in a certain year (from 1994 to 2004) and only for a limited number of crops (ranging from 4 crops to 20 crops per country). The criteria of selection of these five countries was based on the following. First, we chose at least one country illustrating an example of an intensive system, a transition system and an extensive system. Below, we describe the criterion to define these systems; second, Each country should have at least one crop representing each food category of the diet; third, the area for each crop reported by FertiStat [24] should be the same as the harvested area for each crop reported by the FAO [4]; in this way, we validate methodologically the combination of two different databases (see methodology below): crop yields data [4] with nitrogen application rate’s data [24]. In the Supplementary Material 1, we discuss this assumption.
To calculate the nitrogen and land use per person, we needed to simplify the production system and the diets to be able to analyze several parameters illustrating global differences: dietary differences, production systems differences, and trade-offs between land use and nitrogen fertilizer use. The simplification of the production systems includes: selection of one crop representing each food category (Table 1), all livestock animals are feed with feed and not by pasture land (The reason for this assumption is that the aim of this paper is to discuss the trade-off between synthetic nitrogen fertilizer and land use. We excluded the use of pasture land since most pasture in the world is not fertilized.), maize is considered as the only feed crop for all livestock (Supplementary Material 2), and all food items in the diet are grouped into seven food categories which are described below. The assumptions for the calculations are discussed in the Supplementary Material.
The criteria to determine the type of production systems is based on the nitrogen application rate which illustrates the range from extensive to intensive systems. We refer to High Input Systems (HIS) if the nitrogen application rates are high, Low Input Systems (LIS) if the nitrogen application rates are low, and Middle Input Systems (MIS) if the nitrogen application rates are between HIS and LIS. The value of each type of food category differs, and they are illustrated in Table 1. We use national average data of five countries representing these three types of production systems which illustrate the global extremes.
Due to the simplifications mentioned above and the exclusion of food imports, we do not calculate the use of resources for the five countries from which we used their production and consumption data. We use their country level data as examples to illustrate global differences in production systems and diets. To avoid this misinterpretation, when using their national data, we recall them based on their type of production system. France is deemed as a High Input System A (HIS A), USA as High Input System B (HIS B), Mexico as a Middle Input System A (MIS A), the Philippines as a Middle Input System B (MIS B), and Tanzania as a Low Input System (LIS).
The criteria of the type of diet is based on the consumption of staple food and affluent food. These diets illustrate the dietary patterns of the Nutrition Transition Theory [25]: from a very basic diet to a rich affluent diet. A Basic Diet is rich in staple food (cereals, roots and pulses) with a low amount of animal products; a Transition Diet includes larger consumption of animal products, sugars and vegetable oils, and an Affluent Diet includes high consumption of animal products and low consumption of staple food (see Section 3.2). In relation to this categorization, the food supply data of France and the USA are used to represent an affluent diet: Affluent Diet A (France), and Affluent Diet B (USA); Mexico and the Philippines a transition Diet: Transition Diet A (Mexico) and Transition Diet B (the Philippines), and Tanzania a Basic Diet.
In relation to the use of nitrogen, we focus on the use of synthetic nitrogen fertilizer and not on other sources of nitrogen found throughout the food chain. Other studies have calculated all sources of nitrogen related with food production and consumption [19,20,21]. In contrast, in this paper, we are interested in the trade-off between arable land use and synthetic nitrogen fertilizer; therefore, we only consider the use of synthetic nitrogen fertilizer for the production of the food. In relation to land, we focus on the use of arable land. In the rest of the paper, we refer to arable land as land.
For the consumption data, we used food supply data from the Food Balance Sheets [4]. The food supply is not the actual food consumption of the population since it includes food losses. For the aim of this paper, it is more relevant to discuss food supply instead of the actual diet because food losses also require nitrogen fertilizer and land to produce them. A more accurate source of diets is household level surveys. However, these surveys are only available on a national level, and do not include global data. However, Gerbens-Leenes et al. [26] (Figure 7) show a clear relationship between food supply data and household levels surveys. Throughout the paper, we refer to diets when discussing food supply data.
For the production data, we calculated the nitrogen fertilizer use per ton of food by combining nitrogen application rates (kg·N/ha) with crop yield data (ton/ha), see Equations (1) and (3); and the arable land per kilogram of food with the inverse of the crop yield, see Equations (2) and (4). We used crop yield data from the FAO Statistics [4]; however, they do not provide data on nitrogen application which in general is local data that is not widely available on a global scale. The FertiStat Database [24] has national average data for some countries and some crops in a certain year.
We used the FertiStat data [24] on nitrogen application rates and linked it with the crop yield given by FAO Statistics [4]. To validate this assumption of combining two different databases, we compare our calculations with some studies that provide crop field scale data on both nitrogen application and crop yield, see Supplementary Material 1.
For some crops, only a share of the harvested area of the country is fertilized, and FertiStat indicates this percentage (see Supplementary Material 1). Since we link this application rate with the national crop yield given by FAO Statistics, we multiply the application rate by the share of the area, resulting in a weighted nitrogen application rate. For instance, the nitrogen application rate of maize production in Tanzania in 1997 was 80 kg·N/ha, but only 10% of the harvested area was fertilized. So, the value of nitrogen rate that we used is 8 kg·N/ha (80 kg·N/ha × 10%). This assumption is validated in Supplementary Material 1 in which we show that our calculations are in the same order of magnitude as crop field studies with accurate nitrogen application rates data.
We linked agricultural production data with consumption data for the average diet of each country in 2009 [4], see Equations (5) and (6). The diet consists of several food items and each one is produced in different systems. Simplification of the diet is needed to identify the factors driving the use of nitrogen fertilizer and land. Therefore, we used data on the 14 main food categories given by the Food Balance Sheets [4] to represent the diet of each country. The data is discussed in Section 3.2. The food categories are: cereals, roots, sugars, pulses, vegetable oils, vegetables, fruits, alcoholic beverages, milk, eggs, beef, pork, mutton meat and poultry meat. We are able to combine these because the food items included in each food category have similar agricultural production characteristics. For instance, cereals (wheat, rice and maize) in general require similar nitrogen application rates and obtain similar crop yields in comparison with roots (cassava, sweet potatoes and potatoes).
For the vegetable products, one food item and its crop equivalent was chosen to represent each food category. The crops and food items for each category and each country are indicated in Table 1. We choose the crop equivalent of each food category with the largest harvested area according to the FertiStat Database [24]. For instance, for Mexico, FertiStat gives data on maize, rice and wheat production. Maize has the largest harvested area so we chose maize to represent cereals. Sugars, vegetable oils and alcoholic beverages were converted into crop equivalents using conversion factors from Kastner and Nonhebel [17] (Table A1).
Equations to calculate nitrogen and land use per person:
Production data for vegetable products:
(kg·N/ha) a/(ton/ha) × Conversion factor b = kg·N/ton food
(1/(ton/ha) c) × Conversion Factor c × 10,000 = m2/ton food
Production data for animal product d:
(kg·N/ha) a/(ton/ha) × feed-food eff. factor = kg·N/ton food
(1/(ton/ha)) × feed-food eff. factor = m2/ton food
Combining production data (results of Equations (1)–(4)) and consumption data:
(kg·N/ton food) × (kg food/cap/year) × 1/1000 = (kg·N/cap/year)
(m2/ton food) × (kg food/cap/year)× 1/1000 = (m2/cap/year)
(NOTES: Units refer to: Nitrogen application: (kg N/ha): Crop yield: (ton/ha), Food supply: (kg food/cap/year). a For the crops which all the harvested area is not fertilized, the Nitrogen application rate is a weighted value from the one given by the FertiStat database [24]. See text for details; b The nitrogen application and crop yield values are for the feed crop of the livestock. See text for details; c The crop yield data was converted from tones into kilograms and hectares into m2; d The Conversion Factors are only used for sugars, vegetable oils and alcoholic beverages. See text for details.)
Equations (1) and (2) show the calculations to estimate the amount of nitrogen fertilizer use per amount of crop (kg·N/ton crop) and land use per amount of crop (m2/cap). Then, Equations (5) and (6) show the calculations combining production and consumption data to estimate the amount of nitrogen and land use per food category of the diet. We do this for each food category of the vegetable food products in the diet.
Equations (3) and (4) show the calculations used to estimate the nitrogen use for the animal food products. We used a similar methodology to Elferink et al. [27] who calculated the land requirements for different meat products. We calculated the nitrogen fertilizer and land use separately for beef, pig meat, poultry meat, mutton meat, milk and eggs; and we excluded fish and animal fats. The nitrogen and land use for each of these animal food products is the indirect use for the feed crop. First, we calculated the nitrogen fertilizer and land use per ton for the feed crop using Equations (1) and (2). We assumed that all animal products in the five production systems are produced with the same feed crop: maize, which is the feed crop most widely used globally [4]. Supplementary Material 2 discusses the assumption of considering only one type of feed crop. The amount of meat, milk or eggs produced with this feed depends on the feed-food efficiency factor (see Table 2). The feed-food efficiency factor is the ratio of kilogram of feed crop needed to produce a kilogram of meat, milk or eggs. We assumed the same feed-food efficiency factors for all countries (kg dry mass feed/kg output). We used the values for the global average and industrial system given by Mekonnen and Hoekstra [28], see Table 2. This is a simplified assumption since feed efficiencies vary a lot among regions and production systems; but this simplification is necessary to avoid adding extra variables to the calculation in order to only focus on the impact of the type of production system in relation to nitrogen fertilizer application rate.
Finally, we aggregated the nitrogen and land use values for all food categories of the diet to estimate the total nitrogen fertilizers and land use per person. These results are discussed in Section 3.3. Then, in Section 3.4, we calculated individually the impact of diets and production system on the per capita use of nitrogen fertilizer and land. To do this, we selected one diet of each type and we assumed that this diet was produced in all five of the production systems analyzed in Section 3.3. Figure 2a of Section 3.4 shows the affluent diet B produced in all five systems, Figure 2b shows the transition diet A produced in all five systems, and Figure 2c shows the basic diet produced in all five systems. With this figure, it is possible to identify the individual impact of diets and production systems.

3. Results

3.1. Production Systems: Nitrogen Fertilizer and Land Use Per Kilogram of Food

Table 1 shows the production systems’ factors for each food category and country: nitrogen fertilizer application rate in kg·N/ha and crop yield in ton/ha. These factors differ among the systems and also among the food categories.
In general, the High Input Systems (HIS) have both the largest values of nitrogen application rates (amount of nitrogen fertilizer applied in the crop field (kg·N/ha)) and crop yields (amount of crop produced (ton/ha)), the Low Input System (LIS) has the lowest, and the Middle Input Systems (MIS) have intermediate values. Though, the nitrogen fertilizer per amount of crop produced (column 5 of Table 1) does not follow this pattern (column 5 of Table 1). The largest rate of nitrogen application does not necessarily result in largest nitrogen fertilizer use per kilogram of crop. For instance, the maize production in the MIS A shows a smaller nitrogen application rate as does the crop yield to wheat production in the HIS A. However, the nitrogen fertilizer per amount of maize produced in MIS A is more than two times larger than the wheat production in the HIS A. This may be attributed to the relationship between nitrogen application and crop yield. With only 30% higher nitrogen application, the crop yield obtained in HIS A is more than 3 times higher than in MIS A. Sunflower seed, barley and maize production showed similar trends among these types of systems. Note that the application rate of potatoes, beans and vegetables differs among the highly intensive systems (between HIS A and HIS B). The application rate for beans is almost three times larger for HIS A than that for HIS B; for potatoes, it is more than five times larger for HIS B than for HIS A; and for vegetables it is more than three times larger for HIS B than for HIS A. This shows that within one type of production system (e.g., intensive system), differences exist in the production factors. For this reason, we use two systems to include these variations.
The production systems of the LIS show much lower nitrogen use per kilogram of food due to the very low nitrogen application rates. In addition, the land use per kilogram of food is generally much larger due to the low crop yields obtained. So, a clear trade-off is shown between nitrogen and land use per kilogram of food produced.
A pattern can be recognized in the values of nitrogen and land use per kilogram of crop among the food categories. Vegetables, fruits, potatoes and sugars have the lowest values. These categories show one order of magnitude lower values of nitrogen and land use per kilogram of crop produced than pulses and cereals. Though, note that for sugars the nitrogen and land use increases 10-fold in the conversion of the crop equivalent (sugar cane or sugar beet) into its food category (sugar), which is the food item consumed in the diet. The production of oil crops for vegetable oil production shows large variation among countries due to large differences in nitrogen application and crop yield. Note that the crops chosen to represent this food category also vary widely: from soybean, which is a legume that generally does not require a large amount of nitrogen application, to coconuts, cotton and sunflower.
The nitrogen fertilizer and land use per kilogram of food for the animal products (Table 2), especially for the meat products, is much higher than that for the vegetable products. The differences among animal food products are related with the feed-food efficiency factor. Beef is the product with the largest feed-food efficiency factor and it requires the largest amount of both nitrogen and land use per kilogram of food, followed by mutton and goat meat, pork, poultry, eggs and milk.
The differences among the countries in Table 2 are related with the feed values shown in Table 1. LIS uses the largest amount of land and the lowest amount of nitrogen fertilizer per kilogram of food due to the low nitrogen application and low crop yield of maize. The nitrogen application of the High Input Systems (HIS A & HIS B) is much higher than that of the Middle Input Systems (MIS A & MIS B), the former obtaining much higher crop yields than the latter. As a result, the nitrogen and land use per kilogram of maize in the High Input Systems is lower than in the Middle Input Systems. This shows, once again, that larger nitrogen application rates do not necessarily result in larger nitrogen use per kilogram of food depending on the crop yield obtained.

3.2. Food Consumption Patterns

The nitrogen fertilizer and land use per person depends not only on the production system (Table 1 and Table 2) but also on the amount of food consumed (Table 3). Table 3 shows large variation among diets. A person with a Basic Diet consumes a larger amount of staple foods such as roots and pulses than the rest of the systems. Also, a person with an Affluent Diet consumes a larger amount of luxurious food products such as sugars, vegetable oils, vegetables and animal products.
The consumption of the animal products is particularly relevant for the nitrogen fertilizer and land use per person due to the larger requirement of resources than the vegetable products as shown in Table 1 and Table 2. The Affluent Diet B involves the largest consumption of animal products in kg/cap/year followed by Affluent Diet A, Transition Diet A, Transition Diet B and Basic Diet. The composition of the food categories in the diet is different. In general, the consumption of milk is the largest among the animal products for all systems, except for Transition Diet B, followed by beef, chicken and pork, then eggs, and the consumption of mutton meat is the lowest. The importance of beef, chicken and pork in the diet differs among the systems (see Table 3). For instance, for Affluent Diet A pork consumption is larger than chicken, and, for Affluent Diet B, chicken consumption is larger than pork.

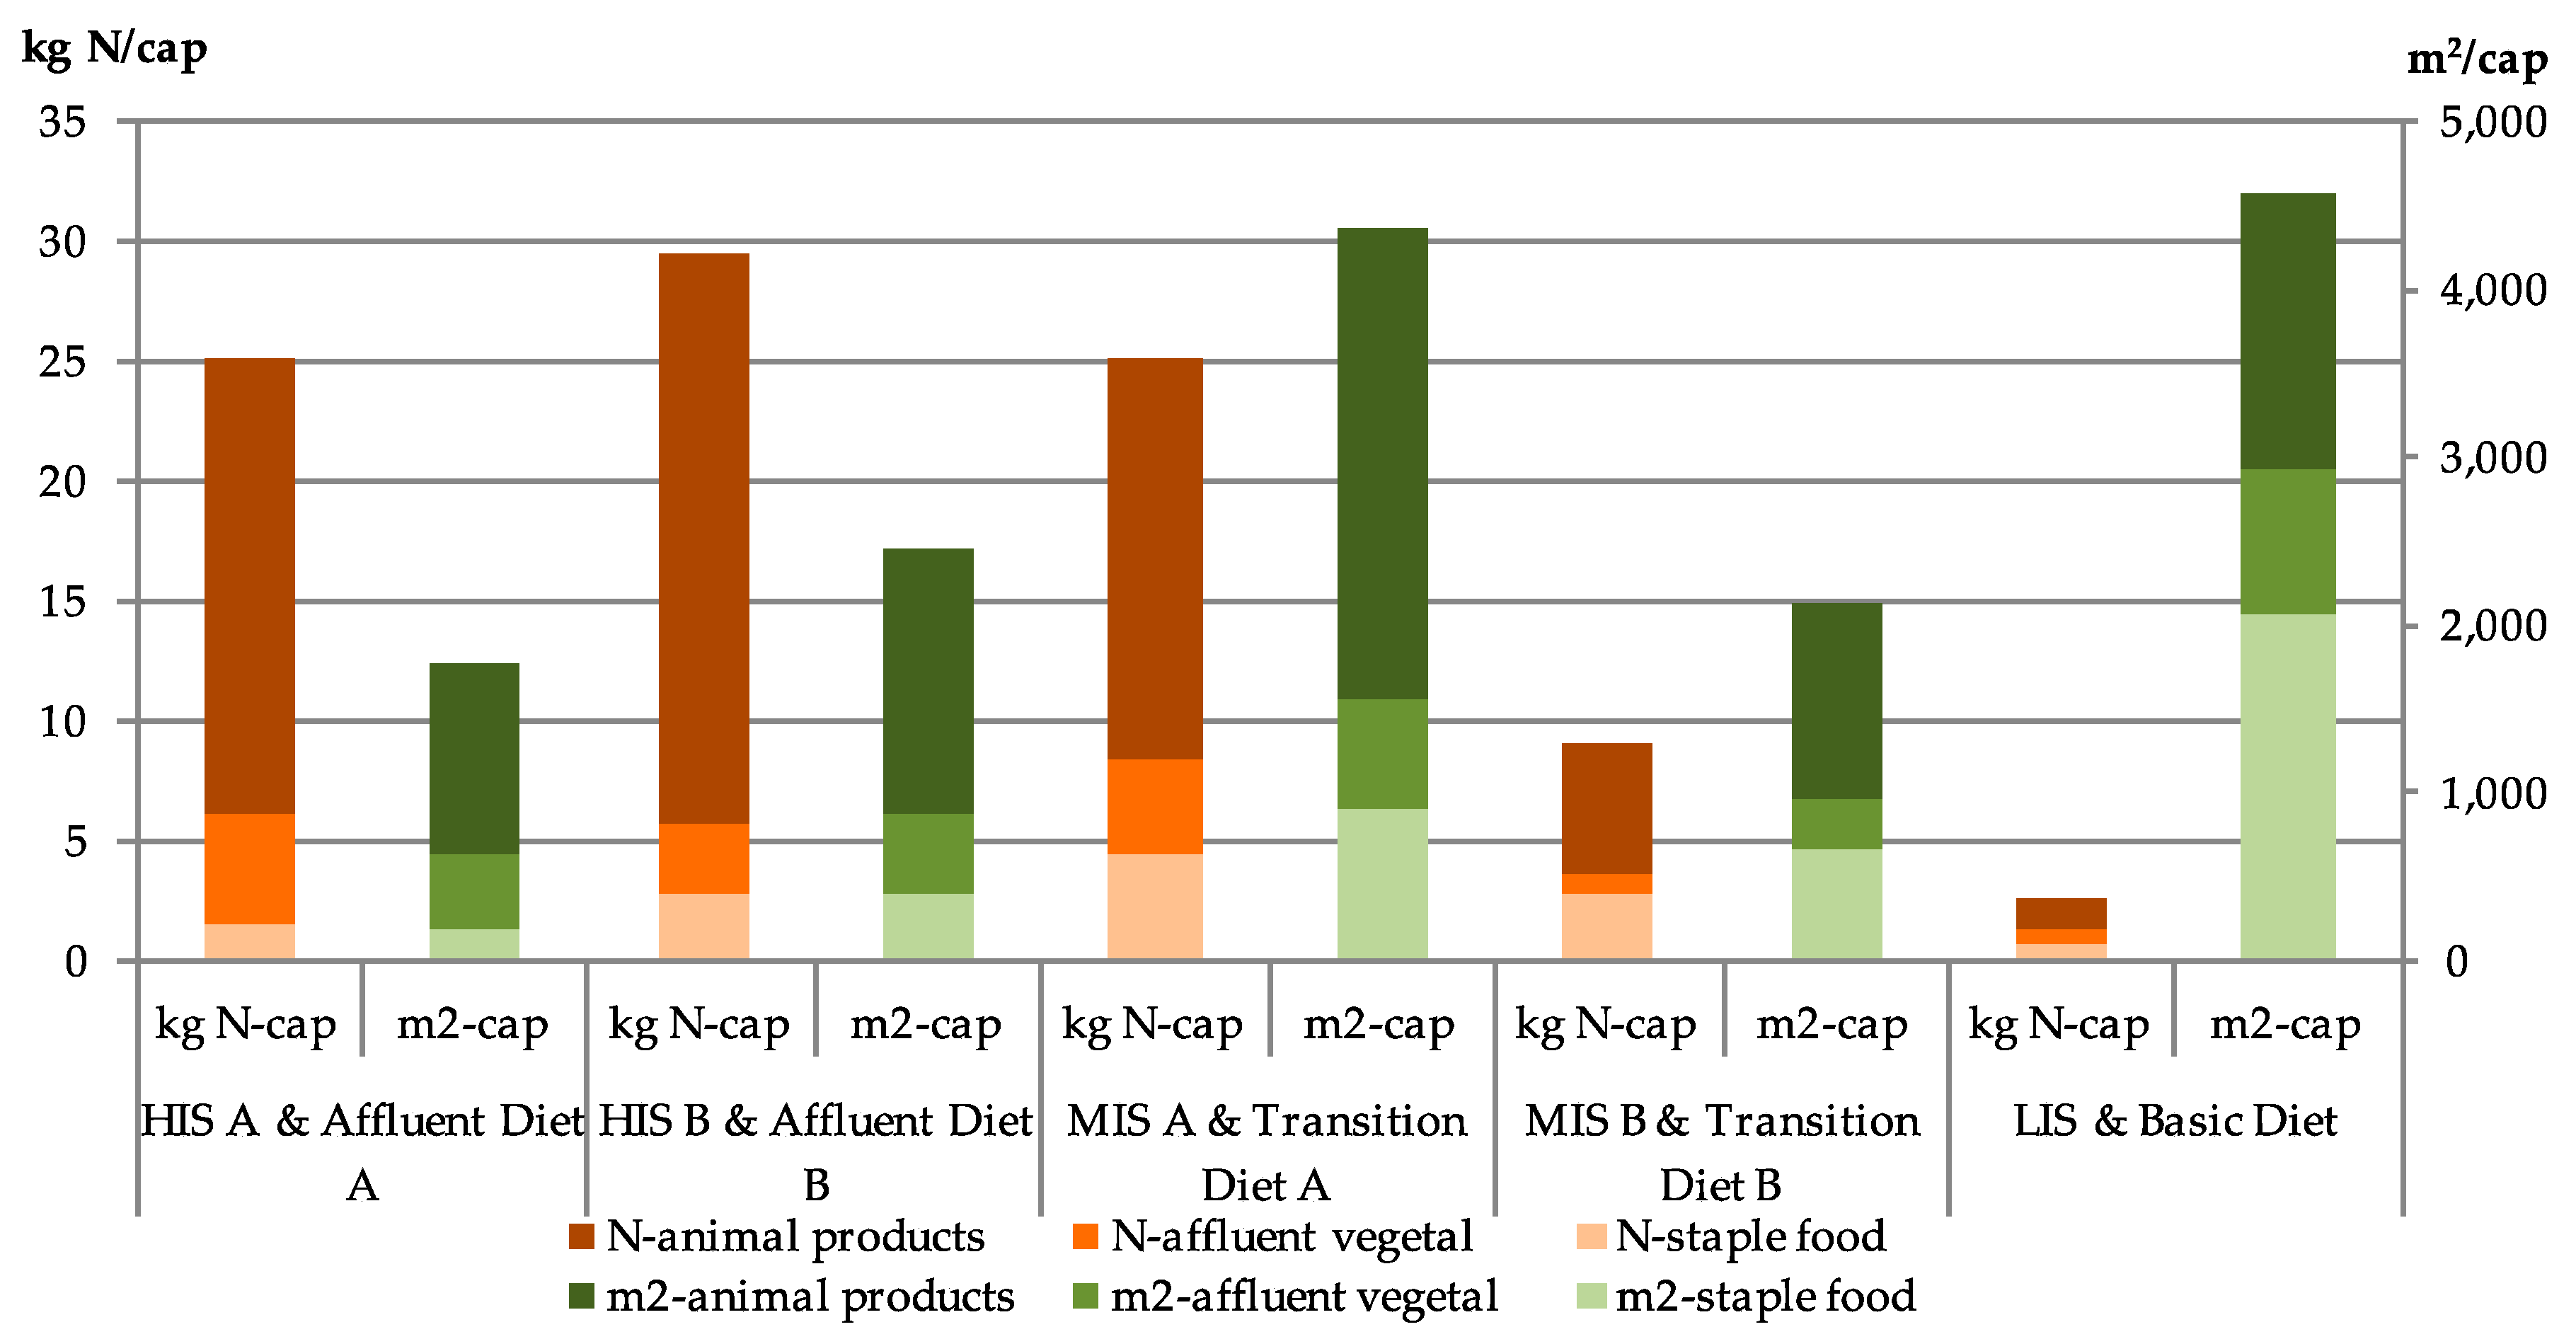
3.3. Trade-Off between Nitrogen Fertilizer and Land Use Per Person

The combination of the production data (Table 1 and Table 2) and the consumption data (Table 3) with Equations (5) and (6) gives the nitrogen fertilizer and land use per person. The results are presented in Figure 1 for five scenarios: the HIS A with an Affluent Diet A, the HIS B with an Affluent Diet B, the MIS A with a Transition Diet A, the MIS B with a Transition Diet B, and the LIS with a Basic Diet. Large differences exist among the five scenarios due to the differences in both production and consumption data discussed above. The order of the systems, left to right of x axis in Figure 1, is in accordance with the type of diet, from affluent to staple, and in accordance with the production system, from large to low amounts of nitrogen application. Though, for the nitrogen application, this trend is not followed by all the food categories and, in some cases, a system on the right side of Figure 1 might have larger rates of nitrogen application than a system which is on the left side of Figure 1.
HIS B is the scenario with the largest nitrogen fertilizer use per person followed by HIS A and MIS A, then MIS B, and LIS has much lower nitrogen fertilizer use per person than the rest of the scenarios. As mentioned before, due to the relationship between nitrogen application and crop yields [29], a trade-off between nitrogen fertilizer and land use is expected in which large nitrogen fertilizer use results in low land use. However, the trade-off between nitrogen fertilizer and land use per person does not follow the same trend. LIS is the system with the largest land use per person followed by MIS A, HIS B, MIS B and HIS A. So, some systems use both large land and nitrogen fertilizer. HIS B has both larger nitrogen fertilizer and land use per person than HIS A, and MIS A show the same relation in comparison with MIS B.
The composition of the nitrogen fertilizer and land use per person is different among the systems. For the High Input Systems, the animal food products account for the largest share of the nitrogen fertilizer and land use per person. The reasons are both the large consumption of animal food products and the low nitrogen fertilizer use per kilogram of food of the vegetable products. In contrast, for the Low Input System, the staple food accounts for the largest share of the land use per person. The reasons are the large consumption and the low crop yields of these food products.

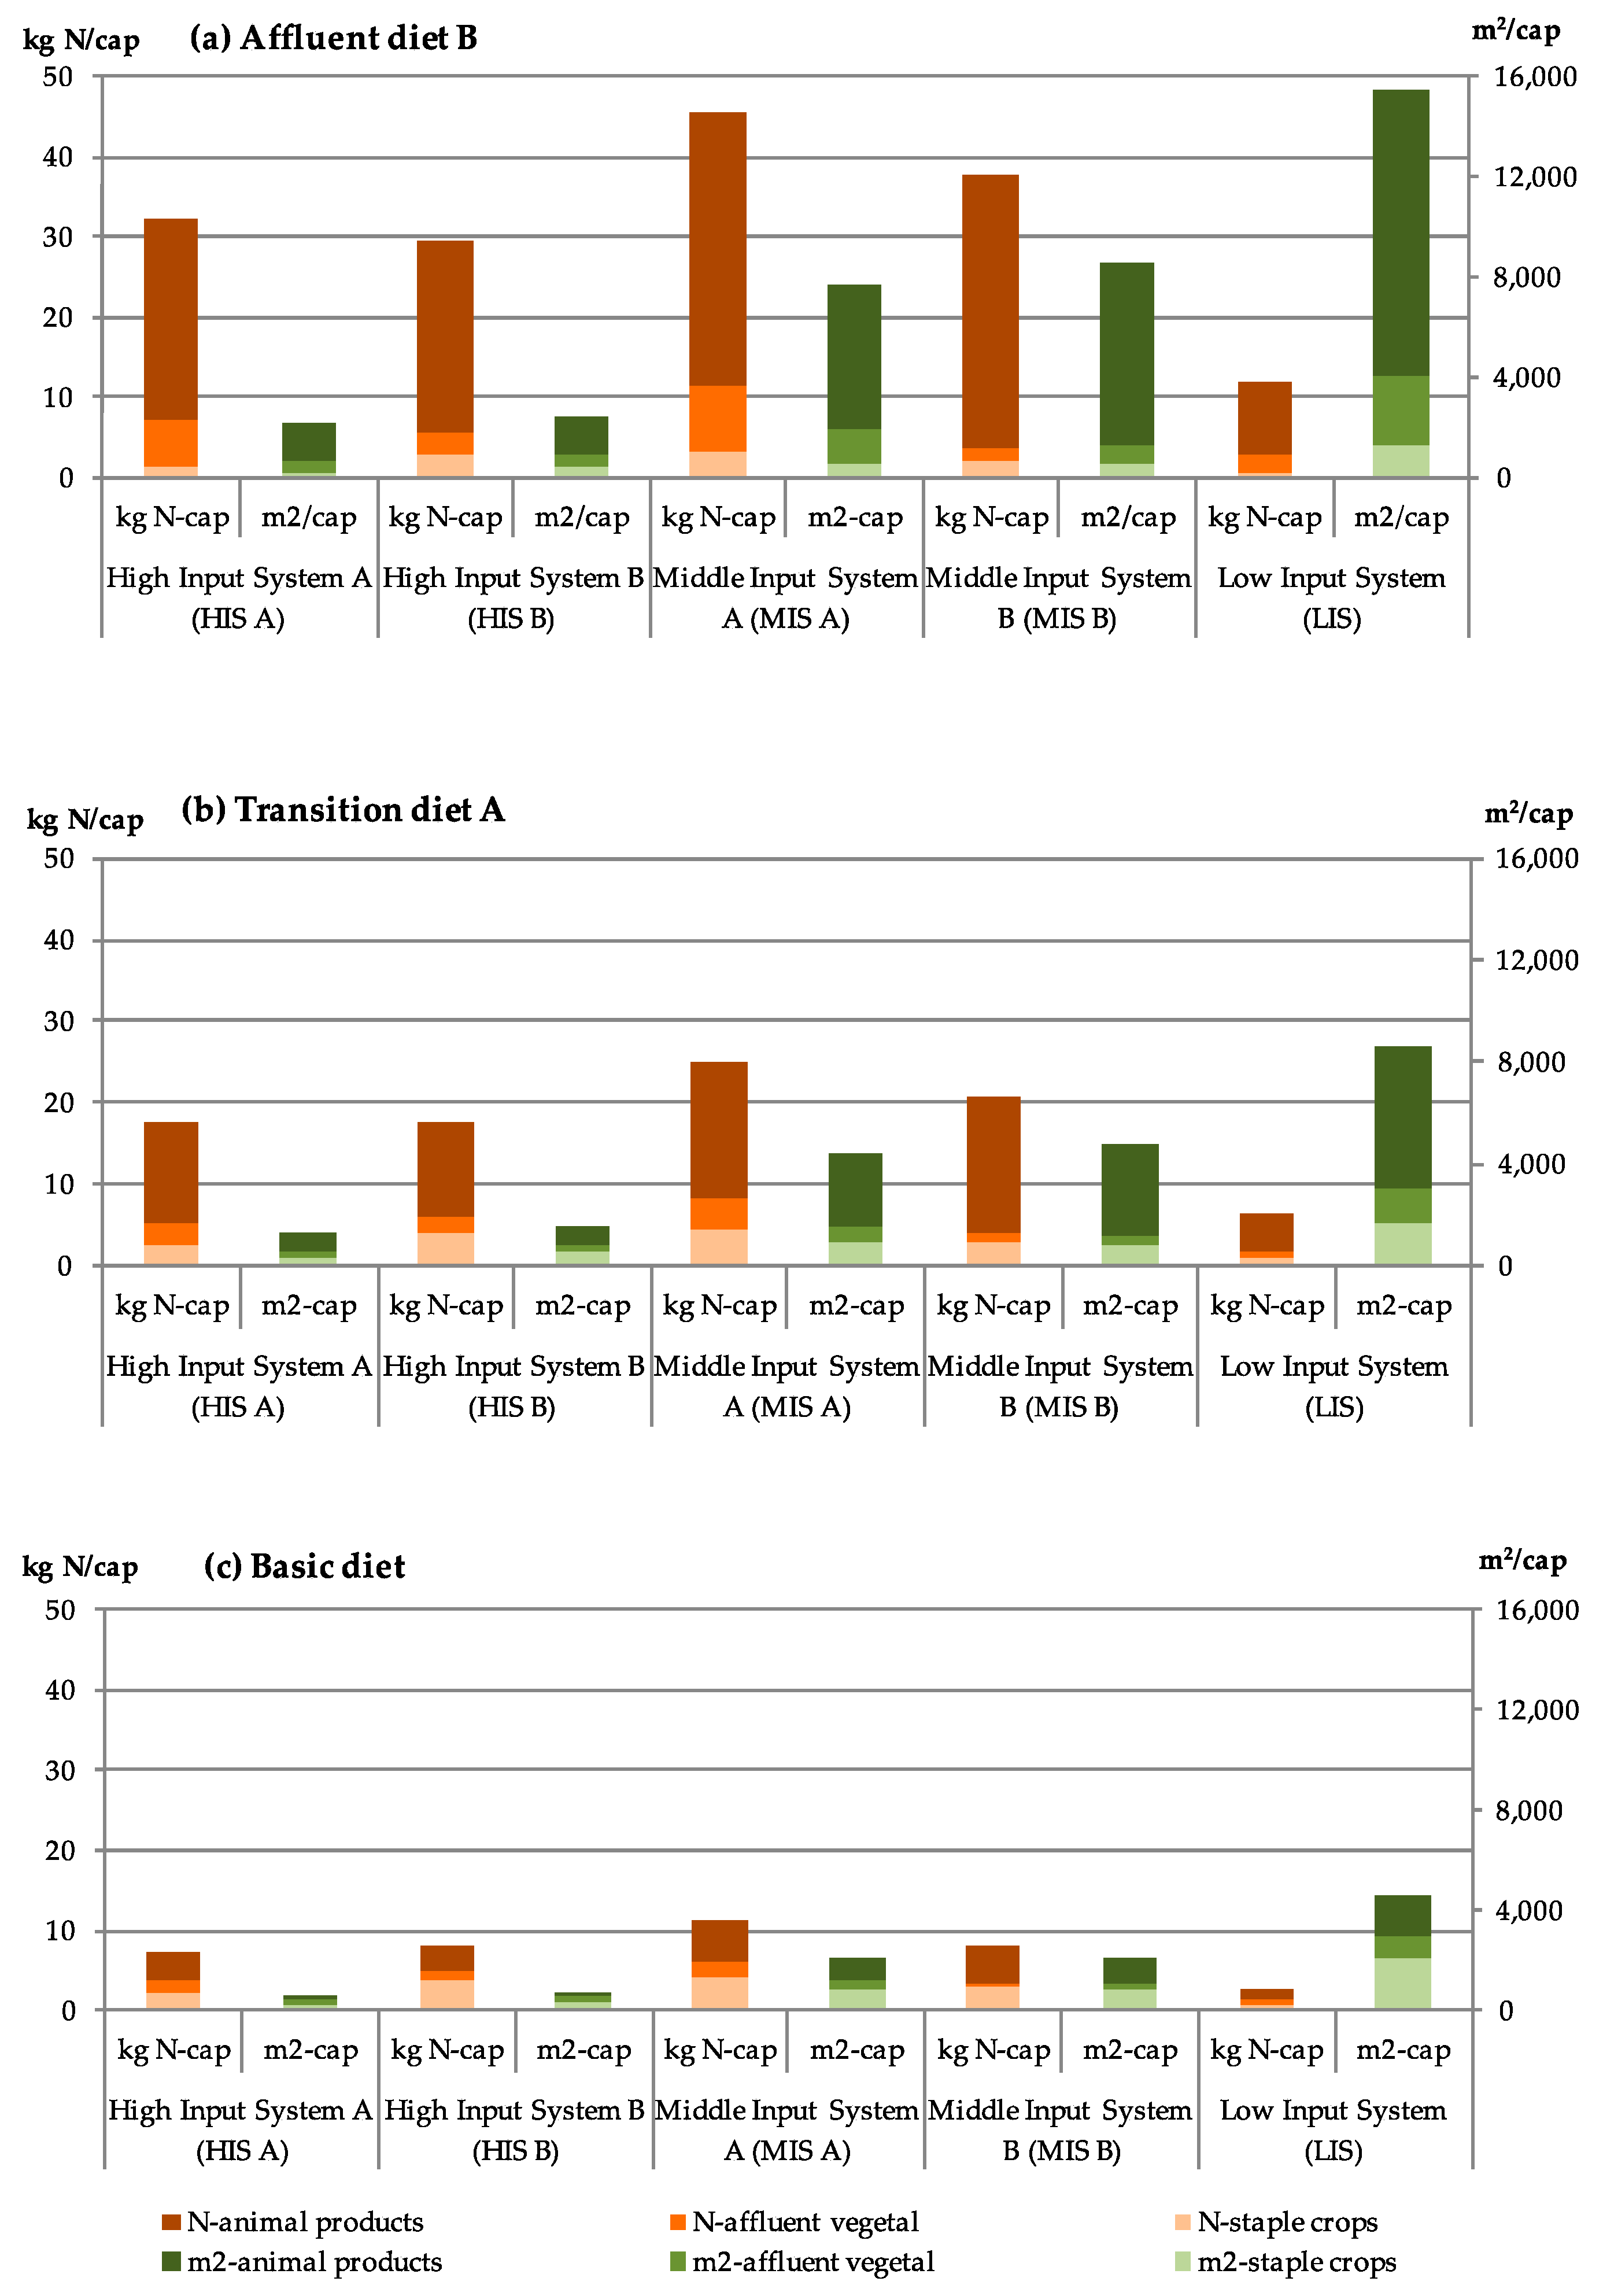
3.4. Role of Type of Production System and Diet in Nitrogen and Land Use

Figure 1 shows large differences in nitrogen fertilizer and land use per person due to production systems and diets. In this section, we discuss how individually the production system and the diet contribute to the nitrogen fertilizer and land use per person (Figure 2).
Figure 2 shows the use of nitrogen fertilizer and land per person for the three diets, each one produced the five production systems analyzed in Figure 2. The differences among Figure 2a–c show the impact of the diets (with a constant production system), and the differences within each graph (left to right) show the impact of the production systems (with a constant diet).
The differences in diets can result in as much as four times more nitrogen fertilizer and land use per person, comparing the affluent and the staple diets. The staple diet, low in animal products, requires less nitrogen fertilizer than the affluent diet rich in animal products. Also, the composition of the use of resources is different. For the affluent diet, animal products account for 75% (produced in MIS A) to 90% (produced in MIS B) of the nitrogen fertilizer use per person. For the staple diet, animal products account for only 40% (produced in HIS B) to 60% (produced in MIS B).
The differences in agricultural production systems can also result in large differences in the use of nitrogen fertilizer and land. For example, look at Figure 2a. MIS A uses four times more nitrogen fertilizer per person than LIS, and LIS uses seven times more land per person than HIS A.
The order of the systems in Figure 2 (left to right) is related to the use of land: from low to high land use per person. This allows us to identify the trade-off between nitrogen fertilizer and land use due to the production systems since the diet is constant in contrast with Figure 1. Figure 2 shows that the trade-off is not linear: the nitrogen fertilizer use per person does not follow an opposite trend than the land use (higher to lower values). The Middle Input Systems use both larger nitrogen fertilizer and land use per person than the High Input Systems. The reason is the values of the nitrogen fertilizer use per kilogram of food of the different food categories (Table 1) which were calculated with the nitrogen fertilizer application and the crop yield. As mentioned before, even though the High Input Systems have higher nitrogen fertilizer application rates, the nitrogen fertilizer per amount of food produced is lower than the ones for the Middle Input Systems because of the high crop yields of the High Input Systems in comparison with the Middle Input Systems.
The most striking result of this analysis is the large variations that can result from the type of diet and the type of production system used in the per capita use of nitrogen fertilizer and land. An affluent diet produced in the LIS uses 24 times more land than a staple diet produced in the HIS. Furthermore, the affluent diet produced in HIS A uses nine times more nitrogen fertilizer than the staple diet produced in LIS. Changes in diets from a staple to an affluent diet generally result in a stronger increase in use of both land and nitrogen (vertical differences in Figure 2). However, the type of production system can strongly change the use of resources and the ratio between nitrogen fertilizer and land use (horizontal differences of Figure 2).

4. Discussion

4.1. Future Implications

The suitable global land for food production is already in use. With future population growth, the available land per person for food production will be greatly reduced. In 2050, the global availability of arable land per person will decrease to less than 2000 m2 per person [3] (Figure 4.3). In addition, a large share of global population is expected to change their diets to a more affluent consumption requiring more resources per person. The transition countries are expected to experience major changes in diets which include Mexico and the Philippines which were studied in this paper but also China and India which are countries with low land availability per person [30] and large populations which together account for 35% of global population [31]. With our results (Figure 2), we can estimate the nitrogen fertilizer needed per person with the available land depending on the type of diet. For an affluent diet, it is only possible to produce food with an intensive system such as HIS A or B (Figure 2a) and 30 kg/cap/year is needed. In contrast, for a basic diet it is possible to produce food using a less intensive system such as MIS A or B (Figure 2c) and “only” around 10 kg·N/cap/year is needed. Tilman et al. [32] forecast two scenarios for global nitrogen fertilizer use in 2050, the first following the trends of the past decades and the second involving a more sustainable intensification of agriculture. Using their predictions, the global average use of nitrogen fertilizer per capita for both scenarios will be 26 kg·N/cap and 24 kg·N/cap, respectively (assuming population growth with medium fertility rate [31]). Figure 2 shows that with this amount of nitrogen and less than 2000 m2, it is not possible to produce the food needed for an affluent diet with any of the five selected production systems used in this paper. It is possible to produce the food required for a transition diet but only using intensive systems such as HIS A and B because the other systems require more than 4000 m2/cap. This implies the following: For 2050, it is not possible to produce food with current production systems if all people follow an affluent dietary pattern. If, globally, diets change to that of a transition consumption pattern, then it is only possible to produce the food needed using intensive production systems. This would imply strong intensification and a higher increase in nitrogen fertilizer use than present estimates [32]. Our results deviate from these estimates by including several parameters which are interrelated: dietary changes, production systems and the trade-off between nitrogen fertilizer and land.

4.2. Our Results within the Broader Literature

In this paper, we have quantified the global variations on the use of nitrogen fertilizer and land per person depending on the type of production system and diet followed. To do this, we used examples of production and diets which illustrate global extremes. This represented a methodological challenge due to the complexity of the food systems so simplification was needed which was described in the methodology. However, we obtain a more integrated analysis of the impact of resource use for food.
Other studies in the literature [16,17,18,19,20,21,22] have calculated regional use of resources similar to what we did in Figure 1, but with a more accurate methodology used to calculate the regional use of resources per person. We do not attempt to do this, but we aim to show the global variations in the impact of the type of diet and the type of production system on the use of nitrogen fertilizer and land per person and, most importantly, the trade-off. Our results show similar orders of magnitude to the footprint studies which we discuss below [16,17,18,19,20,21,22].
The studies on nitrogen footprint calculate not only the use of nitrogen fertilizer but also other sources of nitrogen related with consumption patterns. The main sources of nitrogen related with food production are synthetic nitrogen fertilizer, manure, nitrogen fixation and nitrogen deposition [33]. Including all sources of nitrogen in one analysis is relevant to discuss change in the global nitrogen cycle, and soil and water pollution resulting from agricultural systems. Leach et al. [19] calculated the nitrogen footprint for the USA and the Netherlands, but only for affluent food patterns and intensive systems. They show that nitrogen use for food production is between 20 and 24 kg/cap/year (similar to our results). Pierer et al. [20] also calculate the nitrogen footprint for affluent patterns and production systems (for Austria, the USA, the Netherlands and the UK) resulting in similar values: 16–25 kg·N/cap/year. Other studies show the nitrogen footprint of food using the Nitrogen Calculator (a website designed for consumers to calculate their N footprint: www.n-print.org). The values for Mexico range from 20 to 50 kg·N/cap/year [19] and for Tanzania it is 14 kg·N/cap/year [21]. These comparisons show that our results are in the same order of magnitude as the present literature, and the differences are due to our simplifications and the fact that we only considered the use of synthetic nitrogen fertilizer in order to discuss the trade-off between the use of nitrogen fertilizer and land.
In relation to land, Kastner et al. [18] calculate the land requirements for all sub-continents covering all types of dietary patterns. They show that for affluent diets and intensive production systems (North America and Western Europe), the requirements of land range from 2000 to 2500 m2/cap/year; and for basic diets and extensive systems (Eastern Africa and Southeast Asia), they range from 1500 to 2000 m2/cap/year. So, for these results, the type of diet does not have a large impact on the use of land. However, in these cases, the use of inputs such as fertilizers overrules the impact of type of diet. The small differences in the use of land in relation to the type of diet are due to the intensity of the production system: the “low” land use for an affluent diet (North America and Western Europe) is due to the large use of crop yield related inputs such as nitrogen fertilizer, and the “large” use of land use for the basic diet (Eastern Africa and Southeast Asia) is due to the low use of crop yield related inputs. We have shown that the use of nitrogen fertilizer per person could be 6–10 times higher with an intensive system for an affluent diet than an extensive system for a basic diet. Furthermore, Peters et al. [34] show the impact of the type of diet on the agricultural land use per person produced using management systems in the United States. They show that plant-based diets require around three times more cropland than diets rich in animal products, similar to our results in Figure 2.
Thus, our results, in comparison with the existing studies on nitrogen footprint and land use requirements, present a more integrated analysis of the impact of diets and production systems by including two essential agricultural inputs which require a strong trade-off between them: nitrogen fertilizer and land. In addition, with our approach, it is possible to identify separately the impact of the type of diet and of the type of production system on the per capita use of nitrogen and land (Figure 2).
This paper has shown the importance of addressing the trade-off between the use of agricultural resources and the impact of the type of diet and production system. Other studies have shown the trade-off between the use of human labor and machinery for intensive and extensive systems, and for affluent and basic diets [35]. Further studies should estimate the trade-off between other important yield-related inputs such as water and land use.

4.3. The Role of Food Imports

In this paper, we have not included the role of food imports in the calculation of land and nitrogen use per person. It was necessary to exclude food imports in the calculations in order to analyze only one type of production system: the production system of the country itself. In this way, it was possible to identify the impact of each production system on the land and nitrogen use per person and their trade-off. Otherwise, the production data would have been a combination of two production systems: the production system of the country which is analyzed, and the production system of the country where the food imports were produced. These production systems generally differ. For instance, the food imports of developing countries with extensive systems (such as LIS in our paper) are generally produced using highly intensive systems [36,37]; in contrast, the affluent food items such as coffee which are imported by developed countries are generally produced with extensive systems in developing countries [35].

5. Conclusions

The future challenges for global food supply include shortage of land, large use of nitrogen fertilizer affecting the global environment, and increase of food demand due to dietary changes and population growth. Earlier studies have analyzed the options for solving one of these problems due to the increase of food demand: shortage of land or the surplus of nitrogen in the environment. To ensure a sustainable future, we need to reduce all impacts. This represents a complex challenge since the use of these resources is interrelated and requires trade-offs among them. This study represents the first attempt to estimate in one analysis the impact of several parameters: type of diet, type of production system, land use per capita and nitrogen use per capita. We have discussed the impact of five scenarios which illustrate the global extremes of present diets and production systems. Our results show that nitrogen fertilizer use varies from 3 to 30 kg per person, and arable land use varies from 1800 to 4500 m2 per person. The nitrogen and land use trade-off depends on the relationship between the nitrogen application rate and the crop yield obtained. A clear trade-off was shown between the extremes of production systems: High intensity systems (low land use and high nitrogen use) and Low intensity systems (high land use and low nitrogen use). However, some transition systems demonstrate inefficient use of nitrogen and, as a result, some production systems require high use of both nitrogen fertilizer and land.
Our paper provides a more integrated assessment to design future sustainable solutions by estimating, for each scenario of diets and production systems, the trade-off between nitrogen fertilizer and land use. The solutions deviate from present studies because, with our approach, it is possible to identify pathways to reduce both land and nitrogen use. Future research is needed to include the trade-offs of other resources such as water use, pesticides and herbicides which should also be reduced to ensure a sustainable future.

Supplementary Materials

The following are available online at www.mdpi.com/2071-1050/8/12/1322/s1, Supplementary Material 1: Validation of the calculation of nitrogen fertilizer use per ton of food, Table S1: Crop field scale production data from several sources, Supplementary Material 2: Discussion of our assumption of using maize as the only feed crop for livestock, Table S2: Use of nitrogen fertilizer per amount of food for all animal food products by using different feed crops, Supplementary Material 3: Impact of nutritional value of food products in the use of resources, Table S3: Nutritional content per 100 g of food product, Table S4: Data of Table 1 and Table 2 in different nutritional values, Table S5: Data of Figure 1, Table S6: Data of Figure 2.

Acknowledgments

This project was partly funded with the CONACYT scholarship “Posgrados en el extranjero” No. 209358 and with “Programa de Becas Posdoctorales UNAM” at the Instituto de Geografía UNAM.

Author Contributions

María José Ibarrola-Rivas and Sanderine Nonhebel conceived and designed the research, analyzed the data, and wrote the paper.

Conflicts of Interest

The authors declare no conflict of interest.

References

  1. Godfray, H.C.J.; Beddington, J.R.; Crute, I.R.; Haddad, L.; Lawrence, D.; Muir, J.F.; Pretty, J.; Robinson, S.; Thomas, S.M.; Toulmin, C. Food Security: The Challenge of Feeding 9 Billion People. Science 2010, 327, 812–818. [Google Scholar] [CrossRef] [PubMed]
  2. Godfray, H.C.J.; Crute, I.R.; Haddad, L.; Lawrence, D.; Muir, J.F.; Nisbett, N.; Pretty, J.; Robinson, S.; Toulmin, C.; Whiteley, R. The future of the global food system. Philos. Trans. R. Soc. Lond. B 2010, 365, 2769–2777. [Google Scholar] [CrossRef] [PubMed] [Green Version]
  3. Alexandratos, N.; Bruinsma, J. World Agriculture towards 2030/2050: The 2012 Revision; FAO: Rome, Italy, 2012. [Google Scholar]
  4. Food and Agricultural Organization of the United Nations. FAOSTAT Statistical Database. 2013. Available online: http://faostat.fao.org/ (accessed on 24 February 2014).
  5. Neumman, K.; Verburg, P.H.; Stehfest, E.; Muller, C. The yield gap of global grain production: A spatial analysis. Agric. Syst. 2010, 103, 316–326. [Google Scholar] [CrossRef]
  6. Mueller, N.; Gerber, J.S.; Johnston, M.; Ray, D.K.; Ramankutty, N.; Foley, J.A. Closing yield gaps through nutrient and water management. Nature 2012, 490, 254–257. [Google Scholar] [CrossRef] [PubMed]
  7. Mueller, N.; West, P.C.; Gerber, J.S.; MacDonald, G.K.; Polasky, S.; Foley, J.A. A tradeoff frontier for global nitrogen use and cereal production. Environ. Res. Lett. 2014, 9, 5. [Google Scholar] [CrossRef]
  8. Bouwman, L.; Goldewijk, K.K.; Van Der Hoek, K.W.; Beusen, A.H.W.; Van Vuuren, D.P.; Willems, J.; Rufino, M.C.; Stehfest, E. Exploring global changes in nitrogen and phosphorus cycles in agriculture induced by livestock production over the 1900–2050 period. Proc. Natl. Acad. Sci. USA 2011, 110, 20882–20887. [Google Scholar] [CrossRef] [PubMed]
  9. Bouwman, A.F.; Beusen, A.H.W.; Billen, G. Human alteration of the global nitrogen and phosphorus soil balances for the period 1970–2050. Glob. Biogeochem. Cycles 2009, 23, 1–16. [Google Scholar] [CrossRef]
  10. Galloway, J.N.; Townsend, A.R.; Erisman, J.W.; Bekunda, M.; Cai, Z.; Freney, J.R.; Martinelli, L.A.; Seitzinger, S.P.; Sutton, M.A. Transformation of the Nitrogen Cycle: Recent Trends, Questions, and Potential Solutions. Science 2008, 320, 889–892. [Google Scholar] [CrossRef] [PubMed]
  11. Beusen, A.H.W.; Bouwman, A.F.; Heuberger, P.S.C.; Drecht, G.; Hoek, K.W. Bottom-up uncertainty estimates of global ammonia emissions from global agricultural production systems. Atmos. Environ. 2008, 42, 6067–6077. [Google Scholar] [CrossRef]
  12. Xiong, Z.Q.; Freney, J.R.; Mosier, A.R.; Zhu, Z.L.; Lee, Y.; Yagi, K. Impacts of population growth, changing food preferences and agricultural practices on the nitrogen cycle in East Asia. Nutr. Cycl. Agroecosyst. 2008, 80, 189–198. [Google Scholar] [CrossRef]
  13. Liu, J.; You, L.; Amini, M.; Obersteiner, M.; Herrero, M.; Zehnder, A.J.B.; Yang, H. A high-resolution assessment on global nitrogen flows in cropland. Proc. Natl. Acad. Sci. USA 2010, 107, 8035–8040. [Google Scholar] [CrossRef] [PubMed]
  14. Davis, K.F.; Gephart, J.A.; Emery, K.A.; Leach, A.M.; Galloway, J.N.; D’Odorico, P. Meeting future food demand with current agricultural resources. Glob. Environ. Chang. 2016, 39, 125–132. [Google Scholar] [CrossRef]
  15. Galli, A.; Wiedmann, T.; Ercin, E.; Knoblauch, D.; Ewing, B.; Giljum, S. Integrating Ecological, Carbon and Water footprint into a “Footprint Family” of indicators: Definition and role in tracking human pressure on the planet. Ecol. Indic. 2012, 16, 100–112. [Google Scholar] [CrossRef]
  16. Hoekstra, A.Y.; Mekonnen, M.M. The water footprint of humanity. Proc. Natl. Acad. Sci. USA 2012, 109, 3232–3237. [Google Scholar] [CrossRef] [PubMed]
  17. Kastner, T.; Nonhebel, S. Changes in land requirements for food in the Philippines: A historical analysis. Land Use Policy 2009, 27, 853–863. [Google Scholar] [CrossRef]
  18. Kastner, T.; Ibarrola Rivas, M.J.; Koch, W.; Nonhebel, S. Global changes in diets and the consequences for land requirements for food. Proc. Natl. Acad. Sci. USA 2012, 109, 6868–6872. [Google Scholar] [CrossRef] [PubMed]
  19. Leach, A.M.; Galloway, J.N.; Bleeker, A.; Erisman, J.W.; Kohn, R.; Kitzes, J. A nitrogen footprint model to help consumers understand their role in nitrogen losses to the environment. Environ. Dev. 2012, 1, 40–66. [Google Scholar] [CrossRef]
  20. Pierer, M.; Winiwarter, W.; Leach, A.M.; Galloway, J.N. The nitrogen footprint of food products and general consumption patterns in Austria. Food Policy 2014, 49, 128–136. [Google Scholar] [CrossRef]
  21. Shibata, H.; Galloway, J.N.; Leach, A.M.; Cattaneo, L.R.; Cattell Noll, L.; Erisman, J.W.; Gu, B.; Liang, X.; Hayashi, K.; Ma, L.; et al. Nitrogen footprints: Regional realities and options to reduce nitrogen loss to the environment. Ambio 2016. [Google Scholar] [CrossRef] [PubMed]
  22. Chatzimpiros, P.; Barles, S. Nitrogen food-print: N use related to meat and dairy consumption in France. Biogeosciences 2013, 10, 471–481. [Google Scholar] [CrossRef]
  23. Lassaletta, L.; Billen, G.; Garnier, J.; Bouwman, L.; Velazquez, E.; Mueller, N.; Gerber, J. Nitrogen use in the global food system: Past trends and future trajectories of agronomic performance, pollution, trade, and dietary demand. Environm. Res. Lett. 2016, 11, 9. [Google Scholar] [CrossRef]
  24. Food and Agriculture Organization (FAO). FertiStat Database. 2007. Available online: www.fao.org/ag/agp/fertistat/ (accessed on 24 February 2014).
  25. Popkin, B.M. Nutrition patterns and transitions. Popul. Dev. Rev. 1993, 19, 138–157. [Google Scholar] [CrossRef]
  26. Gerbens-Leenes, P.W.; Nonhebel, S.; Krol, M.S. Food consumption patterns and economic growth. Increasing affluence and the use of natural resources. Appetite 2010, 55, 597–608. [Google Scholar] [CrossRef] [PubMed]
  27. Elferink, E.V.; Nonhebel, S. Variations in land requirements for meat production. J. Clean. Prod. 2007, 15, 1778–1786. [Google Scholar] [CrossRef]
  28. Mekonnen, M.M.; Hoekstra, A.Y. A global assessment of the water footprint of farm animal products. Ecosystems 2012, 15, 401–415. [Google Scholar] [CrossRef]
  29. Engels, C.; Marschner, H. Plant uptake and utilization of nitrogen. In Nitrogen Fertilization in the Environment; Bacon, P.E., Ed.; Marcel Dekker, Inc.: New York, NY, USA, 1995; pp. 41–81. [Google Scholar]
  30. Ibarrola Rivas, M.J.; Nonhebel, S. Assessing changes in availability of land and water for food (1960–2050): An analysis linking food demand and available resources. Outlook Agric. 2016, 45, 124–131. [Google Scholar] [CrossRef]
  31. United Nations. World Population Prospects. The 2010 Revision. Vol. 1, Comprehensive Tables. ESA/P/WP.220; United Nations: New York, NY, USA, 2011. [Google Scholar]
  32. Tilman, D.; Balzer, C.; Hill, J.; Befort, B.L. Global food demand and the sustainable intensification of agriculture. Proc. Natl. Acad. Sci. USA 2011, 108, 20260–20264. [Google Scholar] [CrossRef] [PubMed]
  33. Lassaletta, L.; Billen, G.; Grizzetti, B.; Anglade, J.; Garnier, J. 50 year trends in nitrogen use efficiency of world cropping systems: The relationship between yield and nitrogen input to cropland. Environ. Res. Lett. 2014, 9, 10. [Google Scholar] [CrossRef]
  34. Peters, C.J.; Picardy, J.; Darrouzet-Nardi, A.F.; Wilkins, J.L.; Griffin, T.S.; Fick, G.W. Carrying capacity of U.S. agricultural land: Ten diet scenarios. Elem.: Sci. Anthr. 2016, 4, 000116. [Google Scholar] [CrossRef]
  35. Ibarrola Rivas, M.J.; Kastner, T.; Nonhebel, S. How much time does a farmer spend to produce my food? An international comparison of the impact of diets and mechanization. Resources 2016, in press. [Google Scholar]
  36. MacDonald, G.K.; Beauman, K.A.; Sun, S.; Cassidy, E.S.; Carlson, K.C.; Gerber, J.S.; West, P.C. Rethinking agricultural trade relationships in an era of globalization. BioScience 2015, 65, 275–289. [Google Scholar] [CrossRef]
  37. Kastner, T.; Erb, K.H.; Haberl, H. Rapid growth in agricultural trade: Effects on global area efficiency and the role of management. Environ. Res. Lett. 2014, 9, 3. [Google Scholar] [CrossRef]
Figure 1. Nitrogen fertilizer and land use per person. Staple food includes the consumption of cereals, roots and pulses. Affluent vegetal includes sugars, vegetable oils, fruits and vegetables. Animal products include beef, pork, chicken, mutton meat, eggs and milk. Source of data: calculations from the authors, see text for details. The data of this figure is presented in the Supplementary Material 4.
Sustainability 08 01322 g001
Figure 2. Individual role of diets and production systems in the nitrogen fertilizer and land use per person: (a) Affluent Diet B, (b) Transition Diet A, (c) Basic diet. Source of data: calculations from the authors, see text for details. The data of this figure is presented in the Supplementary Material 4.
Sustainability 08 01322 g002
Table 1. Production systems data for the vegetable products and feed.
Production SystemCrop (Food Item)N Application (kg·N/ha) 1Crop Yield (ton Crop/ha) 2kg·N/ton Crop 3kg·N/ton Food 3m2/ton Crop 3m2/ton Food 3
Cereals
HIS AWheat (wheat)807111114051405
HIS BWheat (wheat)633222234443444
MIS AMaize (maize)602262642684268
MIS BRice, paddy (rice)433141831384048
LISMaize (maize)817785418541
Roots
HIS APotatoes (potatoes)354011253253
HIS BPotatoes (potatoes)2093855260260
MIS APotatoes (potatoes)1082055488488
MIS BPotato (potatoes)681255806806
LISSweet potatoes (sweet potatoes)120.30.354475447
Pulses
HIS ABeans, dry (beans)1503.0494932833283
HIS BBeans, dry (beans)641.8363656255625
MIS ABeans, dry (beans)170.6282817,02717,027
MIS BBeans, dry (beans)80.7101013,37613,376
LISPulses (pulses)10.71114,53114,531
Sugar & Sweeteners
HIS ASugar beet (sugar)145761.910132702
HIS BSugar beet (sugar)120502.4131991061
MIS ASugar cane (sugar)90781.2141291603
MIS BSugar cane (sugar)68701.0121431782
LISSugar cane (sugar)187001161436
Vegetable Oils
HIS ASunflower seed (sunflower oil)1302.552148397411,407
HIS BSoybeans (soybean oil)212.6821382110,088
MIS ASunflower seed (sunflower oil)600.87922713,15437,753
MIS BCoconuts (coconut oil)64.217239511,497
LISSeed cotton (cotton oil)90.5196721,29974,334
Vegetables
HIS AVegetables (vegetables)452322440440
HIS BVegetables (vegetables)1712677390390
MIS AVegetables (vegetables)421633634634
MIS BVegetables (vegetables)0.02580011791179
LISVegetables (vegetables)1062215401540
Fruits
HIS AFruits (fruits)501155915915
HIS BFruits (fruits)93.52444413413
MIS AFruits (fruits)401144882882
MIS BFruits (fruits)381133886886
LISFruits (fruits)130.30.332243224
Alcoholic Beverages
HIS ABarley (beer)12061931580237
HIS BBarley (beer)6031933095464
MIS ABarley (beer)3222136513977
MIS BRice, paddy (beer)4331423138549
LISBarley (beer)121060001080
Feed
HIS AMaize170919 1102
HIS BMaize150818 1185
MIS AMaize60226 4268
MIS Bmaize46225 5495
LISmaize817 8541
Names of systems and the countries of their data sources: High Input System A (HIS A): France, High Input System B (HIS B): USA, Middle Input System A (MIS A): Mexico, Middle Input System B (MIS B): Philippines, Low Input System (LIS): Tanzania. Note: For sugars, vegetable oils and alcoholic beverages, the food item is different than the crop. See column 2. In these cases, the kg·N/ton of food and m2/ton of food is different than the kg·N/ton crop and m2/ton crop. Furthermore, no data of kg·N/ton food and m2/ton food is given to feed since it is converted into animal food products. See Table 2. Data sources: 1 FertiStat Database [24]; 2 FAO Statistics [4]; 3 calculations from the authors from Equations (1) and (2), see the methodology section for details.
Table 2. Production data for the animal food products.
Production Systemkg·N/ton Food 1m2/ton Food 1 kg·N/ton Food 1m2/ton Food 1Feed-Food Efficiency Factors in kg Feed/kg Weight Carcass or Milk and Eggs 2
Beef Poultry Beef19.0
HIS A35620,932HIS A523085Mutton meat13.3
HIS B33822,517HIS B503318Pork3.9
MIS A48781,096MIS A7211,951Poultry Meat2.8
MIS B484104,407MIS B7115,386Milk1.1
LIS130162,282LIS1923,915Eggs2.3
Mutton & goat meat Milk
HIS A24914,653HIS A211212
HIS B23615,762HIS B201304
MIS A34156,767MIS A284695
MIS B33973,085MIS B286045
LIS91113,598LIS89395
Pork Eggs
HIS A734297HIS A432534
HIS B694622HIS B412726
MIS A10016,646MIS A599817
MIS B9921,431MIS B5912,639
LIS2733,311LIS1619,645
Names of systems and the countries of their data sources: High Input System A (HIS A): France, High Input System B (HIS B): USA, Middle Input System A (MIS A): Mexico, Middle Input System B (MIS B): Philippines, Low Input System (LIS): Tanzania. Data sources: 1 Calculations from the authors from Equations (3) and (4), see text for details; 2 Mekonnen and Hoekstra [28] (Appendix 1).
Table 3. Food consumption data for each system.
kg/Cap/YearAffluent Diet AAffluent Diet BTransition Diet ATransition Diet BBasic Diet
cereals120108162154105
roots53571631162
pulses2512220
sugars4164522310
vegetable oils22281057
vegetables93123576234
fruits11511110912277
alcohol8798611563
beef26401747
mutton meat31111
pork313015180
chicken224930101
milk2472561131338
eggs14141841
Names of systems and the countries of their data sources: Affluent Diet A: France, Affluent Diet B: USA, Transition Diet A: Mexico, Transition Diet B: Philippines, Basic Diet: Tanzania. Source of data: Food Supply data of 2009 from the Food Balance Sheets [4].

