Article

Land-Based Mitigation Strategies under the Mid-Term Carbon Reduction Targets in Indonesia

1
Center for Social and Environmental Systems research, National Institute for Environmental Studies, Tsukuba 305-8506, Japan
2
International Institute for Applied Systems Analysis (IIASA), Laxenburg A-2361, Austria
3
Center for Climate Risk and Opportunity Management in Southeast Asia Pacific (CCROM-SEAP), Bogor Agricultural University, Bogor 16143, Indonesia
*
Author to whom correspondence should be addressed.
Sustainability 2016, 8(12), 1283; https://doi.org/10.3390/su8121283
Submission received: 18 September 2016 / Revised: 9 November 2016 / Accepted: 16 November 2016 / Published: 8 December 2016

Abstract

:
We investigated the key mitigation options for achieving the mid-term target for carbon emission reduction in Indonesia. A computable general equilibrium model coupled with a land-based mitigation technology model was used to evaluate specific mitigation options within the whole economic framework. The results revealed three primary findings: (1) If no climate policy were implemented, Indonesia’s total greenhouse gas emissions would reach 3.0 GtCO2eq by 2030; (2) To reduce carbon emissions to meet the latest Intended Nationally-Determined Contributions (INDC) target, ~58% of total reductions should come from the agriculture, forestry and other land use sectors by implementing forest protection, afforestation and plantation efforts; (3) A higher carbon price in 2020 suggests that meeting the 2020 target would be economically challenging, whereas the INDC target for 2030 would be more economically realistic in Indonesia.

1. Introduction

In 2009, the Indonesian government pledged to reduce carbon emissions by 26% through its own efforts and by up to 41% through international support compared with the business-as-usual (BaU) scenario by 2020. Since then, Indonesia has promulgated relevant legal and policy instruments, including a national action plan to reduce greenhouse gas (GHG) emissions. In the latest submission of the Intended Nationally-Determined Contributions (INDC) to the United Nations Framework Convention on Climate Change [1], Indonesia pledged to further cut its GHG emissions by 29% compared with the BaU level by 2030. Indonesia’s INDC [1] outlines the country’s transition to a low-carbon future by describing the enhanced actions and environment required during the 2015–2019 period to lay the foundation for more ambitious goals beyond 2020, contributing to a concerted effort to prevent a 2 °C increase in global temperature. In Indonesia, domestic GHG emissions were 1.8 billion tons carbon dioxide equivalents (GtCO2eq) in 2005, ~65% of which were derived from the agriculture, forestry and other land use (AFOLU) sectors (Ministry of Environment, 2010). The INDC [1] shows that Indonesia has taken significant steps to reduce emissions from these land use sectors by reducing deforestation and forest degradation and restoring ecosystem functions and sustainable forest management, including social forestry through active participation of the private sector, small and medium enterprises, civil society organizations, local communities and the most vulnerable groups. Meeting this target requires quantitative evaluations and specification of highly efficient mitigation countermeasures, which should be prioritized.
Several studies have addressed potential future land use mitigation efforts in the land use sector of Indonesia by examining several types of specific countermeasures. However, some of these studies used static methodologies based on marginal abatement cost curves [2,3,4,5] without considering changes in mitigation effects or countermeasure costs over time. In addition, other studies estimated historical GHG emissions from peat decomposition, peat fires and forest fires [6,7,8,9,10], but did not evaluate the mitigation potential and cost of peatland area and fires [11] in agriculture and land use sectors containing peatland, considering changes in mitigation effects and countermeasure costs over time. Hasegawa et al. [12] assessed the national GHG emission reduction target for 2020, but no studies have focused on the INDC target.
In this study, we aimed to quantify the potential amounts and costs of GHG emission reduction for agriculture and other land use sectors in Indonesia.

2. Methodology

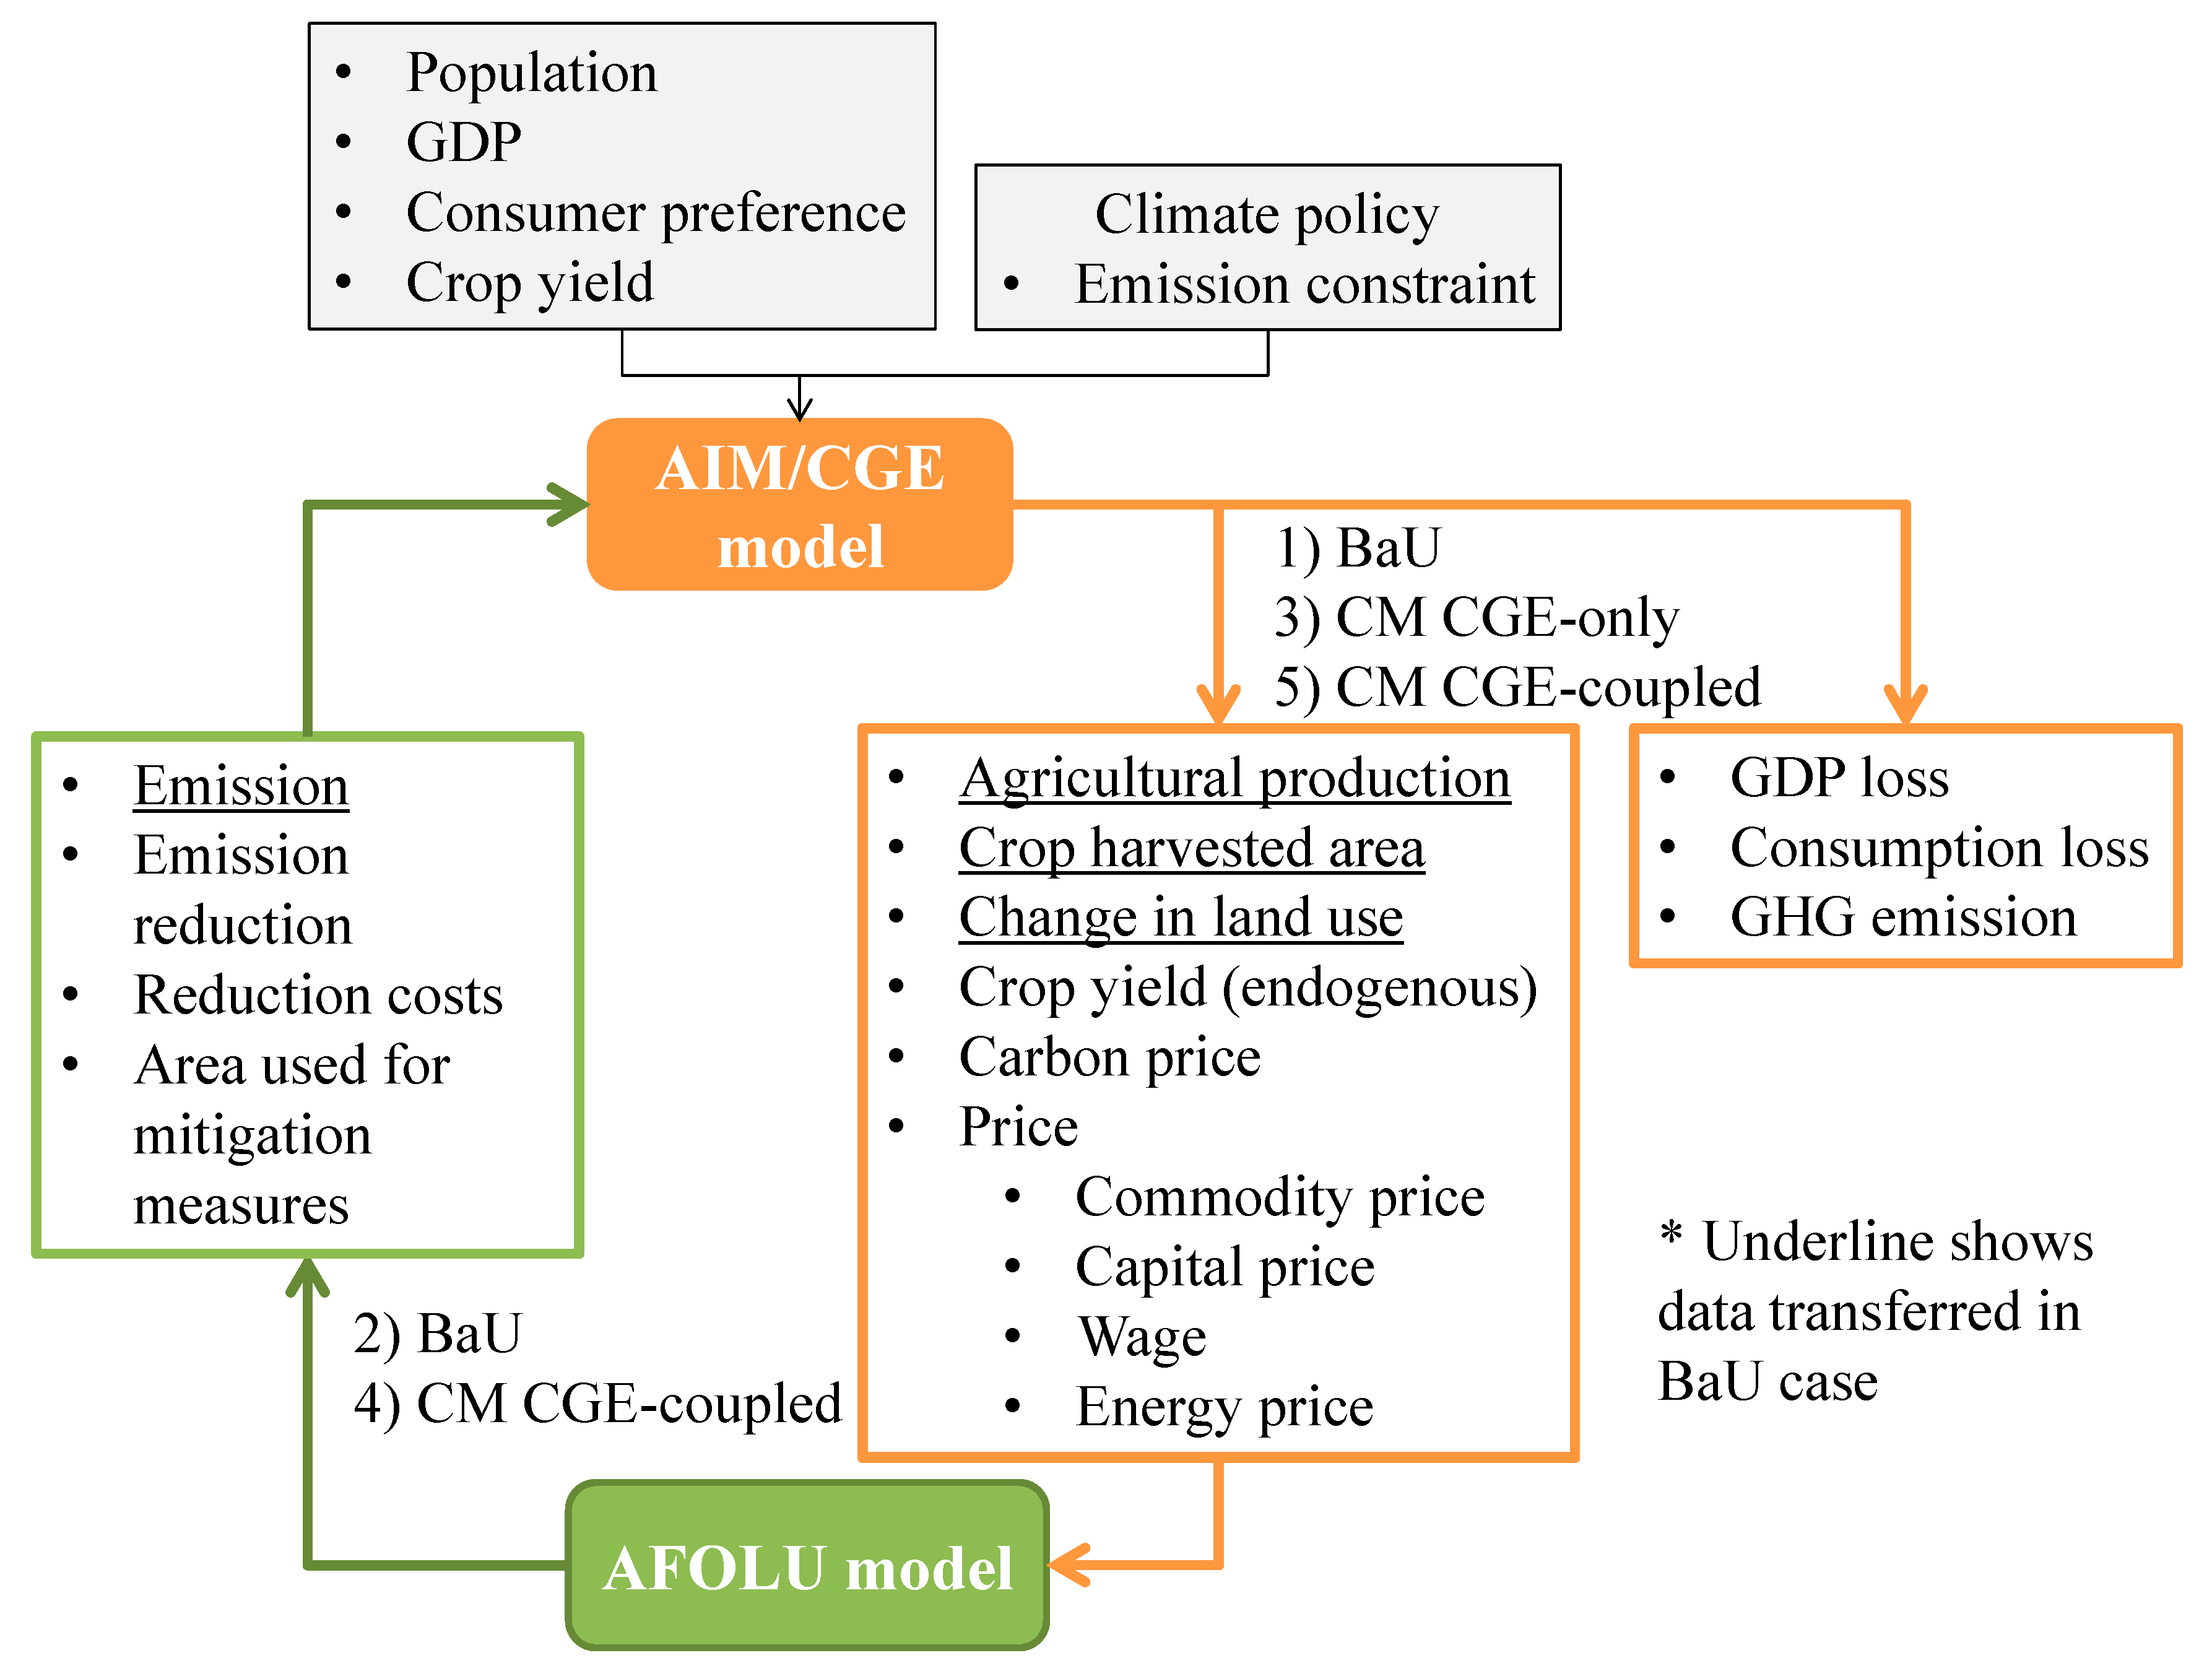
2.1. Model Framework

We used the integrated framework of the national Asia-Pacific Integrated Model/Computable General Equilibrium (AIM/CGE) and a bottom-up technology model (i.e., the AFOLU model) built on the work of Hasegawa et al. [12] (Figure 1). This integration makes it possible to capture two important aspects in climate mitigation assessments; first the CGE model covering the entire economic market provides macroeconomic impacts of climate change mitigation. Second, the AFOLU bottom-up model estimates the overall mitigation cost and effects with a consideration of specific technical mitigation measures. Relevant conditions and data were translated several times between the models until they converged. Socioeconomic assumptions such as population, gross domestic product (GDP), consumer preferences and crop yields as well as a country-level emissions pathway were given into the CGE, which outputs GHG emissions, carbon price and consumption loss. Then the carbon price provided by the CGE and future assumptions of agricultural production, harvested crop area and land-use area were given to the AFOLU model which outputs mitigation cost and amounts and area used for the mitigation measures. See Hasegawa et al. [12] for a more detailed description on the modeling framework.
The CGE model has been built work on by Fujimori et al. [13] and Hasegawa et al. [12]. The model consists of individual behavioral functions which describe changes in supply, demand, investment or trade responding to prices of production factors and commodities, technology development, consumer preference and income. Production functions were formulated as multi-nested constant elasticity substitution (CES) functions (We used a CES function by following the existing studies (e.g., Robinson et al., 2014), though there are other possible formulae of a production function. Our main results of mitigation costs in a macro-economic framework would not be influenced by the formula because the difference of relative prices between baseline and mitigation scenarios is low). Household demand was described by utility maximization using a linear expenditure system function. A parameter of the formula, consumer preference was calculated by income elasticity of food demand based on Global Perspective Studies Unit [14]. The CGE model contains 17 countries or regions and 42 industrial classifications. The oil palm industry, which is a major agricultural industry in Indonesia, was aggregated into an oil crop industry sector. See Fujimori et al. [13] and Hasegawa et al. [12] for more detail.
The AFOLU bottom-up model is a tool to estimate mitigation costs and reduced emission for agricultural, forest and land-use sectors at the national level [11], although it has only been applied to Asian countries [11,15,16,17]. Under a given carbon price and assumptions of future agricultural production and land-use area the model calculates reduced emissions and costs of individual specific measures as a result of technology selection at the cost minimization. To capture characteristics of land-based measures in terms of mitigation costs and effects over years, reduction effects, costs and the land area used for implementing the mitigation measures within a year was passed on to the next year. See Hasegawa and Matsuoka [11] for more details regarding the AFOLU model.

2.2. Scenario Matrix Design

We designed two groups of scenarios (Table 1). The first set included basic scenarios to assess the effects of climate mitigation, while the second set was designed to conduct a sensitivity analysis. In the basic scenario group, we prepared two scenarios with different emission conditions: (a) the BaU scenario, wherein emission constraints were not imposed; and (b) the carbon mitigation (CM) scenario, which included emission constraints. Indonesia’s GHG reduction targets of 26% and 29% from BaU levels by 2020 and 2030, respectively, were assumed to be emission constraints for the CM scenario. The study period covered 2005–2030.
The model outputs depended on numerous uncertain parameters. The second set of scenarios was included to analyze the model’s sensitivity to parameters strongly related to climate mitigation in Indonesia. As indicated in Table 1, we analyzed the effects of four key factor changes: (i) crop yields; (ii) unplanned deforestation ratio; (iii) area of degraded peatland and fires; and (iv) land availability to reduce deforestation. In the case with higher crop yields (highYLD), the annual growth ratio of crop yields was 3%–11% higher than that in the CM case. The high yield value was assumed using uncertainty ranges of crop yields based on expert judgment (see Table A1 in the Appendix A). In the case with low unplanned deforestation (CM-lowDEF), the unplanned deforestation rate was assumed to be 50% (175,000 ha/year) less than the level in the CM case. A 0.5%/year increase in the growth ratios of the area of peatland degradation and fires, which was approximately the same uncertainty of land degradation for the year 2030 as shown in Page [18], was assumed for the case with more degraded peatland area (CM-highDPA). Since there was insufficient information on reduction of unplanned deforestation, the annual implementation ratio of the reduction of unplanned deforestation was assumed to increase linearly from the base year and to reach the same level as the deforestation ratio in the BaU scenario by 2020 for the case with a greater reduction of unplanned deforestation (CM-highRUD). This results in an increase in the potential area of protected forest by 150,000 ha/year compared with that in the CM case in 2020. For socio-economic aspects, we did not perform the sensitivity analysis because we used socio-economic assumptions provided by local experts as Indonesia’s governmental perspective, which are suitable for our aim to provide insights into the governmental approach to develop a mitigation strategy, and other assumptions are not fit to the objective of the study.

2.3. Data

Table 2 shows mitigation countermeasures used for the forestry and land use sector. Costs of measures were assumed based on several studies (see the footnotes in Table 2). These costs included social costs (e.g., compensation for income from illegal logging or shifting agriculture, costs of resettlement of shifting agriculture and compensation for forced removal from plantation areas), which were assumed to be 30% of the direct costs (total cost of labor, capital, energy and land). The maximum annual available area was set based on the strongest mitigation scenario in Boer [2]. The maximum annual available area was assumed to increase over time based on the theory of a sigmoidal curve [19]. The rate of increase was set such that implementing mitigation measures increased over time to achieve the degree of implementation in 2020 predicted by Boer [2]. Data on agricultural mitigation measures were based on Hasegawa and Matsuoka [11].
Peatland drainage and fires are the main emission sources in Indonesia. Future emissions from peatland drainage and fires depend on assumptions of the future areas of drained peatland and peatland fires, which pose a large uncertainty. These areas were calibrated using base-year emissions from both peatland drainage and peatland fires. The area of peat drainage was assumed to increase at a rate of 0.5%/year, whereas the area of fire was set to be constant. Using assumptions based on more accurate information may alter the results of this study, but would not change the main findings.
We assumed population and GDP growth to be 1% and 5%, respectively, provided by local experts as Indonesia’s governmental perspective, which are suitable for our aim to provide insights into the governmental approach to develop a mitigation strategy. To assess the national total INDC, we needed to specify energy-related emissions. We used two assumptions for the energy sector. First, power generation projections were assumed based on the utility expansion plan [20]. This was differentiated into the BaU and mitigation cases, as shown in the Appendix A (Table A2 in the Appendix A). Second, energy end-use depended on improving autonomous energy efficiency. In this study, non-price driven energy improvement was assumed. This is so-called AEEI (autonomous energy efficiency improvement) and we assumed 1.25% negative number to reproduce governmental energy demand projection [21]. Although the values are unusual from the normal CGE studies, we applied that value to assess national policy appropriately.

3. Results

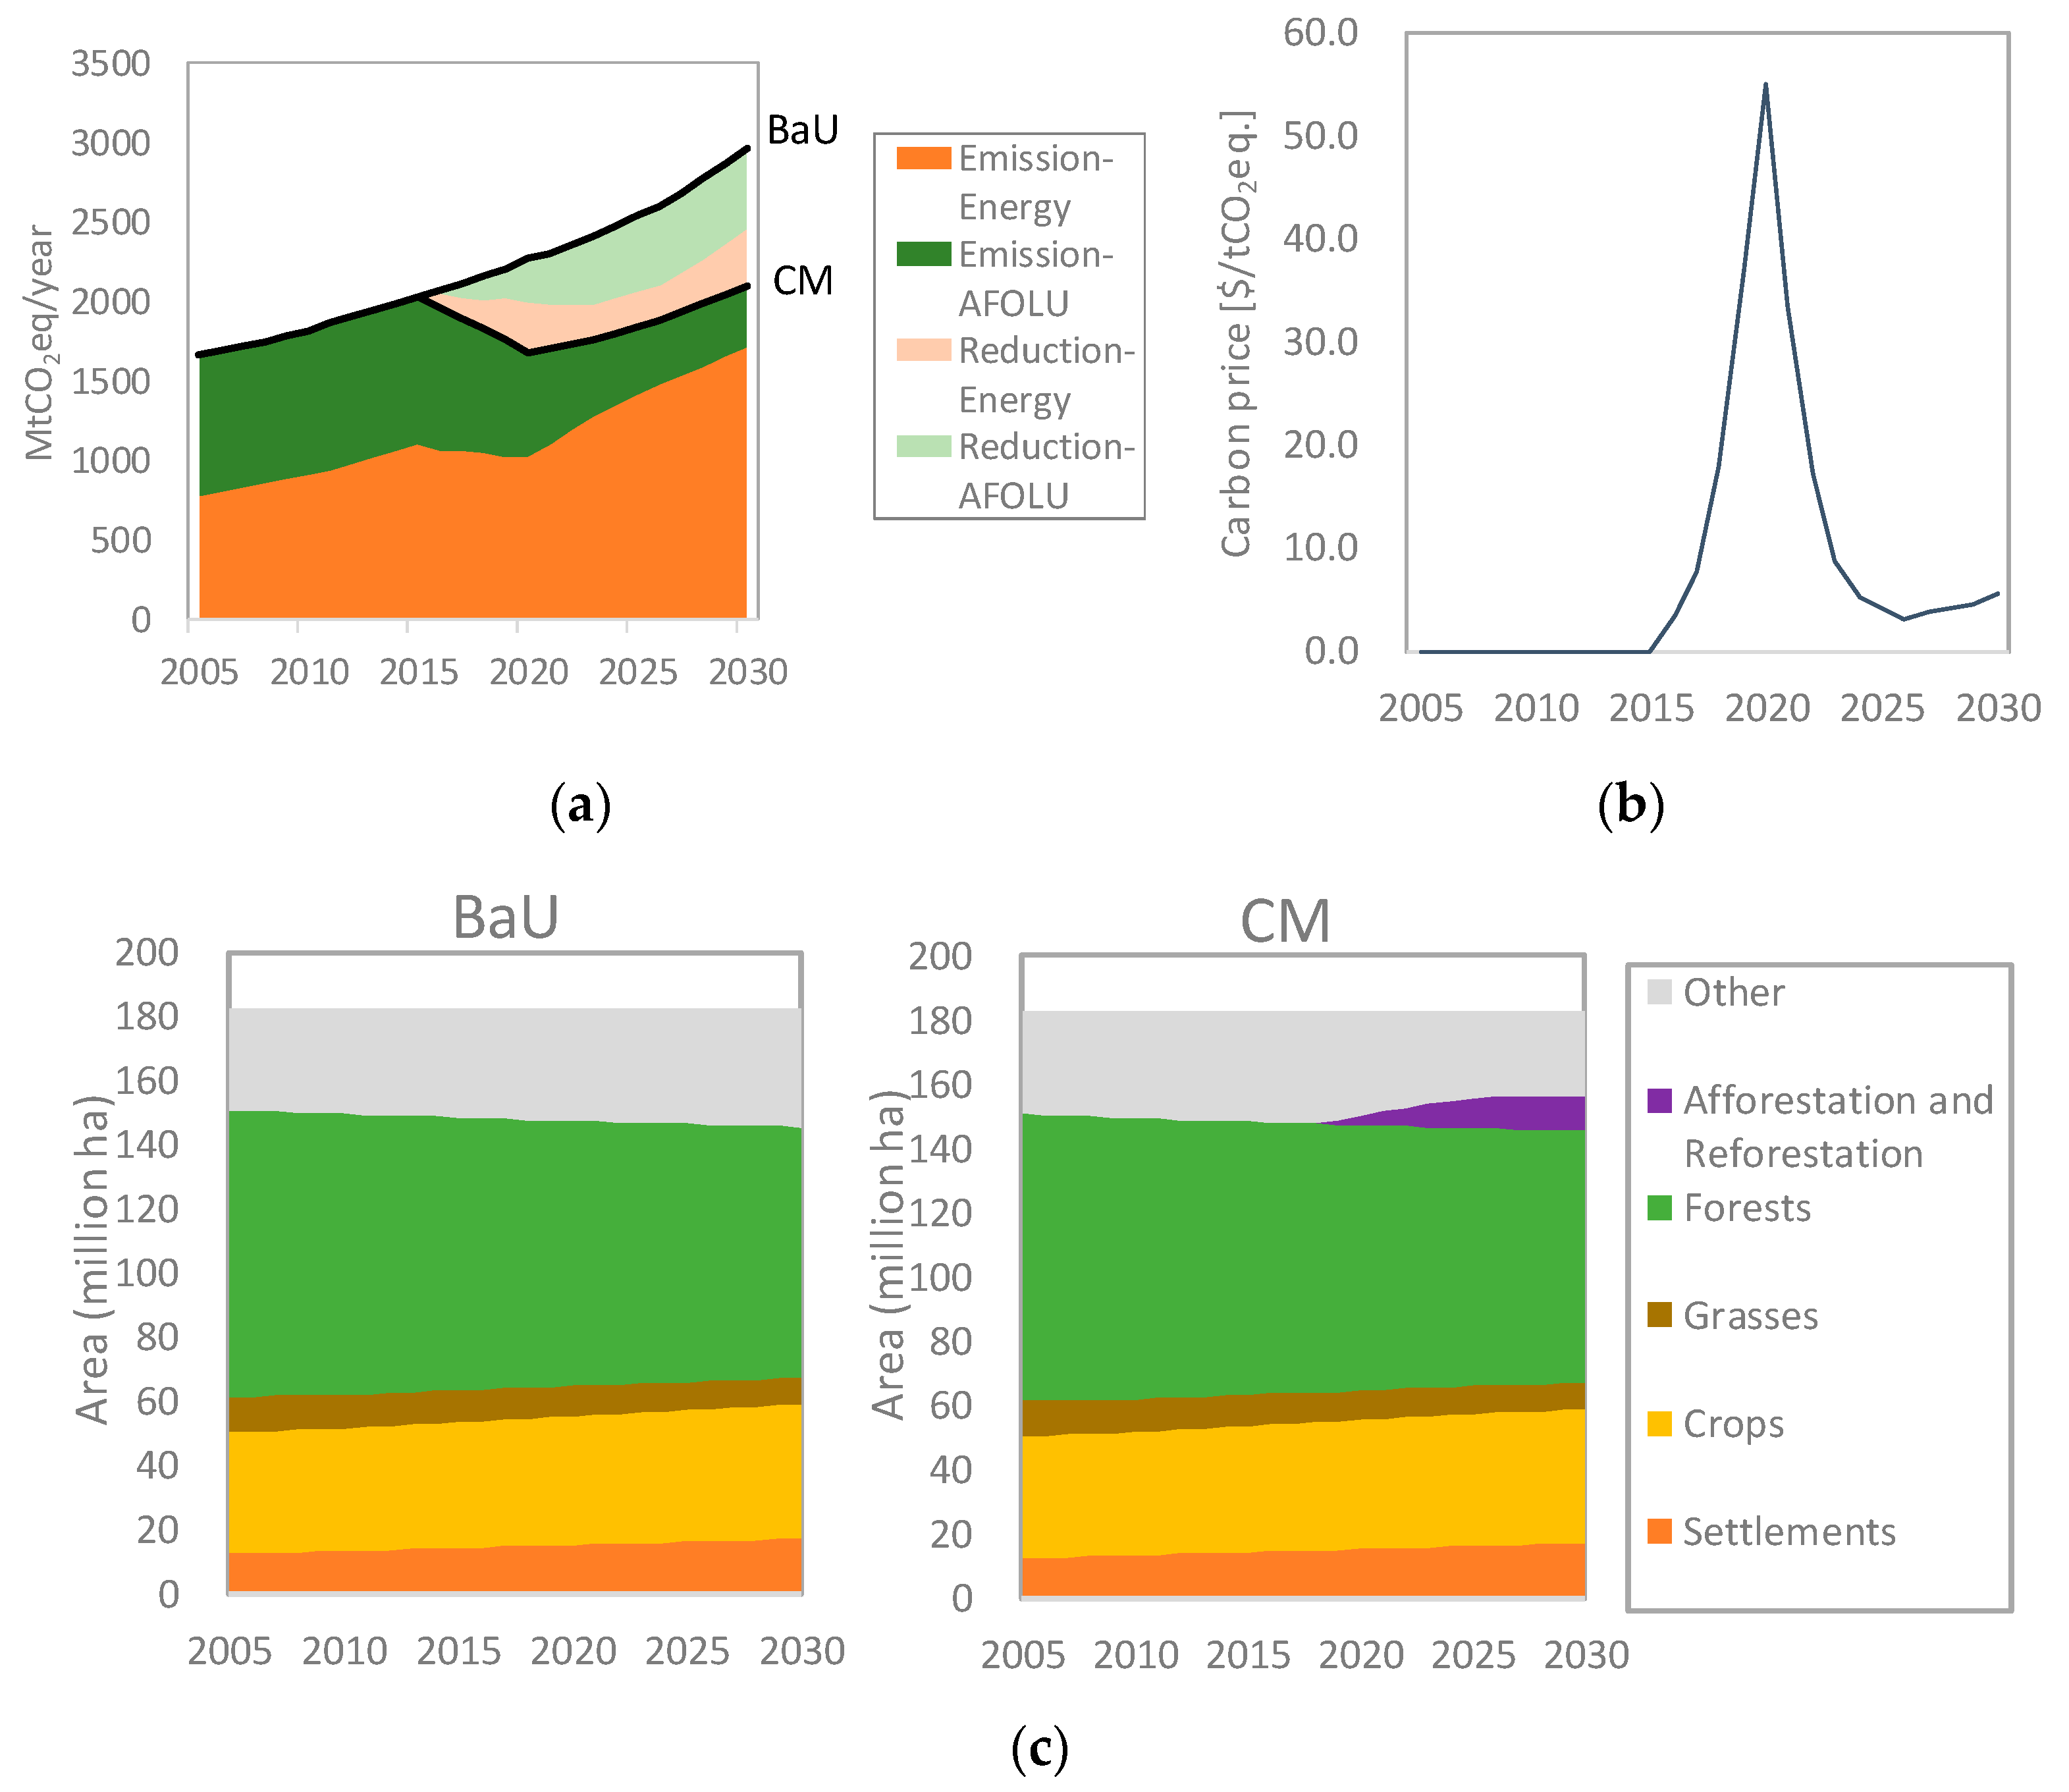
3.1. Overview of Future Trends

Before addressing the main results, we present a broad picture of the circumstances in Indonesia from 2005–2030 in Figure 2. To characterize the effects of constraining emissions, we compared the BaU and CM scenarios with respect to the representative elements related to climate mitigation in the agriculture and land use sectors (GHG emission and reduction by sector, carbon price and area of land use). Without emission constraints, total baseline emissions will reach ~3000 MtCO2eq/year by 2030. In contrast, the reduction target of 29% by 2030 would be achieved in the CM case. Emissions from land use were stable throughout the analysis period, reaching ~900 MtCO2eq/year (30% of total emissions) in the BaU case. In the CM case, the predicted emission reduction by 2030 is 860 MtCO2eq/year, of which 500 MtCO2eq/year (58% of total reductions) would be reduced in the land use sector.
The carbon price started to increase along with the imposed emission constraints, reaching USD 55/tCO2eq in 2020 and decreasing to USD 5.4/tCO2eq by 2030. In the CM case, 10.7 million ha forest area would be converted into plantation or natural regeneration areas as mitigation countermeasures by 2030.
The energy aspects, including primary energy, power generation mix and final energy are shown in the Appendix A (Table A2).

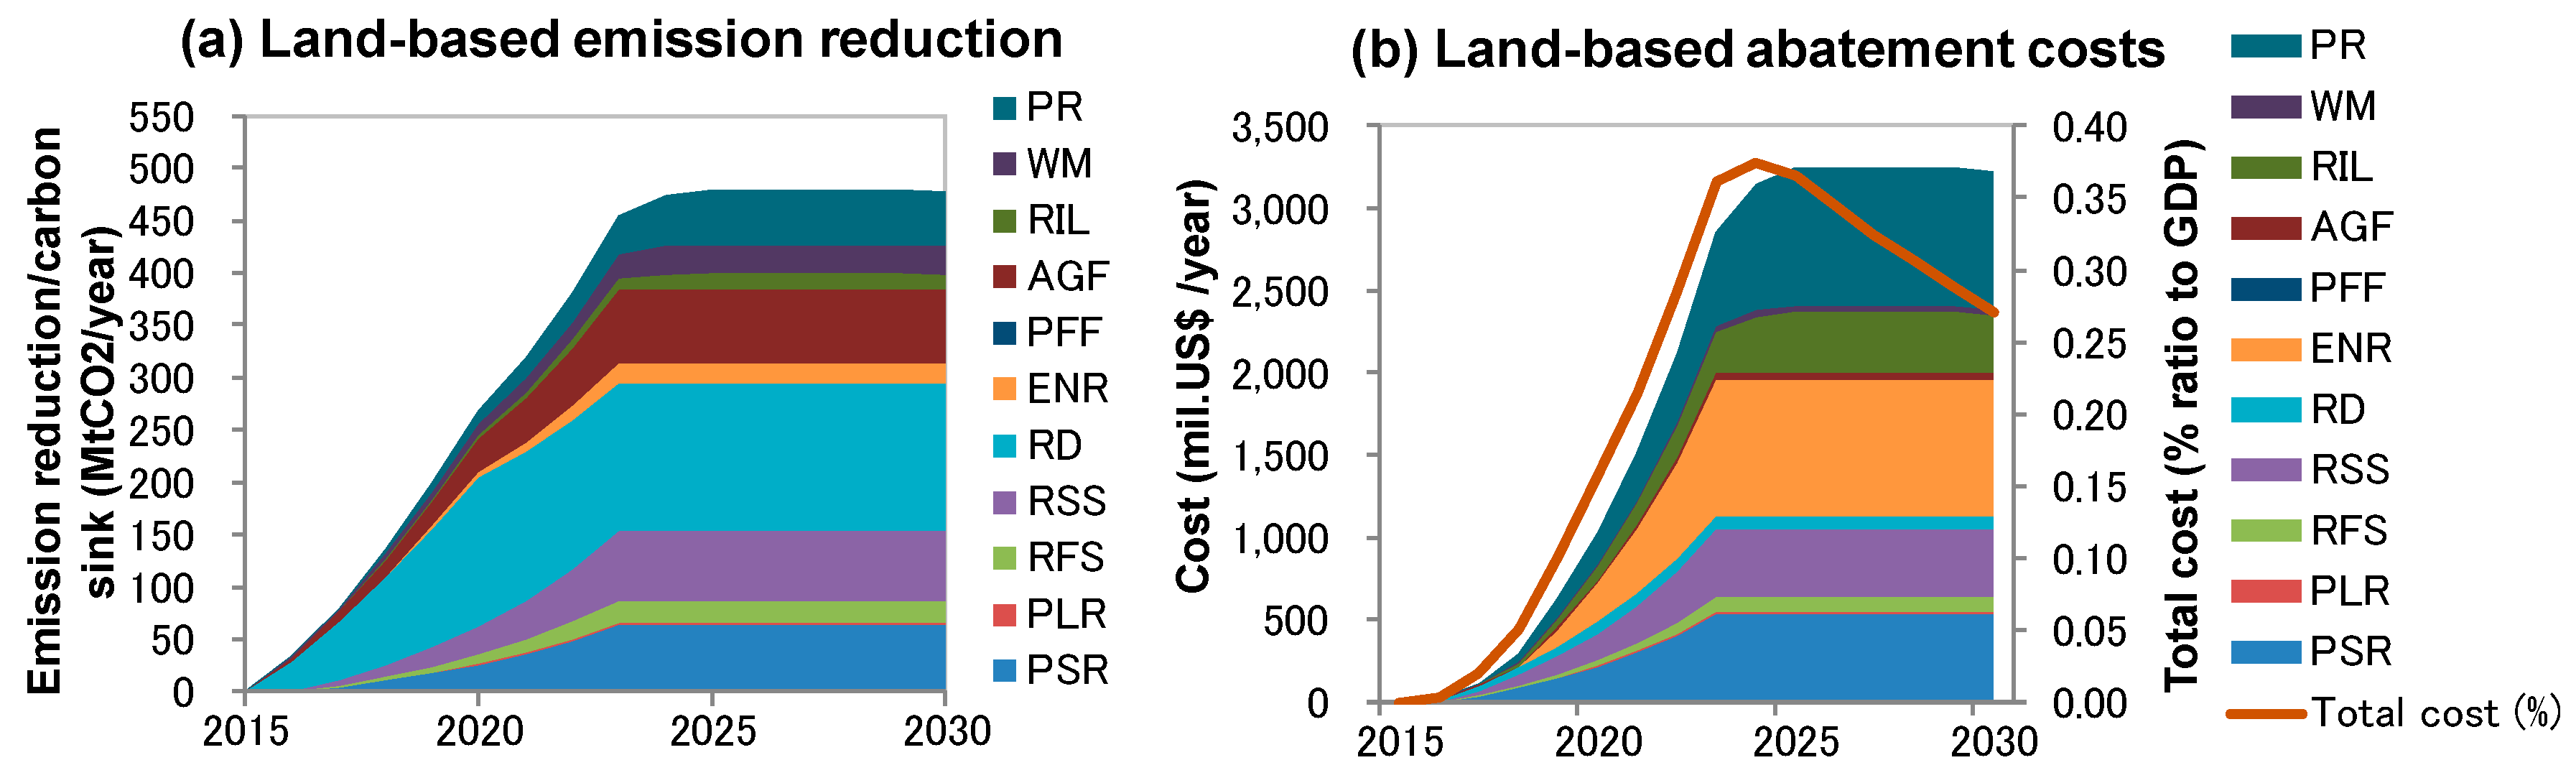
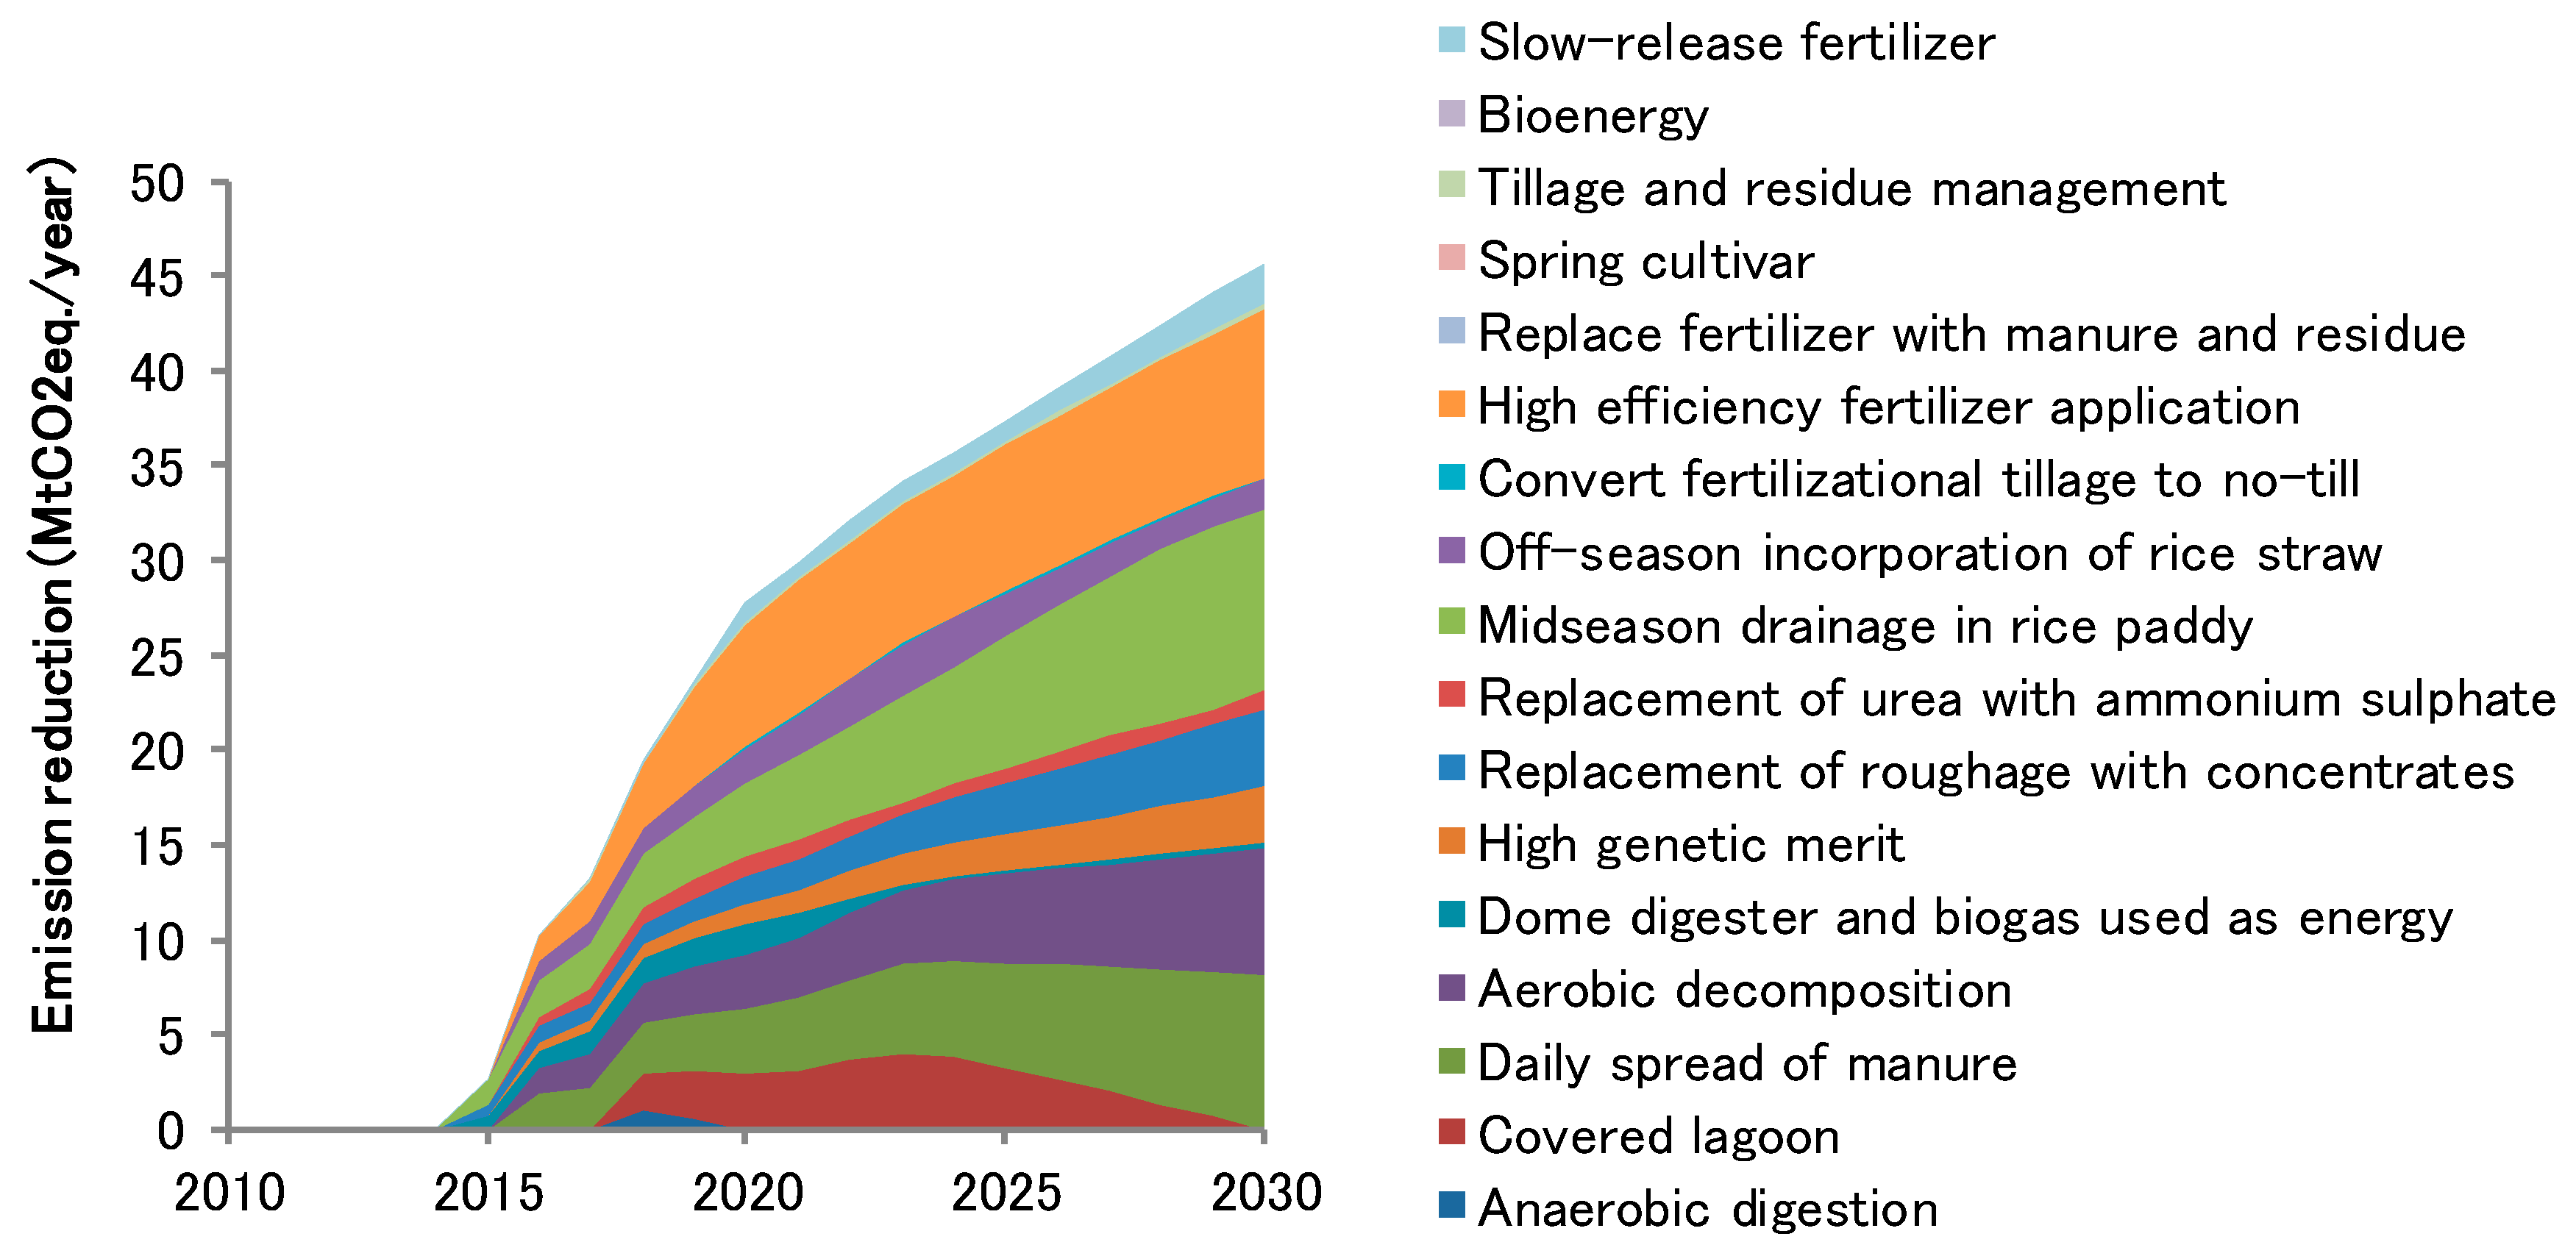
3.2. Carbon Emission Reduction: Key Land-Based Options

We show two sectoral emissions reductions separately. First, Figure 3 shows the predicted carbon emission reductions and abatement costs by forestry and other land use sector by 2030 with a breakdown of countermeasures calculated using the bottom-up model under a given reduction target. The reduction potential increased with the carbon price. The total emission reductions and abatement costs in the land use sector reached 480 MtCO2/year and USD 3.2 billion/year by 2030 (~0.3% of the GDP equivalent of Indonesia in 2030). Forest Protection (FP), plantation and reforestation (Reforestation: slow-growing species; RSS), Reforestation: fast-growing species; RFS, Plantation: long rotation; PLR, and Plantation: short rotation; PSR; see Table 2 for details) and agro-forestry contributed greatly to GHG emission reductions in the land use sector, because they have relatively high economic efficiencies and large potential areas for their application. Total mitigation potential increases over time with its costs and hits the ceiling before 2025. This trajectory means that a carbon price is high enough to introduce mitigation measures at a maximum annual level and to increase mitigation potential until it achieves a technical potential level (see Table 2 for the maximum annual level and the technical potential level). The peak-out timing depends on the assumptions of total land capacity for implementing measures and annual applicable amount of measures and, thus, can be shifted backward or forward, but does not largely affect the situation in the year 2030.
Next, Figure 4 shows the reduced emission in the agriculture and livestock management by 2030 with a share of countermeasures. Total reduced CH4 and N2O emissions reached 47 MtCO2/year in 2030, which was a much smaller than that in the land use sector. High-efficiency fertilizer application (i.e., split fertilization) on cropland soils, water management in rice paddies and livestock’ manure management contributed substantially to reducing emissions in the sectors. Increased crop and livestock production made more opportunities to implement these additional effective mitigation measures.
In general, Figure 3 shows carbon sequestration by enhancing carbon storage and land-based management, while Figure 4 shows non-CO2 emissions reduction mostly by changing agricultural inputs and management. These are different in terms of greenhouse gases’ mitigation function. Carbon sequestered can revert to its original status if the management returns to its original form and is restricted by land availability, but shows a larger potential in the mid-term, while agricultural options are lower in the mid-term, but are not so restricted by land availability and will continue beyond 2030.

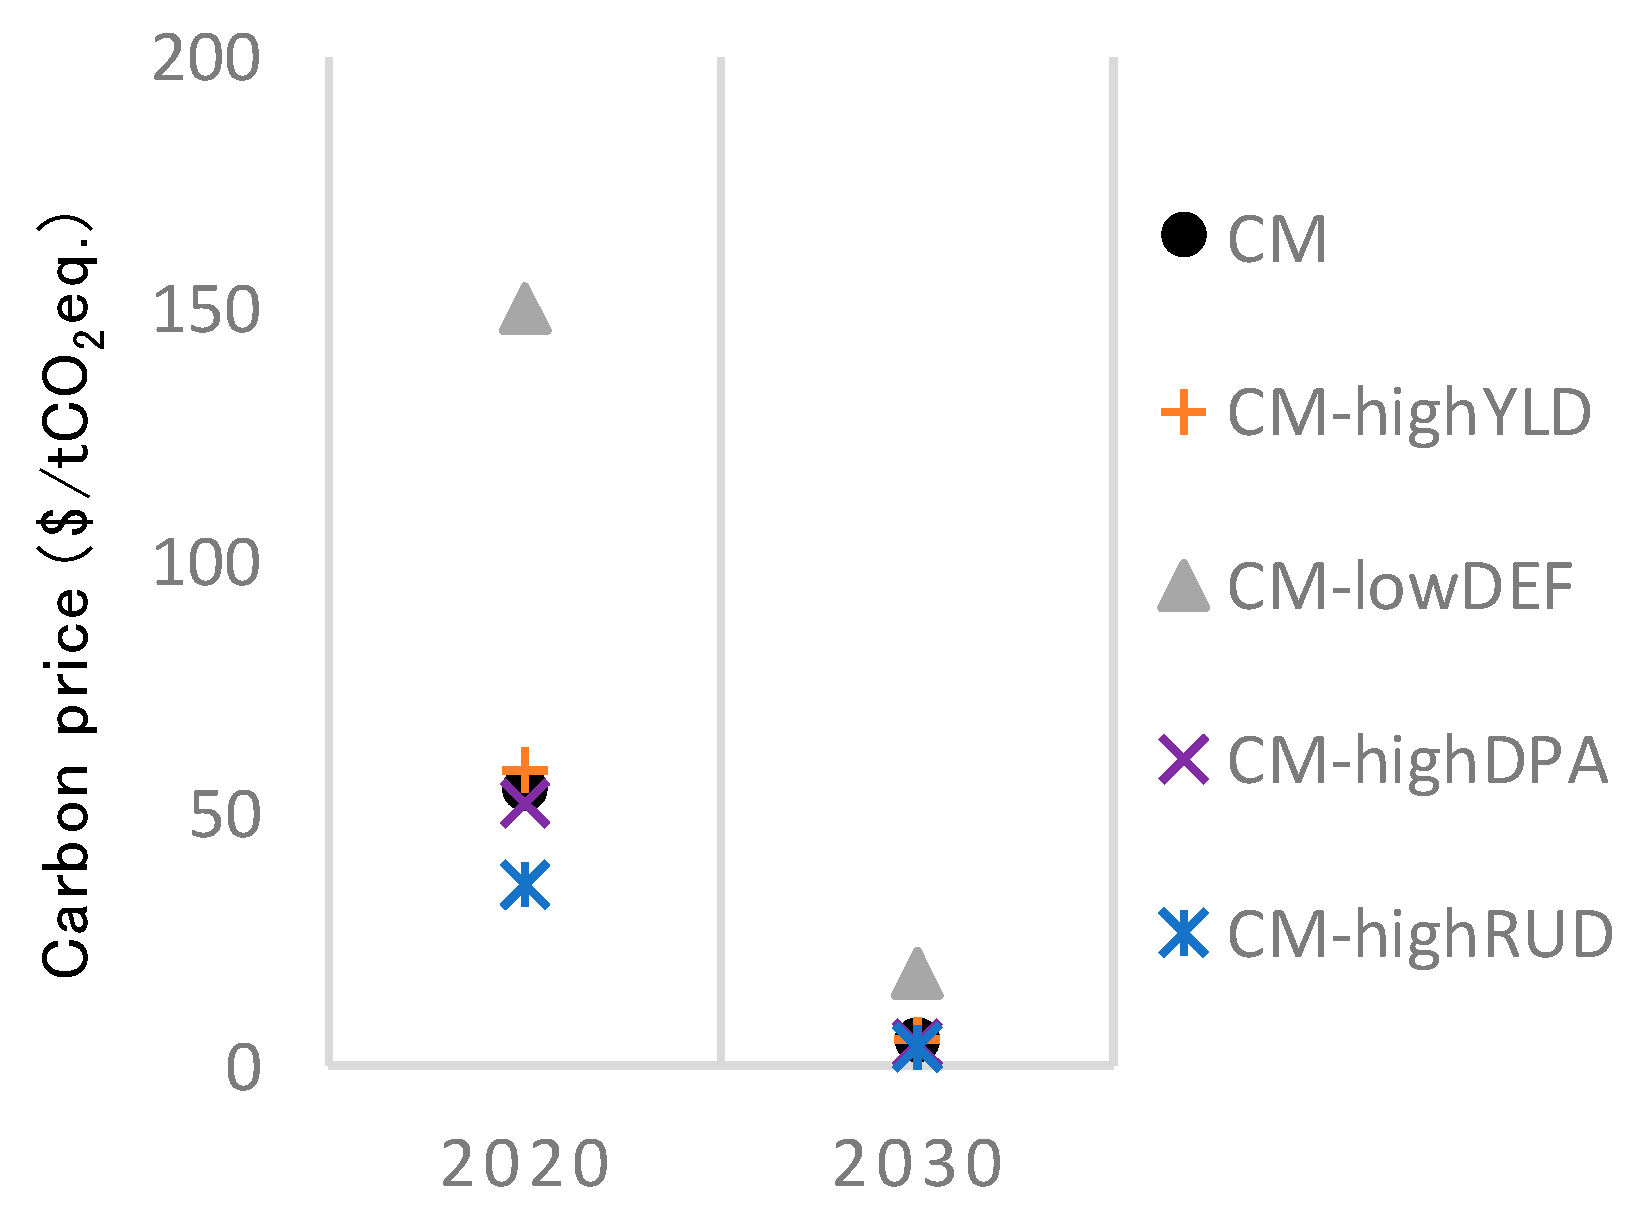
3.3. Sensitivity Analysis

Figure 5 shows the results of the sensitivity analysis of the carbon price to changes in the five assumptions described in Section 2.2. Increases in carbon price were observed in 2020 in all cases with a certain range of uncertainty. Given these results, we suggest that the degree of consumption loss caused by achieving the reduction target by 2020 strongly depends on the baseline unplanned deforestation ratio and area dedicated to reducing unplanned deforestation. There were no large differences in the other cases.
Cases with lower unplanned deforestation ratios (CM-lowDEF) had lower BaU emissions and lower potentials from reducing unplanned deforestation, which likely has the highest reduction potential among the land use sectors in Indonesia. The decrease in the deforestation ratio increases the difficulty of achieving the target by 2020 by diminishing the reduction potential and driving up the carbon price in 2020. A 50% lower deforestation ratio resulted in a carbon price range of 55–150 USD/tCO2eq (CM-lowDEF) in 2020. In contrast, an increase of 150,000 ha/year in the area dedicated to reducing unplanned deforestation (CM-highRUD) in 2020 resulted in a carbon price range of 35–55 USD/tCO2eq (CM) in 2020, but no large difference in 2030.

4. Discussion

4.1. Key Findings and Policy Implications

This paper assesses key mitigation options for achieving the INDC reduction target by 2020 and 2030 in Indonesia integrating the AIM/CGE model and a bottom-up technology assessment model, with a focus on the agriculture and forestry sectors and land use change. In addition, we performed a sensitivity analysis to analyze uncertain factors related to land use mitigation in Indonesia.
According to the results, the 2020 target poses a great challenge economically compared with the 2030 target. Carbon prices can act as an incentive to reduce energy-related emissions by increasing the consumption price of energy-related products and non-energy-related emissions using marginal abatement cost curves. The carbon price in 2020 can be interpreted as a challenge for the 2020 target. There are two reasons for this: first, the emission reduction increased briefly following the initial implementation in 2015. Second, relatively small reductions in land use sectors required large emission reductions in energy-related sectors, leading to increases in the carbon price and consumption loss.
By contrast, the 2030 emission target appears relatively easier to realize. Considering the current GHG emission profile, the AFOLU sector is the major source of emissions, but would no longer be the main source in 2030. The major contribution of GHG reductions is shared by the energy and AFOLU sectors. With regard to the AFOLU side policy, strong intervention in land use is needed, such as enhancing forest protection and plantation areas.
From the sensitivity analysis, achieving the 2020 reduction target in Indonesia would result in a carbon price strongly dependent on the BaU emission pathway driven by the assumptions related to deforested area and the implementation of the reduction of unplanned deforestation and forest protection efforts.
This study represents a first trial for assessing the INDC reduction target in Indonesia by 2030 and provides useful information that may assist decision-making for GHG mitigation strategies, such as developing a roadmap for achieving the INDC target. In addition, it would be useful to revise the INDC commitment in 2020. For real policy decision-making, more applicable mitigation assessment should be conducted by reassessing the socioeconomic assumptions as well as technology settings in this study, based on development plans created with stakeholders and policy makers. Also, reflecting Indonesia’s current situation or land-use regulations, which were not taken into account in this study, would be helpful for developing a more realistic mitigation policy for the country. Better understanding of these assumptions is crucial for estimating future consumption loss and thus a sensitivity analysis needs to be performed.

4.2. Limitations and Future Work

Many aspects remain to be expanded on in future work, as discussed below:
  • Spatial distribution of land-use in the country was not taken into account. Gridded agro-ecological information could help clarify the spatial distribution of suitable areas for implementing mitigation measures and provide more useful information in future analyses;
  • The cost for reducing unplanned deforestation is difficult to define since reducing deforestation can be realized through many activities, including implementing forest monitoring, empowering communities surrounding threatened forests (e.g., providing alternative livelihood communities, improving crop productivity, changing from shifting cultivation into permanent agriculture), institutional development and empowering forest management groups;
  • Ecosystem services maintained by reducing deforestation were not considered in the study. Therefore, our consumption loss might be a pessimistic estimate. Integrating this into the models as a monetary value could provide a new perspective to land-based mitigation measures.
These issues should be addressed in future studies.

Acknowledgments

This study was supported by the Environmental Research and Technology Development Fund (2-1402) of the Ministry of the Environment, Government of Japan and JSPS KAKENHI Grant Number JP16K18177.

Author Contributions

Tomoko Hasegawa, Shinichiro Fujimori, Rizaldi Boer and Gito Sugih Immanuel conceived and designed research. Tomoko Hasegawa and Shinichiro Fujimori performed the experiments. Rizaldi Boer and Gito Sugih Immanuel provided local data; Toshihiko Masui supervised the project; all authors analyzed the data and contributed to discussion; Shinichiro Fujimori commented on the manuscript at all stages; and Tomoko Hasegawa wrote the paper.

Conflicts of Interest

The authors declare no conflict of interest.

Appendix A

Table A1. Crop yield and deforestation rate assumptions used in the sensitivity analysis.
CommoditiesYield of Annual Crops (t/ha)
2030
2010BaUCMCM-highYLD
Rice paddy5.05.96.06.3
Other cereals (mainly Maize)4.44.75.25.6
Vegetables9.09.510.00.4
Oil Crops5.37.07.07.0
Other Crops0.91.11.11.1
Cassava20.223.124.627.2
Sugar crops (mainly sugar cane)47.956.561.065.3
Fruits and Nuts10.711.311.812.3
Industrial crop0.91.01.11.1
Palm oil (FFB)16.122.723.424.1
2010BaUCMCM-lowDEF
Deforestation Rate (000 ha/year) 500352175
Note: Based on local expert judgement.
Table A2. Power generation assumptions. Other renewable energy types, such as wind and solar energy, comprised <0.01% of the total share.
Power SourceBaUCM
2020203020202030
Coal65.9%69.8%65.9%68.6%
Oil1.6%0.4%1.6%1.4%
Gas24.9%26.1%23.8%20.2%
Geothermal2.6%1.3%3.4%5.0%
Hydropower4.9%2.4%5.2%4.8%

References

  1. Intended Nationally Determined Contributions (INDC) Republic of Indonesia. Available online: http://www4.unfccc.int/Submissions/INDC/Submission%20Pages/submissions.aspx (accessed on 10 July 2016).
  2. Boer, R. Economic Assessment of Mitigation Options for Enhancing and Maintaining Carbon Sink Capacity in Indonesia. Mitig. Adapt. Strategies Glob. Chang. 2001, 6, 257–290. [Google Scholar] [CrossRef]
  3. Sathaye, J.A.; Makundi, W.R.; Andrasko, K.; Boer, R.; Ravindranath, N.H.; Sudha, P.; Zuomin, S. Carbon mitigation potential and costs of forestry options in Brazil, China, India, Indonesia, Mexico, the Philippines and Tanzania. Mitig. Adapt. Strategies Glob. Chang. 2001, 6, 185–211. [Google Scholar] [CrossRef]
  4. Boer, R.; Wasrin, U.R.; Dasanto, B.D.; Makundi, W.; Hero, J.; Ridwan, M.; Masripatin, N. Assessment of carbon leakage in multiple carbon-sink projects: A case study in Jambi Province, Indonesia. Mitig. Adapt. Strategies Glob. Chang. 2007, 12, 1169–1188. [Google Scholar] [CrossRef]
  5. DNPI (Dewan Nasional Perubahan Iklim). Indonesia’s Greenhouse Gas Abatement Cost Curve. Available online: http://www.mmechanisms.org/document/country/IDN/Indonesia_ghg_cost_curve_english.pdf (accessed on 4 Octorber 2011).
  6. Page, S.E.; Siegert, F.; Rieley, J.O.; Boehm, H.-D.V.; Jaya, A.; Limin, S. The amount of carbon released from peat and forest fires in Indonesia during 1997. Nature 2002, 420, 61–65. [Google Scholar] [CrossRef] [PubMed]
  7. Van Der Werf, G.R.; Dempewolf, J.; Trigg, S.N.; Randersn, J.T.; Kasibhatla, P.S.; Giglio, L.; DeFries, R.S. Climate regulation of fire emissions and deforestation in equatorial Asia. In Proceedings of the National Academy of Sciences; Field, C.B., Ed.; Carnegie Institution of Washington: Stanford, CA, USA, 2008; Volume 105, pp. 20350–20355. [Google Scholar]
  8. Murdiyarso, D.; Hergoualc’h, K.; Verchot, L.V. Opportunities for reducing greenhouse gas emissions in tropical peatlands. In Proceedings of the National Academy of Sciences; DeFries, R.S., Ed.; Columbia University: New York, NY, USA, 2010; Volume 107, pp. 19655–19660. [Google Scholar]
  9. Hooijer, A.; Page, S.; Canadell, J.G.; Silvius, M.; Kwadijk, J.; Wösten, H.; Jauhiainen, J. Current and future CO2 emissions from drained peatlands in Southeast Asia. Biogeosciences 2010, 7, 1505–1514. [Google Scholar] [CrossRef]
  10. Miettinen, J.; Hooijer, A.; Shi, C.; Tollenaar, D.; Vernimmen, R.; Liew, S.C.; Page, S.E. Extent of industrial plantations on Southeast Asian peatlands in 2010 with analysis of historical expansion and future projections. GCB Bioenerg. 2012, 4, 908–918. [Google Scholar] [CrossRef]
  11. Hasegawa, T.; Matsuoka, Y. Climate change mitigation strategies in agriculture and land use in Indonesia. Mitig. Adapt. Strategies Glob. Chang. 2015, 20, 409–424. [Google Scholar] [CrossRef]
  12. Hasegawa, T.; Fujimori, S.; Masui, T.; Matsuoka, Y. Introducing detailed land-based mitigation measures into a computable general equilibrium model. J. Clean. Prod. 2016, 114, 233–242. [Google Scholar] [CrossRef]
  13. Fujimori, S.; Masui, T.; Matsuoka, Y. AIM/CGE [basic] manual Discussion Paper Series; Center for Social and Environmental Systems Research, National Institute for Environmental Studies: Tsukuba, Japan, 2012.
  14. Global Perspective Studies Unit; Food and Agriculture Organization of the United Nations. World Agriculture towards 2030/2050: Interim Report. Available online: http://www.fao.org/fileadmin/user_upload/esag/docs/Interim_report_AT2050web.pdf (accessed on 1 January 2006).
  15. Nguyen, T.H.; Hasegawa, T.; Matsuoka, Y. Climate change mitigation strategies in agriculture, forestry and other land use sectors in Vietnam. Mitig. Adapt. Strategies Glob. Chang. 2014, 19, 15–32. [Google Scholar]
  16. Jilani, T.; Hasegawa, T.; Matsuoka, Y. The future role of agriculture and land use change for climate change mitigation in Bangladesh. Mitig. Adapt. Strategies Glob. Chang. 2015, 20, 1289–1304. [Google Scholar] [CrossRef]
  17. Hak, M.; Hasegawa, T.; Matsuoka, Y. An assessment of GHG emissions and mitigation potential from Agriculture, Forestry and Other Land use in Cambodia. J. Glob. Environ. Eng. 2015, 71, 12. [Google Scholar] [CrossRef]
  18. Hooijer, A.; Silvius, M.; Wösten, H.; Page, S. PEAT-CO2 Assessment of CO2 Emissions from Drained Peatlands in SE Asia; Delft Hydraulics Report Q3943. Available online: http://wetlands.or.id/PDF/buku/Peat%20CO2.pdf (accessed on 12 December 2011).
  19. Grubler, A. Technology and Global Change; Cambridge University Press: Cambridge, UK, 2004. [Google Scholar]
  20. Perusahaan Listrik Negara. Electricity Supply Business Plan PT Perusahaan Listrik Negara (PLN) (Persero) 2016–2025. Available online: http://www.pln.co.id/blog/ruptl/ (accessed on 1 August 2016).
  21. Siagian, U.W.; Yuwono, B.B.; Fujimori, S.; Masui, T. Low-carbon energy development in Indonesia in alignment with its indc by 2030. Energies 2016, in press. [Google Scholar]
  22. Japan International Cooperation Agency. Restoration Procedures Guidelines on Protected Areas—Tropical Rain Forest Tropical Monsoon Mountains and Forests—(in Bahasa); JICA: Jakarta, Indonesia, 2014.
  23. Intergovernmental Panel on Climate Change. 2006 IPCC Guidelines for National Greenhouse Gas Inventories; Eggleston, H.S., Buendia, L., Miwa, K., Ngara, T., Tanabe, K., Eds.; Institute for Global Environmental Strategies: Hayama, Japan, 2006. [Google Scholar]
Figure 1. Coupled scheme of the Asia-Pacific Integrated Model/Computable General Equilibrium (AIM/CGE) and agriculture, forestry and other land use (AFOLU) models [12]. BaU, business-as-usual; CM, carbon mitigation.
Sustainability 08 01283 g001
Figure 2. (a) GHG emissions and reductions by sector in the emissions-constrained scenario (CM case); (b) carbon price and (c) area of land use change.
Sustainability 08 01283 g002
Figure 3. (a) Reduced emissions and (b) abatement costs in forestry and other land use sectors with a share of technical mitigation measures calculated using the AFOLU bottom-up model. The mitigation measure codes in the legend are shown in Table 2.
Sustainability 08 01283 g003
Figure 4. Reduced emission in the agriculture and livestock managements with a share of technical mitigation measures calculated using the AFOLU bottom-up model.
Sustainability 08 01283 g004
Figure 5. Sensitivity analyses of the carbon price for the mitigation scenario (CM) using different assumptions of high crop yields (CM-highYLD), a lower unplanned deforestation ratio (CM-lowDEF), larger area of peatland degradation and fires (CM-highDPA) and more reduction of unplanned deforestation (CM-highRUD). See Table 1 for the scenario codes in the legend.
Sustainability 08 01283 g005
Table 1. Model scenarios used in the study.
ScenarioReduction Target in 2020 and 2030YieldBaseline Unplanned Deforestation RatioBaseline Degraded Peatland AreaReducing Unplanned Deforestation
BaUNoLowHighMidMid
CMYesMidMidMidMid
Sensitivity analysis
CM-highYLDYesHighMidMidMid
CM-lowDEFYesMidLowMidMid
CM-highDPAYesMidMidHighMid
CM-highRUDYesMidMidMidHigh
Table 2. Mitigation measures in land use sectors used in the AFOLU bottom-up model.
Cost (USD/ha/Year)Mitigation Effect(tCO2/ha/Year)Maximum Annual Available Area(1000 ha/Year)Timespan for Mitigation Cost (Year)Timespan for Mitigation Effect (Year)Technical Potential Area (1000 ha)
Plantation: short rotationPSR98 a13.6 a123 d25 h25 h6140 d
Plantation: long rotationPLR153 a18.9 a5.3 d25 h25 h160 d
Reforestation: fast-growing speciesRFS88 a30.9 a31 d25 h25 h920 d
Reforestation: slow-growing speciesRSS137 a30.8 a93 d25 h25 h2780 d
Reducing unplanned deforestationRD150 h405 e100 h25 h25 h350 h
Reduced impact loggingRIL78 a5.1 a100 d12 a12 a3000 h
Enhanced natural regenerationENR225 b7.3 a133 d15 a15 a4000 h
Improved water management on managed peatlandWM17 j20 c47 d10 j10 j1400 i
Peatland restoration on unmanaged peatlandPR182 c20 c87 d25 h25 h2600 f
Agro-forestryAGF18 g43.5 g67 d25 h25 h2000 d
Notes: a Based on Boer [2]. Costs were based on the labor and wages needed for mitigation measures [2] using 10% of the discount rate. Mitigation effects were derived from Boer [2] using a timespan for mitigation effect; b Japan International Cooperation Agency [22]; c Assumed based on expert judgments; d Derived from technically potential area divided by the study period; e Based on emission factors for fire/deforestation [23]; f Based on the land area assumed for Indonesia’s Intended Nationally-Determined Contributions (INDC) [1]; g Based on the mitigation potential and cost of oil palm in Boer et al. [4]; h Assumed; i Area of timber and palm oil plantation in managed peatland was assumed to be an applicable area; j Based on the Technology Fact Sheet. Peatland water management technology peat re-mapping.

