Article

The Delimitation of Urban Growth Boundaries Using the CLUE-S Land-Use Change Model: Study on Xinzhuang Town, Changshu City, China

1
Department of Environmental Science and Engineering, Fudan University, Shanghai 200433, China
2
Urban Planning and Architectural Design Institute, Fudan University, Shanghai 200433, China
3
Department of Geography, Kent State University, Kent, OH 44242, USA
*
Authors to whom correspondence should be addressed.
Sustainability 2016, 8(11), 1182; https://doi.org/10.3390/su8111182
Submission received: 16 July 2016 / Revised: 20 October 2016 / Accepted: 12 November 2016 / Published: 16 November 2016
(This article belongs to the Special Issue Sustainable Ecosystems and Society in the Context of Big and New Data)

Abstract

:
Over the past decades, urban growth boundaries (UGBs) have been regarded as effective tools applied by planners and local governments to curb urban sprawl and guide urban smart growth. The UGBs help limit urban development to suitable areas and protect surrounding agricultural and ecological landscapes. At present, China’s Town and Country Planning Act officially requires the delimitation of UGBs in a city master planning outline and in central urban area planning. However, China’s practices in UGBs are usually determined by urban planners and local authorities, and lack a sound analytical basis. Consequently, Chinese UGBs are often proven to be inefficient for controlling urban expansion. In this paper, take the fast-growing Xinzhuang town of Changshu city, eastern China as an example, a new method towards establishing UGBs is proposed based on land-use change model (the Conversion of Land Use and its Effects at Small regional extent, CLUE-S). The results of our study show that the land-use change and urban growth simulation accuracy of CLUE-S model is high. The expansion of construction land and the decrease of paddy field would be the main changing trends of local land use, and a good deal of cultivated land and ecological land would be transformed into construction land in 2009–2027. There is remarkable discordance in the spatial distribution between the simulated UGBs based on the CLUE-S model and the planned UGBs based on the conventional method, where the simulated results may more closely reflect the reality of urban growth laws. Therefore, we believe that our method could be a useful planning tool for the delimitation of UGBs in Chinese cities.

1. Introduction

The growing negative impacts of urban sprawl arising from the rapid urbanization are a major challenge for sustainable urban development [1]. Emphasizing sustainable development and ecological ideas of today, while determining how to effectively curb urban sprawl and harmonize the conflicts between the urban development and ecological protection or farmland preservation are the important issues concerning the human-dominated ecosystems [2,3]. Among the various approaches to managing urban growth, urban containment policy has been extensively studied and introduced to many countries to increase urban land-use density and protect open space from being developed [4,5]. Greenbelts, urban growth boundaries (UGBs), and urban service boundaries (USBs) are three major forms of urban containment policy [6]. All of these forms aim to promote compact and contiguous development patterns, while preserving open space, agricultural land, and environmentally sensitive areas that are not currently suitable for urban development [4]. However, among the notions of these urban containment boundaries, the UGBs have been widely discussed in academia and implemented in various countries around the world [7,8,9,10], due to their popularity and easy acceptance.
In China, the conception of UGBs began to be known among the planners and scholars in the late 1990s [11,12]. The officially issued “Urban Planning Compilation Methods” by China’s former Ministry of Construction, requires that the city master planning outline and central urban area planning include research of UGBs. The definitions for “prohibited construction areas”, “restricted construction areas”, and “suitable construction areas” were officially proposed. Also, the boundaries of urban construction areas were put forward. According to China’s Town and Country Planning Act initiated in 2008, the urban construction boundaries (UCBs), defined as legal boundaries to distinguish urban land from rural areas, were expected to constrain intensive human activities in aggregated urban settlements and thus maintain the ecosystem services provided by the surrounding seminatural and natural environment. Thus, in the context of rapid urbanization and pronounced environmental deterioration over the past three decades, it is urgent to reduce artificial adverse impacts on ecosystem functioning, maintain the harmony human–nature relationship, and sustain the development of the society across local, regional, and national scales [13]. Meanwhile, UCBs are also applied by the urban planning administrative department as the basis for issuing construction site planning permits, and they have played a crucial role in constraining urban growth in China [1]. Therefore, as the most explicit legal urban containment boundaries, the planned UCBs can be approximately defined as the UGBs under China’s Town and Country Planning Act.
In the process of delimiting UGBs, various factors related to urban spatial growth need to be considered. To date, conventional methods of delineating UGBs of Chinese cities are based on local authority’s intentions and planners’ personal experiences. Most of the time, they lack an adequate scientific basis and quantitative support. Consequently, the UGBs often fail to effectively contain urban expansion. According to the study of Han et al. (2009) on the verification of the implementation of planned UGBs of Beijing using multi-temporal remote sensing images, more urban land development was found outside than inside the UGBs during the two previous planning periods (1983–1993 and 1993–2005) [13]. Tian et al. (2008) and Xu et al. (2009) also found that substantial urban development recently occurred beyond the UGBs of Guangzhou and Shanghai [14,15]. The reason for the inconsistencies between the planned UGBs and the practical urban developments may be inadequate awareness of the rules and trends of urban growth. In addition, the conventional approach to establishing UGBs is not appropriate when taking into consideration the comprehensive forces that quantitatively influence urban growth process. However, comprehensive studies on the practice of UGBs in urban planning are still very limited. Therefore, new methods that can account for the key driving forces and accurately predict the trend of urban growth are necessary for improving the delimitation of UGBs.
Identifying the primary causes, processes, and trends of land-use change are crucial for supporting urban planning and delimiting urban growth boundaries [16,17]. Land-use change models are useful tools for analyzing driving forces and processes, understanding the causes and consequences, and predicting the possible future outcomes of land-use change [18,19]. Analysis of scenarios with land-use modeling can provide support for land-use planning [20,21,22] and help inform policymakers of possible future patterns under different policy restraint conditions [23]. As a typical spatially explicit and empirically based statistical model, the CLUE-S (the Conversion of Land Use and its Effects at Small regional extent) model treats the competition between different types of land uses based on systems theory, simulating different land uses simultaneously. It has been recognized as an excellent tool for to interpret land-use change processes [24,25,26], and has been successfully applied to modeling of land-use change in many different regions. It can better account for the processes that determine changes in the spatial pattern of land use and explore possible future changes in urban growth at various spatial scales [27]. It can also specify the conditions of scenarios for future land use in detail [28,29]. Compared to the relatively subjective land-use models based on decision-making behavior of locators [30,31], the CLUE-S model is based on land-use change processes and its simulation result is more objective and persuasive.
The CLUE-S model simulation results, as an alternative future urban form or a possible land-use scenario, can be applied as the basis for Chinese UGBs, which were schematically made with less scientific support and designed by the need of economic and population growth, and the planners’ experiences and topographical and geologic characteristics. The CLUE-S model can be conveniently applied to predict future land-use and urban growth patterns. In addition, the impact of the policies related to the control and guidance of urban growth can be simulated as different scenarios in the CLUE-S model. The model can be utilized as a planning support system to delimit UGBs. To our knowledge, there are extensive publications on land-use change simulation using the CLUE-S model. However, to date, case studies using the CLUE-S model simulation to establish UGBs have been relatively scarce.
This paper aims to bridge the gap between future land use, urban growth pattern, and UGBs by using the Xinzhuang town of Changshu city, eastern China, as an example. The objectives of this study are (1) to simulate future land-use changes and urban growth under different scenarios based on the CLUE-S model; and (2) to evaluate the feasibility and applicability of a land-use change model to support urban planning and delimit the UGBs. The paper is organized as follows. Firstly, we provide a detailed account and the implementation issues of the methodology. Secondly, the analysis of the simulation accuracy of CLUE-S model and future spatiotemporal changes of land use and urban growth under three scenarios are described. Thirdly, the simulated UGBs based on CLUE-S model are compared with the planned UGBs to evaluate the feasibility and applicability of land-use change model for supporting spatial planning. Finally, we discuss the deficiency of this research and present the conclusion. We intend our study to be helpful for urban planners and decision-makers for better understanding the complexities of land-use change so that they can make scientifically sound decisions for future urban growth boundaries.

2. Study Area and Methods
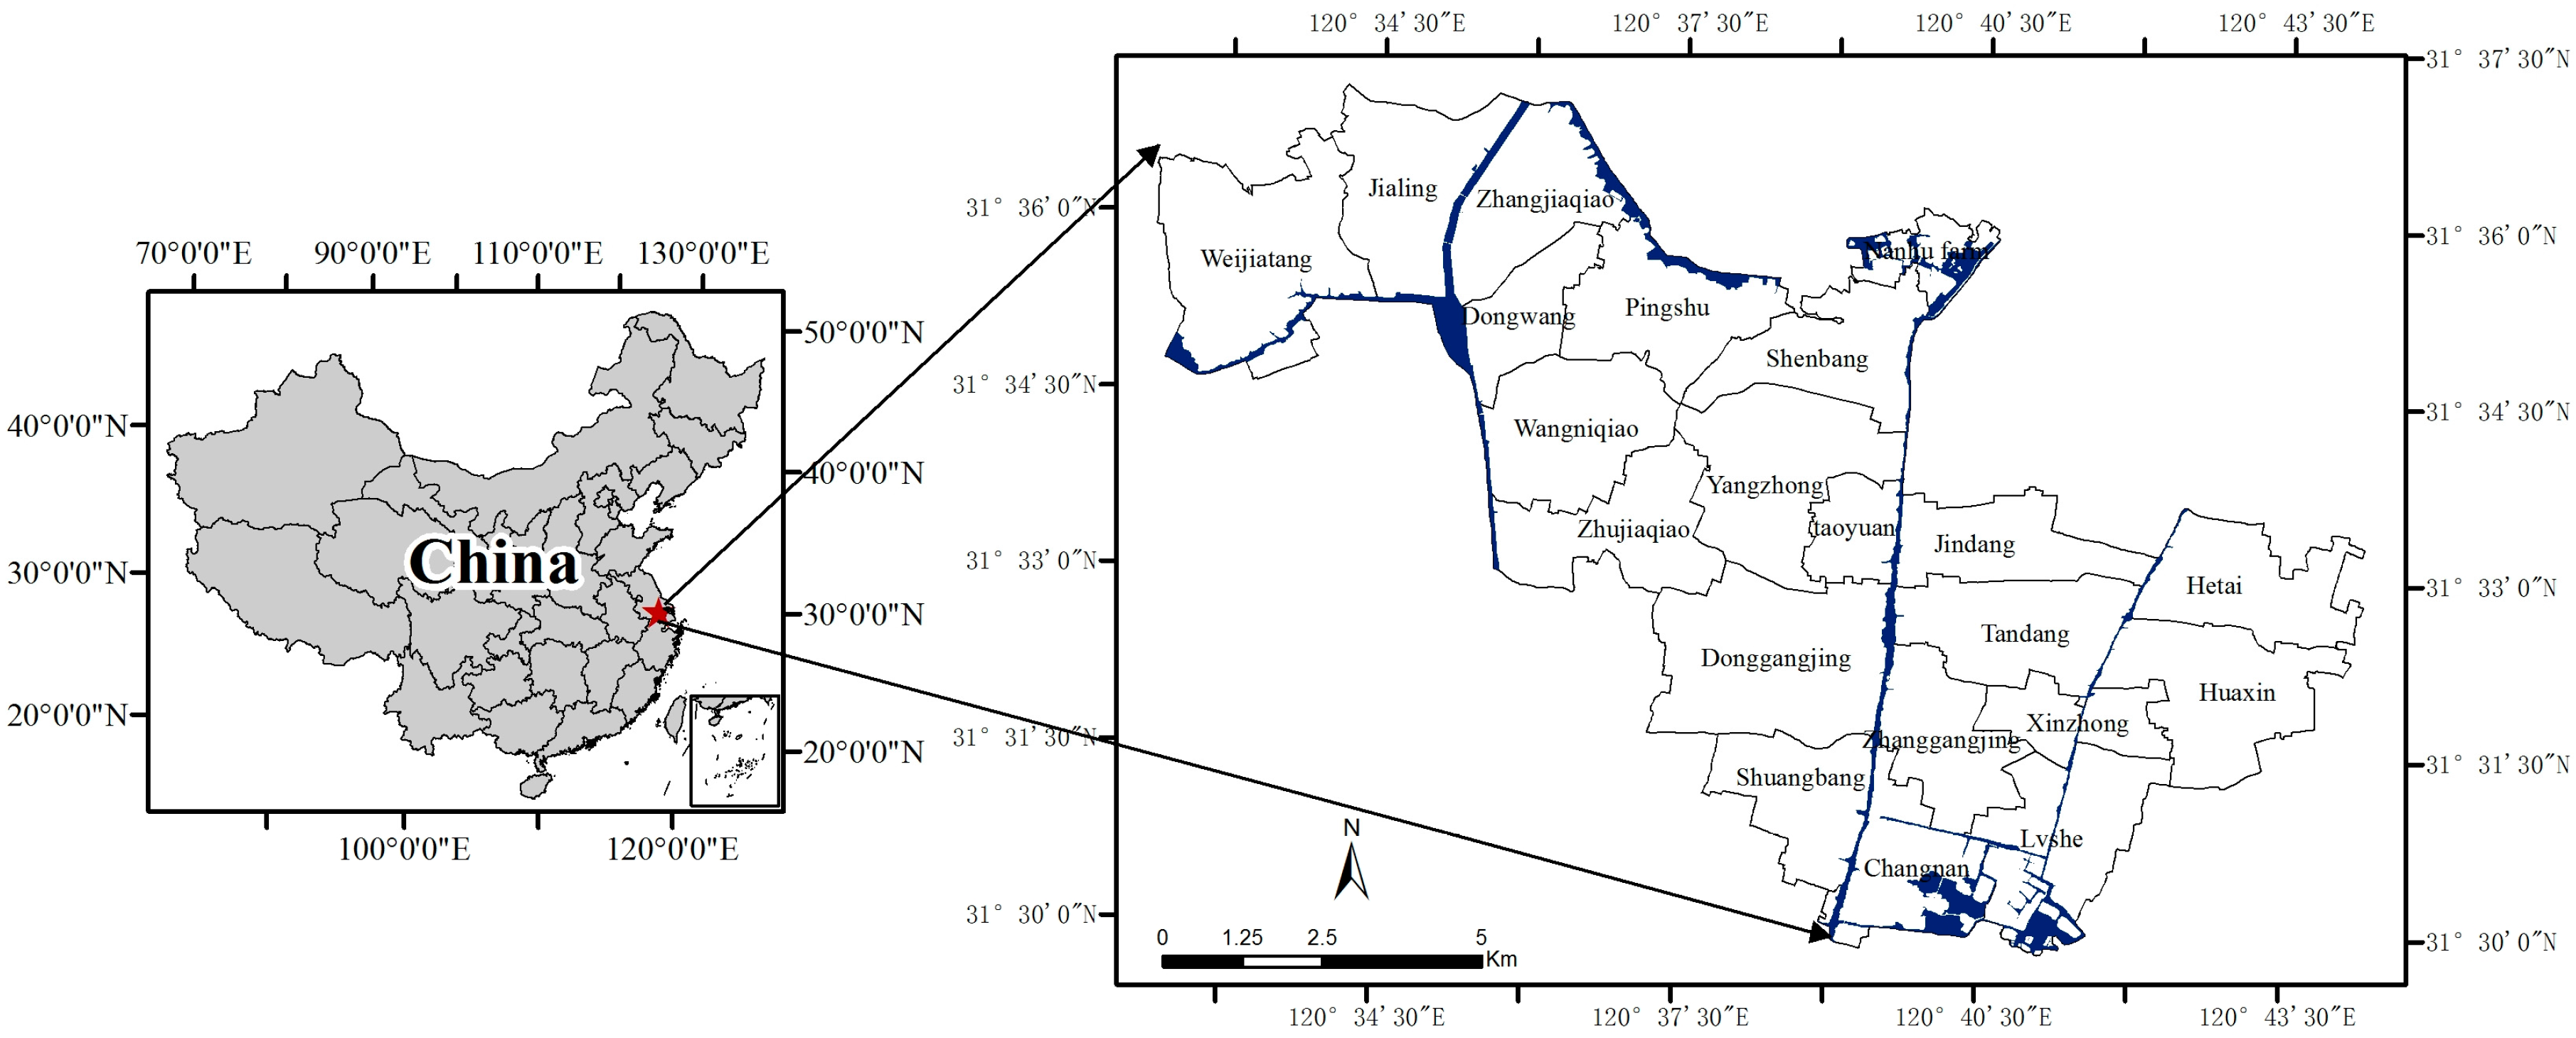
2.1. Study Area

Xinzhuang town, located between 120°32′–120°44′E and 31°29′–31°37′N, is a rapidly urbanized and industrialized area in Changshu city, eastern China (Figure 1). It is one of the two significant development central towns in the latest master plan of Suzhou city, due to its prominent and convenient location for water and land transportation. It is to the east of Shajiabang resort district, to the west of Wuxi city, approximately 50 km from Suzhou city and Wuxi city, and 190 km from Nanjing city and Hangzhou city. The study area is about 104.26 km2, including 1 jiedao office (county-level governmental branch), 20 villages, 3 neighborhood committees, and the South Lake farm. In recent years, the economy of Xinzhuang town has been growing rapidly. In 2011, the gross domestic product (GDP) of the study area was 9.05 billion RMB Yuan (equivalent to 1.40 billion U.S. dollars, with an exchange rate of 6.46 in 2011). The number of workers employed by the enterprises was about 60,000, approximates 44.25% of the local permanent population. Urban and rural industrial and residential land has continuously expanded with economic and industrial growth in Xinzhuang, especially after 2000. The sprawl of construction land has occupied plenty of farmland and caused a substantial change to the area’s landscape and the environment in the past decades [32].

2.2. Data Collection and Processing

2.2.1. Data Collection

In this study, many data sets—including a 1991 aerial photograph at 1:10,000, a 2001 IKONOS image, and a 2009 QuickBird image—were used to generate land-use maps. The 1:10,000 topographic maps and 1:10,000 digital elevation model (DEM) of the study area were acquired from Geographic Information Center of Jiangsu province. A total of 405 evenly distributed field-survey points for land-use information were sampled via field surveys in 2009 by using the Global Positioning System (GPS) with ±1 m error for ground-truth.
The other data used in this study includes: (1) statistical yearbooks of 1991, 2001, and 2009 of Changshu city obtained from Changshu Statistical Bureau; (2) statistical yearbooks from 2007 to 2010 of Xinzhuang town obtained from Xinzhuang Statistical Bureau; and (3) the urban planning reports and land-use maps of Xinzhuang town obtained from Xinzhuang Planning Office of Land and Resources.

2.2.2. Data Processing

In this study, data processing consisted of follow steps. Firstly, the 2009 QuickBird image was geometrically corrected and georeferenced to the transverse coordinate system, using the 1:10,000 topographic map and boundary layer file (Shapefile) with ESRI ArcGIS 10.3 (Environmental Systems Research Institute, Inc., Redlands, CA, USA). Secondly, the image-to-image method was applied for the georeferenced registration of images from 1991 and 2001 with the total root mean squared (RMS) error of less than 0.5 pixels. Thirdly, an image enhancement of intensifying visual distinction among features was performed to increase the amount of information. In succession, image interpretation symbols of different image elements were added accompanying by field investigations, which could be consulted in the process of artificial visual operations. Subsequently, visual interpretation was manually carried out for images from 1991, 2001, and 2009, and land-use maps were generated with the help of ancillary data, including the topographic map and ground survey information. Land-use types were divided into nine classes: paddy field, dry land, forest, water area, urban and rural construction land, fishpond, grassland, vegetable field, and orchard land (Figure 2). The overall accuracy of the image classification was assessed with a randomly stratified method by overlapping the field survey points with the land-use maps. The overall accuracy for three land-use maps were determined to be 92.1% for 1991, 93.5% for 2001, and 95.2% for 2009, respectively. Besides, due to the restriction of area percentage of each land-use type in CLUE-S model, these nine land-use types were reclassified into six categories accordingly, namely paddy field, dry land (including vegetable field), forest (including grassland and orchard land), water area, fishpond, and urban and rural construction land. Furthermore, multiple resolution scales ranging from 5 m to 20 m were attempted to test the performance of CLUE-S model. However, due to the bottleneck of the computing system, the maximum spatial resolution in the CLUE-S model was set as 20 m in this study [32].

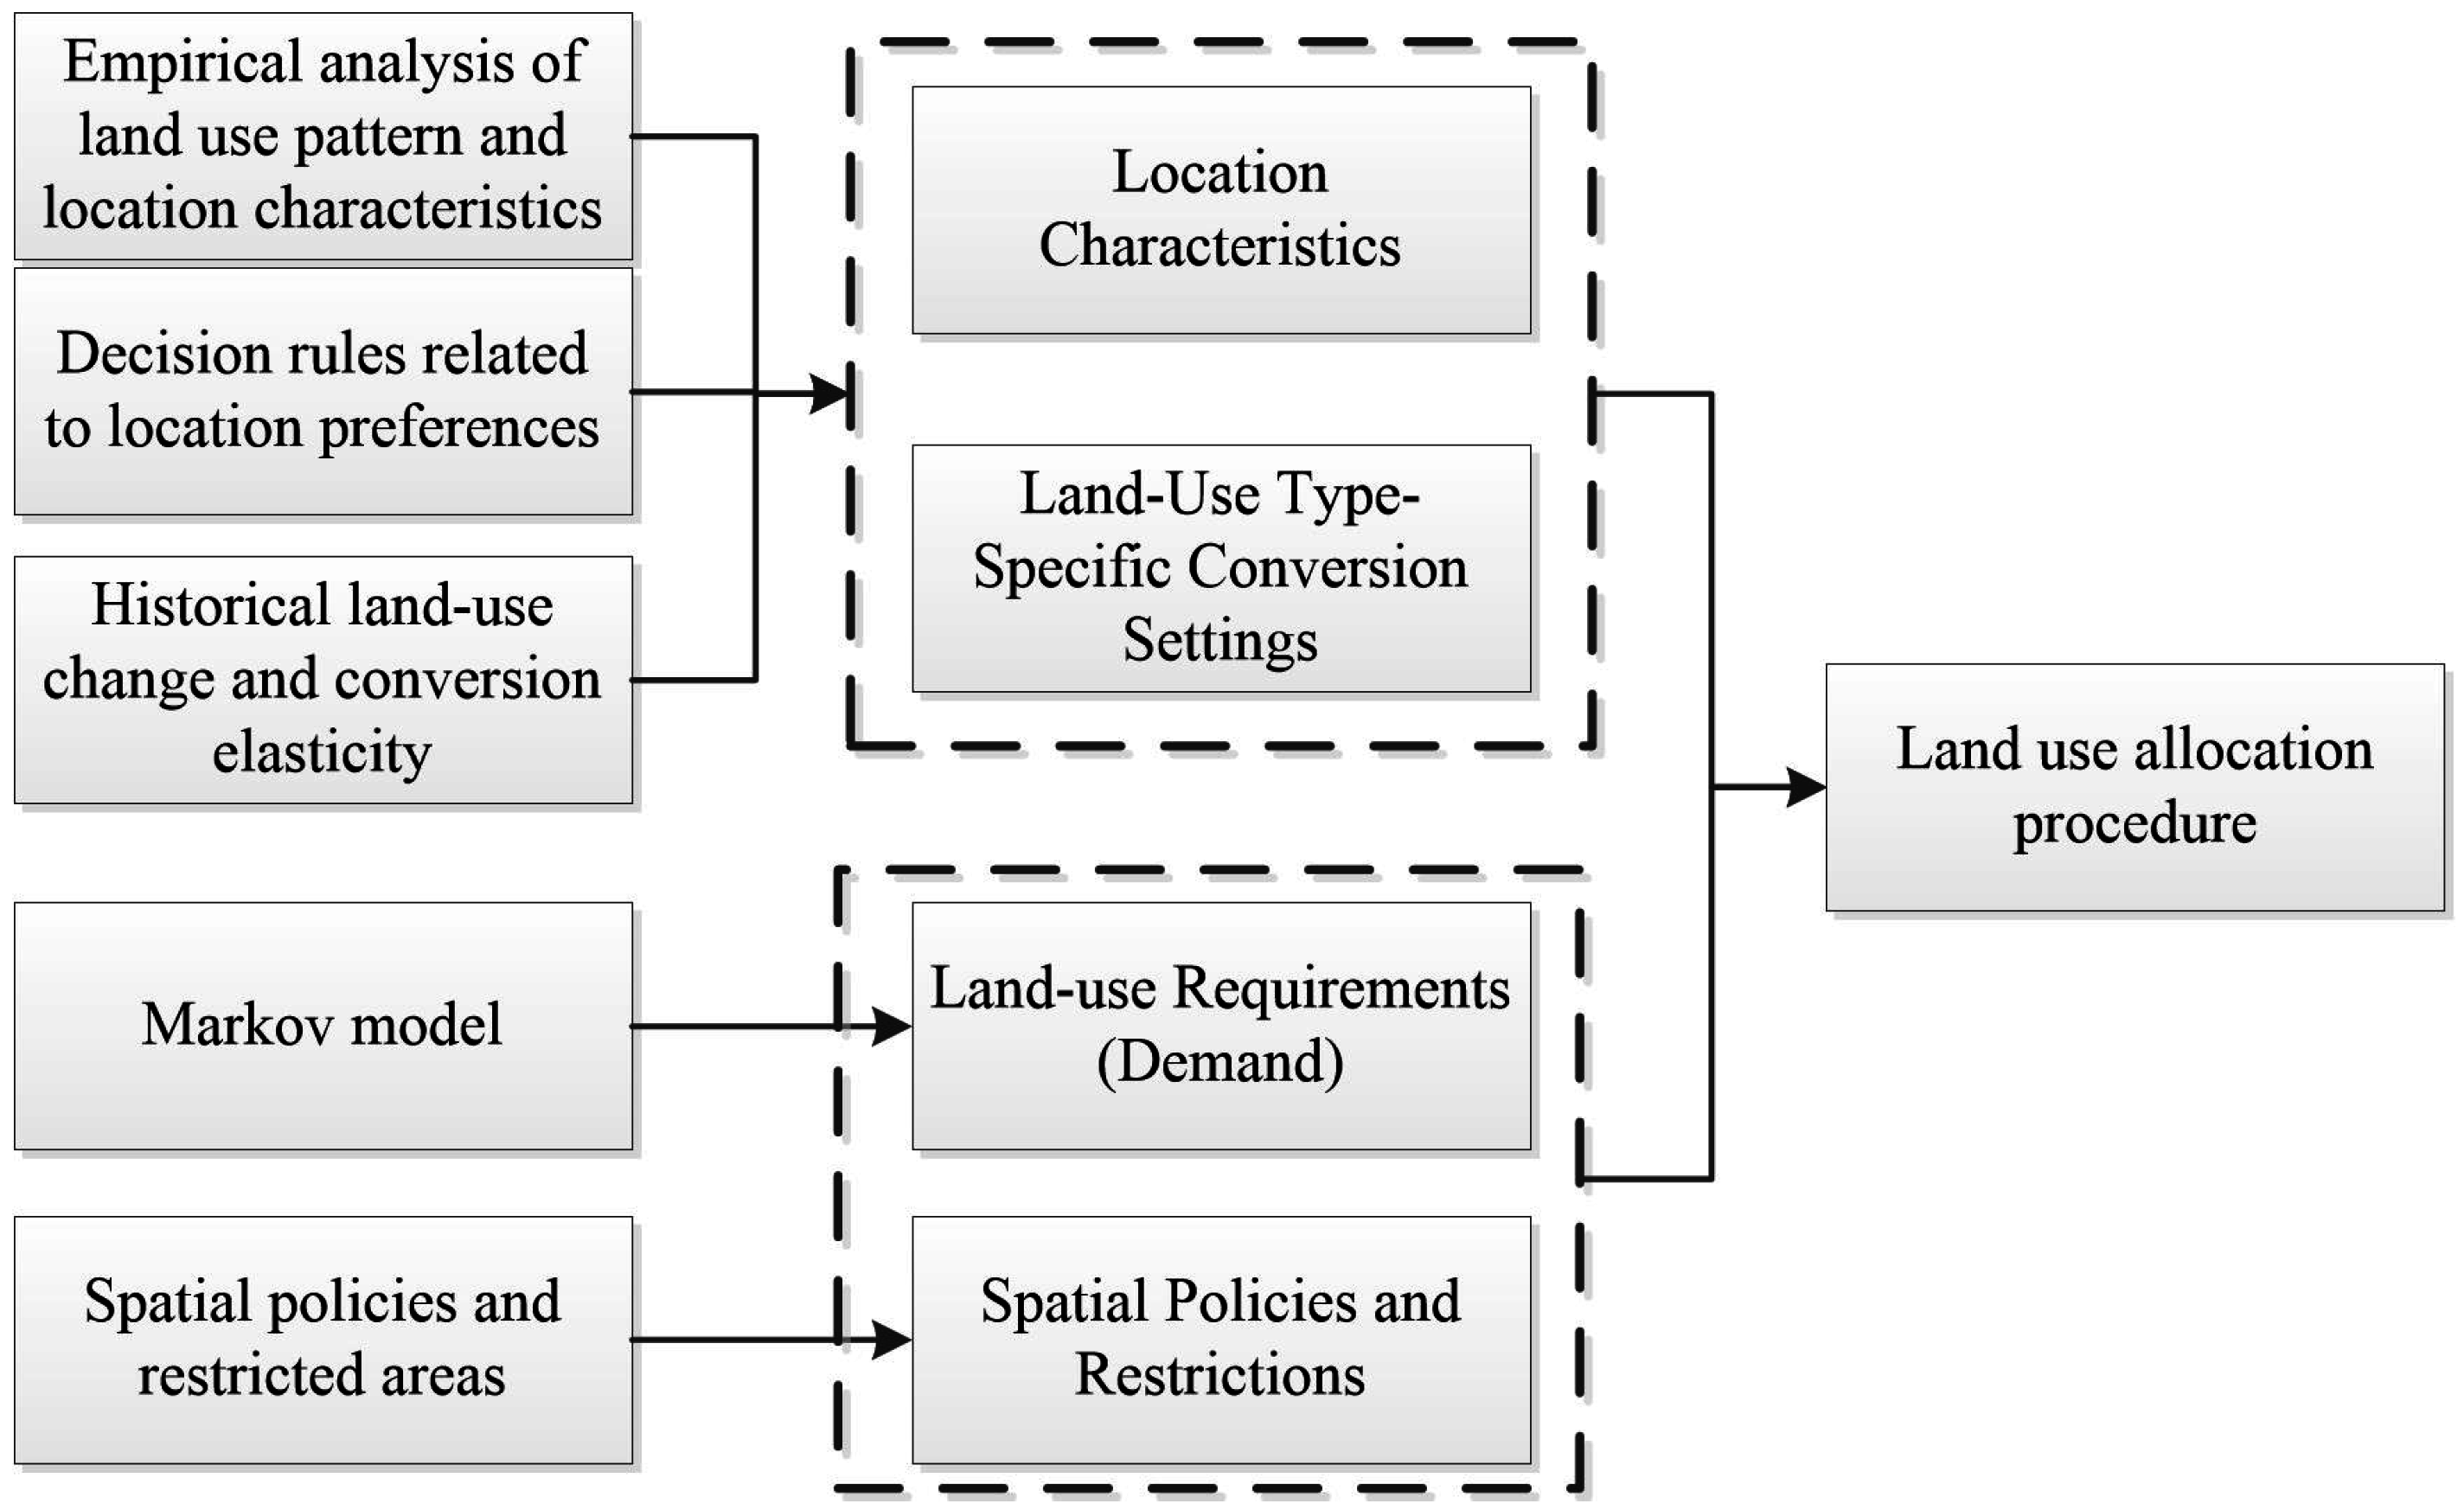
2.3. The Settings of the CLUE-S Model

In this study, the CLUE-S model, which was specifically developed for the spatially explicit simulation of land-use change [33,34], was used to simulate future land-use change and urban growth. This model is based on an empirical analysis of location suitability combined with the dynamic simulation of competition and interactions between the spatiotemporal dynamics of land-use systems [28]. Figure 3 shows an overview of the information needed to run the CLUE-S model [29]. As can be seen, the CLUE-S model needs to consider the following four categories of information: land-use requirements, location characteristics, spatial policies and restrictions, and land-use type specific conversion settings. All of them together create a set of conditions and possibilities, with which the model calculates the best solution in an iterative procedure.

2.3.1. Spatial Policies and Restrictions

Spatial policies, restrictions, and land tenure can influence the pattern of land-use change. In this study, three scenarios were designed to represent different implementations of the spatial policies and restrictions. (1) The Current Trend (CT) scenario or named baseline scenario was formulated based on historical land-use change from 1991 to 2009; (2) The Urban Planning (UP) scenario was designed based on the urban planning and land-use planning schemes of Xinzhuang town, which emphasized compact urban development and basic farmland preservation through restraining developments around town centers and along major roads; (3) The Ecological Protection (EP) scenario, which highlights protection and preservation of ecological land, was designed based on related ecological and environmental protection policies in the study area over the next 20 years. This scenario aims at fixing the increasingly worsening ecological problems through two assumed key aspects. The first one is that the main construction land (including intensive residential land and industrial park) and river and ecological land (including ecological preservation area of Kunchenghu, and the Nanhu River, Jialing River, Wangyu River, and Xinan River) would not be converted to the other land-use types. The second one is to intensively implement preservation and restoration of ecological land (e.g., wetland and vegetation) through designating the relatively large-scale ecological land as forbidden development areas.

2.3.2. Land-Use Requirements (Demand)

The land-use requirements (demand) for the different land-use types under the Current Trend (CT) scenario was calculated using the Markov model and linear interpolation method. The linear interpolation employs a time-series analysis based on the extrapolation of trends in historical land-use change during 1991–2009. Besides, the land-use data in this study area for the years from 1991 to 2009 were obtained from statistical yearbooks of Changshu city. The Markov model represents a mathematical technique for predicting future changes of a system. It has been widely applied to temporal land-use change predictions in a great number of studies [35,36,37,38,39]. As the land-use change process of the study area conforms to the aforementioned conditions and characteristics, it is appropriate to use the Markov chain prediction model for temporal land-use change in this research [26]. Based on the transition probability matrix and Bayes’ theorem of conditional probabilities, the Markov model is defined as follows:
X ( n ) = X ( n 1 ) P i j
where X(n) and X(n − 1) are the system statuses at the time-points n and n − 1, respectively; Pij is a transition probability matrix satisfying the following conditions, where i, j are the land-use types at the time-points n and n − 1, respectively. Pij should meet the following requirements:
  • j = 1 n P i j = 1 (i, j = 0, 1, 2, …, n) (the sum of the elements in each row equals one);
  • 0 ≤ Pij ≤ 1 (i, j = 0, 1, 2, …, n) (all matrix members are non-negative and range between 0 and 1).
The areas demand of different land-use types in the UP scenario were adjusted from the results of the CT scenario, based on the general land-use planning in Xinzhuang Town (2006–2020). The land-use area demand in the EP scenario was adjusted based on the results from the UP scenario, based on the principles of ecological protection.

2.3.3. Location Characteristics

The demand for land by the different land-use types determines the overall competitive capacity of the different land-use types, but the location suitability is a major determinant of the competitive capacity of the different land-use types at a specific location. The location suitability is a weighted average of the suitability based on empirical analysis capturing the historic and current location preferences in response to location characteristics, and suitability based on scenario specific decision rules [27]. Generally, land-use conversions are expected to take place at locations which have the highest “preference” for the specific type of land-use at a given moment. However, the preference cannot be observed or measured directly, and has to therefore be calculated as a probability. In this study, the probability of a certain grid cell was calculated by logistic regression as follows [40]:
log ( P i 1 P i ) = β 0 + β 1 X 1 , i + β 2 X 2 , i + + β n X n , i
where Pi is the probability of a grid cell for the occurrence of the considered land-use type i, the coefficients β are estimated through logistic regression using the actual land-use pattern as a dependent variable, n is the number of driving factors, and the parameters X refer to the driving factors. The value of relative operating characteristics (ROC) proposed by Pontius and Schneider (2001) [41] was used to evaluate the fit of the regression model. A completely random model gives ROC a value of 0.5, while perfect fit results in a ROC value of 1.0. If the value of ROC is below 0.7, the accuracy of the model is low; the accuracy will be preferable if the ROC value is above 0.7 [42].
For each of the land-use types, a logistic regression was run for 1991, 2001, and 2009, respectively. Eleven driving factors of land-use change taken into account as potential determinants were selected based on literature and fieldwork in the study area, including distance to major road, distance to minor road, distance to nearest river, distance to village government, distance to nearest rural settlement, per capita GDP, per capita gross industrial product, per capita gross agricultural product, grain output per area, population density, and per capita income. These were selected to evaluate the suitability of a certain grid cell to be devoted to a land-use type. The logistic regression models, based on the GIS dataset, were constructed to determine the relations between land-use changes and a set of potential driving factors. The spatial distribution of all land-use types could be well explained by the selected driving variables as indicated by the high ROC test statistics (>0.7). The derived regression models were used to calculate suitability maps for different land-use types.

2.3.4. Land-Use Type-Specific Conversion Settings

Land-use type-specific conversion settings determine the temporal dynamics of the simulations. There are two sets of parameters needed to characterize the individual land-use type in the CLUE-S model: land-use conversion matrix and elasticity. The land-use conversions restricted by land-use policies, restrictions, and land tenure could be reflected in a land-use conversion matrix. The rows of the matrix indicate the land-use type at time step t and the columns indicate the land-use type at time step t + 1. Moreover, land-use type-specific conversion settings were defined and implemented by the relative elasticity for change (ELAS) in the model [28]. The relative elasticity ranges between 0 (easy conversion) and 1 (irreversible conversion). The higher the defined elasticity, the more difficult it is to convert this land-use type. In the study areas, the change in land use showed frequent conversion between land-use types during 1991–2009 [32]. Based on the reference data during 1991–2009 and expert knowledge, the values of conversion elasticity for different land-use types were tuned so that they are suitable for the calibration of the model. According to the defined scenarios (see Section 2.3.2), specific conversion elasticity values of land-use types were defined and implemented in the model for 2009–2027 (Table 1).

2.4. Land-Use Change and Urban Growth Simulation

When all the inputs are provided, the CLUE-S model will calculate the most likely land-use changes given the abovementioned restrictions and suitability (Section 2.3), with discrete time steps, under the three scenarios. The simulation process is summarized in the following steps.
Firstly, the total probability (TPROPi,u) of each grid cell i is calculated for each of the land-use types u according to Equation (3) [43,44]:
T P R O P i , u = P i , u + E L A S u + I T E R u
where Pi,u calculated in Equation (2) is the suitability of location i for land-use type u, ELASu is the conversion elasticity for land-use type u, and ITERu is an iteration variable that is specific to the land-use type u and indicates the relative competitive strength of the land-use type.
Secondly, a preliminary allocation is made for all land-use types with an equal value of the iteration variable (ITERu) by allocating the land-use type with the highest total probability for the considered grid cell. According to the conversion matrix, conversions that are not allowed are not allocated. A certain number of grid cells will change land use during this allocation process.
Thirdly, the total allocated area of each land use will be compared with the requirements for that land-use type. When the allocated area for a specific land-use type is smaller than the demanded area, the value of the iteration variable is increased. Conversely, the value will be decreased, for too much has been allocated. The process followed balances with bottom-up allocation based on location suitability and with top-down allocation based on regional demand. Steps above were repeated until the allocated area for land-use types equaled the demanded area.

2.5. Simulation Accuracy Assessment of CLUE-S Model

According to the configuration above of the CLUE-S model, the land-use pattern in 2009 was simulated based on that in 1991 and 2001 with the CLUE-S model to evaluate its simulation accuracy and validate its applicability in the study area. Therefore, two forecasting periods spanning 1991–2009 and 2001–2009 were set. The accuracy of a simulation bases the foundation of charactering the past land-use trends and determining the credibility of forecasting outputs. In this study, discriminant analysis was performed to evaluate the overall simulation accuracy and the accuracy of predicted change for each land-use type. The pixel-based comparison for simulated land-use maps for 2009 (Figure 4) and the actual land-use map for 2009 was performed. To do so, 50 sampling windows with 500 m × 500 m were randomly selected. For each sampling window, the percentage of each land-use type was calculated. Subsequently, the land-use types were recoded as the group variable and their percentages were used as the predictors. Discriminant analysis using the MASS library was performed in the free R statistical software (version x64 3.3.1) [45].

2.6. The Delimitation of UGBs

The simulation results from the CLUE-S model was used to delimit UGBs, based on the following procedure in ESRI ArcGIS 10.3. Firstly, the region group procedure in ArcGIS 10.3 was applied to extract all contiguous urban construction land cells from a land-use simulation map to create urban patches. Then, the urban patches in the raster format were converted into a vector format consisting of many polygons. Polygons with low compactness and a small area were eliminated, as they are not feasible for urban developments. The remaining urban construction land polygons were then be regarded as UGBs for the study area. Notably, the UGBs in most cities of China may comprise numerous polygons, which is quite different from UGBs in the USA [1].

3. Results

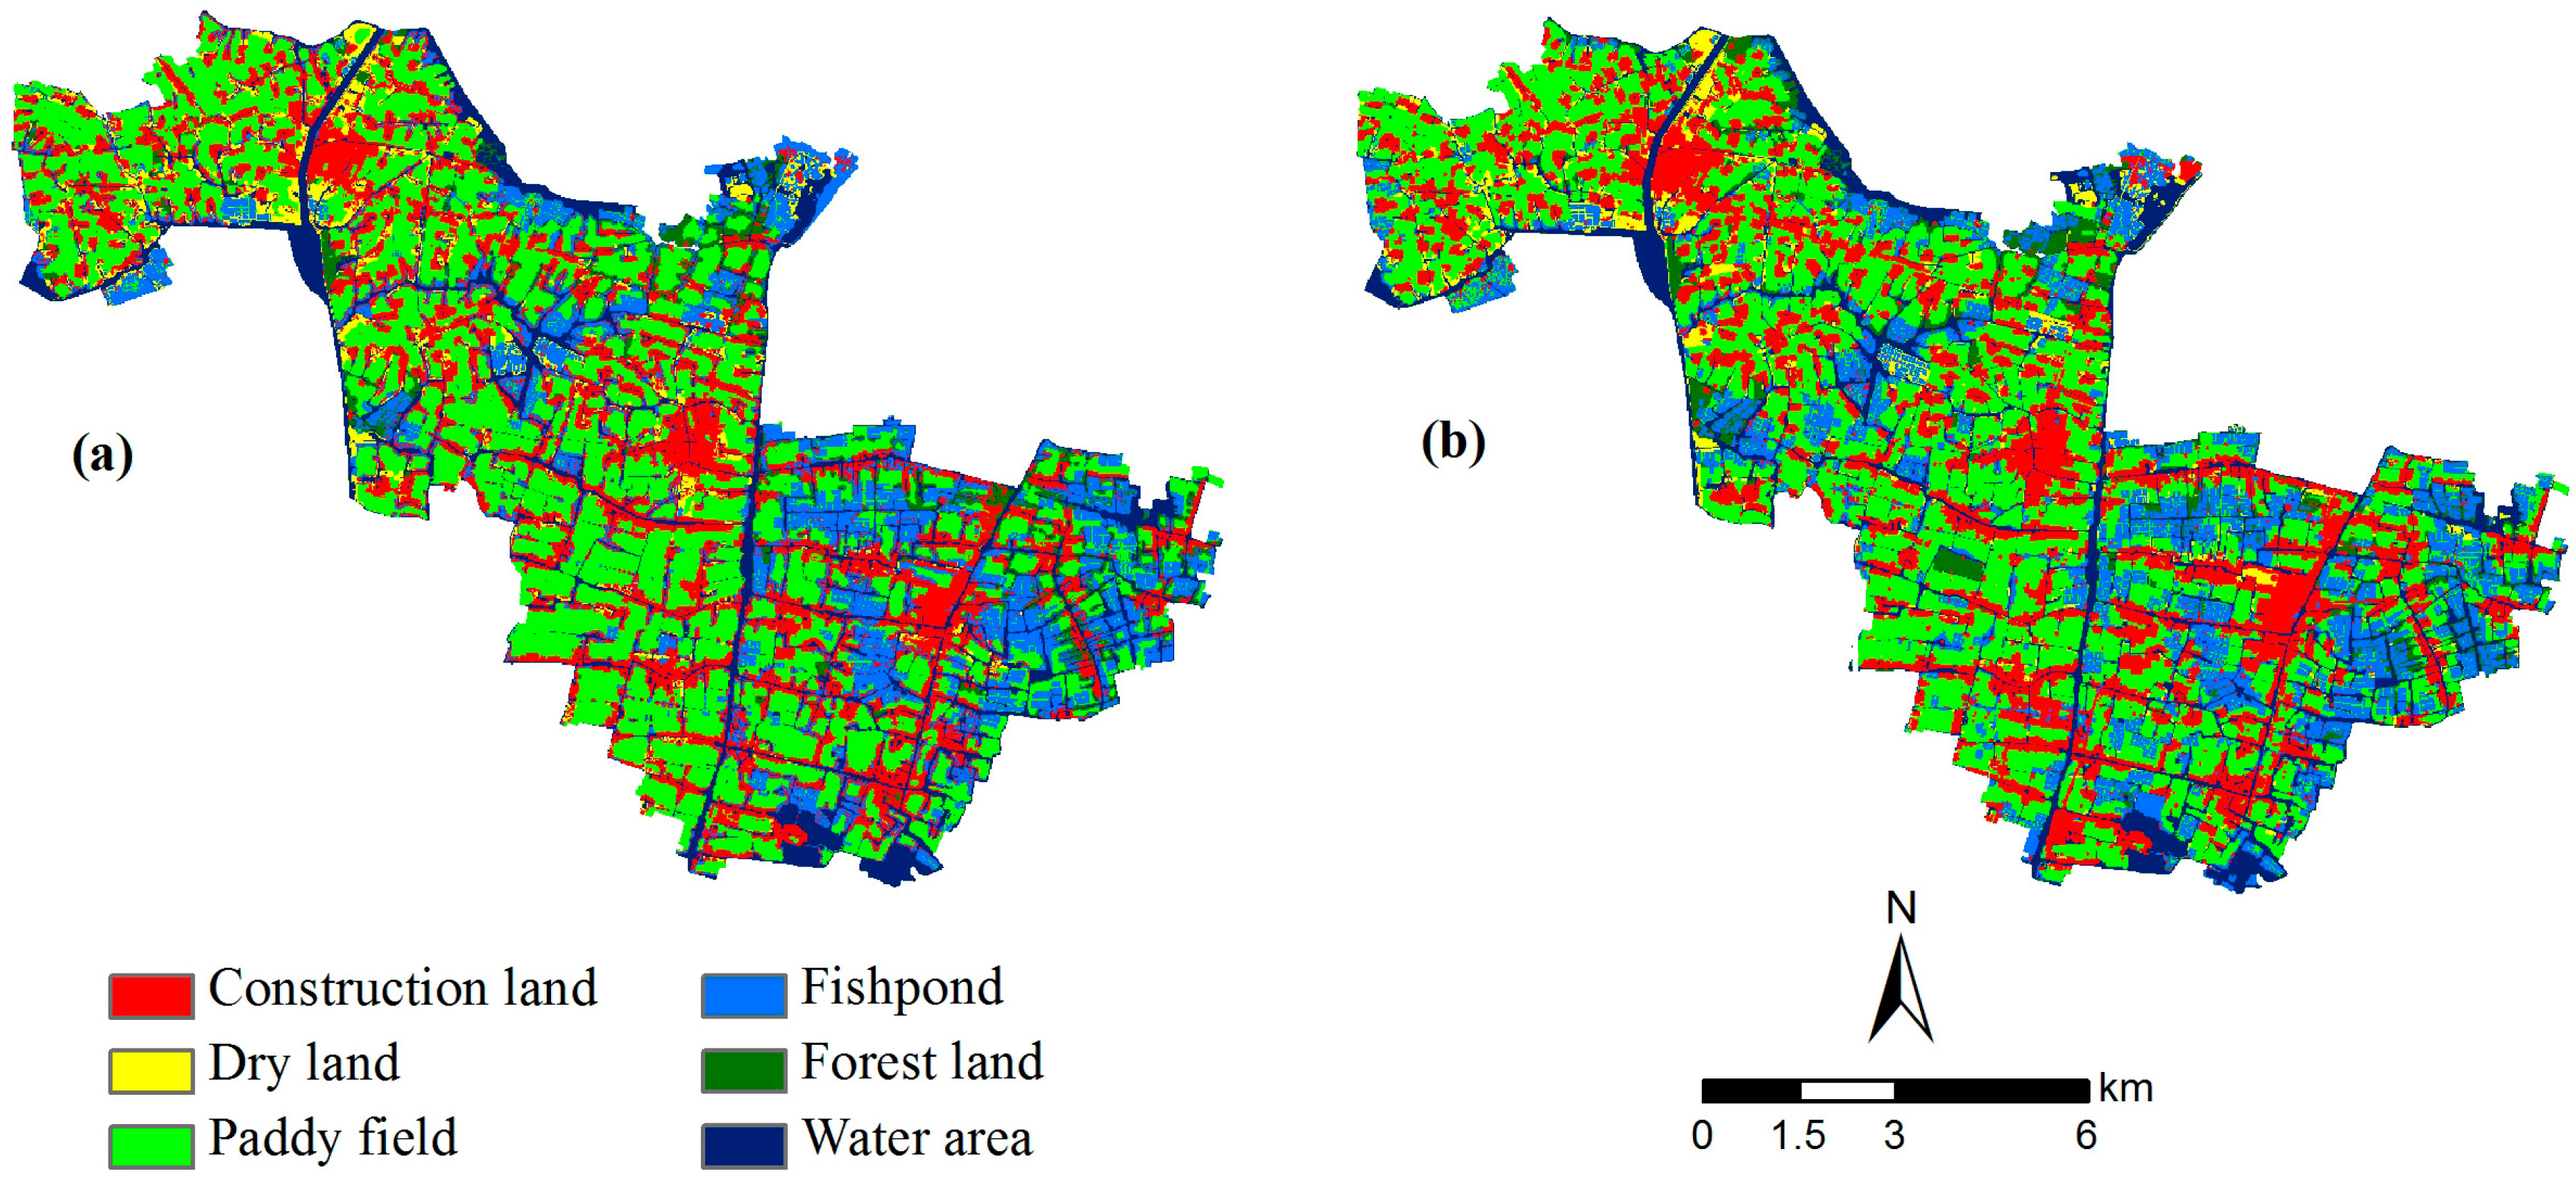
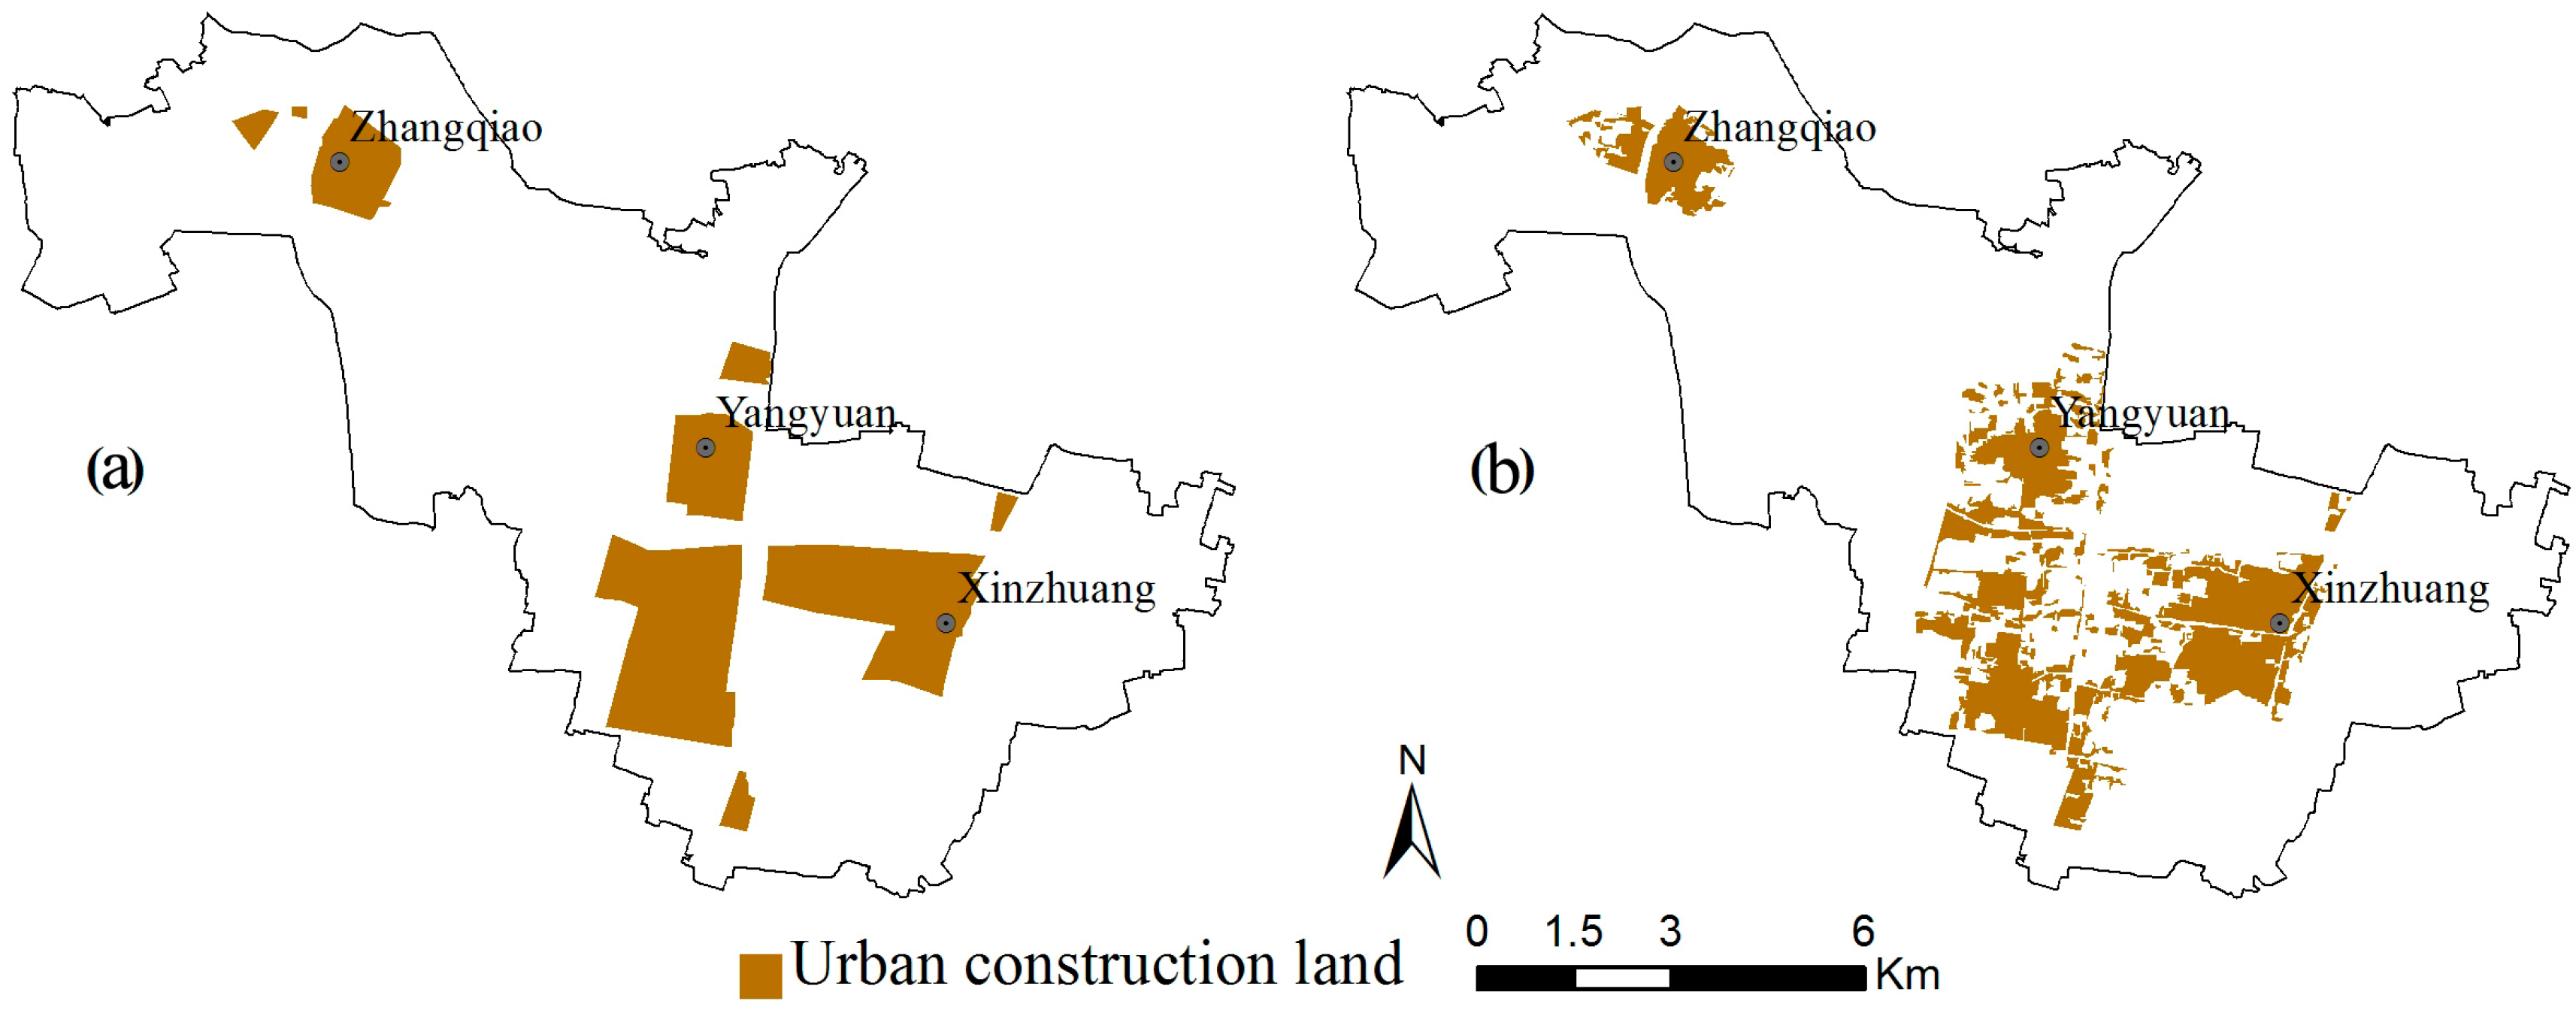
3.1. Simulation Accuracy Assessment

Table 2 shows that for all land-use types, the ROC statistics of logistic regression were greater than 0.7, which suggests the strong explanatory power of the selected driving factors employed to explain the land-use spatial patterns. In particular, the spatial goodness-of-fit of construction land and water area were much higher than the other land-use types, with the ROC statistics greater than 0.91.
The linear discriminant functions with probability of correct classification of the given land-use types range between 77.3% and 83.1%, indicating that the CLUE-S model gave excellent simulation accuracy for land-use change prediction on this time scale (18 years). With the decrease of the simulation time, the prediction was more accurate, implying the CLUE-S model increasingly captured the trends in land-use changes. Then, the CLUE-S model was applied to predict land-use change and urban growth for 2009–2027, with one-year steps in the study area.

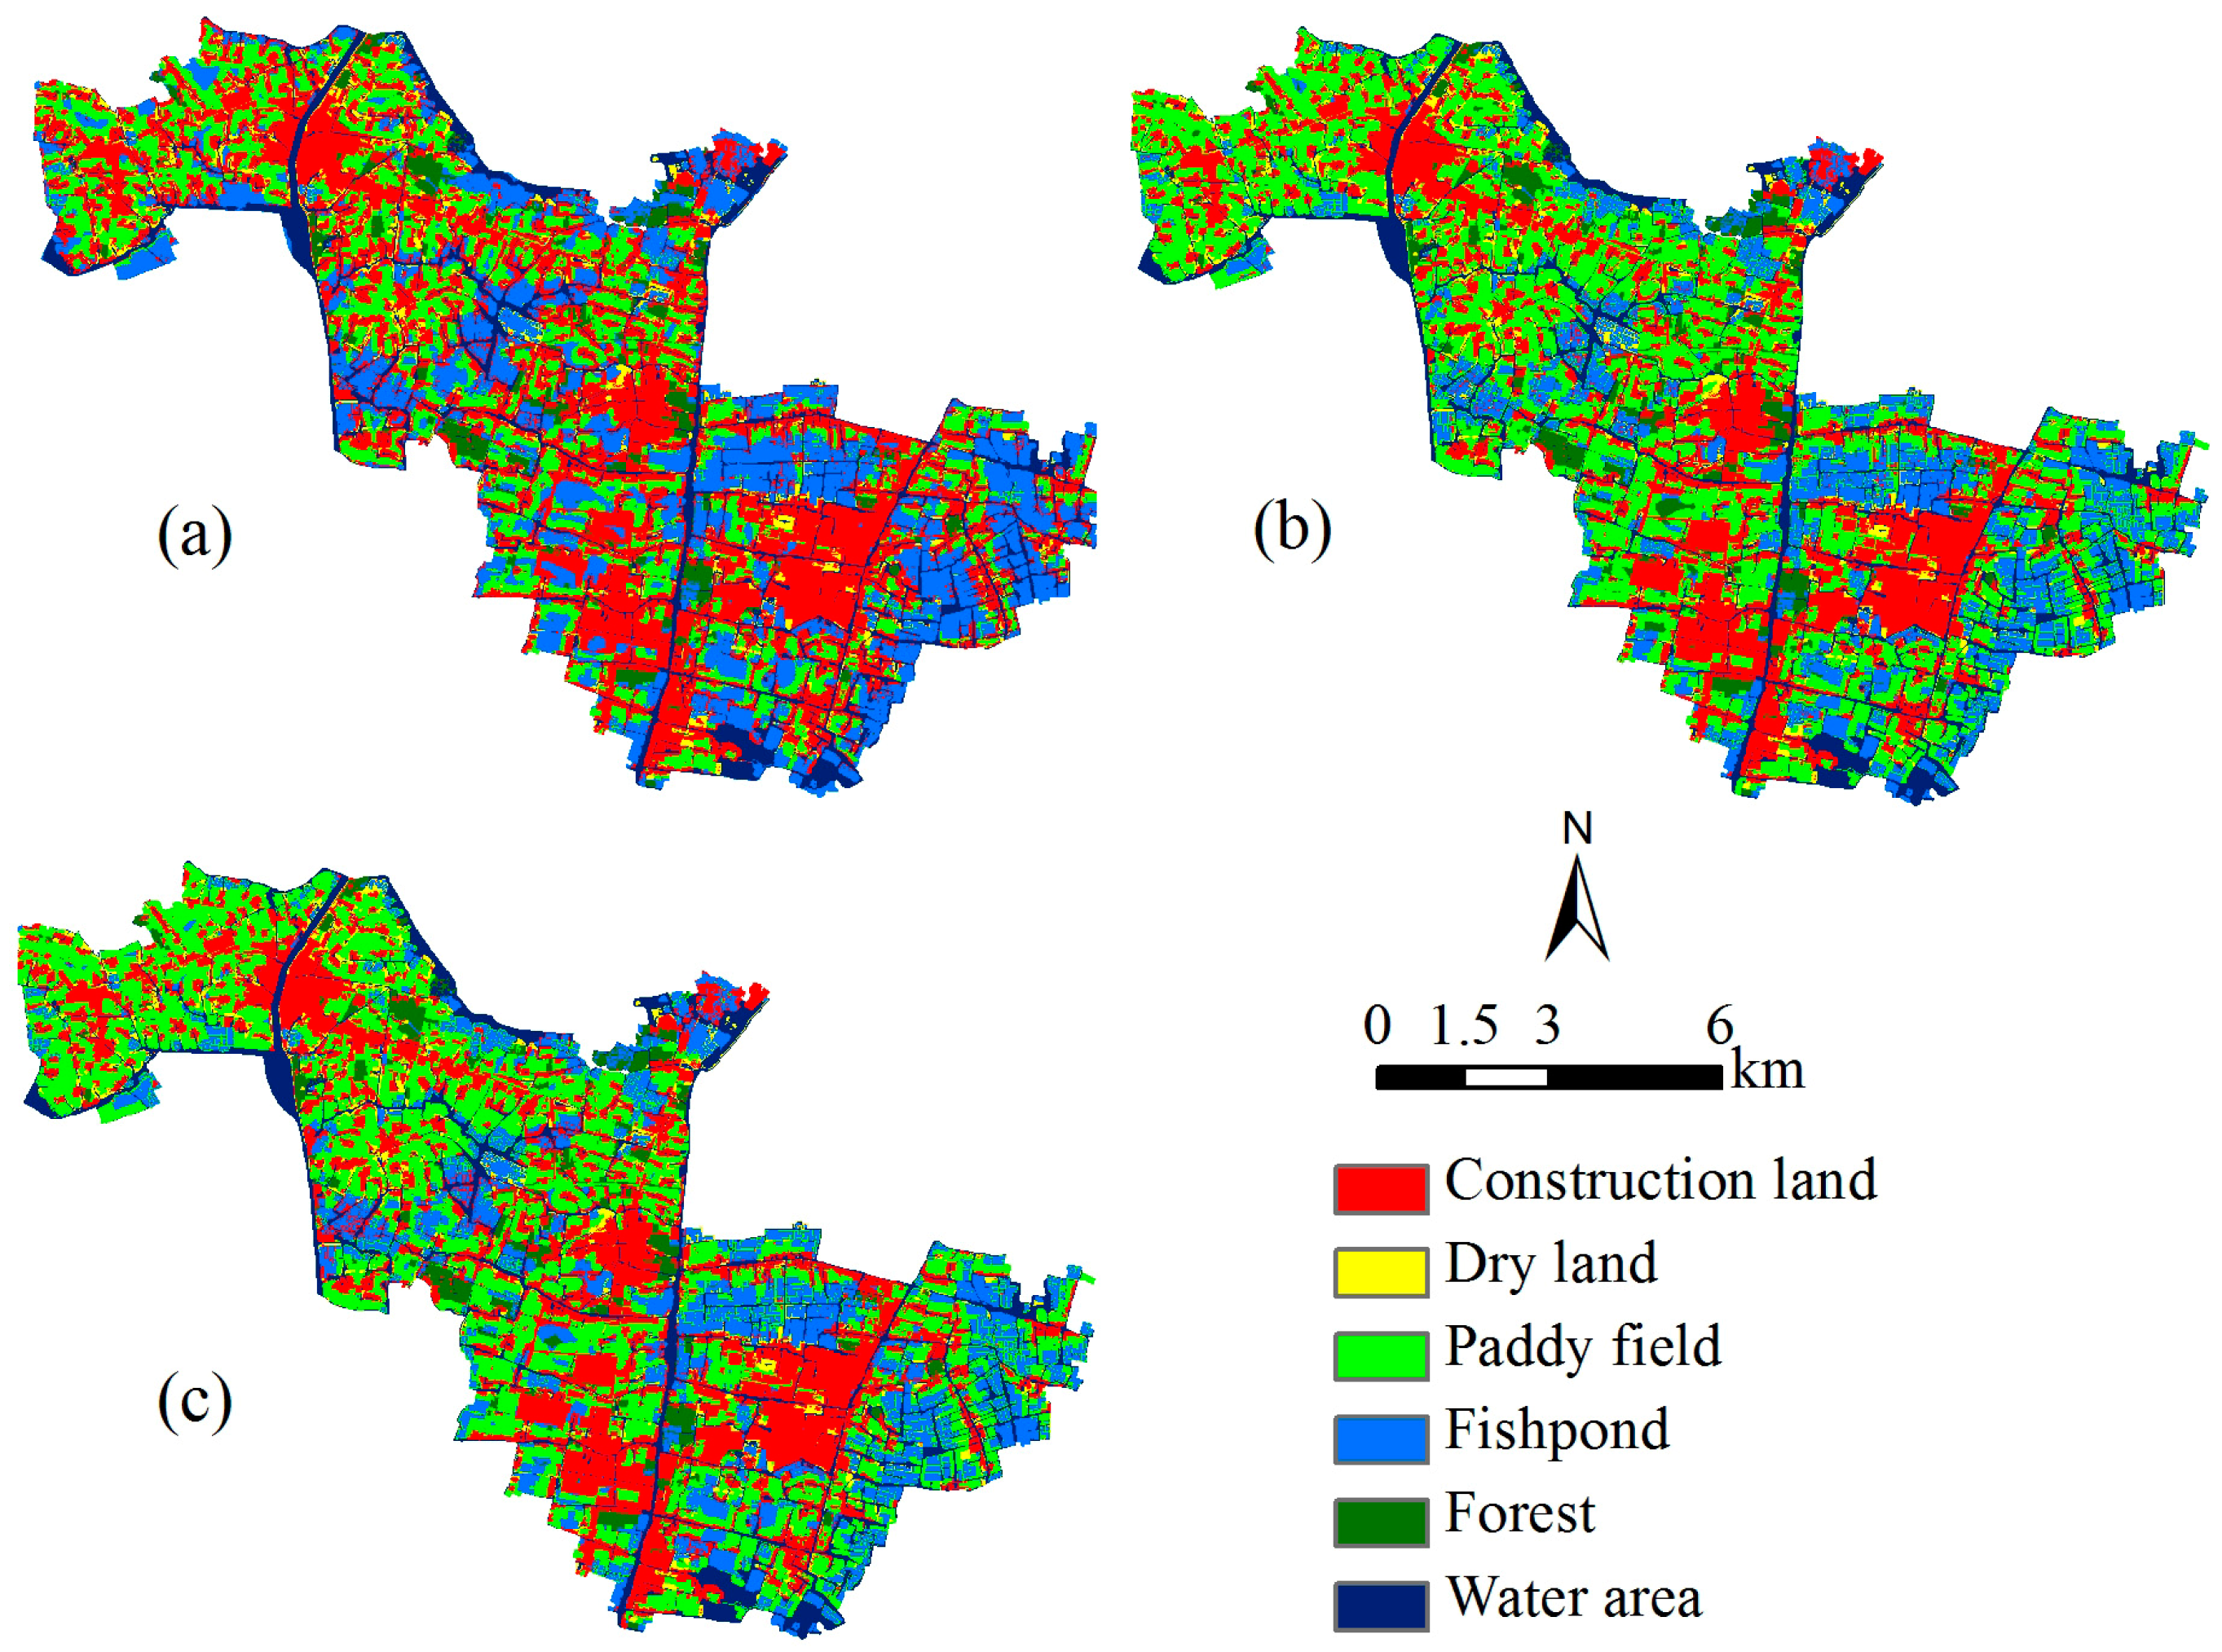
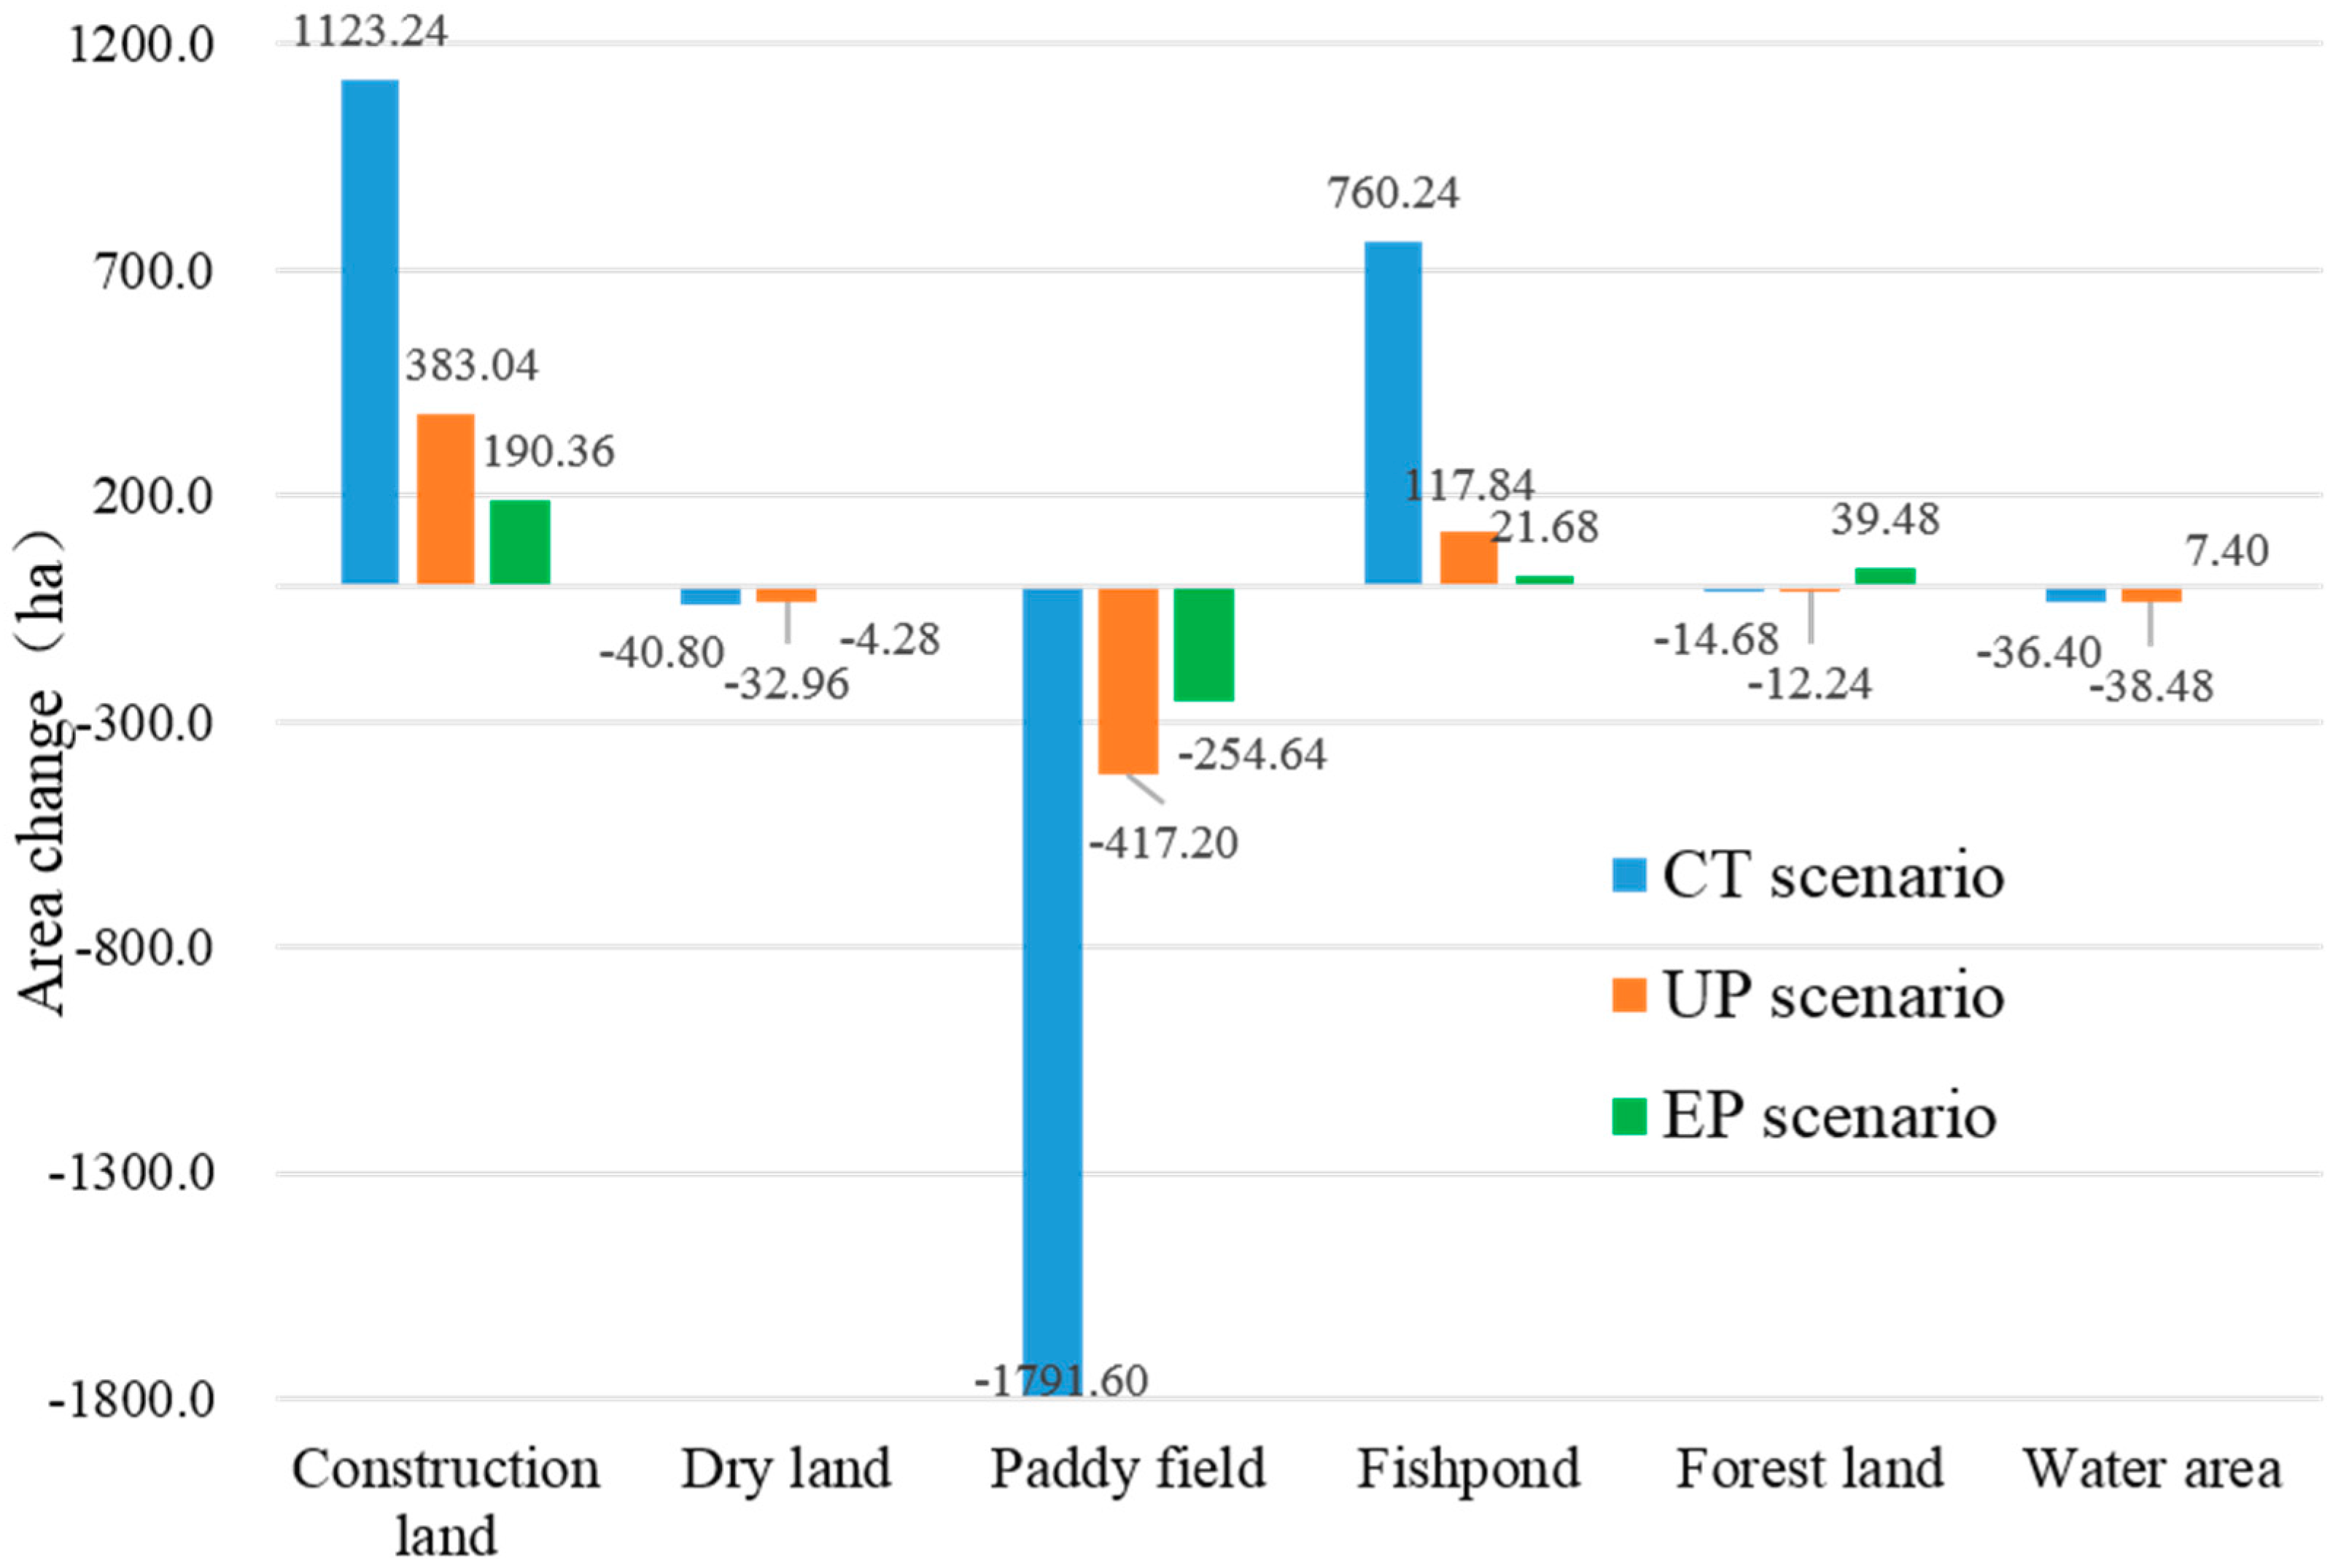
3.2. Land-Use Change and Urban Growth Prediction under Different Scenarios

The configuration parameters of the CLUE-S model were applied to land-use change and urban growth simulation for 2009–2027. Different land-use types with regard to future area changes under three scenarios are shown in Figure 5, which displays different change trends for 2009–2027. The increase of construction land and the decrease of paddy field were the dominant changes of land-use in the study area under the three scenarios. The increased area of construction land was mainly converted from paddy field, based on the additional analysis of land-use transition matrix. Plenty of paddy field, along with a few dry land and forest, were occupied by the construction land, especially those located at the urban–rural fringe, nearby existing construction area, and along major roads and water area (Figure 6). The average annual increase rate of construction land under the CT scenario was 62.40 ha/year, which was obviously higher than that under other scenarios. Unlike the other two scenarios, the forest and water area would increase for their higher ecological service values under the EP scenario. The area of paddy field would decrease under all scenarios. This is particularly remarkable for the CT scenario, which showed the area of paddy field decreased by 1791.60 ha from 2009 to 2027, while the area under the UP and EP scenarios decreased by 417.20 ha and 254.64 ha, respectively.
Like the other parts of the southern Jiangsu in China, the cultivated land in our area was subject to encroachment by construction land. Such a result indicates the increasing conflicts between urban and rural development and farmland preservation. Consequently, the urban planners and decision-makers in Xinzhuang town need to highlight the issues and strengthen the control of its land use. In the process of establishing the UGBs, the amount of urban and rural construction land should be validated scientifically, aiming to prohibit the unplanned sprawl of construction land reasonably and realizing the sustainable use of land resources.

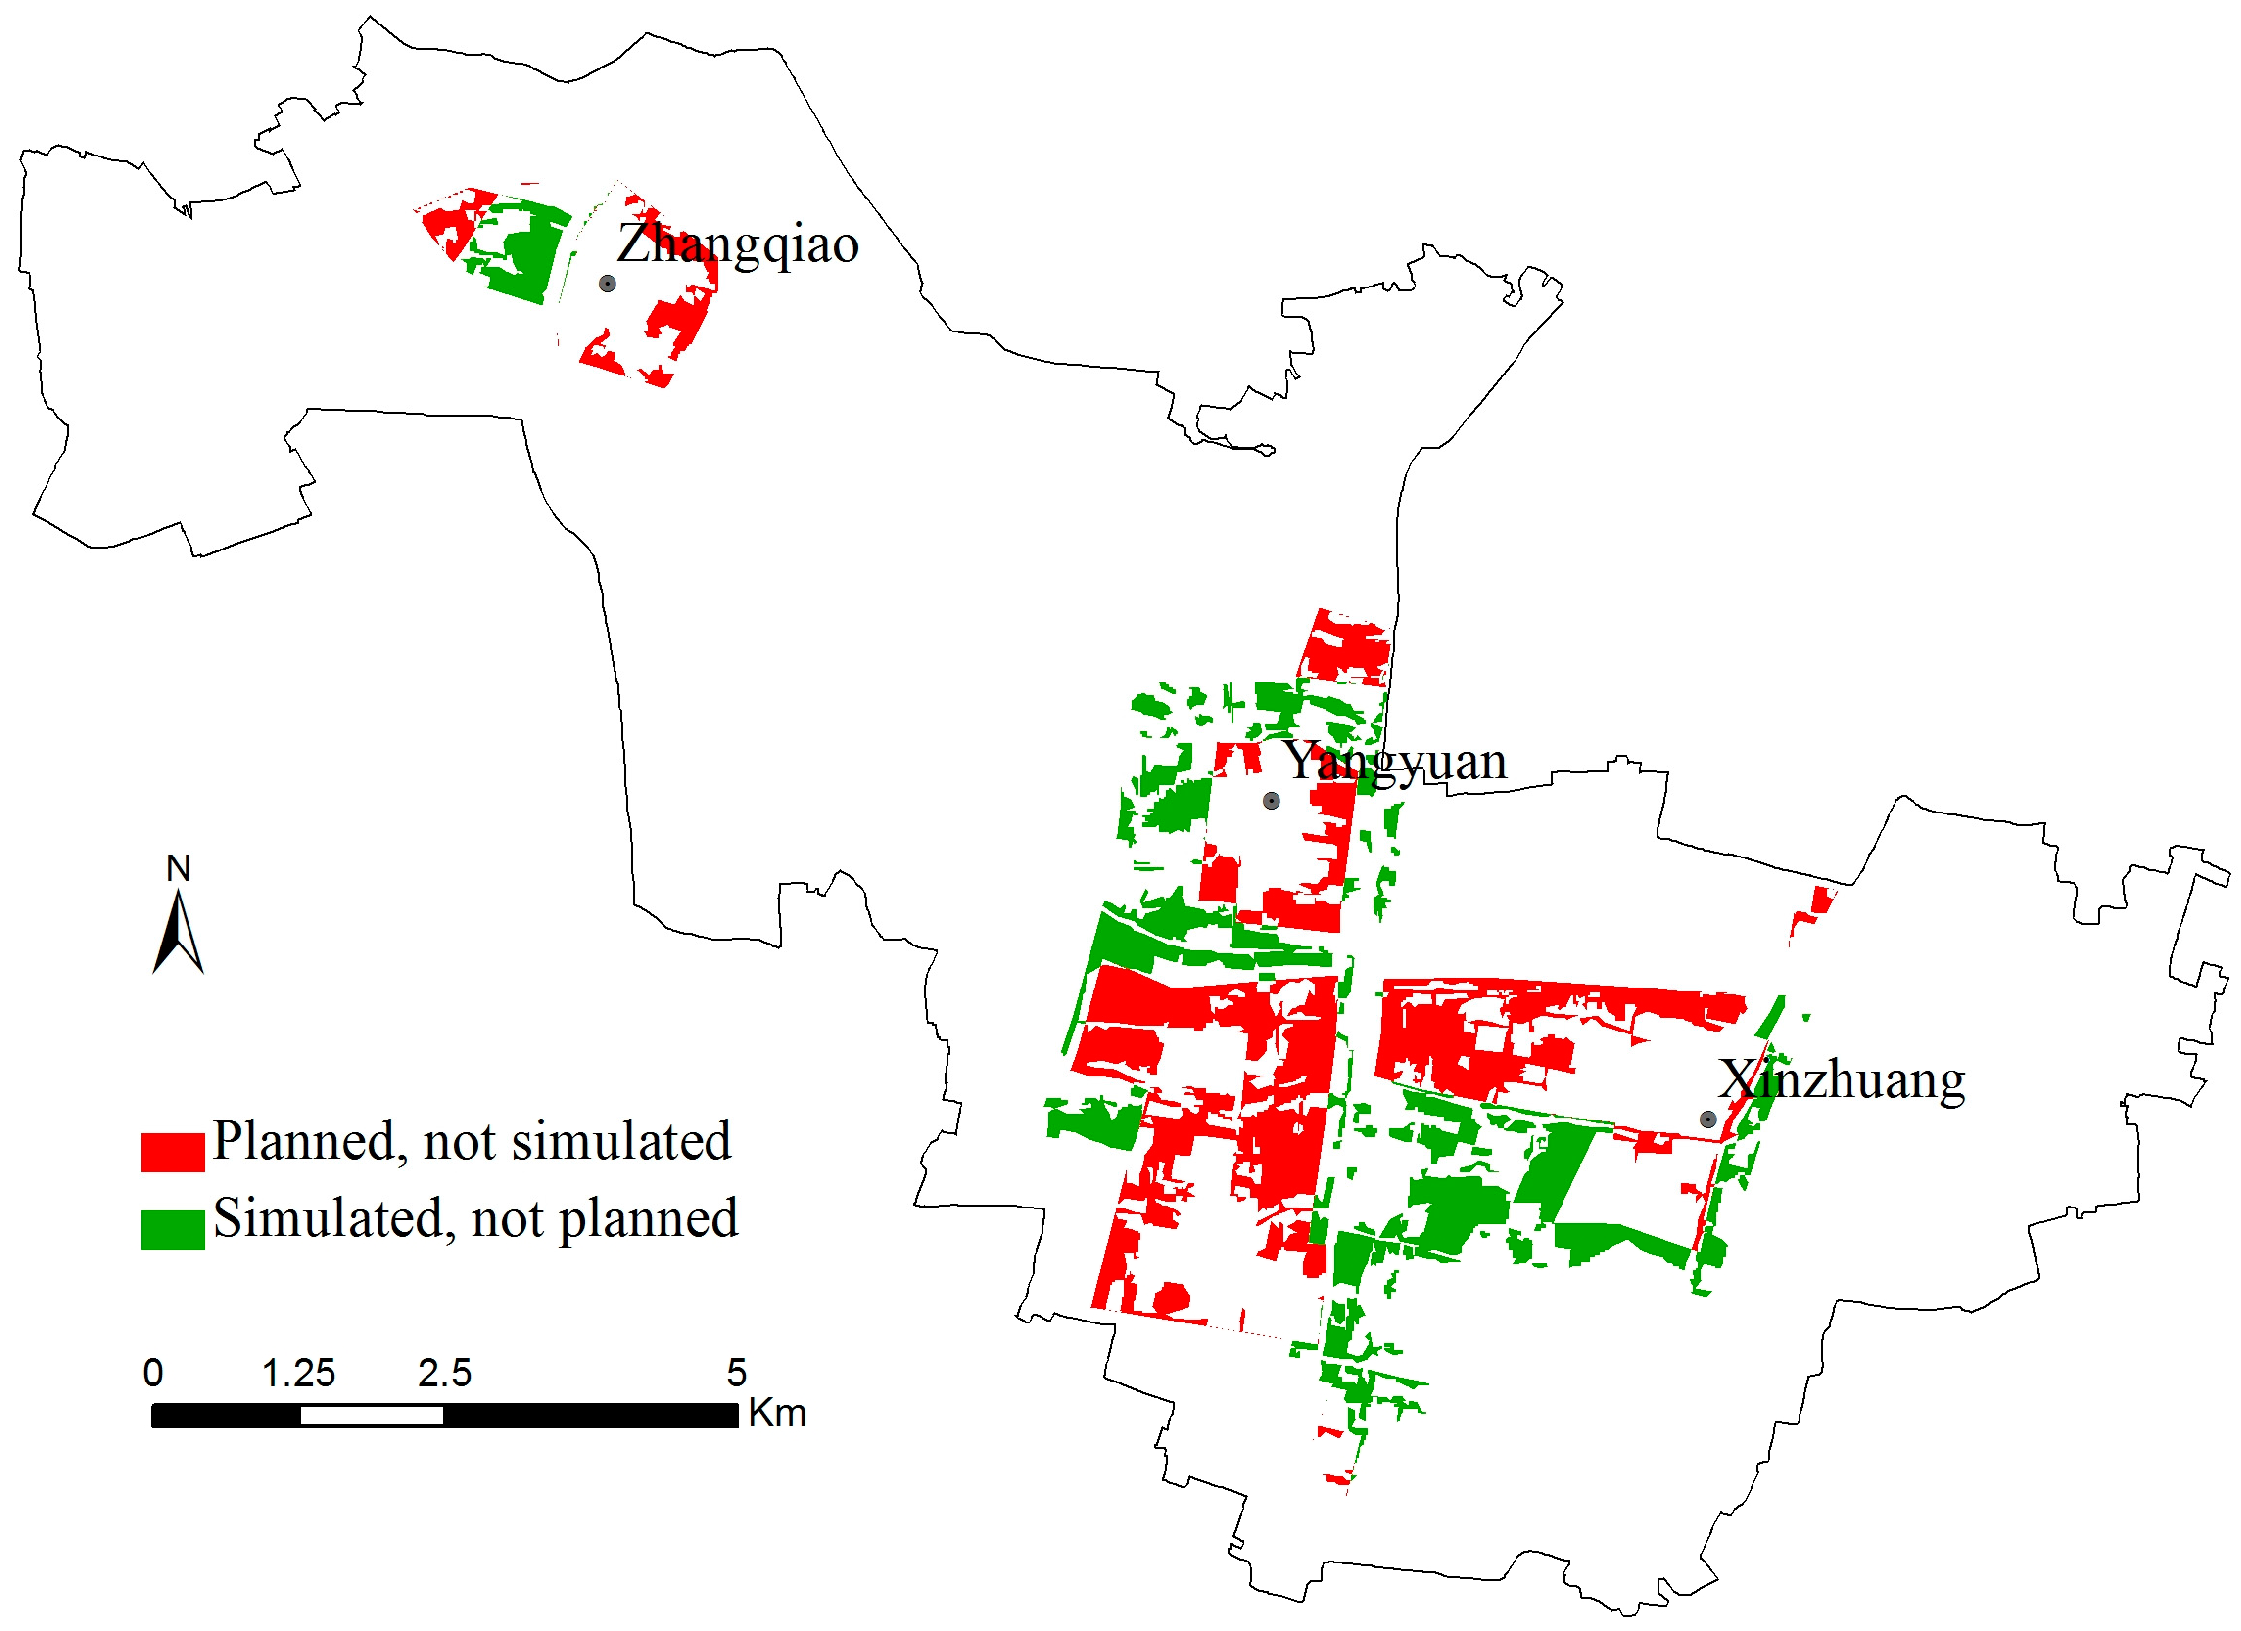
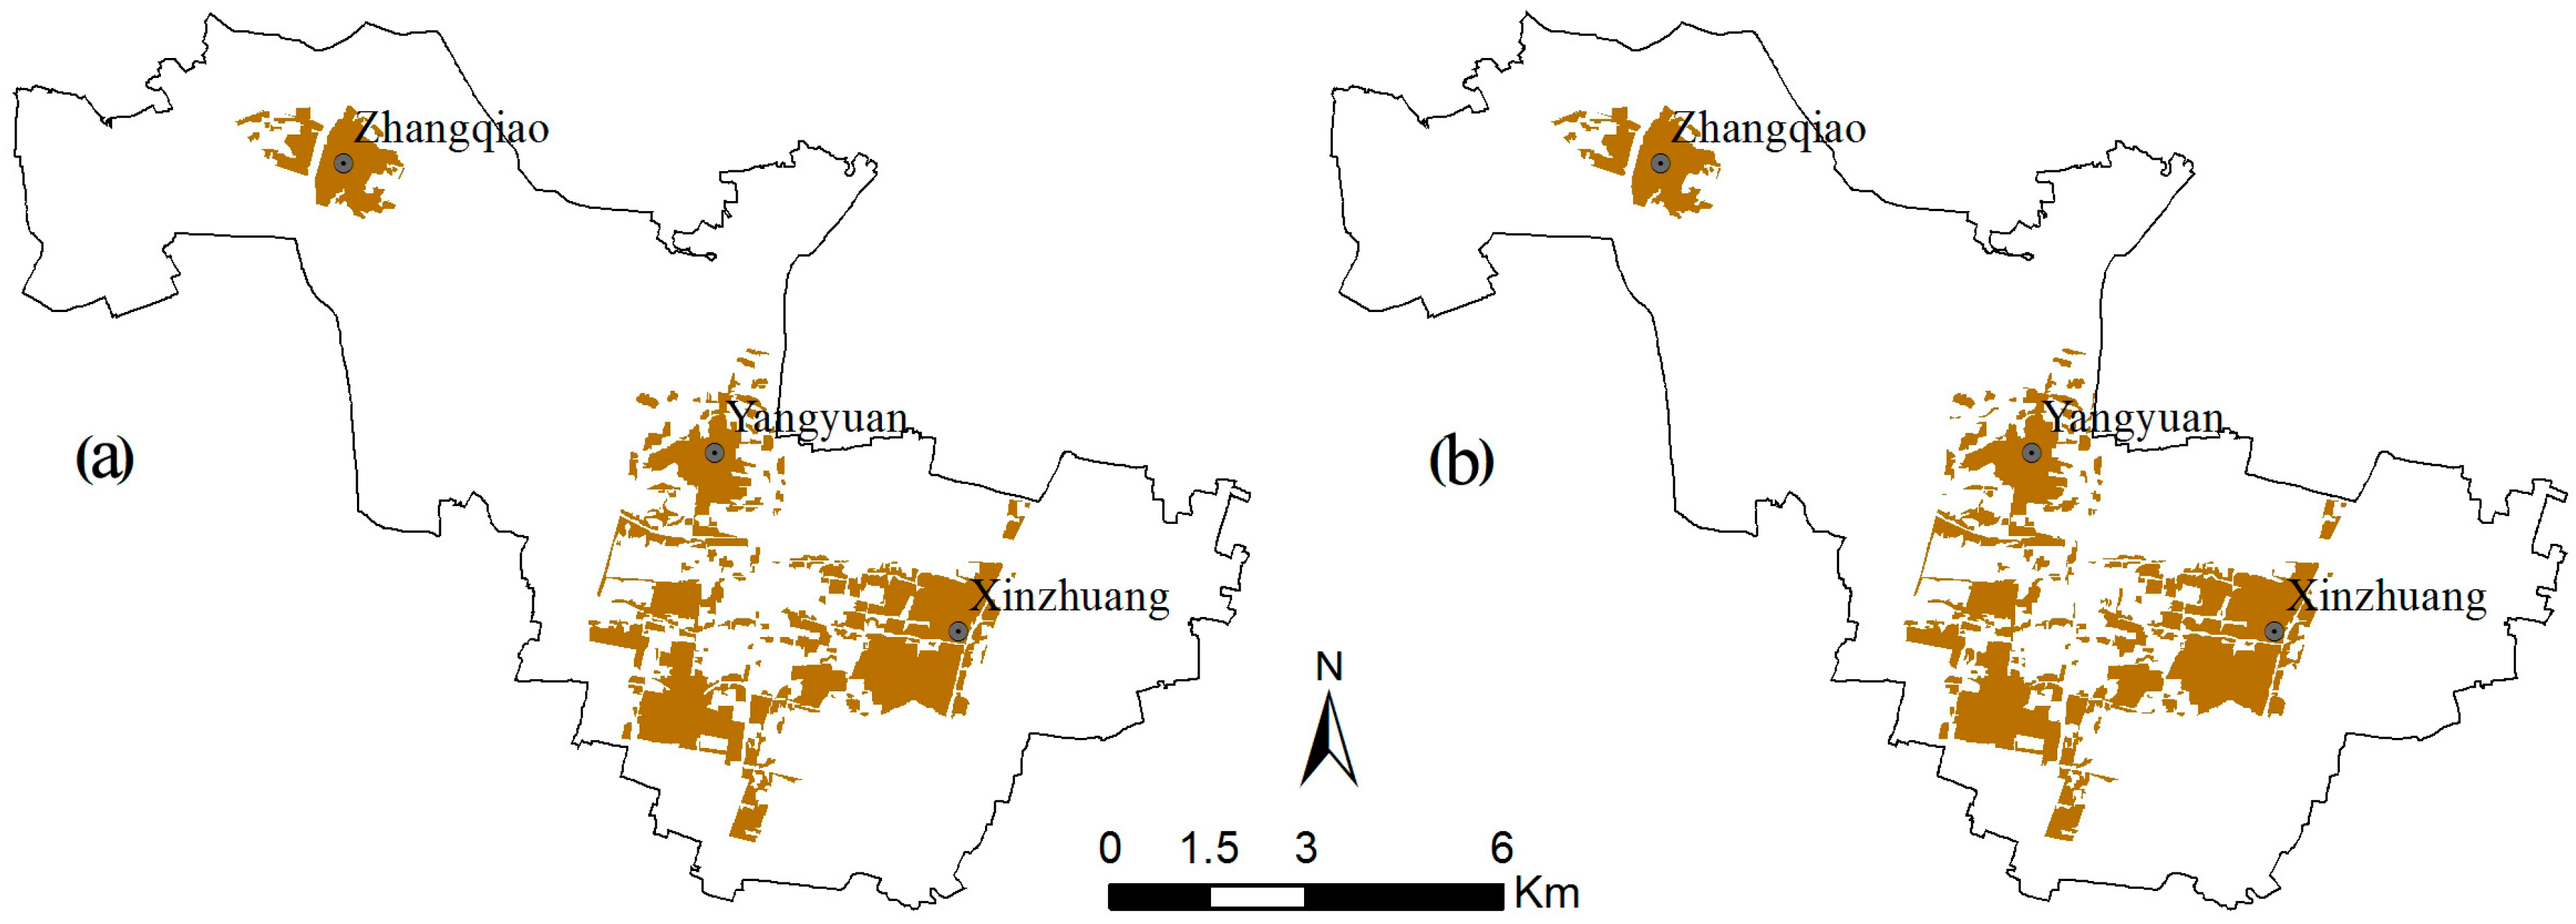
3.3. The Delimitation of UGBs

The UGBs of the study area are established in the present study based on the aforementioned CLUE-S model simulation methods. To evaluate the feasibility of the land-use change model in delimiting the UGBs, a comparison of the simulated urban construction land (UGBs) in 2020 under the CT scenario with the planned UGBs from Xinzhuang town master planning (2006–2020) was made. Urban growth from 2009 to 2020 is expected to follow the trend of urban growth of 1991–2009. Accordingly, the CT scenario is regarded as the baseline scenario. The planned UGBs and simulated UGBs under the CT scenario of 2020 are shown in Figure 7. Figure 8 further reveals that the UGBs in the planned map tend to be spatially simplified with regular boundaries, while the simulated UGBs under the CT scenario exhibiting the historical growth trends tend to be rather spatially fragmented with complicated boundaries. The simulated map seems to better reflect the reality of urban growth laws, while the planning map seems more like an arbitrary blueprint with regular boundary by simplifying the complexity of land-use dynamics and ignoring the interior difference in land-use structure.
Figure 9 shows the CLUE-S model based simulation of future urban growth patterns under the UP and EP scenarios. Not surprisingly, the simulated UGBs under the UP and EP scenarios were slightly different from the UGBs under the CT scenario, when setting the baselines for conversion elasticity value (Table 1). Therefore, all simulated UGBs under the three scenarios show better outputs when compared with the planned UGBs delimited by Xinzhuang town master planning (2006–2020).

4. Discussion

4.1. On the Suitability of CLUE-S Model in Delimitation of UGBs

Among the existing approaches examining the cause–effect relationship between urban sprawl and surrounding environment, the concepts and planning practices of UGBs provide a relatively new way rather than the final solution to mitigate the adverse impacts of urban encroachment on agricultural and rural land [46]. In practice, it is necessary and effective for local governments to guide the zoning and land-use decisions by restricting urban development to a given boundary. Meanwhile, the surrounding environment with agricultural and rural land, watershed, forest, and wild land are expected to be less effected by intensive human activities. Many factors ranging from natural conditions [47], socioeconomic levels [48], and political institutions [49], which interplay in a complex way in effecting local governments’ decision-making for zoning and land-use. In the context of China’s practice in urban master planning, these aforementioned factors were traditionally considered. However, too many concerns were focused on socioeconomic factors (e.g., population growth, land price, local government’s fiscal revenue) and political considerations (e.g., increase in GDP and local government’s performance assessment), which, to a large degree, determine the matching/mismatching supply/demand of land resource and land-use pattern. In contrast, the dynamic land-use pattern under multiple scenarios—which represent the historical and predicted conflicts between land development intensity and maintaining natural ecosystem services as well as seeking solutions to future conflicts—attracted less attention. Consequently, such traditional planning with arbitrary and subjective assumptions are not only responsible for uncontrolled urban encroachment and officially pronounced environmental deterioration [50,51,52], but for the remarkable deviation between presumed UGBs and actual UGBs. As addressed in Section 3.3 of this paper, there is a remarkable deviation between the planned UGBs and simulated UGBs under the CT scenario. In contrast, the simulated UGBs under the UP and EP scenarios, which were based on the baseline simulation, were slightly deviated from the UGBs under the CT scenario (Figure 9). Apparently, all of these simulated UGBs, which represent the past land-use trends and focus on different land development intensity and demand for ecosystem services, show that the CLUE-S model performs much better than the planned UGBs using conventional methods.

4.2. Limitation of This Study

In this study, the CLUE-S model was employed to simulate and validate the UGBs based on past land-use trends, and further predict future UGBs under three scenarios. Compared to the conventional UGBs established, which depend mostly on planners’ experience, the CLUE-S model considers a combination of land-use suitability, spatial policies and restrictions, and neighborhood effects to satisfy the balance between land-use supply and demand. However, the accuracy and applicability of the CLUE-S model may be subject to data quality and accessibility, which can influence the CLUE-S models’ validation and their applicability to guide urban planning practice and delimitation of UGBs. Firstly, the quality of the input data measured in time and spatial scales determines the accuracy of simulated UGBs under different scenarios. Undoubtedly, high-resolution images (~m) can capture fine-scale land-use features and provide accurate spatial information. This can further help reduce the mixing effect between neighboring pixels, and thus reduce the systematic errors of misclassification of land-use types. Besides, acquired images with short revisiting intervals can accurately capture the timely change of land-use types, which characterizes dynamic features of urban footprint. Unfortunately, due to the physical limitation of a maximum of six land-use types’ settings of the CLUE-S model and computing system, all of the high-resolution land-use maps were resampled to a relatively coarse 20 m product. This may degrade our effort in exploring this model’s suitability and applicability. We think a combination of the other models, such as Markov chain decision [53,54], systematic dynamics approach [17,40,55], and time-series analysis [56], may help fix such problems. Secondly, data accessibility determines the applicability in simulation and delimitation of UGBs. In this study, land-use data settings, under three scenarios, were input into the CLUE-S model to simulate and validate the past land-use patterns and further predict future UGBs. However, due to the complexity of land-use change and urban growth process, it is still very difficult for the present CLUE-S model or Markov model to adopt all of the key factors in determining the formation of UGBs. For example, detailed considerations such as spatial distribution of urban infrastructure and demand for land, socioenvironmental inequality and land development pressure, and the compensation for deviation between planned and actual UGBs, were missing in our model settings. At present, it seems that our findings are divergent from the objectives in effectively guiding and manipulating the acceptable UGBs. Therefore, we appeal for the development of mature land-use and land-cover change (LUCC) models, which will better reflect the complex behaviors of land-use change and urban growth system via combining different socioeconomic and ecological “what-if” scenarios design. Through the comparison analysis among different scenarios, a preferable scenario can be selected to establish the recommended UGBs and the corresponding policy for decision makers [1].

5. Conclusions

China’s practice in delimitation of UGBs are often proven to be inefficient in curbing the uncontrolled urban expansion and associated adverse impacts on the surrounding environment. In this paper, the fast-growing Xinzhuang town of Changshu city, eastern China, was used as an example to demonstrate how to develop a new method towards delimiting UGBs based on a land-use change model (CLUE-S). The methodology adopted in this study can simulate possible patterns of urban growth and land-use change, and indicate how different policies, spatial restraints, and growth trends may or may not be conducive to the objectives of delimiting UGBs under different scenarios. The results show that the land-use change and urban growth simulation accuracy of CLUE-S model is high. The expansion of construction land and the decrease of paddy field would be the main changing trends of local land-use, and a massive area of cultivated land and ecological land providing ecosystem services would be transformed into construction land in 2009–2027. There is remarkable discordance in the spatial distribution between the simulated UGBs based on the CLUE-S model and the planned UGBs based on the conventional method, while the simulated results may more closely reflect the reality of urban growth laws. Herein, focusing on the future, UGBs may quite differ from the planned UGBs in the master planning, we consider that there is a strong need to develop an improved solution by using available historical data for land use, and configuration of model parameters during the calibration of the CLUE-S model. Only by doing these, can the enhanced land-use change models serve as scientific planning support tools that are helpful for assisting spatial planners and decision-makers to understand the urban growth process and delimit the UGBs. In the context of China’s reality, the findings would help local authorities better understand the complex land-use system and develop the improved urban development and land-use management, which can better balance urban expansion, basic farmland, and ecological land protection. In summary, this study proves that a land-use change model can provide the requisite theoretical guidance and technical support for delimiting and improving UGBs in Chinese cities. From a broad view, the findings of this study may provide beneficial lessons for our international colleagues who are engaged in urban planning, land development, spatial modeling, and ecosystem management.

Acknowledgments

This research is jointly supported by the project National Natural Science Foundation of China (Grants No. 41171432 and No. 51378127), Humanity and Social Science Youth foundation of Ministry of Education of China (Grants No. 16YJCZH161), and China Postdoctoral Science Foundation (Grants No. 2014M561407).

Author Contributions

Rui Zhou designed the overall ideas for the study, performed the processing and analysis of the data, and wrote the earlier draft of manuscript. Rui Zhou and Hao Zhang rewrote the manuscript. Hao Zhang and Xin-Yue Ye revised the manuscript and improved the quality of latest version. All of the authors read and approved the final manuscript. Xin-Jun Wang and Hai-Long Su participated in field survey.

Conflicts of Interest

The authors declare no conflict of interest.

References

  1. Long, Y.; Han, H.; Lai, S.; Mao, Q. Urban growth boundaries of the Beijing Metropolitan Area: Comparison of simulation and artwork. Cities 2013, 31, 337–348. [Google Scholar] [CrossRef]
  2. Erik, L.; Ding, C. Land use efficiency, food security, and farmland preservation in China. Land Lines 2006, 18, 2–7. [Google Scholar]
  3. Clover, J.; Eriksen, S. The effects of land tenure change on sustainability: Human security and environmental change in southern African savannas. Environ. Sci. Policy 2009, 12, 53–70. [Google Scholar] [CrossRef]
  4. Nelson, A.; Duncan, J. Growth Management Principles and Practices; American Planning Association Planners Press: Chicago, IL, USA, 1995. [Google Scholar]
  5. Long, Y.; Shen, Z.; Mao, Q. An urban containment planning support system for Beijing. Comput. Environ. Urban. 2011, 35, 297–307. [Google Scholar] [CrossRef]
  6. Pendall, R.; Martin, J.; Fulton, W. Holding the Line: Urban Containment in the United States; The Brookings Institution Center on Urban and Metropolitan Policy: Washington, DC, USA, 2002. [Google Scholar]
  7. Gordon, D.; Vipond, S. Gross density and new urbanism. J. Am. Plann. Assoc. 2005, 71, 41–54. [Google Scholar] [CrossRef]
  8. Bengston, D.; Youn, Y. Urban containment policies and the protection of natural area: The case of Seoul’s greenbelt. Ecol. Soc. 2006, 11, 3–13. [Google Scholar] [CrossRef]
  9. Coiacetto, E. Residential sub-market targeting by developers in Brisbane. Urban Policy Res. 2007, 25, 257–274. [Google Scholar] [CrossRef]
  10. Gunn, S. Green belts: A review of the region’s responses to a changing housing Agenda. J. Environ. Plan. Manag. 2007, 50, 595–616. [Google Scholar] [CrossRef]
  11. Fang, L. Study on American urban growth management policy and its reference to China. Chin. J. Land 1999, 8, 42–43. (In Chinese) [Google Scholar]
  12. Wu, Q.; Zhing, S. Review of Urban Growth Boundary research and analysis of its Sinicization. Trop Geol. 2011, 31, 409–415. [Google Scholar]
  13. Han, H.; Lai, S.; Dang, A.; Tan, Z.; Wu, C. Effectiveness of urban construction boundaries in Beijing: An assessment. J. Zhejiang. Univ-Sci. A 2009, 10, 1285–1295. [Google Scholar] [CrossRef]
  14. Tian, L.; Lv, C.; Shen, T. Theoretical and empirical research on implementation evaluation of city master plan: A case of Guangzhou City Master Plan (2001–2010). Urban Plan. Forum 2008, 5, 90–96. (In Chinese) [Google Scholar]
  15. Xu, Y.; Shi, S.; Fan, Y. Methodology of Shanghai City Master Planning in new position. Urban Plan. Forum 2009, 2, 10–15. (In Chinese) [Google Scholar]
  16. Ojima, D.; Lavorel, S.; Graumlich, L.; Moran, E. Terrestrial human-environment systems: The future of land research in IGBP II. IGBP. Glob. Chang. Newsl. 2002, 50, 31–34. [Google Scholar]
  17. Zhao, R.; Chen, Y.; Shi, P.; Zhang, L.; Pan, J.; Zhao, H. Land use and land cover change and driving mechanism in the arid inland river basin: A case study of Tarim River, Xinjiang, China. Environ. Earth. Sci. 2013, 68, 591–604. [Google Scholar] [CrossRef]
  18. Braimoh, A.; Onishi, T. Spatial determinants of urban land use change in Lagos, Nigeria. Land Use Policy 2007, 24, 502–515. [Google Scholar] [CrossRef]
  19. Luo, G.; Yin, C.; Chen, X.; Xu, W.; Lu, L. Combining system dynamic model and CLUE-S model to improve land use scenario analyses at regional scale: A case study of Sangong watershed in Xinjiang, China. Ecol. Complex. 2010, 7, 198–207. [Google Scholar] [CrossRef]
  20. Verburg, P.; Veldkamp, A. Projecting land use transitions at forest fringes in the Philippines at two spatial scales. Landsc. Ecol. 2004, 19, 77–98. [Google Scholar] [CrossRef]
  21. Houet, T.; Marchadier, C.; Bretagne, G.; Moine, M.; Aguejdad, R. Combining narratives and modeling approaches to simulate fine scale and long-term urban growth scenarios for climate adaptation. Environ. Model. Softw. 2016, 86, 1–13. [Google Scholar] [CrossRef]
  22. Vilet, J.; Bregt, A.; Brown, D.; Delden, H.; Heckbert, S. A review of current calibration and validation practices in land-change modeling. Environ. Model. Softw. 2016, 82, 174–182. [Google Scholar]
  23. Erik, K.; Piet, R.; Ton, D. Modeling land-use change for spatial planning support. Ann. Reg. Sci. 2008, 42, 1–10. [Google Scholar]
  24. Overmars, K.; Verburg, P.; Veldkamp, T. Comparison of a deductive and an inductive approach to specify land suitability in a spatially explicit land use model. Land Use Policy 2007, 24, 584–599. [Google Scholar] [CrossRef]
  25. Pan, Y.; Roth, A.; Yu, Z.; Doluschitz, R. The impact of variation in scale on the behavior of a cellular automata used for land use change modeling. Comput. Environ. Urban Syst. 2010, 34, 400–408. [Google Scholar] [CrossRef]
  26. Guan, D.; Li, H.; Inohae, T.; Su, W.; Nagaie, T.; Hokao, K. Modeling urban land use change by the integration of cellular automaton and Markov model. Ecol. Model. 2011, 222, 3761–3772. [Google Scholar] [CrossRef]
  27. Verburg, P.; Eickhout, B.; Meijl, H. A multi-scale, multi-model approach for analyzing the future dynamics of European land use. Ann. Reg. Sci. 2008, 42, 57–77. [Google Scholar] [CrossRef]
  28. Verburg, P.; Soepboer, W.; Limpiada, R. Land use change modeling at the regional scale: The CLUE-S model. Environ. Manag. 2002, 3, 391–405. [Google Scholar] [CrossRef] [PubMed]
  29. Verburg, P.; Overmars, K. Dynamic simulation of land use change trajectories with the CLUE model. Model. Land-Use Chang. 2007, 90, 321–335. [Google Scholar]
  30. Parker, D.; Manson, S.; Janssen, M.; Hoffmann, M.; Deadman, P. Multi-agent systems for the simulation of land use and land cover change: A review. Ann. Assoc. Am. Geogr. 2003, 93, 316–340. [Google Scholar] [CrossRef]
  31. Berger, T.; Schreinemachers, P.; Woelcke, J. Multi-agent simulation for the targeting of development policies in less-favored areas. Agric. Syst. 2006, 88, 28–43. [Google Scholar] [CrossRef]
  32. Zhou, R.; Su, H.; Hu, Y.; Li, Y.; Liu, M. Scenarios simulation of town land use change under different spatial constraints. Trans. CSAE 2011, 27, 300–308. (In Chinese) [Google Scholar]
  33. Veldkamp, A.; Fresco, L. CLUE: A conceptual model to study the conversion of land use and its effects. Ecol. Model. 1996, 2, 253–270. [Google Scholar] [CrossRef]
  34. Verburg, P.; Veldkamp, A.; Bouma, J. Land-use change under conditions of high population pressure: The case of Java. Glob. Environ. Chang. 1999, 9, 303–312. [Google Scholar] [CrossRef]
  35. Muller, M.; Middleton, J. A Markov model of land-use change dynamics in the Niagara Region, Ontario, Canada. Landsc. Ecol. 1994, 9, 151–157. [Google Scholar]
  36. Reveshty, M. The assessment and predicting of land use changes to urban area using multi-temporal satellite imagery and GIS: A case study on Zanjan, IRAN (1984–2011). J. Geogr. Inf. Syst. 2011, 3, 298–305. [Google Scholar] [CrossRef]
  37. Xia, H.; Liu, H.; Zheng, C. A Markov-Kalman model of land-use change prediction in XiuHe Basin, China. In Geo-Informatics in Resource Management and Sustainable Ecosystem; Springer: Berlin/Heidelberg, Germany, 2013; pp. 75–85. [Google Scholar]
  38. Yang, X.; Zheng, X.; Chen, R. A land use change model: Integrating landscape pattern indexes and Markov-CA. Ecol. Model. 2014, 282, 1–7. [Google Scholar] [CrossRef]
  39. Zheng, H.; Shen, G.; Wang, H.; Hong, J. Simulating land use change in urban renewal areas: A case study in Hong Kong. Habitat. Int. 2015, 43, 23–34. [Google Scholar] [CrossRef]
  40. Bucini, G.; Lambin, E. Fire impacts on vegetation in Central Africa: A remote-sensing based statistical analysis. Appl. Geogr. 2002, 22, 27–48. [Google Scholar] [CrossRef]
  41. Pontius, R.; Schneider, L. Land-cover change model validation by an ROC method for the Ipswich watershed, Massachusetts, USA. Agric. Ecosyst. Environ. 2001, 85, 239–248. [Google Scholar] [CrossRef]
  42. Pontius, J. Quantification error versus location error in comparison of categorical maps. Photogram. Eng. Remote Sens. 2000, 8, 1011–1016. [Google Scholar]
  43. Veldkamp, A.; Verburg, P. Methodology for Simulating the Spatial Dynamics of Land Use Change in Forest Fringes. 2002. Available online: http://edepot.wur.nl/314616 (accessed on 15 November 2016).
  44. Zheng, X.; Zhao, L.; Xiang, W.; Li, N.; Lv, L.; Yang, X. A coupled model for simulating spatio-temporal dynamics of land-use change: A case study in Changqing, Jinan, China. Landsc. Urban. Plan. 2012, 106, 51–61. [Google Scholar] [CrossRef]
  45. R Development Core Team. R Version x64 3.3.1. Available online: https://cran.r-project.org/ (accessed on 20 June 2016).
  46. James, P.; Holden, M.; Lewin, M.; Neilson, L.; Oakley, C.; Truter, A.; Wilmoth, D. Managing Metropolises by Negotiating Mega-Urban Growth. Harald Mieg and Klaus Töpfer. In Institutional and Social Innovation for Sustainable Urban Development; Routledge: Oxford, UK, 2013. [Google Scholar]
  47. Wei, L. GIS Modeling of Urbanization Impacts on Natural Resources. Master’s Thesis, Iowa State University, Ames, IA, USA, 2007. [Google Scholar]
  48. Evans, A. Economics and Land Use Planning; John Wiley and Sons: Hoboken, NJ, USA, 2008. [Google Scholar]
  49. Lewis, P.G. Shaping Suburbia: How Political Institutions Organize Urban Development; University of Pittsburgh Press: Pittsburgh, PA, USA, 1996. [Google Scholar]
  50. Gao, Z. Analysis of Disorder in Land Use Planning. Planners 2000, 16, 57–59. (In Chinese) [Google Scholar]
  51. Li, Y. Method of determining urban growth boundary from the view of ecology: A case study of Hangzhou. City Plan. Rev. 2011, 35, 83–90. (In Chinese) [Google Scholar]
  52. Zhu, Z.; Mo, B.; Xie, F. Delimitation of urban growth boundary based on land ecological suitability evaluation: A case of Fangchenggang. Planners 2009, 25, 40–44. (In Chinese) [Google Scholar]
  53. Halmy, M.; Gessler, P.; Hicke, J.; Salem, B. Land use/land cover change detection and prediction in the north-western coastal desert of Egypt using Markov-CA. Appl. Geogr. 2015, 63, 101–112. [Google Scholar] [CrossRef]
  54. Han, Y.; Jia, H. Simulating the spatial dynamics of urban growth with an integrated modeling approach: A case study of Foshan, China. Ecol. Model. 2016, 10, 1–10. [Google Scholar]
  55. Mao, X.; Meng, J.; Wang, Q. Modeling the effects of tourism and land regulation on land-use change in tourist regions: A case study of the Lijiang River Basin in Guilin, China. Land Use Policy 2014, 41, 368–377. [Google Scholar] [CrossRef]
  56. Liu, M.; Hu, Y.; Chang, Y.; He, X.; Zhang, W. Land use and land cover change analysis and prediction in the upper reaches of the Minjiang River, China. Environ. Manag. 2009, 43, 899–907. [Google Scholar] [CrossRef] [PubMed]
Figure 1. Location and administrative districts of Xinzhuang in Jiangsu Province, China.
Sustainability 08 01182 g001
Figure 2. Land-use maps of Xinzhuang for 1991, 2001, and 2009.
Sustainability 08 01182 g002
Figure 3. Overview of the information flow in the CLUE-s model used for the study area. Note: This figure is redrawn according to Reference [29].
Sustainability 08 01182 g003
Figure 4. Simulated land-use maps for 2009: (a) based on the land-use data from 1991; and (b) based on the land-use data from 2001.
Sustainability 08 01182 g004
Figure 5. Area change of different land-use types during the prediction period under three different scenarios.
Sustainability 08 01182 g005
Figure 6. Simulated results of land-use in 2027 under (a) CT scenario; (b) EP scenario; and (c) UP scenario.
Sustainability 08 01182 g006
Figure 7. Planned urban growth boundaries (UGBs) and simulated UGBs under the CT scenario: (a) planned UGBs in 2020; and (b) simulated UGBs in 2020.
Sustainability 08 01182 g007
Figure 8. Spatial overlay between planned UGBs and simulated UGBs.
Sustainability 08 01182 g008
Figure 9. UGBs under EP and UP scenarios based on the CLUE-S (the Conversion of Land Use and its Effects at Small regional extent) model simulation: (a) simulated UGBs in 2020 under the EP scenario; and (b) simulated UGBs in 2020 under the UP scenario.
Sustainability 08 01182 g009
Table 1. Conversion elasticity values of land-use types in historical simulation and forecasting process.
ScenarioConstruction LandDry LandPaddy Field FishpondForestWater
1991–2009 0.90.50.40.80.60.7
2009–2027CT0.90.50.40.80.60.7
UP0.90.70.60.80.60.7
EP0.90.60.40.80.80.8
Note: CT, UP, and EP are abbreviations of Current Trend, Urban Planning, and Ecological Protection scenarios, respectively.
Table 2. The relative operating characteristics (ROC) statistics of logistic regression for all land-use types in 1991, 2001, and 2009.
Land-Use Type199120012009
Dry land0.7110.7060.759
Construction land0.9690.9170.951
Forest0.7680.8140.815
Water area1.0000.9900.988
Paddy field0.7760.7290.792
Fishpond0.8090.7860.812

