Article

Grassland and Wheat Loss Affected by Corn and Soybean Expansion in the Midwest Corn Belt Region, 2006–2013

1
Department of History, Armstrong State University, Savannah, GA 31419, USA
2
Department of Geography, Miami University, Oxford, OH 45056, USA
*
Author to whom correspondence should be addressed.
Sustainability 2016, 8(11), 1177; https://doi.org/10.3390/su8111177
Submission received: 31 August 2016 / Revised: 7 November 2016 / Accepted: 9 November 2016 / Published: 18 November 2016
(This article belongs to the Special Issue Land and Food Policy)

Abstract

:
Increases in agricultural commodity price triggered by ethanol production and other socioeconomic conditions have dramatically affected land uses and agronomic practices in the U.S. This study used crop-specific land cover data from the U.S. Department of Agriculture (USDA) to analyze agricultural expansion and crop rotation pattern from 2006 to 2013 in the Midwest Corn Belt (MWCB): nine states including Illinois, Indiana, Iowa, Kansas, Minnesota, Missouri, Nebraska, Ohio, and South Dakota. We identified a total of 3.9 million acres’ grassland loss between 2007 and 2012. The net loss of grassland occurred mainly along the western MWCB, an area with competing demand for limited water supply. Net conversion of grassland to corn or soybean is likely the result of a resumption of cropping on lands previously enrolled under the USDA Conservation Reserve Program (CRP), as well as expansion beyond CRP lands. Wheat, small grains, and other crops were also impacted by corn and soybean expansion. The amount of corn planted on corn increased by 23% between 2006 and 2013, whereas the amount of continuous soybean cropping fluctuated over time.

1. Introduction

The world population of 7.2 billion in mid-2013 is projected to increase to 8.1 billion in 2025, and 9.6 billion in 2050, an increase of almost one billion more people within the next 12 years [1]. Overall food demand is projected to double or triple by 2050 [2]. In the meantime, U.S. fuel ethanol production increased by 731% from 1.6 billion gallons to 13.3 billion gallons between 2000 and 2013 [3]. This large and rapid expansion of U.S. ethanol production resulted in increasing demand for corn, the primary feedstock for ethanol in the U.S., contributing to unprecedented rises in agricultural commodity prices [4]. Data from the U.S. Department of Agriculture (USDA) National Agricultural Statistics Service (NASS) (2014) showed that the market prices of corn more than tripled in the past decade. During 2000–2013, the total U.S. corn production increased from 9.9 billion bushels to 13.9 billion bushels, while the total corn area increased from 79.6 million acres to 95.4 million acres [5].
Higher commodity prices of corn have also encouraged farmers to change agronomic practices in the Midwest Corn Belt by adjusting crop rotations [4]. Corn-soybean/soybean-corn rotation has long been implemented by U.S. farmers in the Midwest Corn Belt [6,7]. Corn and soybean may also be rotated with other forage crops like alfalfa or oats in different parts of the US [6]. Crop rotation can have a number of significant benefits, including improved soil quality [6,8], increased soil carbon sequestration [8], fewer crop diseases and pests [9,10,11] and consequently higher agricultural productivity [6,8]. However, to produce more corn and capitalize on higher prices, farmers tend to shift to continuous corn planting [12]. Reduced soybean production would mean higher price for soybean, which also tripled in the past decade. Therefore, in response to higher market price of soybean and production shift to corn, some farmers expanded or shifted to soybean production instead of corn production [4].
The environmental and economic implications associated with changes in corn and soybean production have recently received increasing attention among scientists [4,13,14,15]. However, the magnitude of environmental impacts of corn and soybean expansions depends on the spatial and temporal patterns of crop distribution over time, as well as where these additional corn and soybean acres are located [16,17]. Since farmers react to price trends when making land use decisions, recent changes in the corn and soybean markets provide an excellent opportunity to examine agricultural expansion of corn and soybean and the impacts on other land uses, as well as changes in crop rotation patterns.
The U.S. Midwest Corn Belt (MWCB) is one of the nation’s most agriculture-intensive regions [18]. The total area dedicated to corn or soybean production in the MWCB more than tripled between 1980 and 2014, covering roughly 82% of the entire nine-state area in 2014 [5]. Increasing demand for food along with new demand for biofuels has caused and may continue to cause regional land use/cover and cropping pattern changes [15]. Despite the significance of land use/cover change in the MWCB, information on where, at what rates, and which land cover classes were affected by agricultural expansion is generally lacking at the regional scale [19]. Moreover, regional scale studies of agricultural land use/cover changes either utilize limited subsets of the Corn Belt (e.g., the Dakota Prairie Pothole Region in Johnston et al. [20]) or preceded the doubling of corn and soybeans prices between 2006 and 2013, with the exception of one [19]. Wright and Wimberly [19] focused on grassland conversion from 2006 to 2011, whereas the study presented here considers all major land uses that have been affected by agricultural expansion, not just grassland.
To summarize, the objectives of this study are to: (i) analyze short-term (2006–2013) trends of major crops (i.e., corn, soybeans, and wheat) using the USDA Cropland Data Layers (CDL); (ii) quantify recent land use/cover changes between 2006 and 2013 using the USDA CDL; (iii) determine where and at what rates corn and soybean expansion has occurred between 2006 and 2013 by analyzing crop-specific satellite imagery of the USDA CDL; and (iv) examine and measure biannual crop rotation sequences between corn and soybean during 2006–2013 from the USDA CDL.

2. Materials and Methods

2.1. Study Site

Covering roughly 1,525,393 km2, the U.S. MWCB is one of the nation’s most productive regions for farming and its agricultural productivity is critical to the U.S. economy [
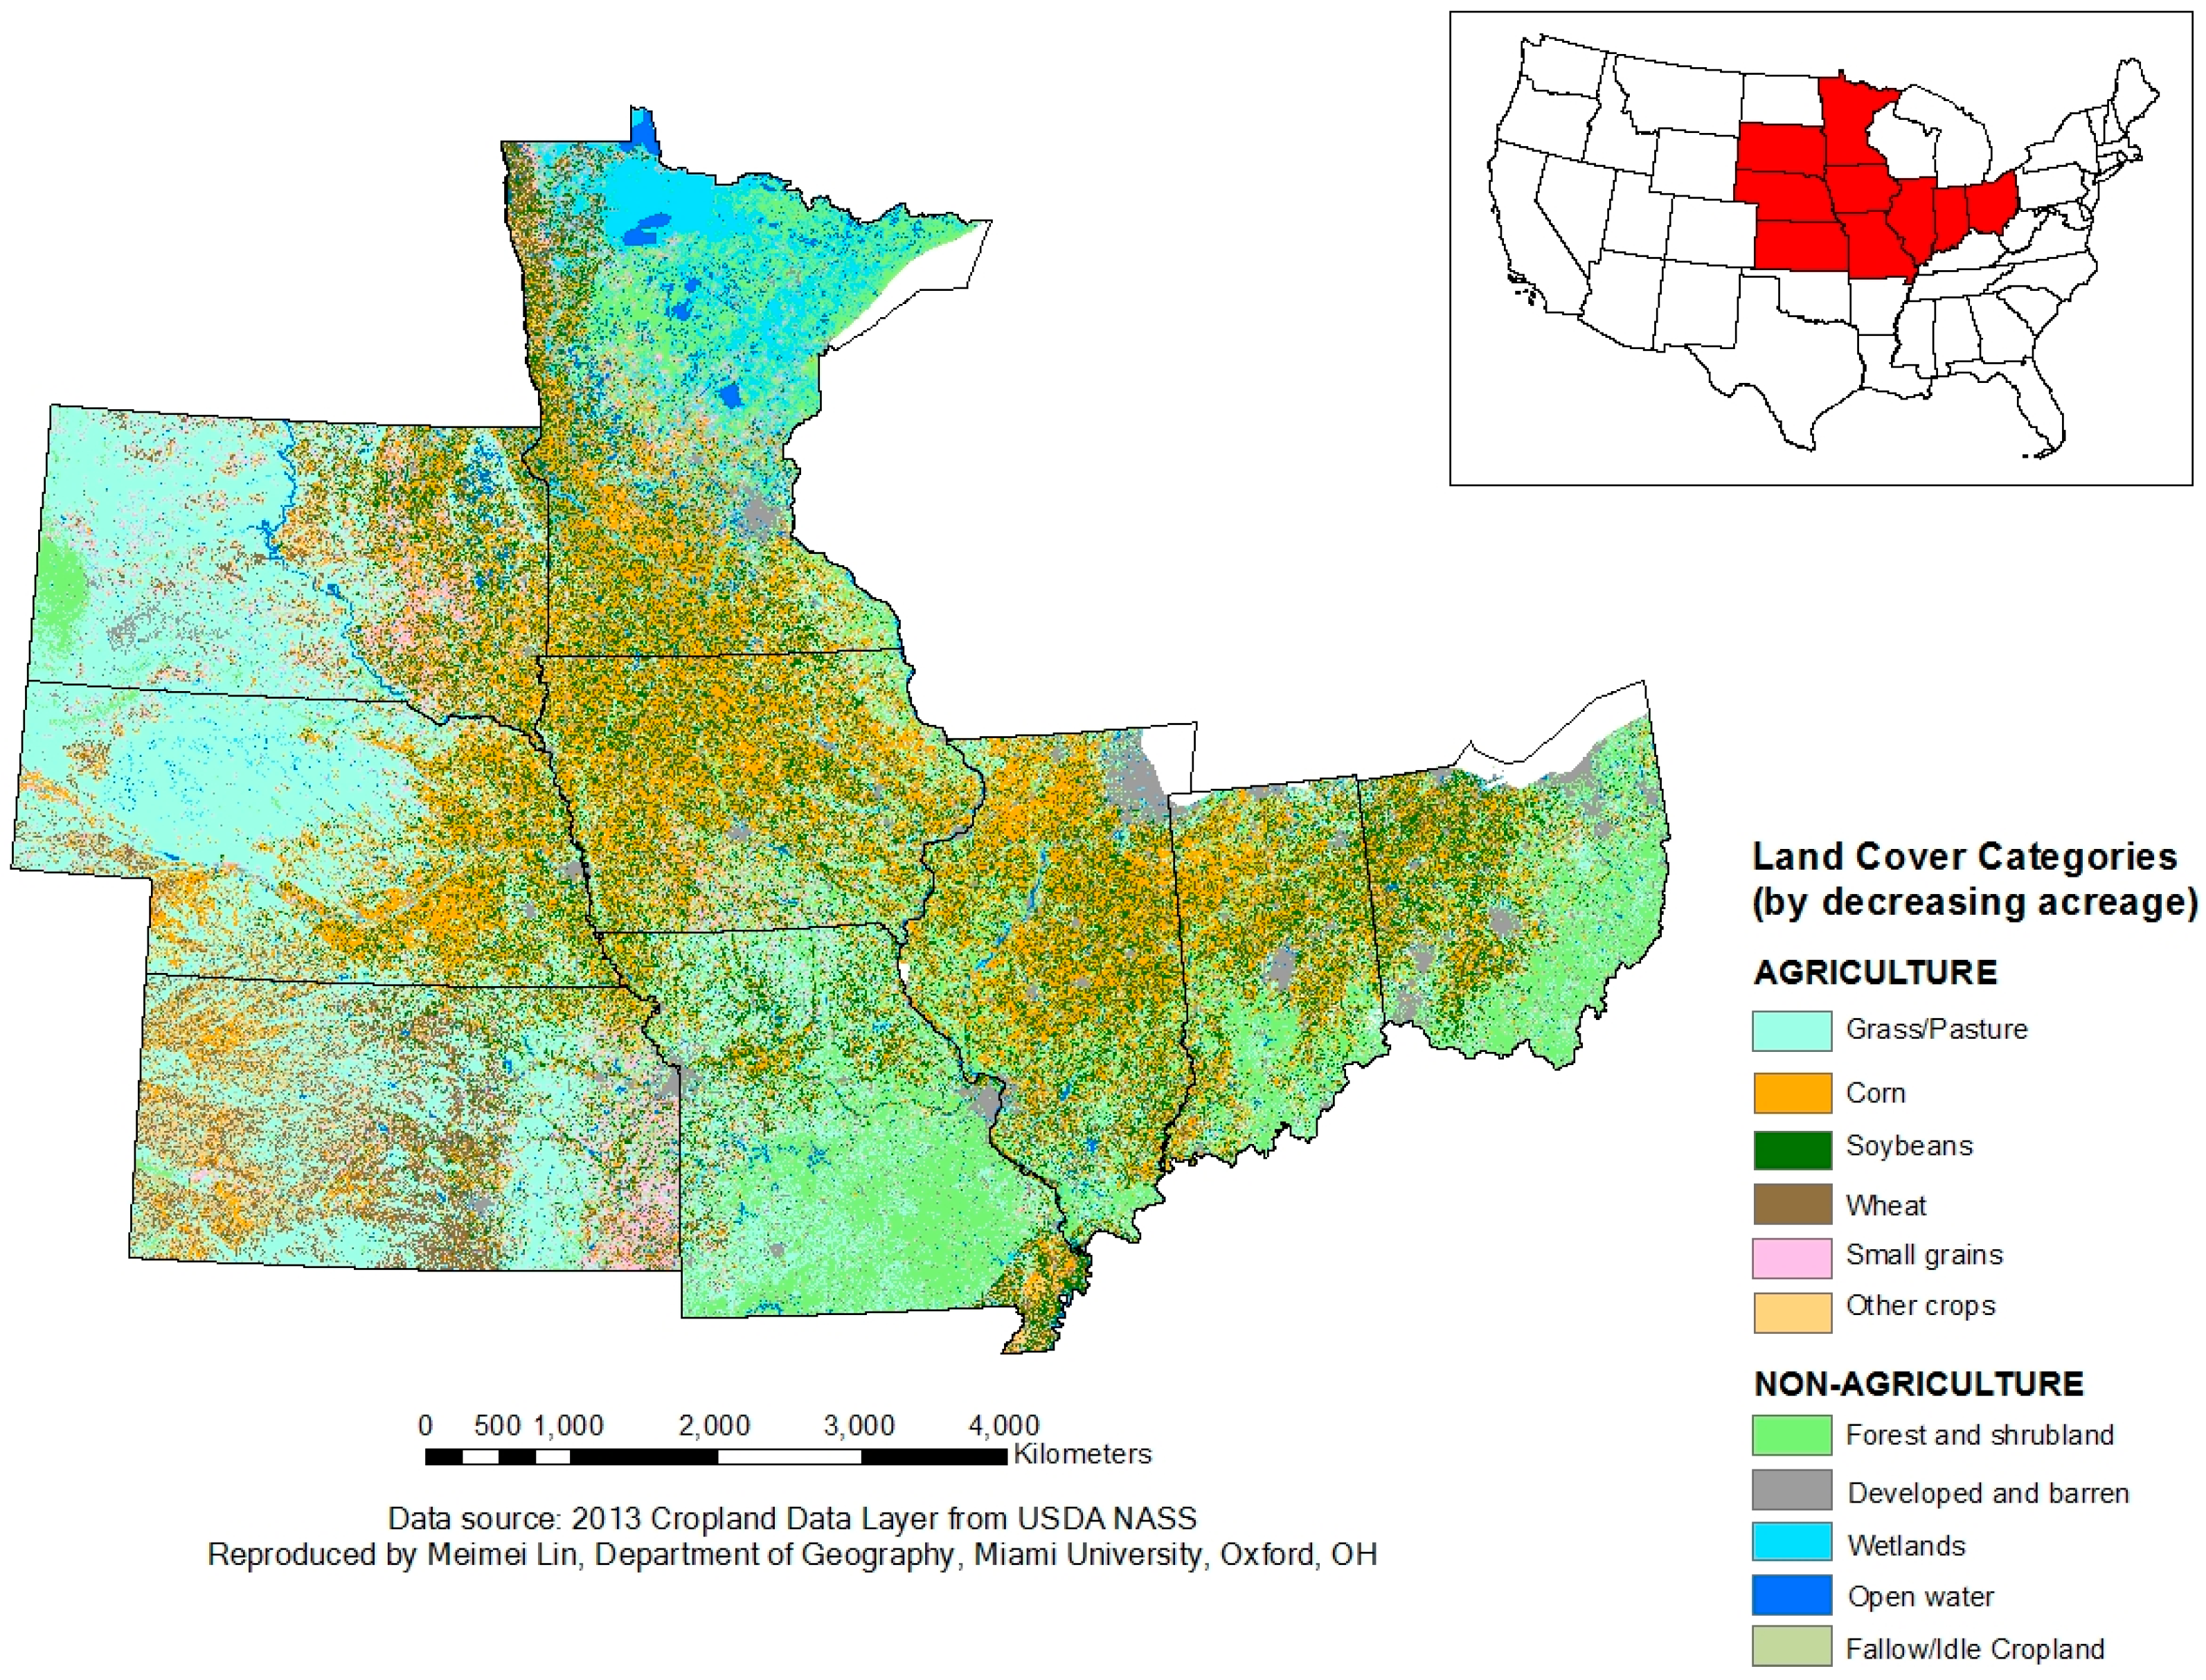
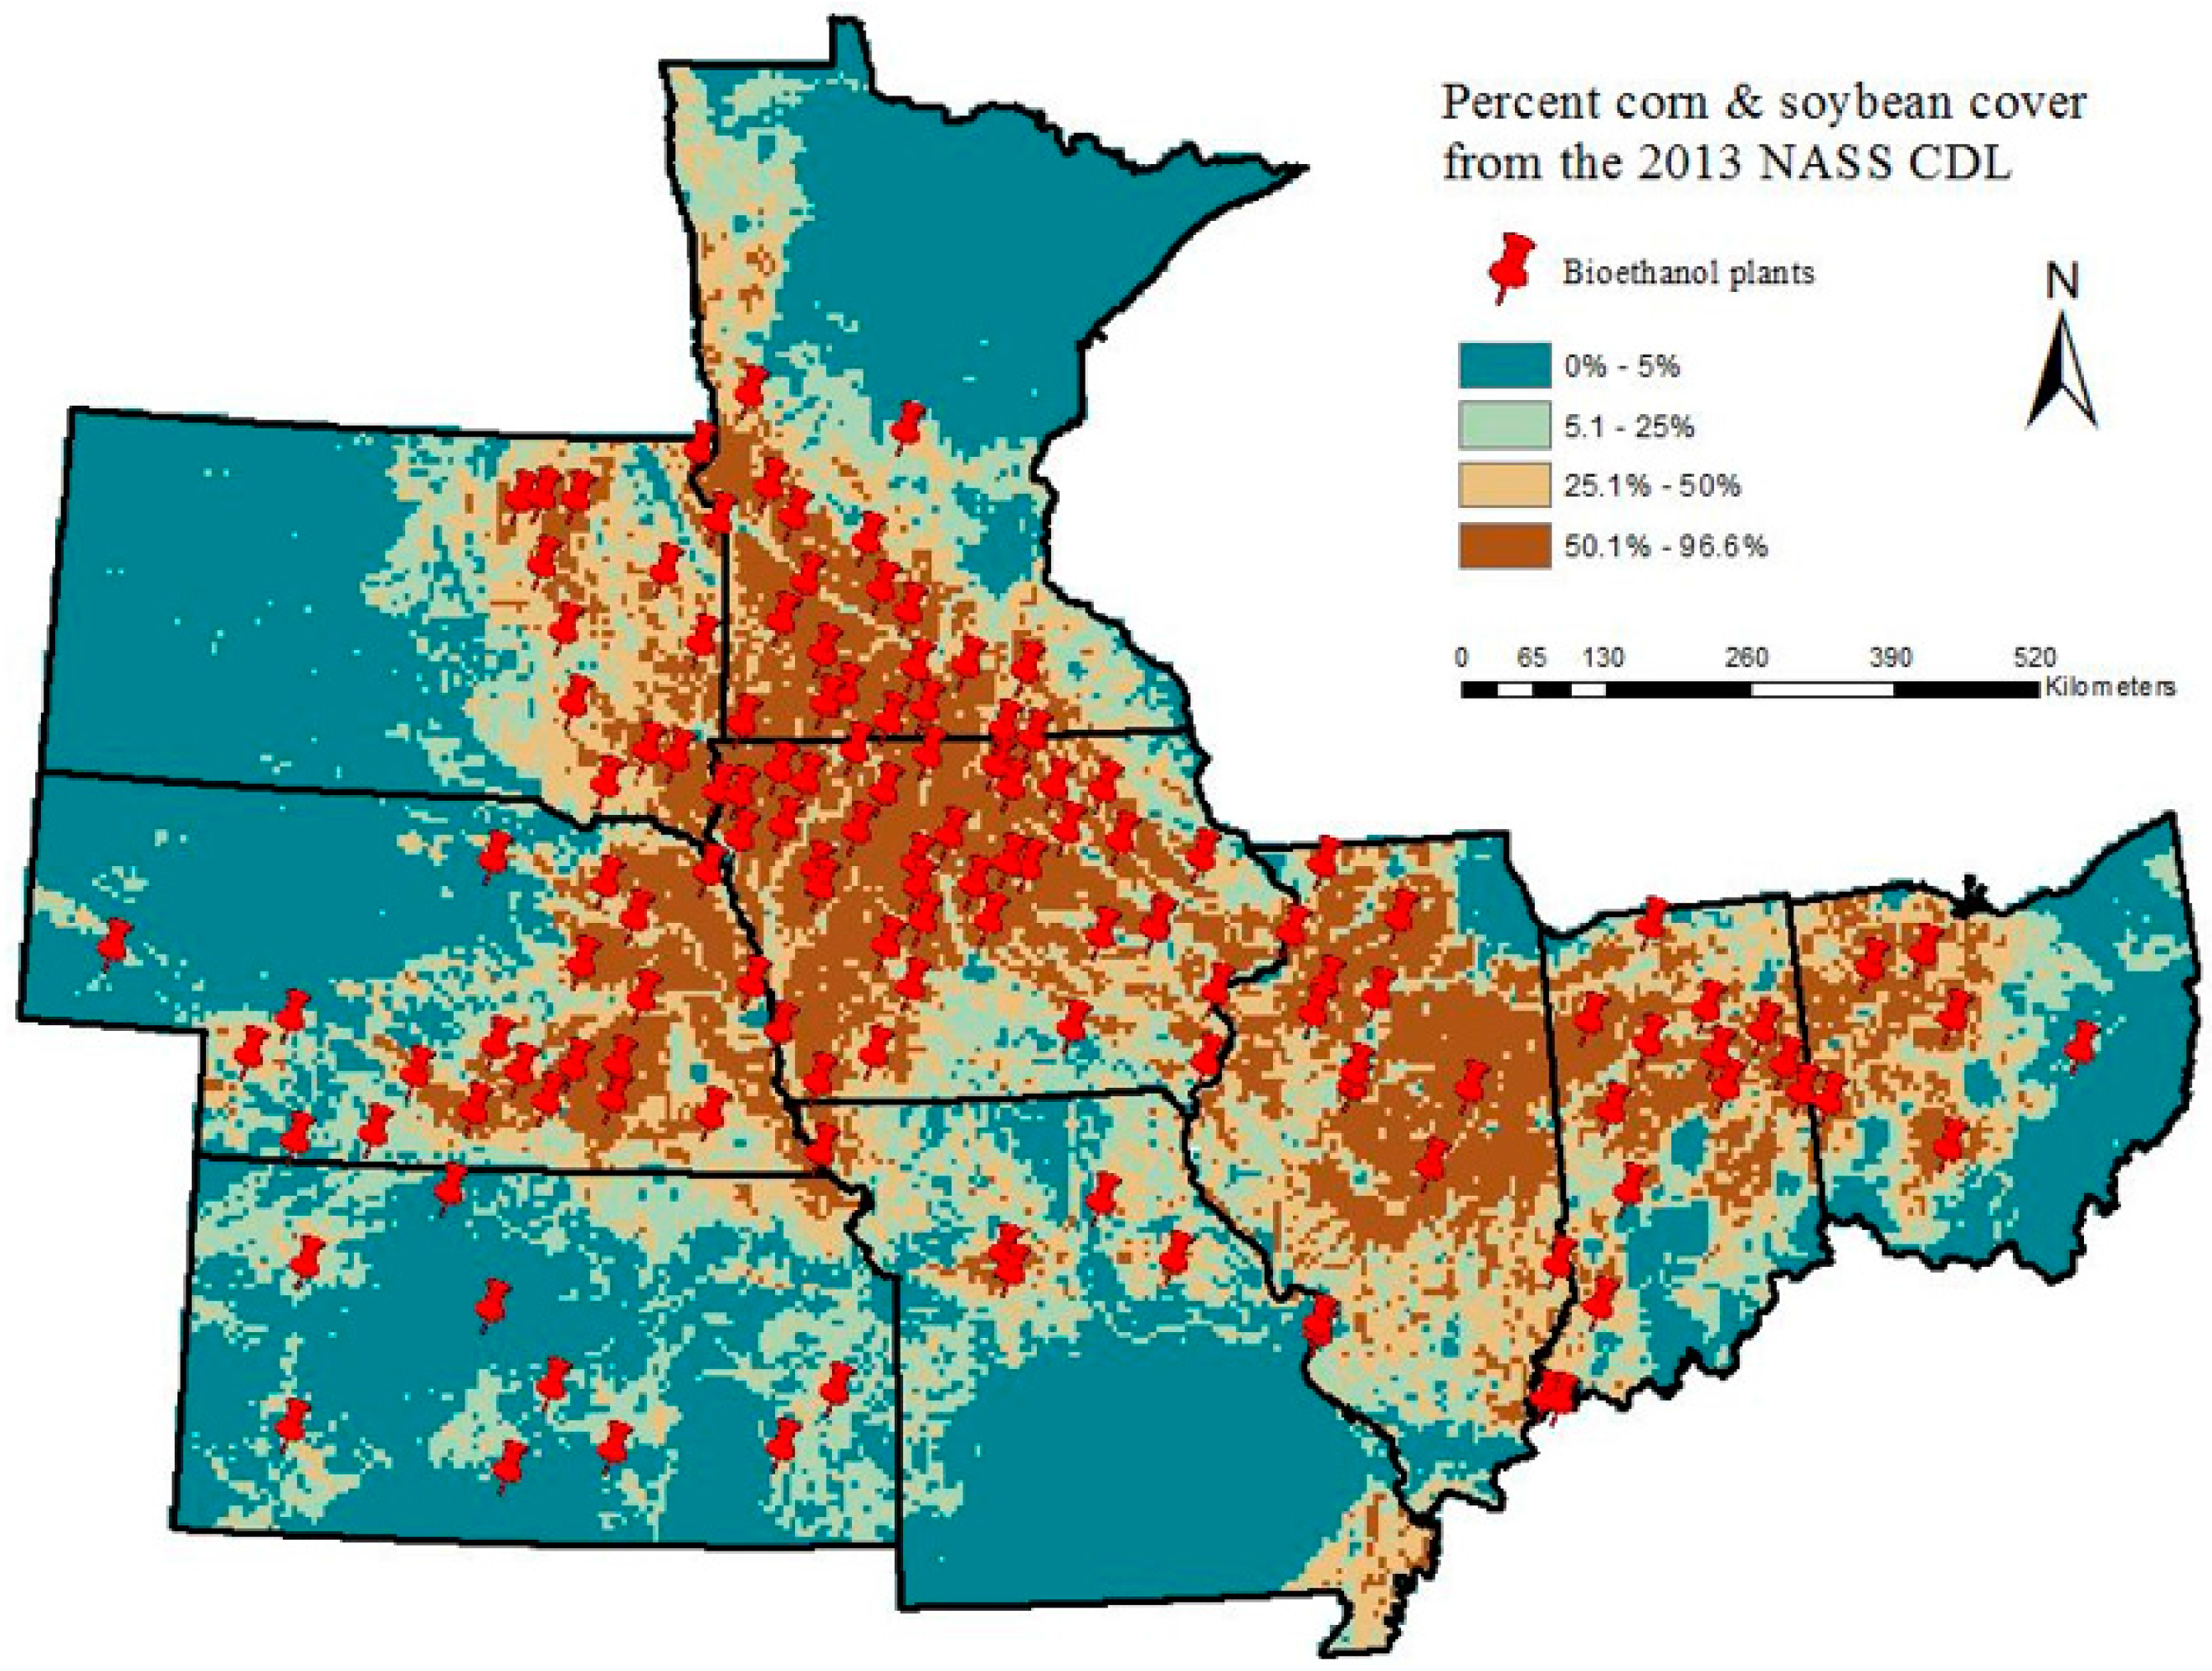
18]. Nine states in the U.S. MWCB were selected for this study: Illinois, Indiana, Iowa, Kansas, Minnesota, Missouri, Nebraska, Ohio, and South Dakota (Figure 1). These were chosen for analysis since they are the nine leading states in the United States in value of corn production [5]. In addition, this region is a major producer of soybean, another Midwest cash crop. Together they account for more than 76% of the corn production and 73% of the soybean production in 2013 [5].
The agricultural landscape of the MWCB was majorly shaped by changing agricultural practices in the region [21]. For example, in southwestern Ohio, corn and soybean production has increased rapidly, while land in wheat, oats, and pasture decreased during the 1960s and 1970s [21]. In the 1990s and 2000s, land in corn and soybeans even reached 90% of the total cropland area [22].

2.2. Data Sources

The main data source for this study is the USDA CDL. The CDL is a crop-specific land cover product produced annually from satellite imagery since 1997, with specific focus on the type and location of crops planted in the contiguous U.S. Detailed crop classification maps at both county and state level can be freely downloaded from the CropScape website [5]. More information about this project and metadata can be accessed through this website. The classification accuracy of major crop types can be as high as 90%. Therefore, the cropland data layers of nine MWCB states between 2006 and 2013 acquired from CropScape website were used directly in this study.

2.3. Data Processing

The CDL data for the years of 2006–2013 of all nine MWCB states were acquired in TIFF and IMG formats. The spatial resolutions for the years of 2006–2009 are 56 m, and 2010–2013 are 30 m. Initially, 2010–2013 data files were re-sampled into 56 m resolution to make all files the same spatial resolution. Then, all nine CDL files of the same year were mosaicked into a seamless annual data layer.
The classification scheme of CDL data files is relatively consistent from state to state or year to year, especially for CDL data files between 1997 and 2013. Equivalent classes that have different classification codes were combined (Table 1), producing a total of 11 land use classes: corn, soybeans, wheat, small grains, other crops, open water, developed and barren, forest and shrubland, grassland, wetlands, and fallow/idle cropland. The cloud was reclassified as NoData and eliminated from all years to make sure that land use change analysis was only performed on locations present all years. Therefore, a total of 0.068 million hectares were covered by clouds and reclassified as NoData. After dropping out these cloud areas, the study area of all nine states (including non-agricultures such as open water, forest and shrubland, and wetlands) totaled over 150 million hectares. All geospatial data layers were analyzed in ESRI ArcGIS 10.3 (ESRI, Redlands, CA, USA).

2.4. Data Analyses

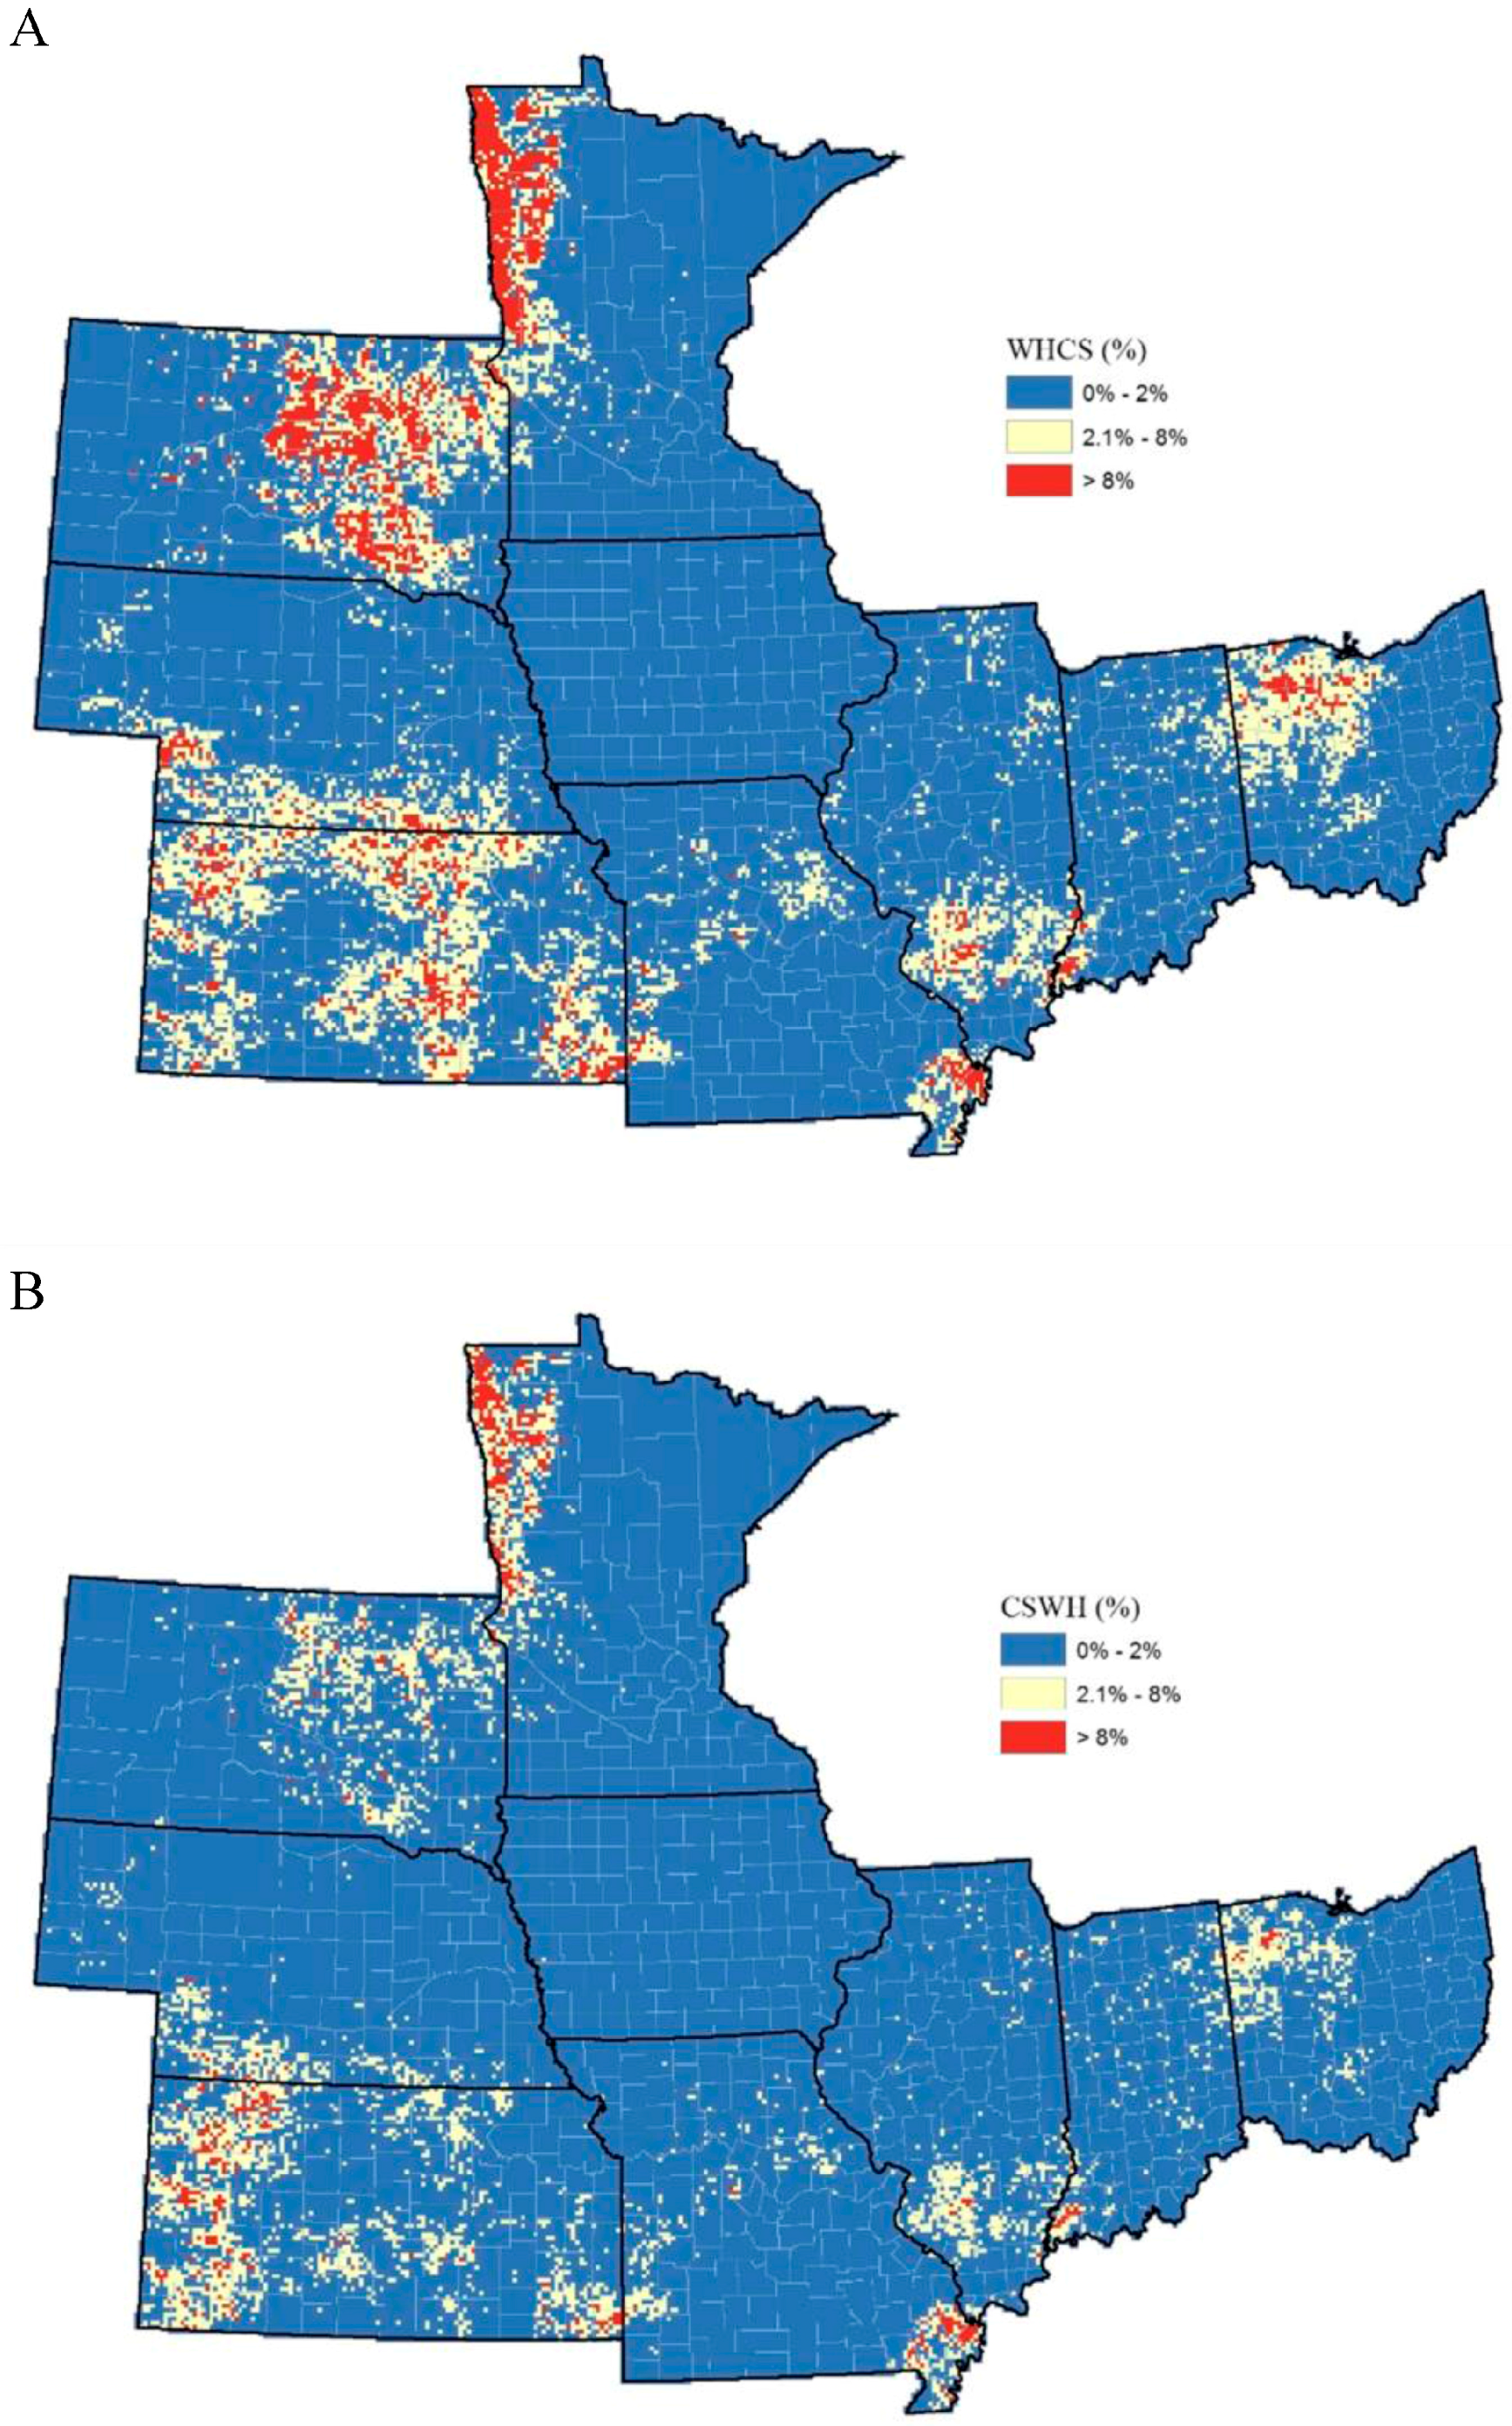
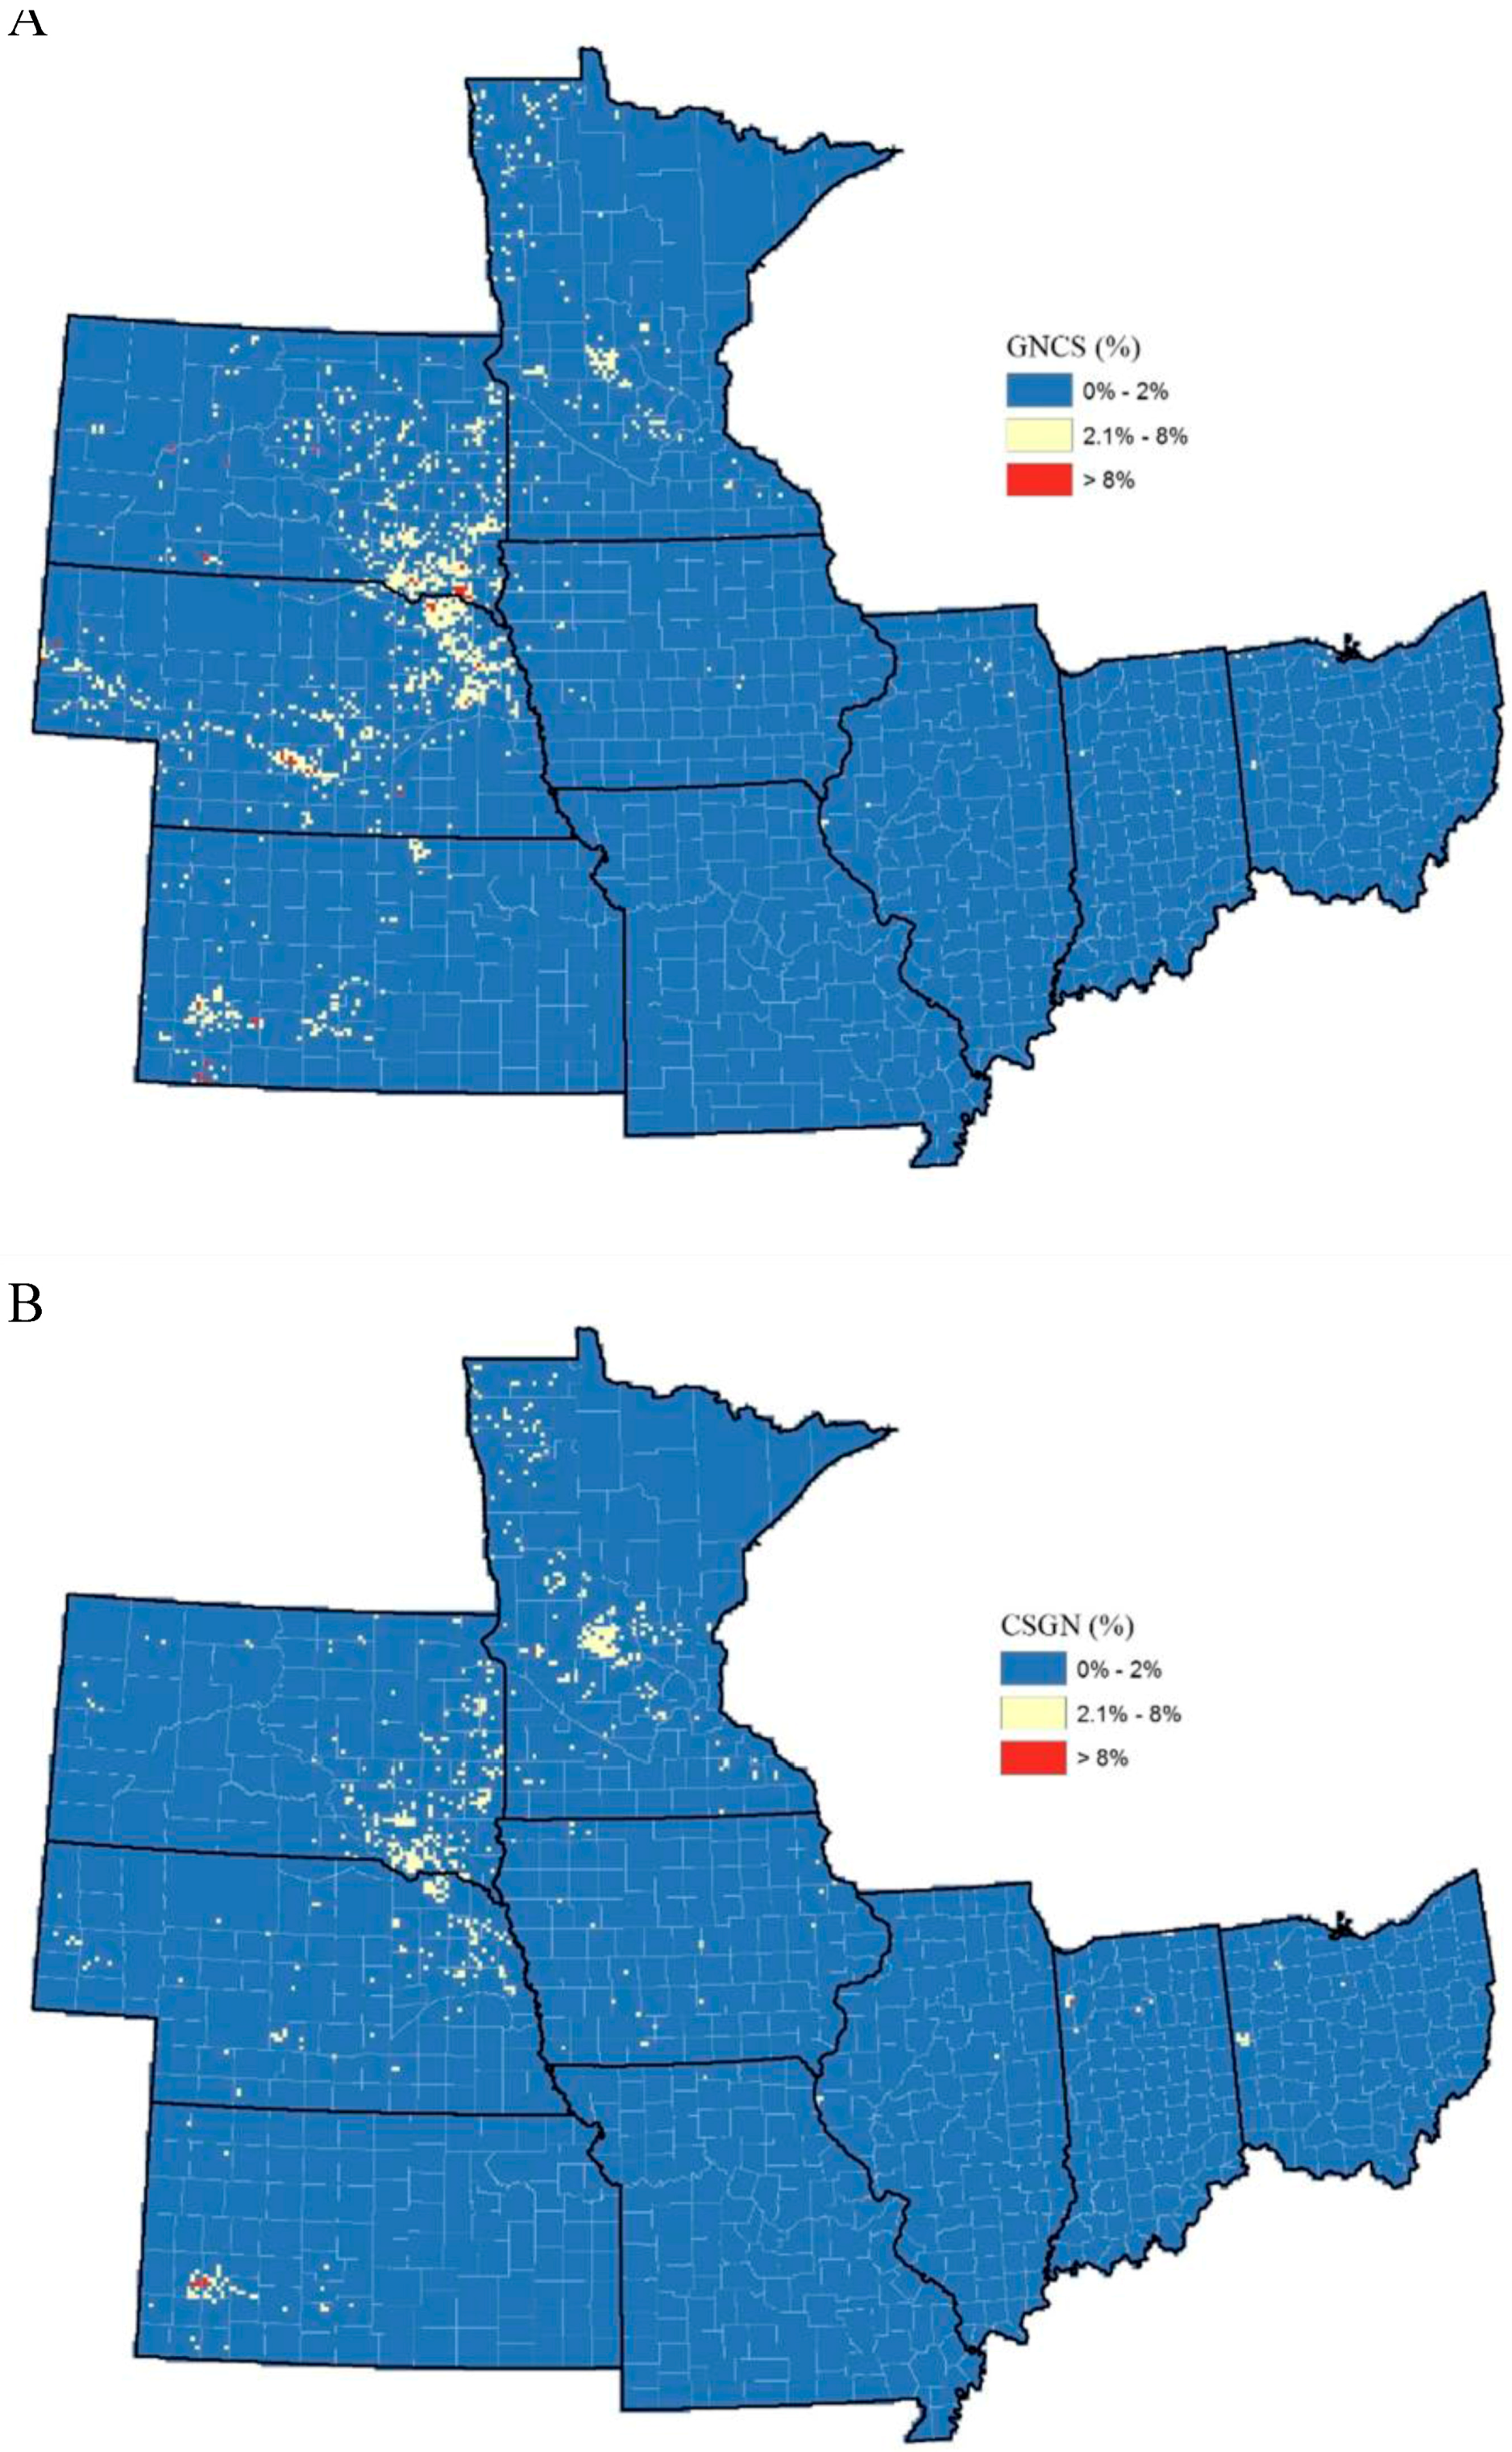
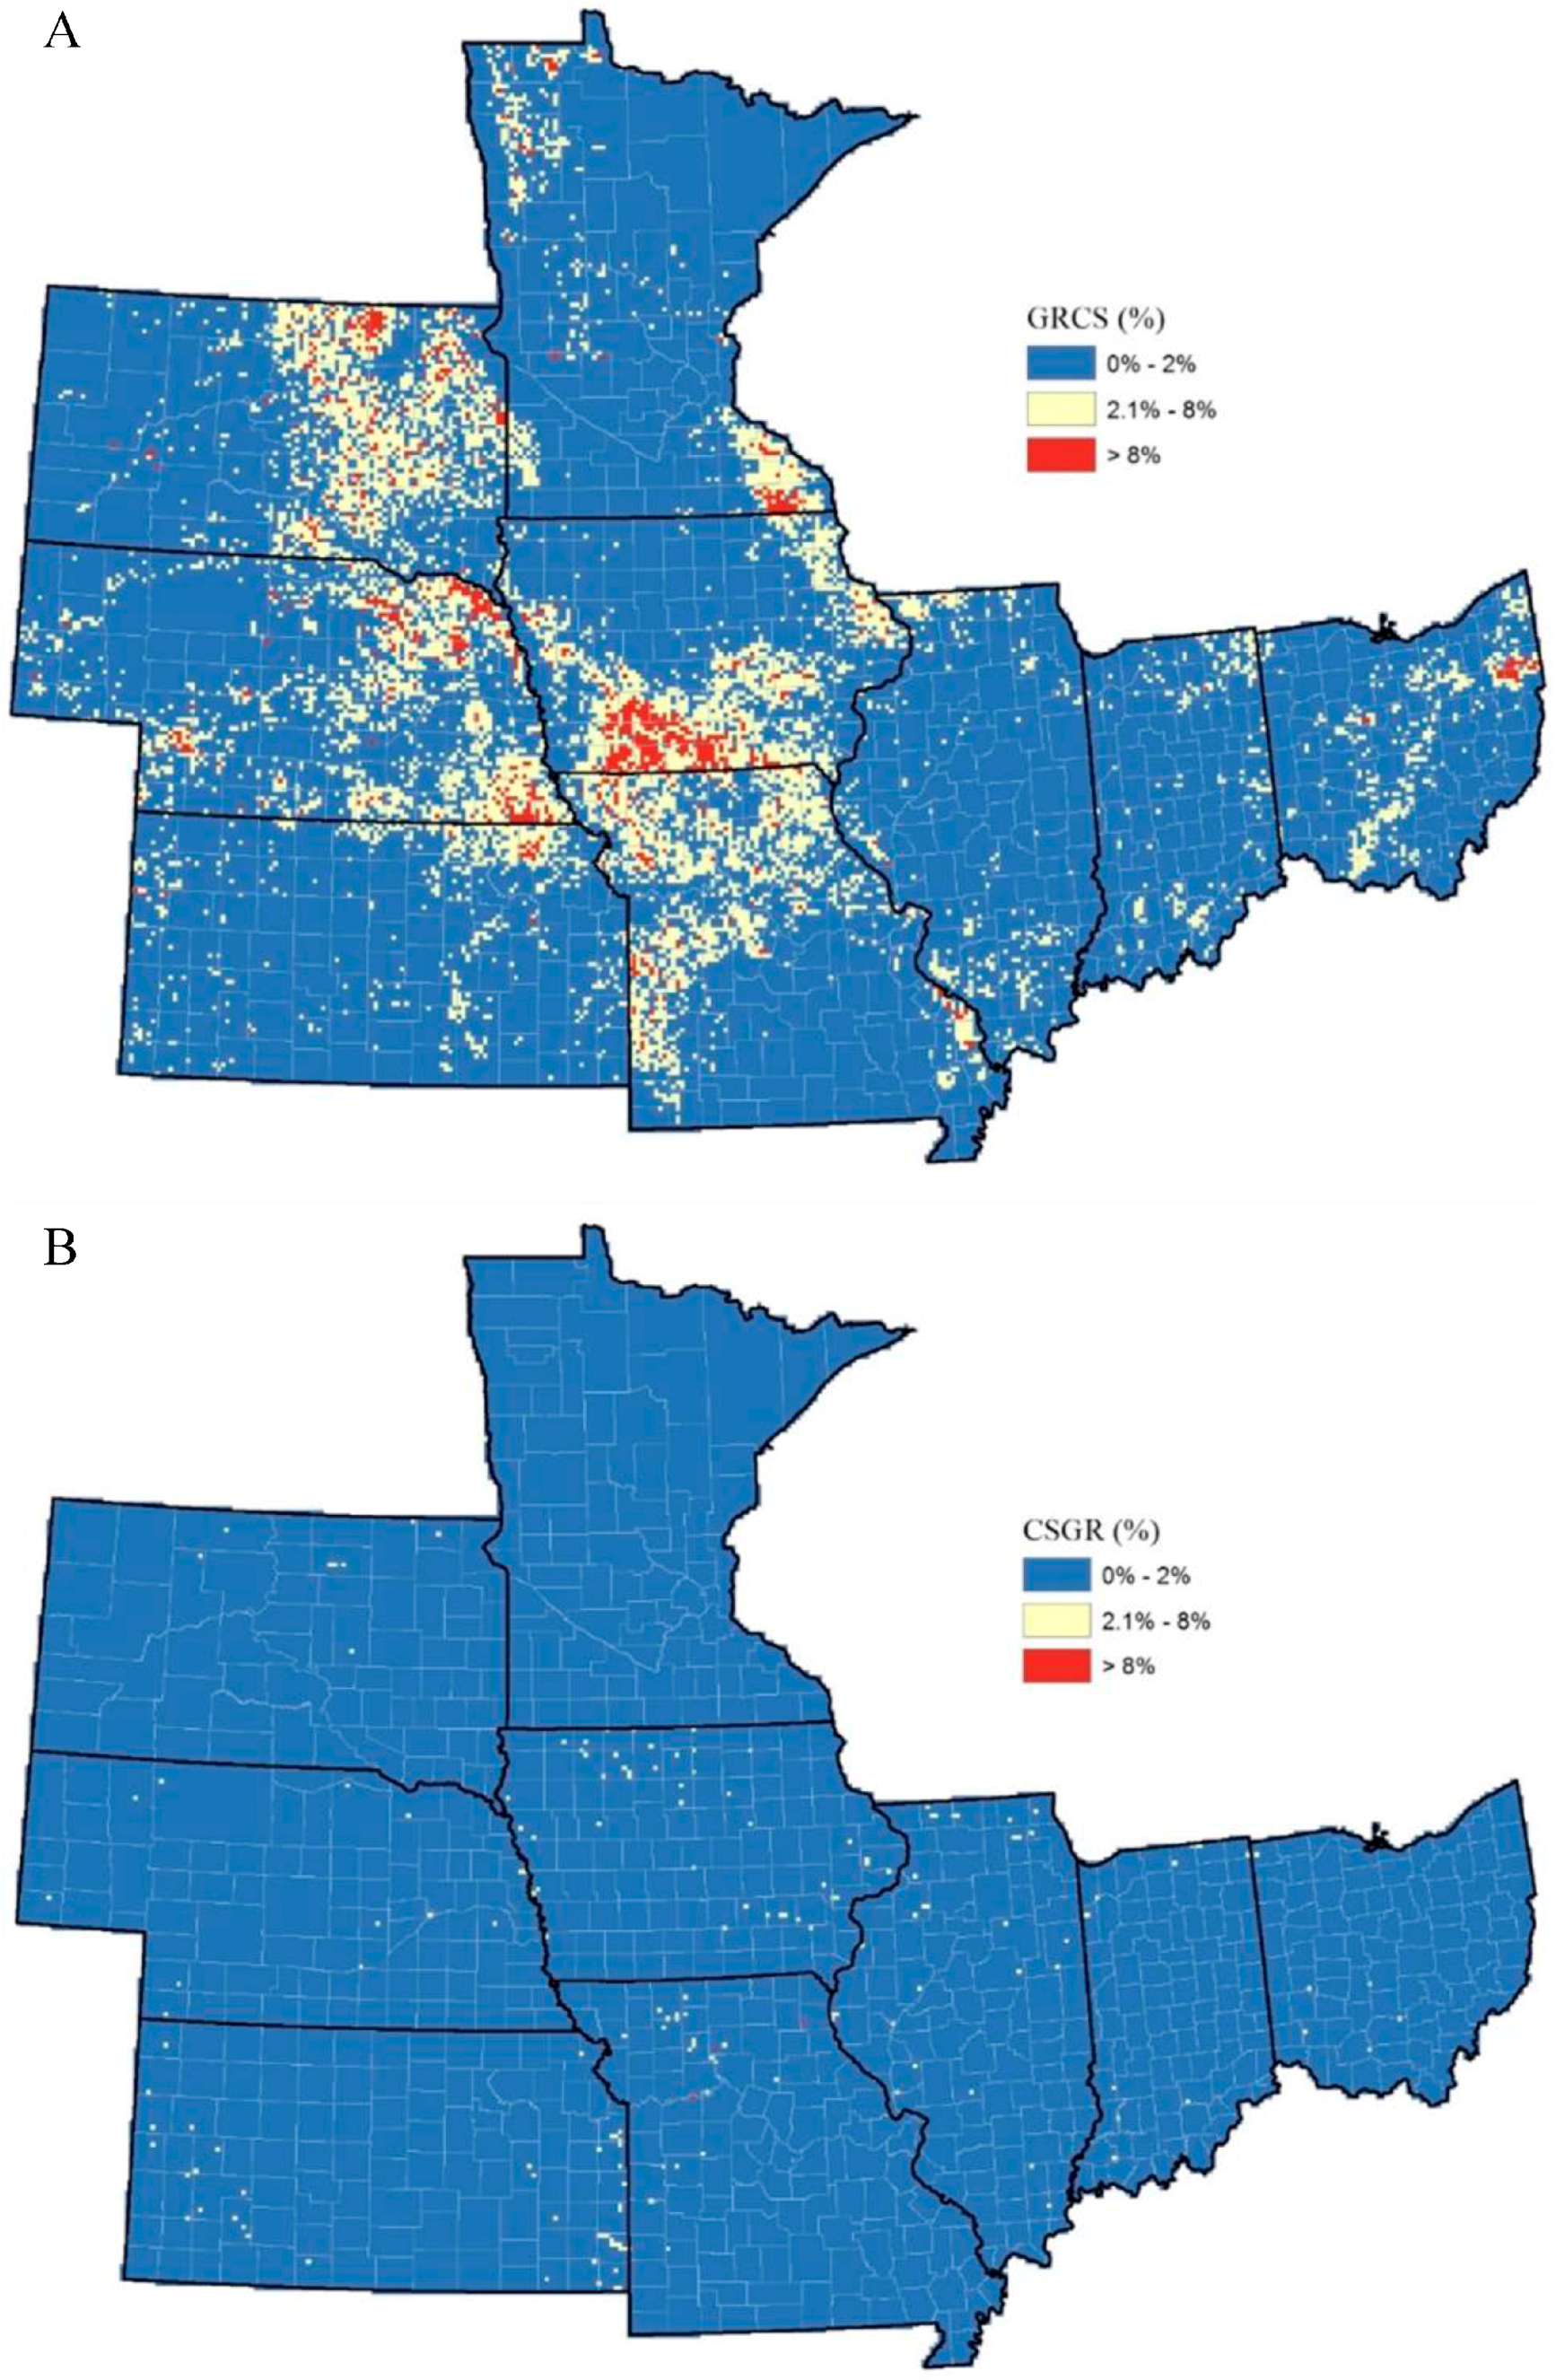
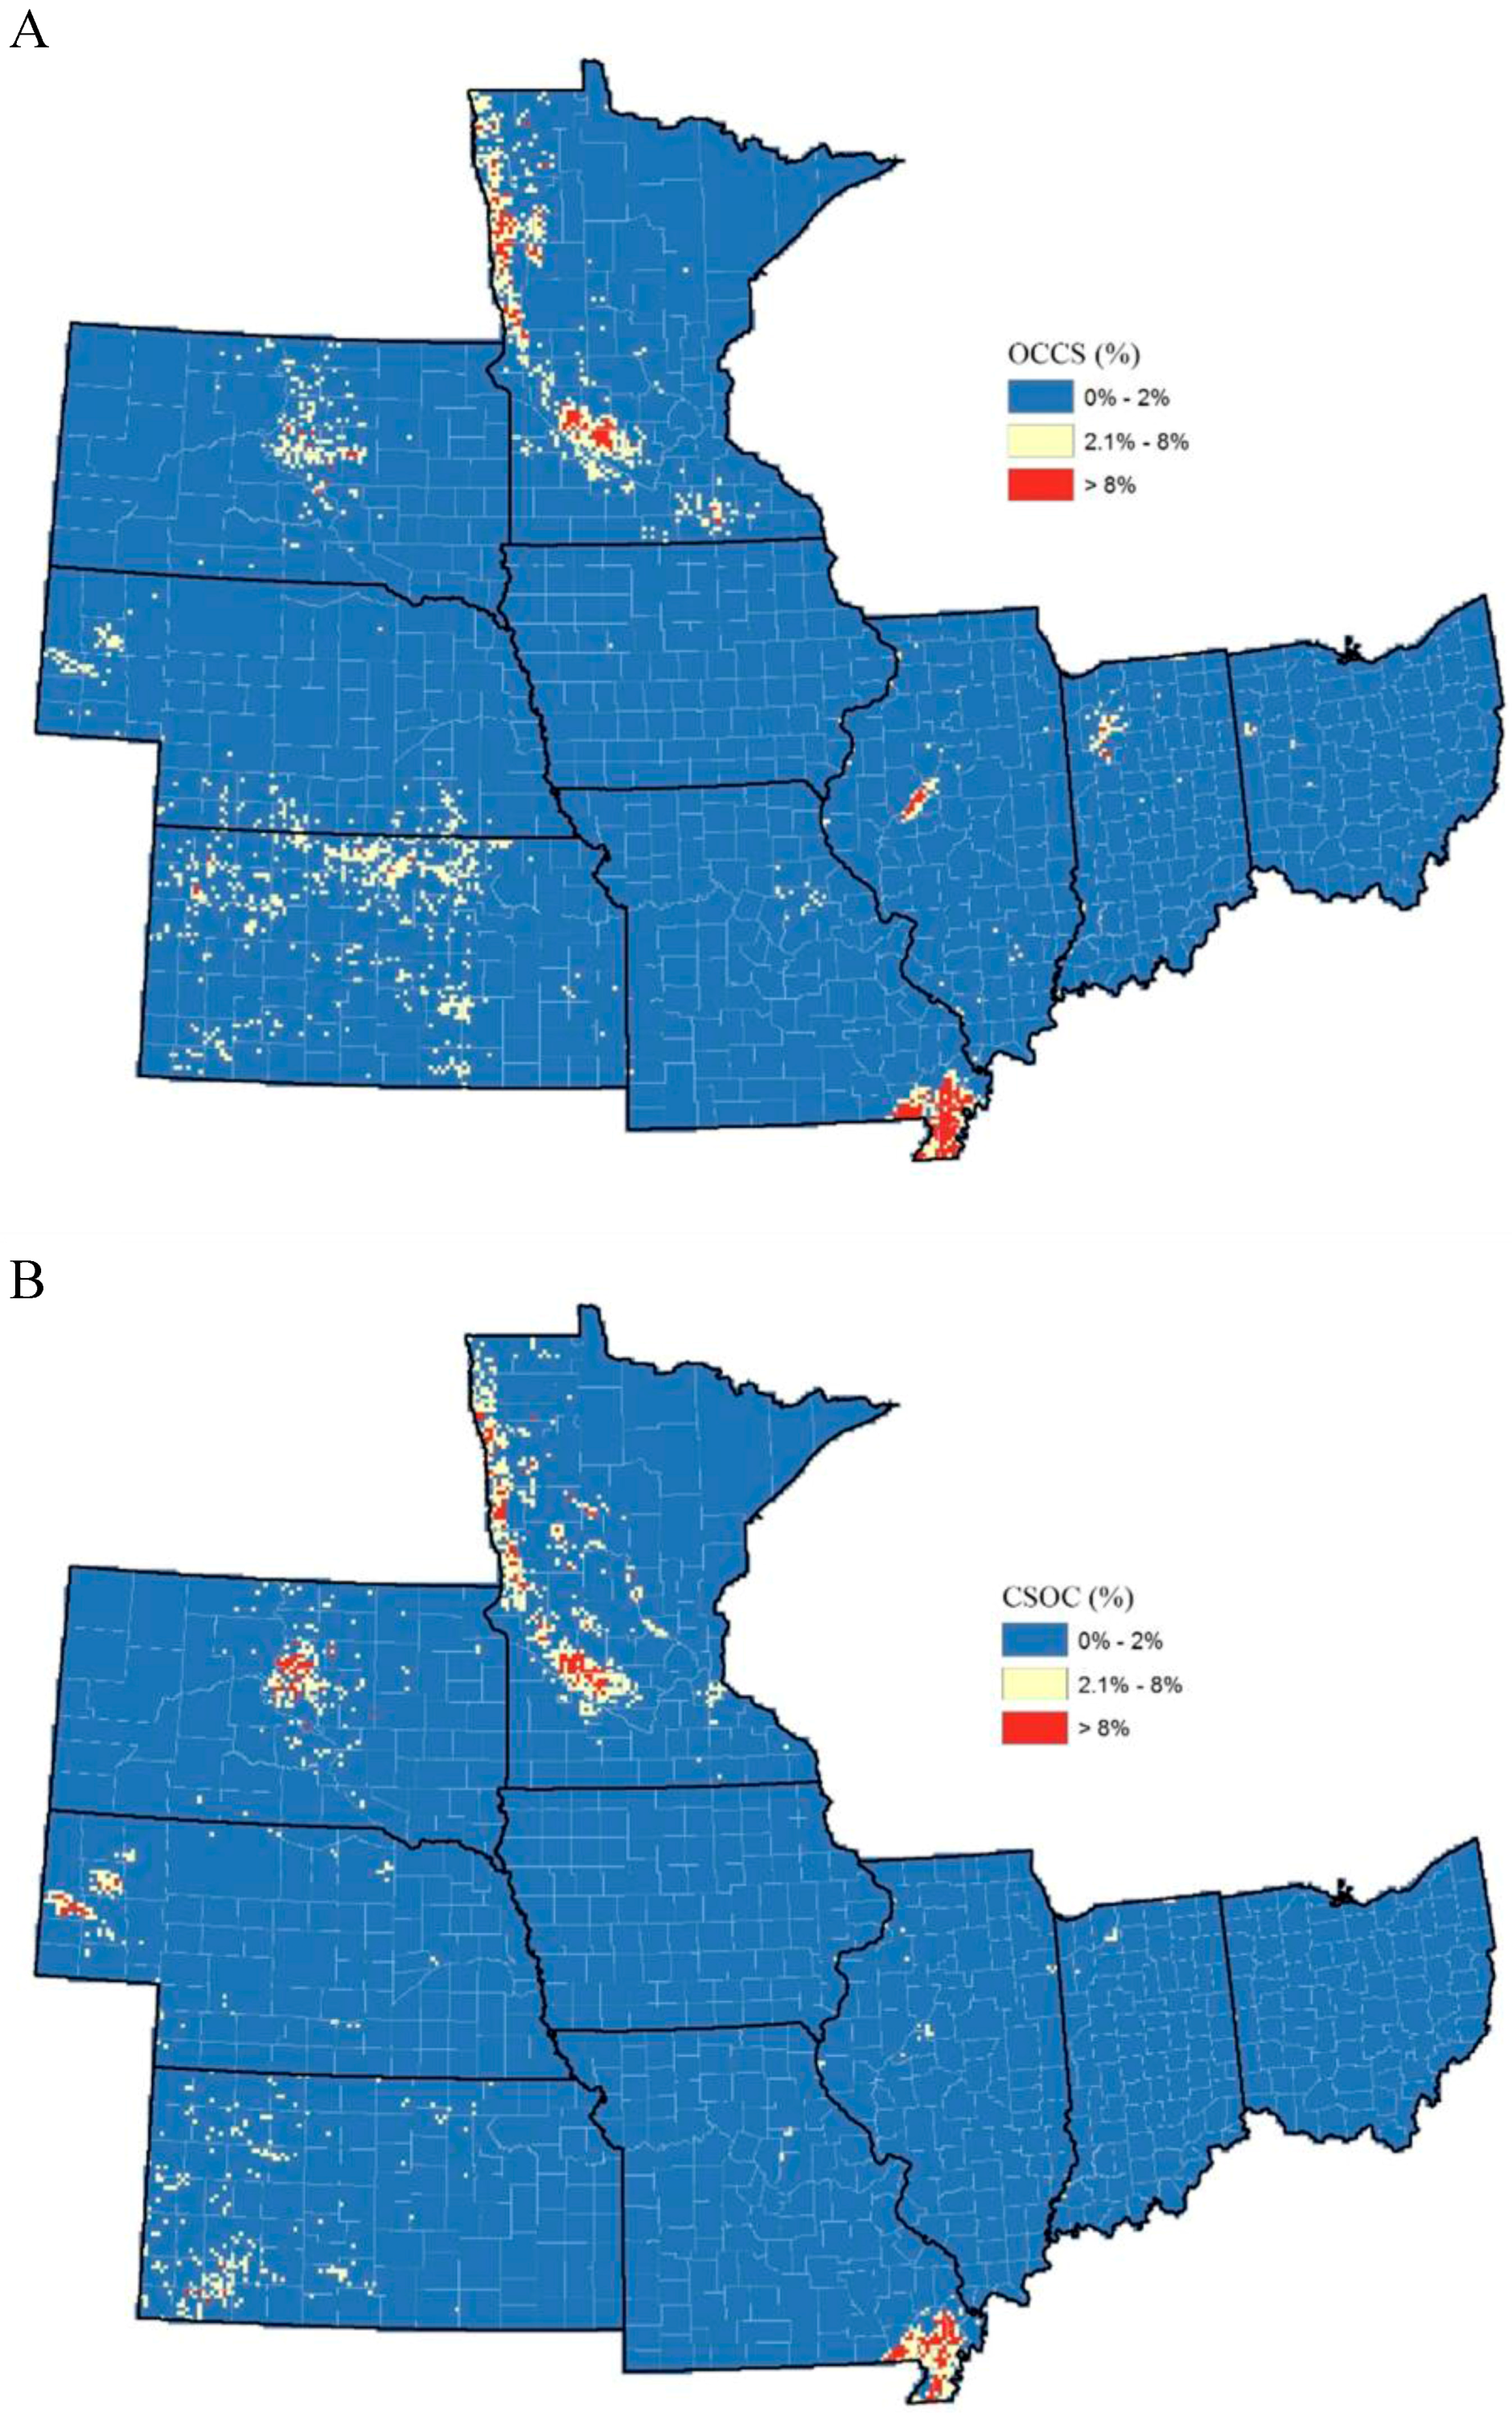
Major land cover conversions to corn/soybeans: Major land conversions to corn/soybeans included grassland, wheat, small grains, and other crops conversions. To determine grassland conversion in the MWCB over the period 2007 to 2012, we used the 2007 NASS CDL as a baseline map and compared it on a pixel-by-pixel base with the 2012 NASS CDL. Since we considered corn and soybeans as a general corn/soybeans class, corn and soybeans pixels in the 2012 NASS CDL were merged together. Then, the logical operator of subtraction was executed to identify pixels that changed from grassland in 2007 to corn/soybeans in 2012. All other land cover conversions to corn/soybeans were determined in the same way (as described in the last few sentences) as grassland conversion to corn/soybeans.
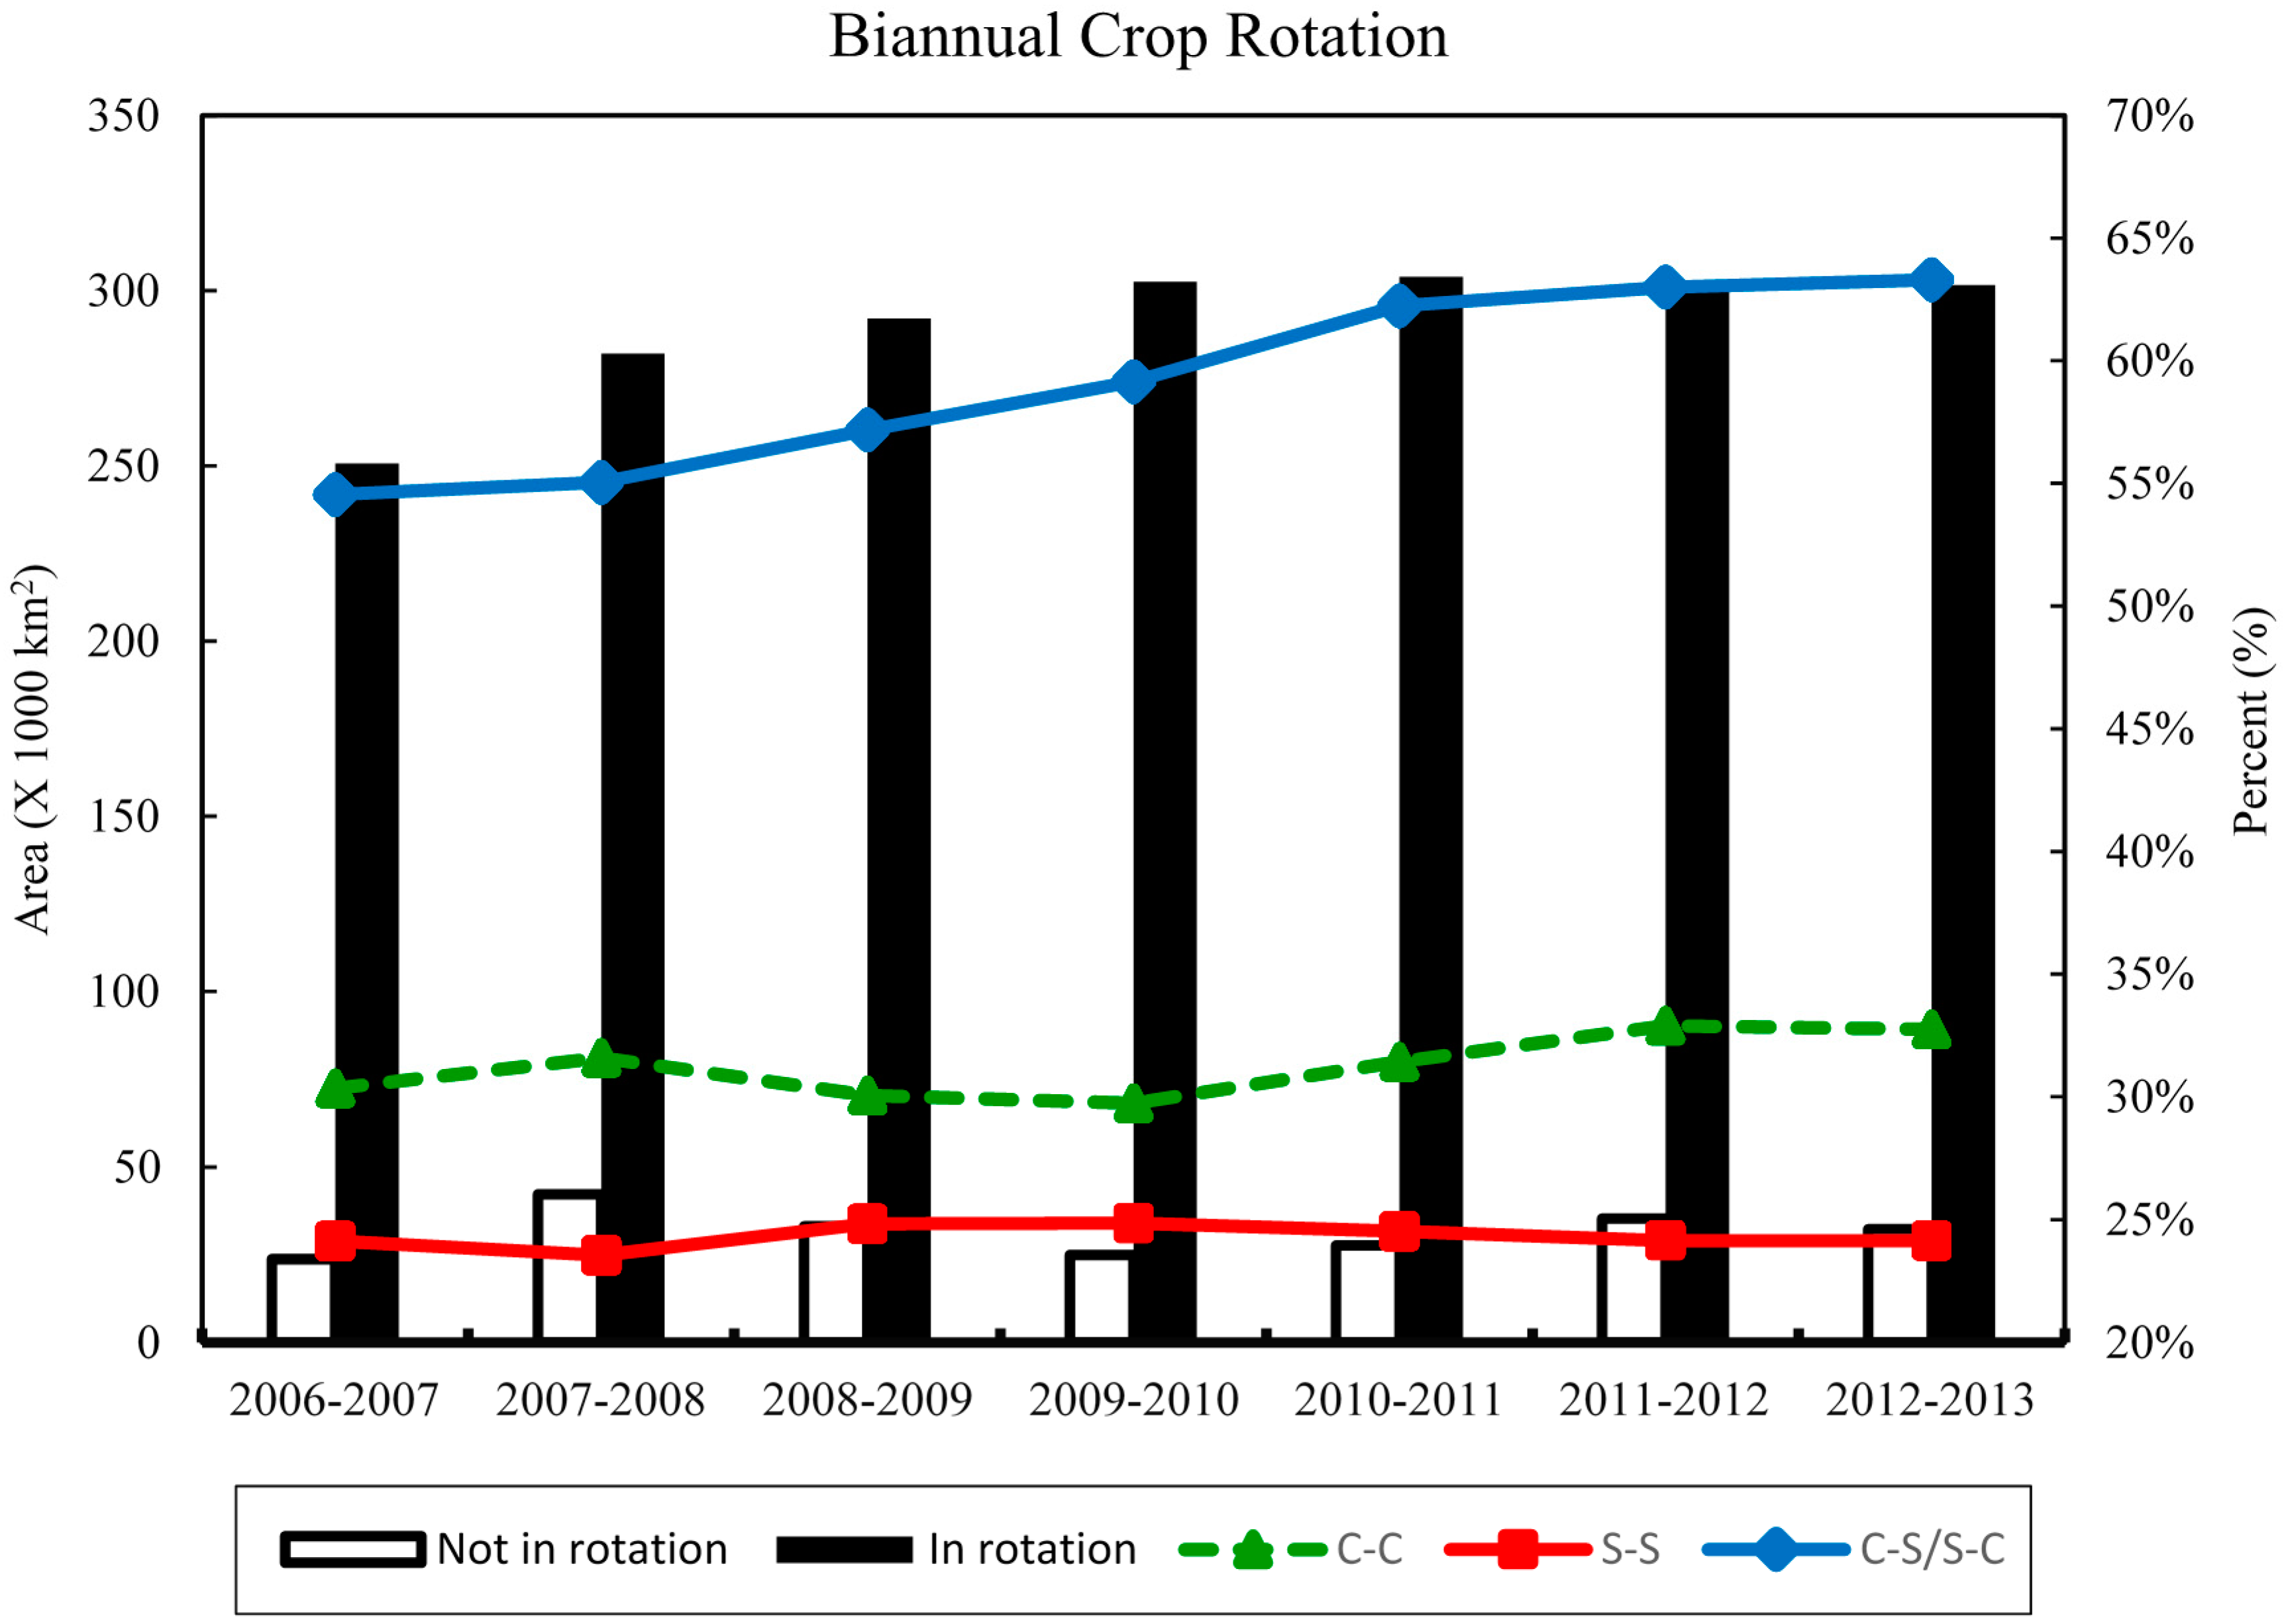
Crop rotation pattern investigation: Biannual sequences for corn and soybeans across the MWCB were analyzed using the CDL datasets: 2006–2007, 2007–2008, 2008–2009, 2009–2010, 2010–2011, 2011–2012, and 2012–2013. To determine biannual crop rotation pattern between corn and soybeans, each CDL data layer was reclassified. Possible rotation patterns for each biannual sequence include: corn-corn rotation (C-C), soybeans-soybeans rotation (S-S), corn-soybeans or soybeans-corn rotation (C-S/S-C). Specifically, the amount of area present in each unique rotation sequence, the amount of change between unique crop rotation sequences, as well as the frequency of biannual crop rotation patterns were determined for every location in the study area. The information generated allows for the identification of the most common crop rotation patterns in the region and associated temporal variations.

3. Results

3.1. Short-Term Trends of Major Crops (i.e., Corn, Soybeans, and Wheat) Based on State-Wide Annual CDL Data Layers, 2006–2013

Overall, area planted to corn and soybean showed continuous increase while area planted to wheat decreased between 2006 and 2013 (Figure 2). Corn area planted increased by 21% (roughly 46 km2) from 2006 to 2013. The area of corn rose profoundly between 2006 and 2007 while the area of soybeans dropped concomitantly (Figure 2). After the sharp decline in 2007, area planted to soybeans showed a gradual increase with a mean of 202,726 km2. Note that corn area was always larger than soybeans area during 2006–2013, with a peak corn to soybeans ratio of 1.52:1 in 2007. There was a significant decline in wheat area over eight years of data. Specifically, wheat area decreased abruptly in 2007. In 2008, wheat area climbed up to where it was in 2006. However, between 2008 and 2010, there were another two successive declines in wheat area. Overall, area planted to wheat experienced significant decrease with low and high outliers in 2010 and 2008, respectively.

3.2. Land Cover Diversity, Distribution, and Changes Based on Annual CDL Data Layers, 2006–2013

Land cover in the MWCB consists of crop and non-crop cover types. Crop cover types include corn, soybeans, wheat, small grains, and other crops, which encompassed a total of 77 CDL land cover classes in the study area during 2006–2013. Non-crop cover types include grassland, forest and shrubland, wetlands and water, and developed land (Table 1).
Corn/soybeans area decreased by 26,375 km2 from 2006 to 2007, which was due to an abrupt decline of 48,438 km2 in soybeans acres in 2007 (Figure 3). Note that all crop cover types were merged in a generalized summed-crop class; all non-crop cover types except grass/pasture were combined in a general non-agriculture class. Even though there was a concomitant rise of 22,062 km2 in corn area in 2007, the gain was not enough to offset the loss of soybeans. During 2007–2013, the amount of land cultivated for corn and soybeans increased from 406,842 km2 to 473,820 km2. The average rate of increase was eight times greater for 2009–2010 (+32,707 km2·year−1) than for 2011–2012 (4036 km2·year−1). Percent of land planted to corn/soybeans increased from 27% of the study area in 2007 to 32% of the study area in 2012, with an increase of 73,663 km2.
Temporal patterns of summed crop tended to resemble that of corn/soybeans, with a sudden drop in 2007 and a monotonic increase from 2007 to 2013. Trends of summed crop and non-agriculture area somewhat mirrored each other: whenever there was a decline in the area of summed crop, there was a corresponding increase in non-agriculture area, and vice versa. Trends of grassland area tended to mirror that of corn/soybeans over eight-year period. After a sudden rise in 2007, grassland started to fall monotonically over the years spanning 2007–2013 (Figure 3). However, the average rate of decrease for 2010–2011 was 57,533 km2·year−1, which was five times greater than that for the time period of 2007–2010 (11,521 km2·year−1). The total grassland area decreased from 35% of the region in 2007 to 28% in 2013. It should be noted that the size of grassland was larger than the size of corn/soybeans between 2006 and 2010, but then fell under corn/soybeans between 2011 and 2013, indicating an expansion of corn/soybeans planting (Figure 3).
The area of forest and shrubland increased slightly between 2006 and 2007, stayed relatively stable at an average of 257,011 km2 from 2007 to 2010, experienced a decline of 16,358 km2 from 2010 to 2011, and then remained constantly at an average of 237,011 km2 from 2011 to 2013 (Figure 3). Wetlands and open water were also combined in a general wetlands/water class (Figure 3). The area of wetlands/water was relatively constant around 73,307 km2 between 2006 and 2010. Contrary to expectations, wetlands/water area increased between 2010 and 2011, and stayed roughly stable again from 2011 to 2013 (Figure 3).
In terms of land use distribution in 2013, corn and soybeans concentrated dominantly in the state of Iowa, Illinois, Indiana, southwestern Minnesota, western Ohio, eastern Nebraska, and eastern South Dakota (Figure 4). However, wheat was mostly planted in the state of Kansas (Figure 5). There was also sparse wheat distribution in the center of South Dakota and northwestern corner of Minnesota. The total area of wheat was profoundly small (Figure 5), covering only 4.41% of the study area (Table 1). The same can be said of small grains, which accounted for only 3.87% of the MWCB in 2013. Small grains majorly located in the eastern portion of Kansas and South Dakota (Figure 6). To summarize, wheat and small grains tended to concentrate on the outskirts of the core corn/soybeans region within the study area.

3.3. Agricultural Expansion in the MWCB

Agricultural expansion was the most intense between 2007 and 2012 as the area of corn/soybeans increased by 18% (~73,660 km2) within five years (Figure 3). The annual self-replacement rates of corn/soybeans increased from 0.79 between 2006 and 2007 to an average of 0.87 during 2007–2012. Over the same time period, grassland area decreased by 16% (~85,388 km2). The major land uses that transitioned into corn/soybeans were grassland, wheat, other crops, and small grains (by decreasing acreage).

3.3.1. Grassland Conversion to Corn/Soybeans from 2007 to 2012

Grassland conversion to corn/soybeans between 2007 and 2012 occurred predominantly in four states, Nebraska, Iowa, South Dakota, and Missouri. Here, corn and soybeans production has expanded westward into the Western Corn Belt Plains eco-region, where its mean annual evapotranspiration exceeds mean annual precipitation [19]. In Iowa, corn and soybeans cropping has expanded outside of the core corn/soybeans area and into southern Iowa. However, in Missouri, grassland conversion majorly located in northern Missouri (Figure 7A). The loss of grassland to cropland was greatest in the state of Nebraska, accounting for 20% of the total grassland loss from 2007 to 2012 (Table 2). Iowa ranks second and lost 775,000 acres (~19% of the total grassland loss) to grassland conversion.
On the other hand, change from corn/soybeans to grassland concentrated mainly in Kansas and Iowa, and at much lower rates than grassland conversion (Figure 7B). Both states lost about 55,000 acres of cropland to grassland during 2007–2012. To conclude, there was a net decline in grassland area in the MWCB totaling nearly 15,640 km2 (>3.9 million acres; Table 2). Grassland net loss was concentrated along the western margin of the Corn Belt—Nebraska, Iowa, and South Dakota.
We also examined the relationship between the amount of land in the Conservation Reserve Program (CRP) and grassland loss. The amount of land enrolled in CRP was about 43,532 km2 (~10.75 million acres), which was down by 19 percent (~2.56 million acres) during 2007–2012 in our study region (Figure 8). Over the same time period, there was a significant conversion (~3.9 million acres) from grassland to corn/soybean. The total loss of CRP between 2007 and 2012 (~2.56 million acres) was lower than net grassland-to-corn/soybeans conversion.

3.3.2. Wheat Conversion to Corn/Soybeans from 2007 to 2012

The proportion of wheat transitioning to corn/soybeans was 0.30 between 2006 and 2007. However, during 2007–2012, conversion rate of wheat to corn/soybeans increased to an average of 0.37, which suggested that wheat was more likely to change to corn/soybeans in this time period. Wheat conversion to corn/soybeans was concentrated in three states: Kansas, South Dakota, and Minnesota. In Kansas, the change to corn/soybeans was more widespread across the whole state while conversion in South Dakota occurred mainly in eastern portion of the state (Figure 9A). Minnesota featured a high proportion of wheat conversion along its western border (Figure 9A). There were also some wheat conversions in the states of Nebraska, Illinois, and Ohio, accounting for much lower proportion of the total wheat conversion to corn/soybeans (Figure 9A).
Land area that underwent conversion from corn/soybeans to wheat occurred in the exact same states as conversion from wheat to corn/soybeans and surrounded the core wheat conversion region (Figure 9B). However, transfers of corn/soybeans to wheat were much smaller than that of wheat to corn/soybeans, resulting in a net loss of wheat (~2.53 million acres) during 2007–2012 (Table 3). Loss of wheat area between 2007 and 2012 was greatest in South Dakota, which contributed to 36% of the total wheat loss over the MWCB (Table 3).

3.3.3. Other Crops Conversion to Corn/Soybeans from 2007 to 2012

Other crops-to-corn/soybeans transition rates averaged 0.32 between 2007 and 2012. However, conversion of other crops to corn/soybeans was relatively minor when compared with grassland and wheat conversion to corn/soybeans (Table 4). Change from corn/soybeans to other crops may reflect the use of crop rotation systems in some states depending on the region; farmers use other crops to rotate with corn or soybeans in order to protect and improve soil quality. The major conversions between other crops and corn/soybeans occurred in four states, Minnesota, Kansas, Missouri, and South Dakota (Figure 10). In sum, we found a net decline in other crops in the MWCB totaling about 930 km2 (~230,000 acres; Table 4).

3.3.4. Small Grains Conversion to Corn/Soybeans from 2007 to 2012

Exchanges between small grains and corn/soybeans were mostly unidirectional from 2007 to 2012, meaning either that there is no land conversion from corn/soybeans to small grains, or that the conversion rate of corn/soybeans to small grains is lower than 0.05. Even though the conversion rate from corn/soybeans to small grains was very small, it is still possible that transfers of corn/soybeans to wheat exceed reciprocal transfers of small grains to corn/soybeans because of the large coverage of corn and soybeans in the field. Conversions between corn/soybeans and small grains were concentrated in both Nebraska and South Dakota (Figure 11). Five out of nine MWCB states had net losses of corn/soybeans totaling 84,000 acres (Table 5). Overall, there was a net loss of small grains to corn/soybeans (152,000 acres) during 2007–2012 (Table 5).

3.4. Biannual Crop Rotation between Corn and Soybeans, 2006–2013

Corn-soybeans rotation is a common crop rotation pattern that has been practiced by farmers in the MWCB for centuries [6]. Ideally, when assessed as biannual sequences, one should expect to see equal amounts of corn-soybeans and soybeans-corn sequences over a large geographic extent as in this study. However, the amount of corn and soybeans area in corn-soy/soy-corn rotation is less than 100%, ranging from 56% in 2006 to 63% in 2013 (Figure 12). The amount of rotation between corn and soybeans was about the same from 2006 to 2008. During 2008–2013, the amount of corn-soy/soy-corn rotation increased by 24%, which accounts for the gradual increase of corn/soybeans self-replacement rates over the same time.
Other than the traditional annual rotation of corn and soybeans, we also found continuous corn rotation and continuous soybeans rotation. The amount of corn planted on corn increased by 23% (~16,854 km2) between 2006 and 2013 (Figure 12). Temporal pattern of continuous soybeans cropping roughly mirrored that of continuous corn cropping (Figure 12). From 2006 to 2008, the amount of continuous soybeans declined while the amount of continuous corn increased. From 2008 to 2010, there were two successive increases in the amount of continuous soybeans planting and two successive declines in the amount of continuous corn planting. During 2010–2013, the amount of soybeans planted on soybeans decreased gradually while the amount of corn planted on corn rose concomitantly. Note that the total amount of land under continuous corn cropping was always higher than the total amount of land under continuous soybeans cropping over the study period (Figure 12). To summarize, we did find increases of continuous cropping (i.e., no rotation) (Figure 12). There were two time periods that experienced rises in continuous cropping, 2006–2008 and 2009–2012.

4. Discussion

In this study, satellite imagery of the MWCB were acquired from the USDA CDL at CropScape website. CDL data layer, a crop specific land cover product, is especially useful for our study as it provides spatially explicit data at an adequate temporal frequency and relatively high spatial resolution; it allows for a detailed analysis of when and where agricultural expansion of corn and soybean occurred [5].
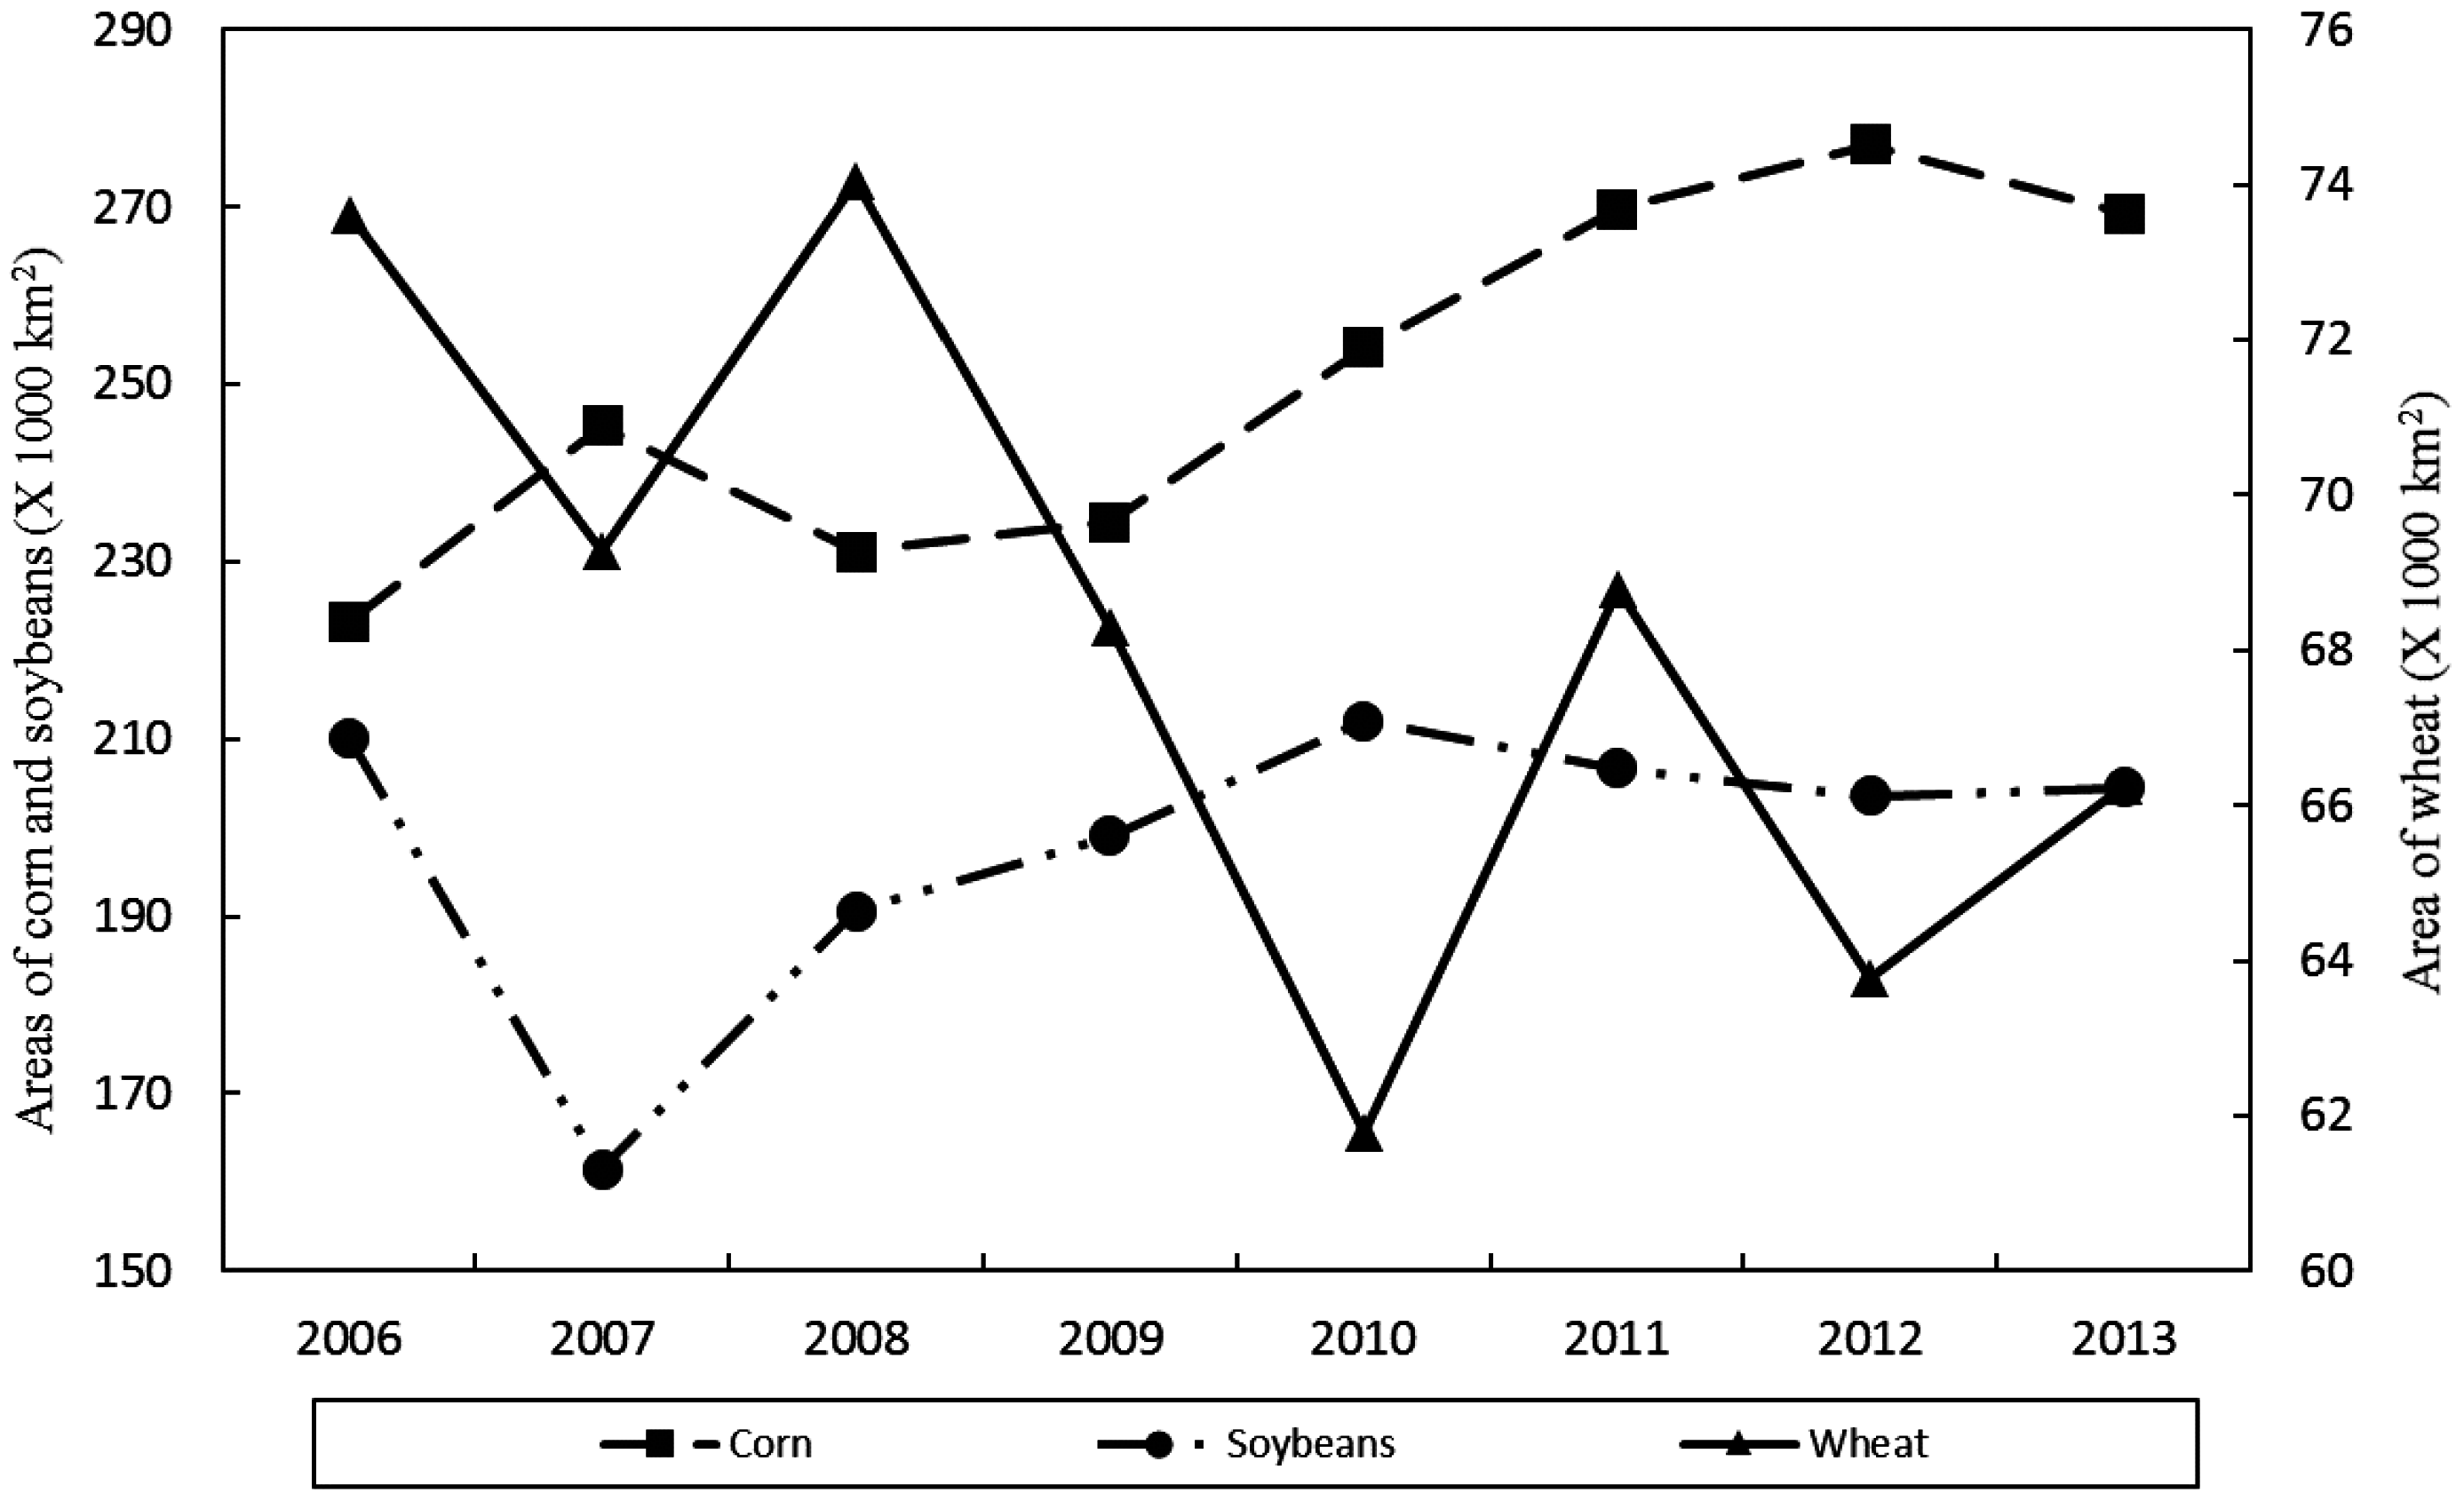
In general, the short-term trend analyses (2006–2013) of corn and soybeans acreage indicated continuous corn and soybeans expansion, whereas wheat decreased over the same time. Note that there was an abrupt increase in corn acres and a simultaneously decrease in soybean acres from 2006 to 2007. The amount of land planted to corn in 2007 climbed to about 245,334 km2: a total of 172,933 km2 (~70.5%) was newly added corn area and a total of 72,400 km2 (~29.5%) was corn planted on corn between 2006 and 2007. The amount of newly added corn was directly related to the decrease in the amount of soybeans, wheat, and grassland/pasture. This increase was primarily at the expense of soybeans area, which accounted for roughly 77% of the total gain. Considering crop rotation practices from 2006 to 2007, we found that continuous corn cropping accounted for 32.4% (~72,400 km2) and corn-soybeans rotation was 48.9% (~109,200 km2) of the total corn area in 2006 (Table 6). However, about 63.2% (~132,700 km2) of 2006 soybean area was under soybeans-corn rotation but only 13.8% (~28,900 km2) was continuous soybeans cropping from 2006 to 2007 (Table 6). This explains why there was a large deviation in the amount of corn and soybeans planted, suggesting an increase in the intensification of corn since 2006.
Several studies [4,12,13,14,17,19,
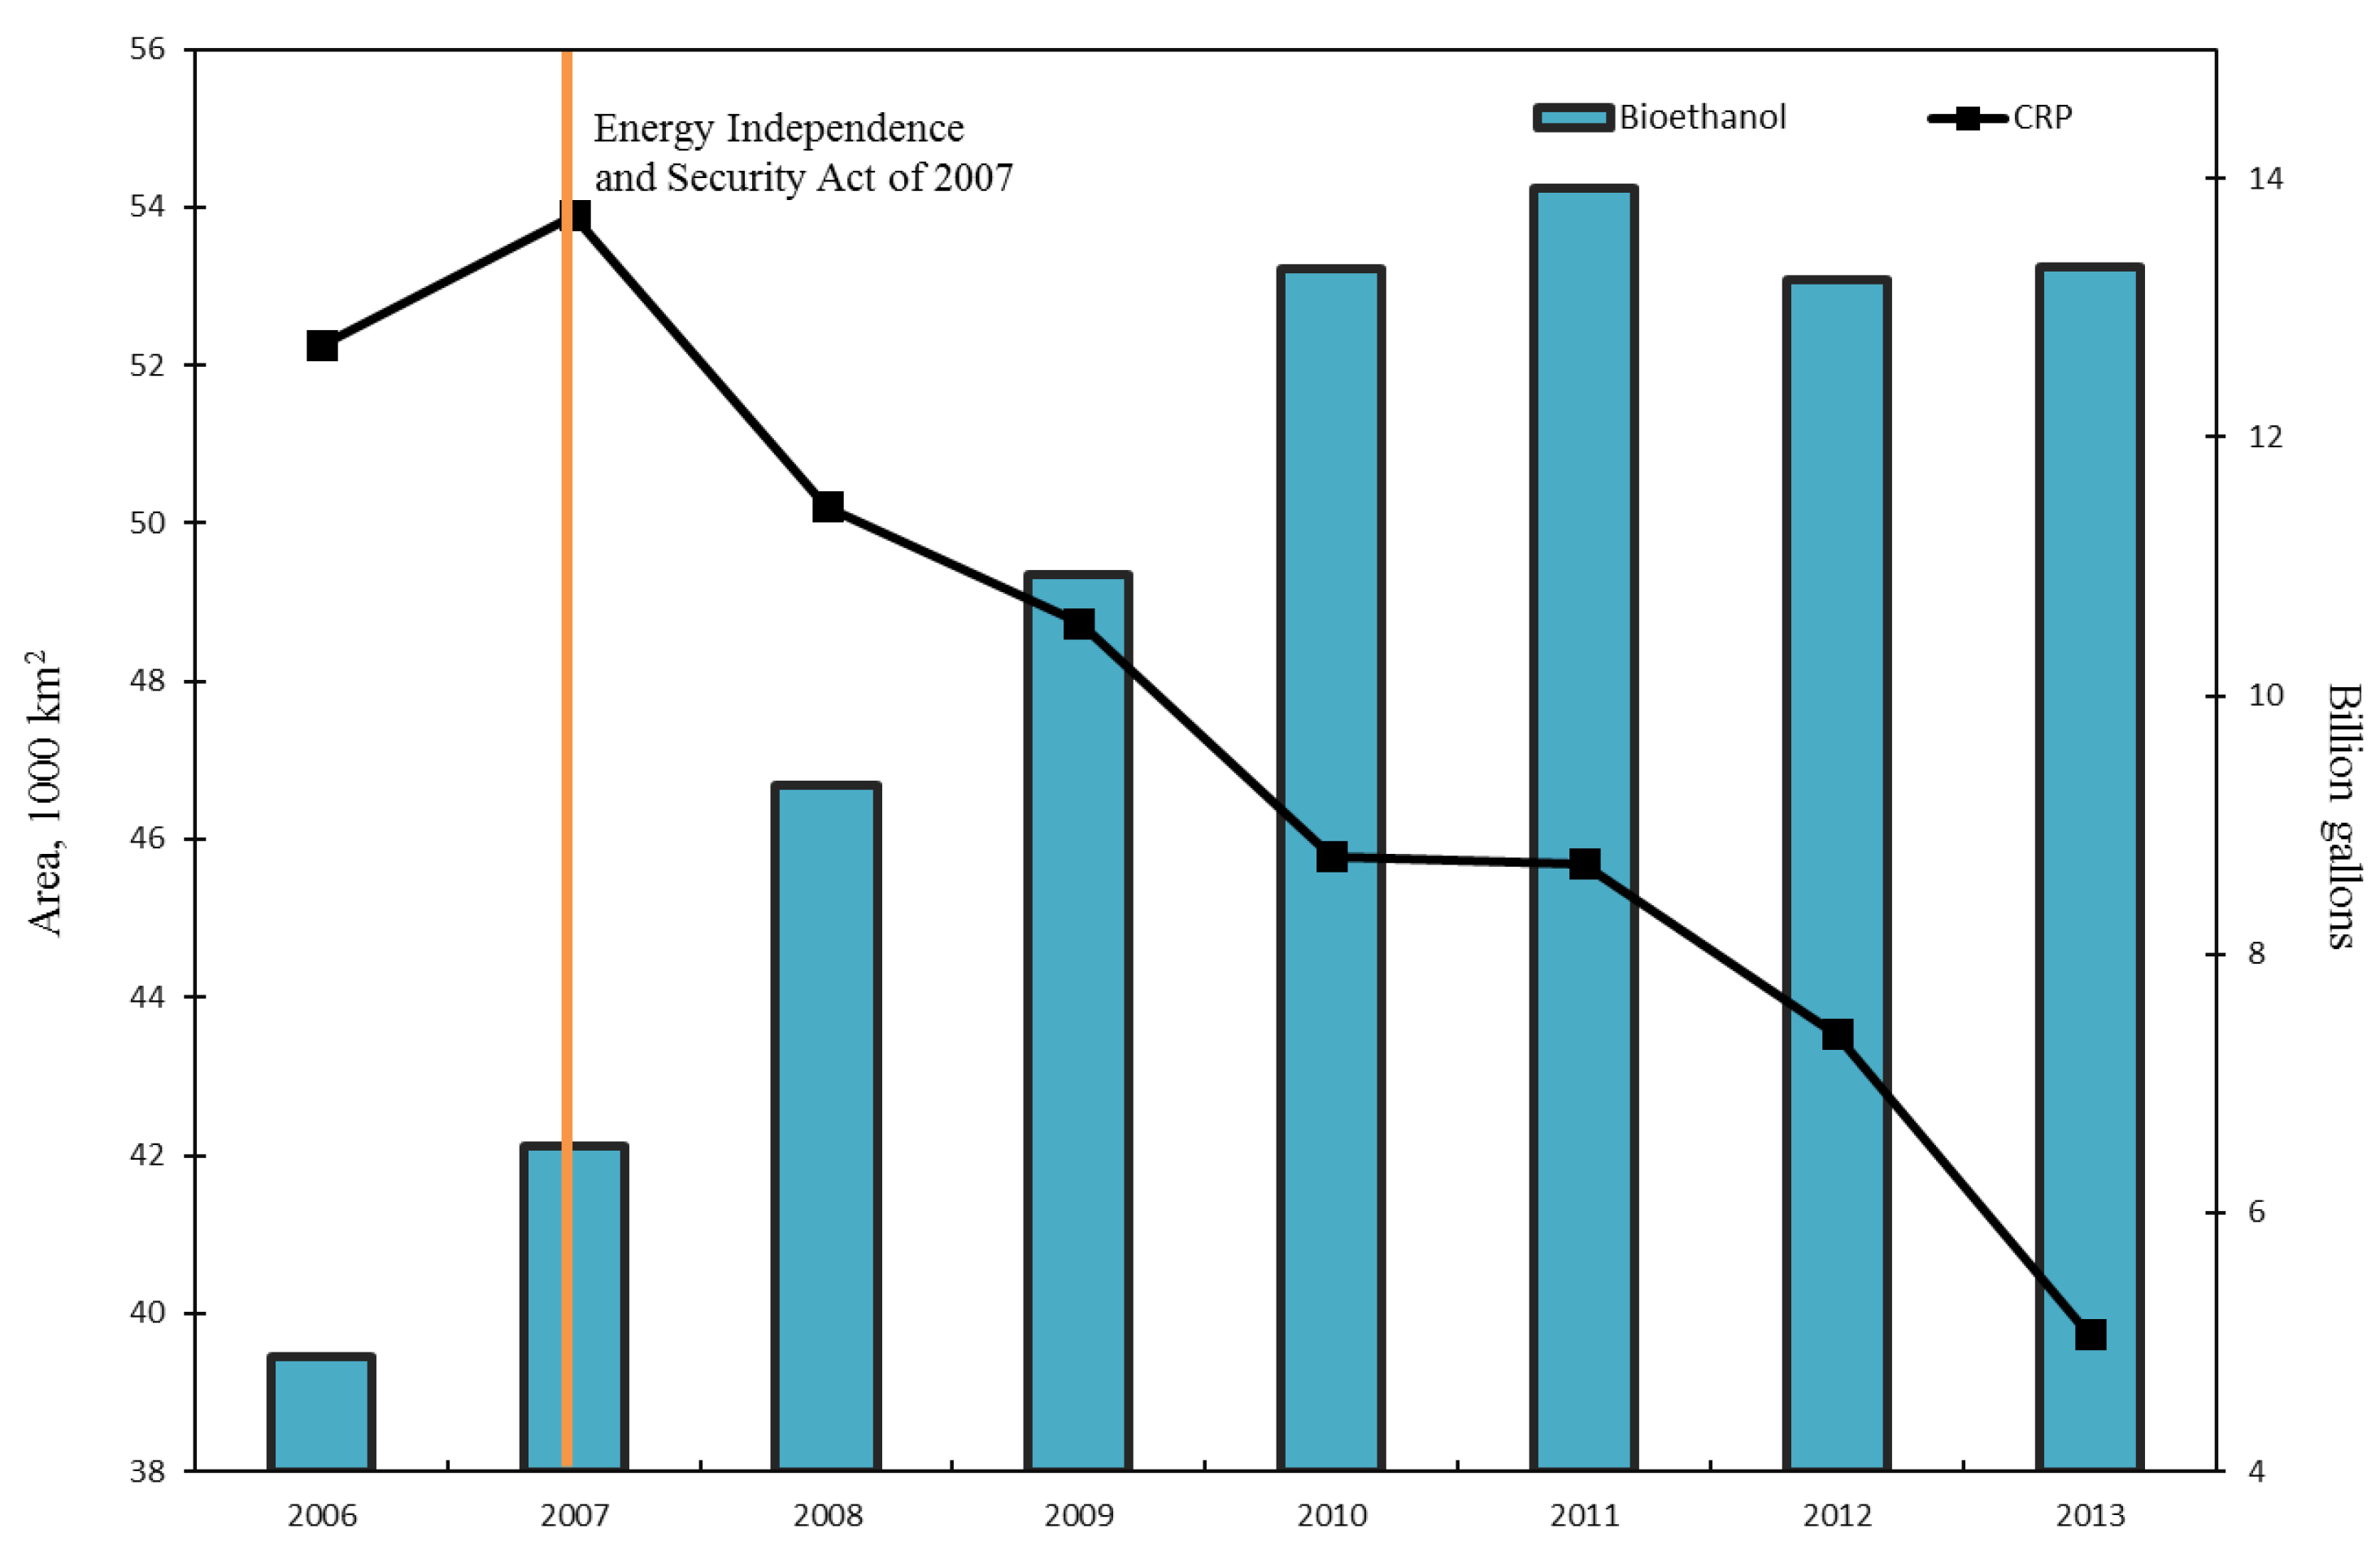
23] have demonstrated that the prominent increase of corn acreage in 2007 and the subsequent years is likely attributable to both market conditions and policy incentives underlie the interest in ethanol. Crude oil prices reached a record high of $68 in the summer of 2006 (the average price in 2006 was about $59). With the rapid increase in gasoline prices, there was unprecedented increasing demand for ethanol, for which corn is a major input. Further contributing to the interest in ethanol, the Energy Independence and Security Act (EISA) of 2007 (Public Law 110–140) mandated to blend grain-based ethanol—made entirely from corn—into the national gasoline supply [24]. Federal bioenergy policies, aimed at reducing greenhouse gas emissions and increasing energy independence, also provide incentives for boosting biofuel productions. When combined, these economic and policy drivers have contributed to agricultural expansion in the fertile MWCB.
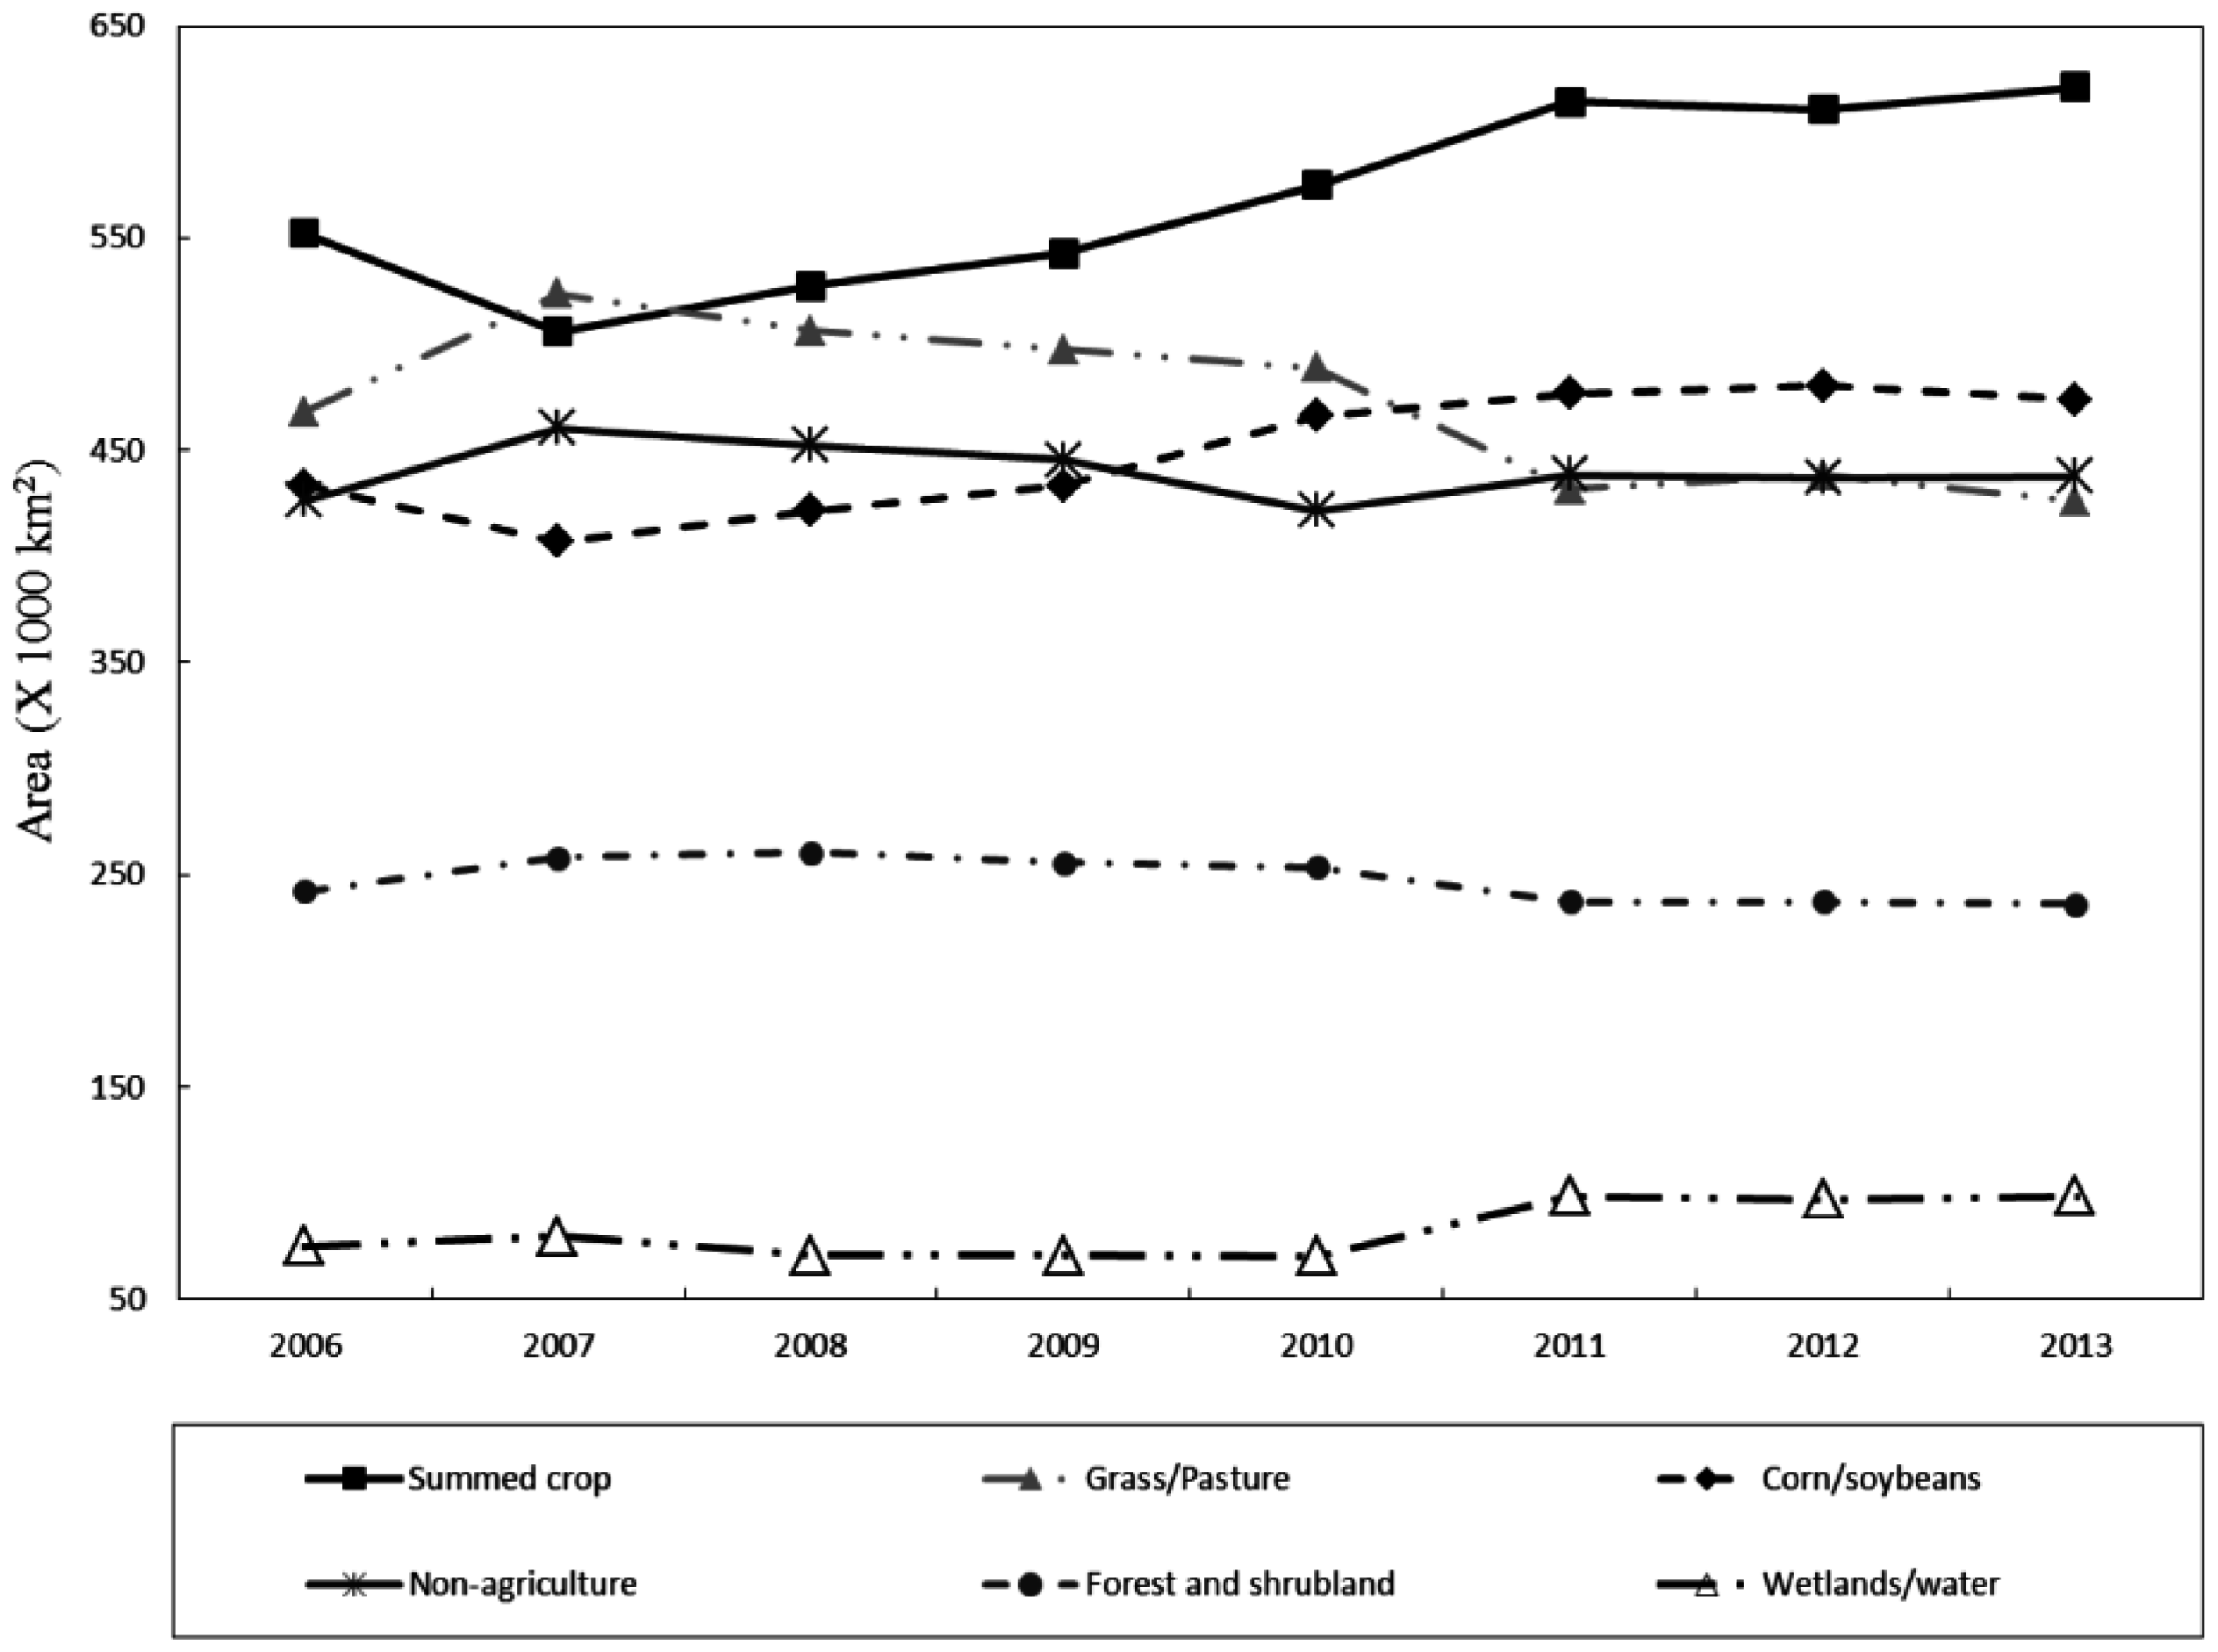
Spatial analysis of agricultural expansion revealed continuous corn and soybean expansion at the expense of other land cover types, including grassland, wheat, small grains, and other crops. Of all, grassland loss was the greatest, totaling roughly 15,640 km2 (~3.9 million acres). Grassland conversion to corn and soybean occurred dominantly along the western margin of the MWCB. Our finding is consistent with Wright and Wimberly [19] in that cropland expansion has shifted westward to more arid western states, which potentially means higher agricultural input, in particular of irrigation. It might also encroach onto environmentally sensitive lands. As pointed out by the US Government Accountability Office (GAO), U.S. farm program payments provided strong incentives for landowners to convert grassland to cropland [23]. In the meantime, drought-resistant varieties of corn and soybeans made possible by genetically modified engineering technology also contributed to a switch to corn and soybean production along the MWCB [25]. Land conversion from grassland to cultivated croplands is associated with many environmental problems, including losses of grassland-dependent species [26,27], decreases of carbon sequestration [26] and water quality [28], and increases in soil erosion [29]. Once native grassland loss occurs, the damage is hard to recover.
The analysis of the relationship between CRP land and grassland loss revealed two major points: (1) most of grassland conversion was due to a resumption of cropping on former CRP lands; and (2) corn and soybeans cropping has expanded beyond those lands previously protected by the CRP. This finding is consistent with previous studies [4,12,19,30,31]. CRP was designed to protect highly erodible and environmentally sensitive acres of agricultural land to vegetative covers under 10 to 15 years’ contract [32]. Much of the land entering the CRP was land formerly being devoted to row crop production. Therefore, by registering them under CRP, farmers can create a wide range of environmental benefits including the provision of improved habitat for grassland-dependent wildlife (e.g., pheasant) and other important ecosystem services [33].
However, the amount of lands enrolled under CRP is subject to both landowner decisions and program caps as determined by Congressional budget [34]. Landowner decisions change as the market prices of grain and fuel fluctuate. The emerging market of biofuels has boosted the market prices of major agricultural commodities, corn and soybean in particular [31]. In turn, higher crop prices provide incentives for farmers to cultivate lands and Congressional efforts to increase agricultural production [34]. Besides, increasing demand for land also lifts land value, which can further complicate the registration of CRP land. In fact, large amount of total CRP acres left the program since 2007. The wholesale loss of CRP land can have detrimental environmental impacts on wildlife and ecosystem services provided, especially in the context of global climate change. Therefore, government policy should be designed to promote more CRP enrollment due to its proven ability to conserve biodiversity even when there are fluctuations in agricultural commodity market. One option is to raise CRP payments so that it is as attractive as higher crop price. Higher CRP payments will certainly require substantially higher Congressional budget. Therefore, a change in targeting strategies is needed to ensure that the most sensitive land does not leave the program.
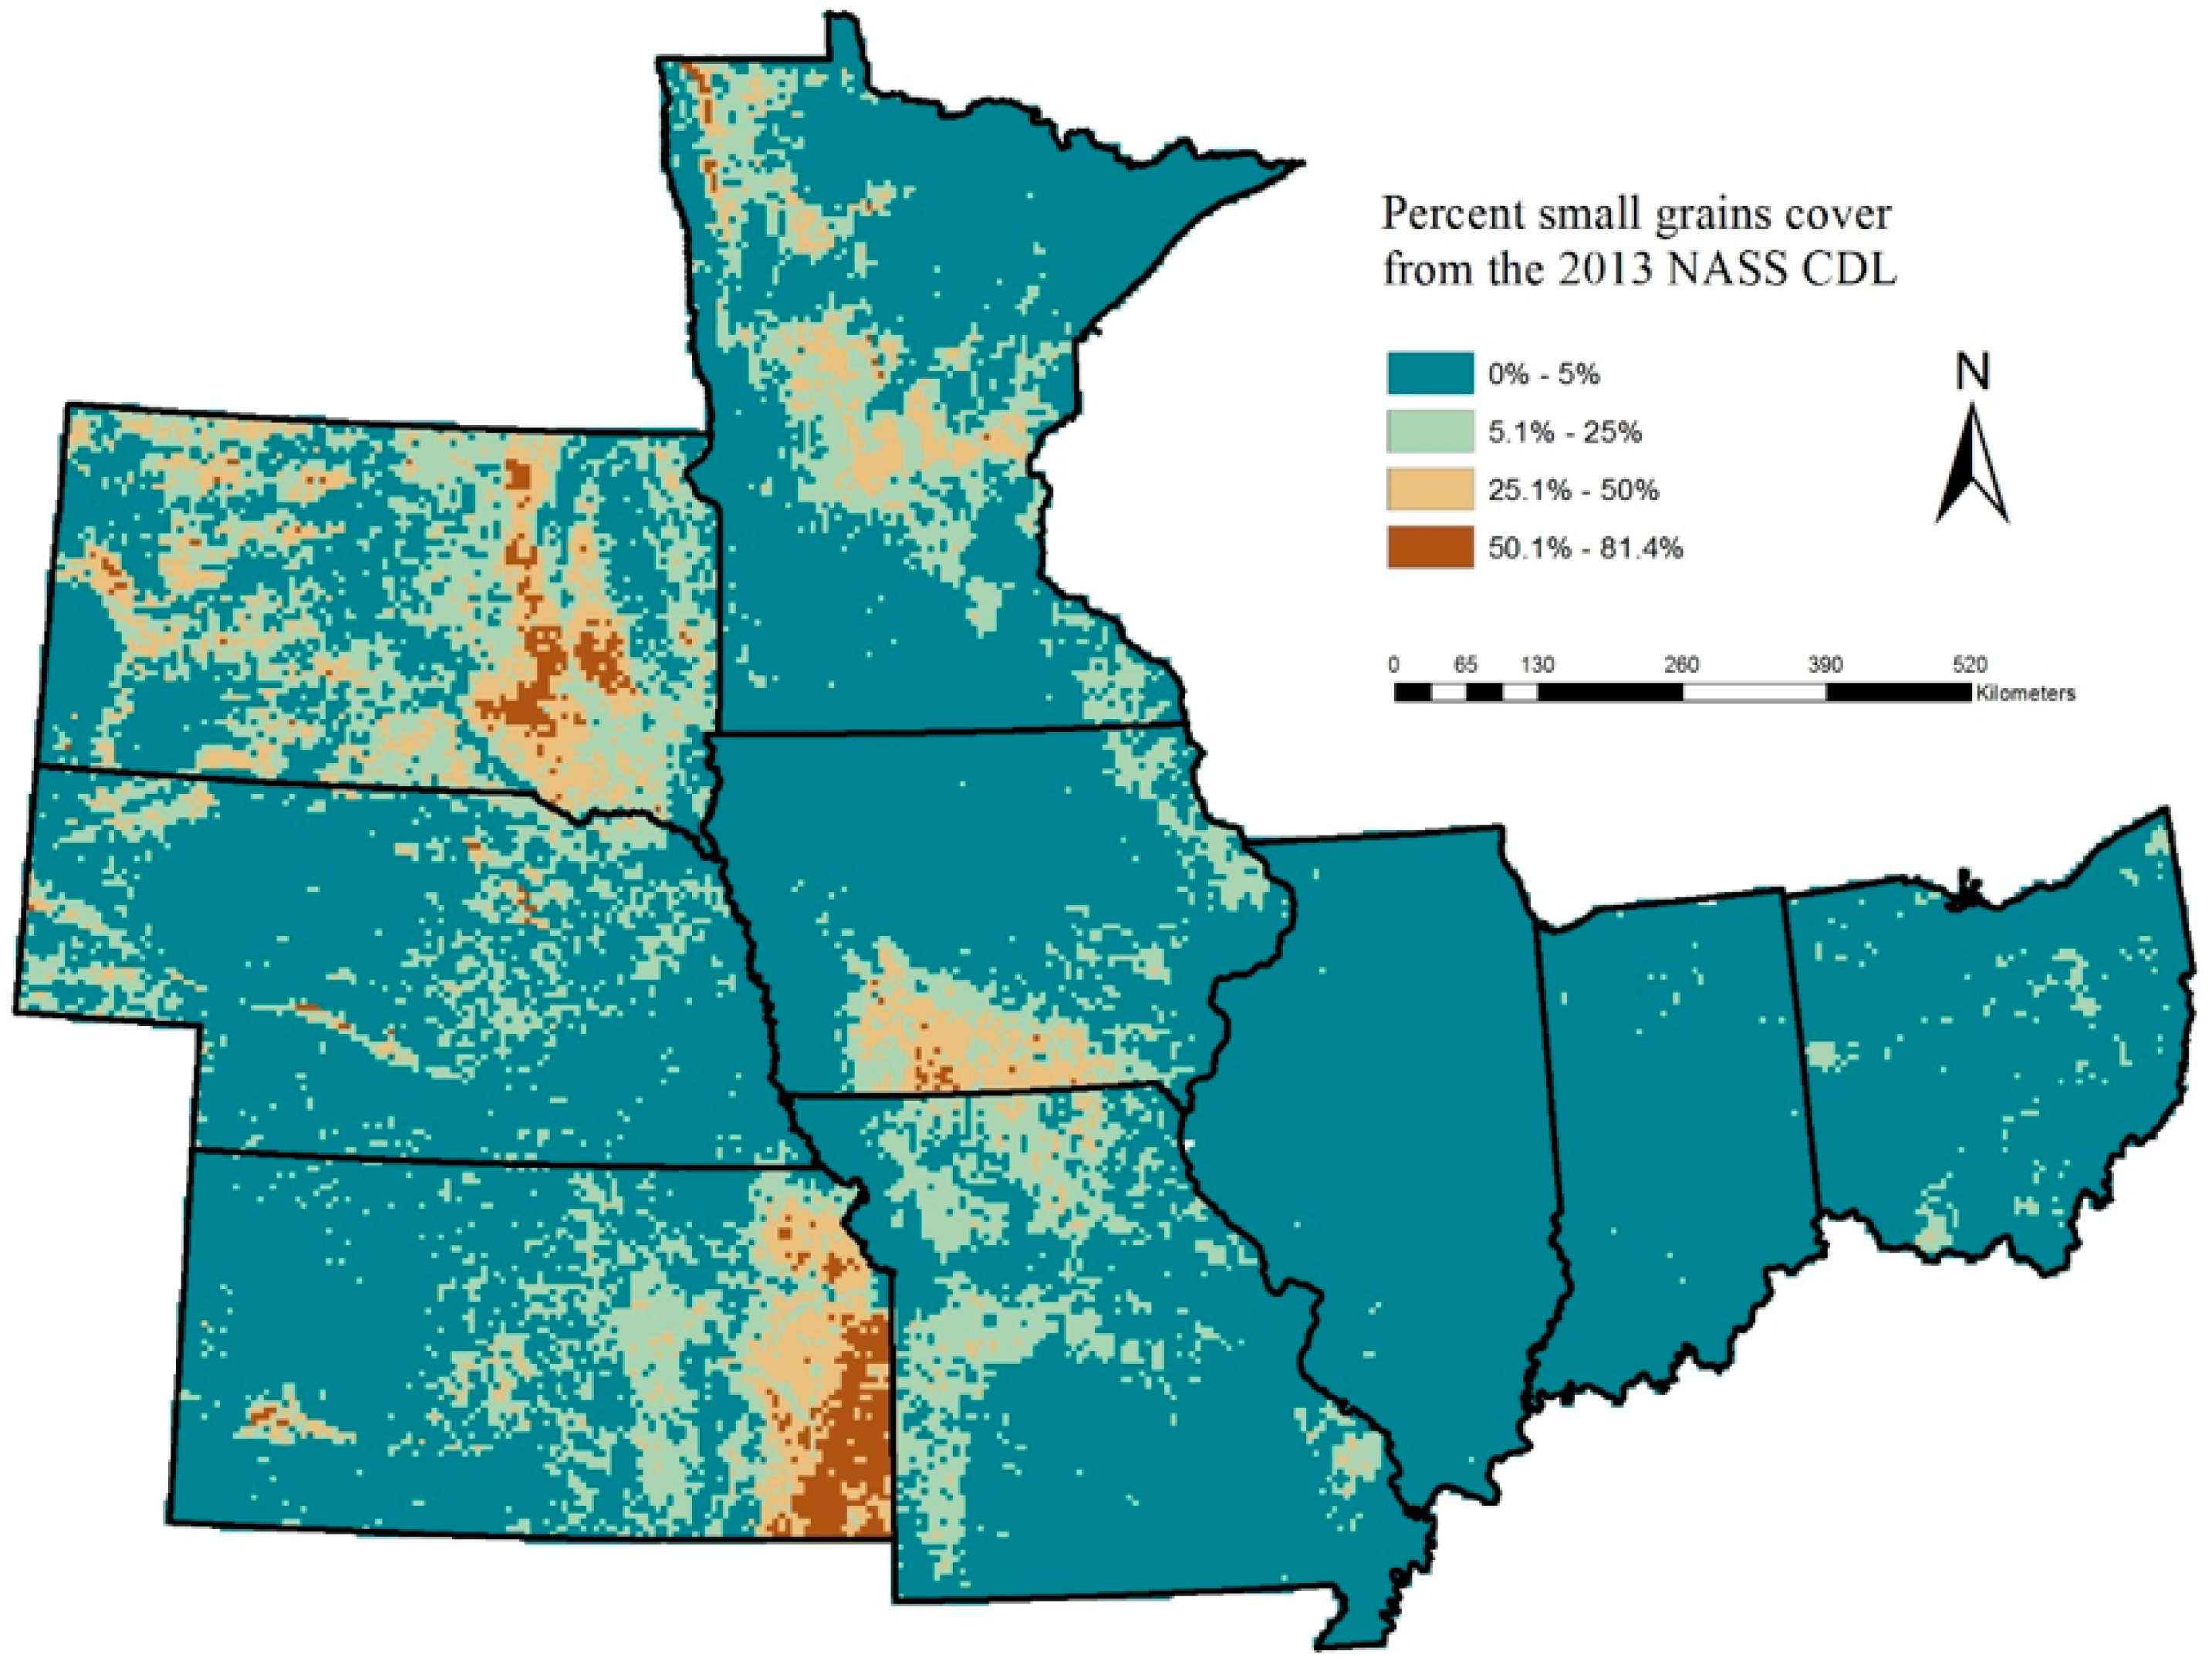
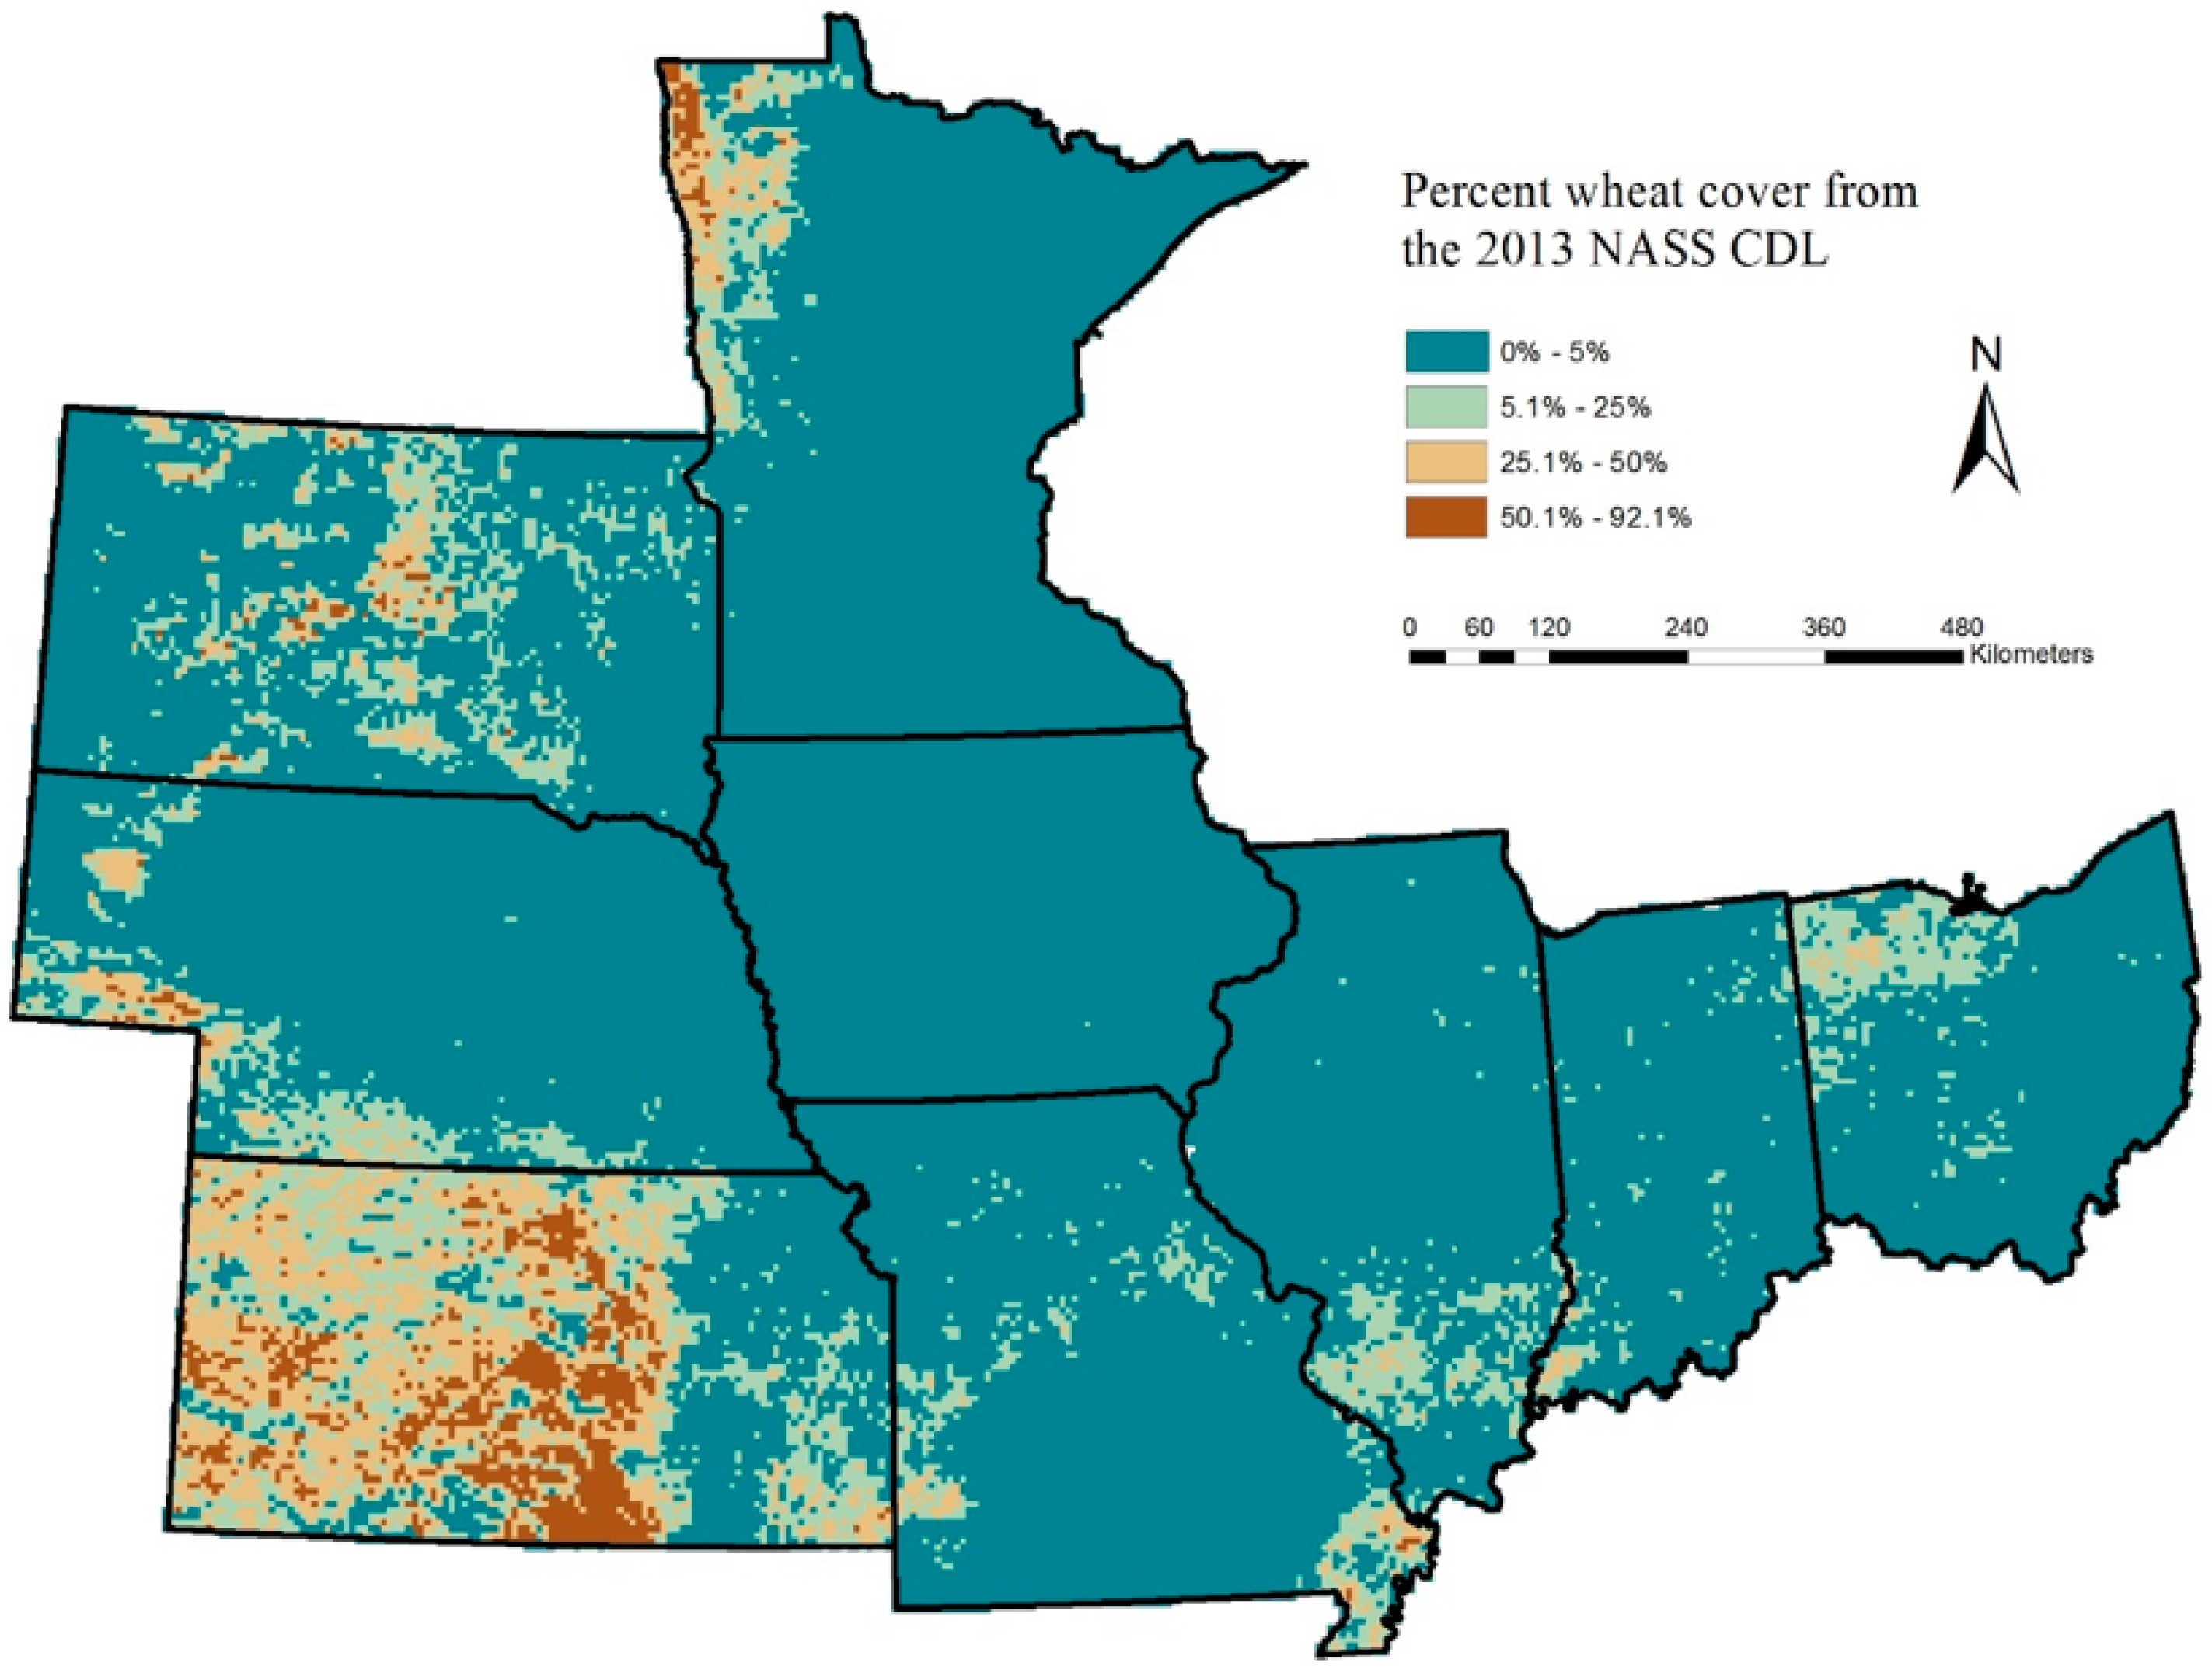
Wheat was the second most affected land cover class with a total net loss of 2.5 million acres. Wheat is also an important Midwest crop grown in the US, ranked right behind corn and soybean. The significant loss of wheat acreage to corn and soybean can be problematic given the importance of wheat as a direct food resource for human beings. The US also exports about half of its wheat production to international trade market [5]. Such a significant shift of wheat production to corn and soybean can indirectly affect the food security of foreign countries which have rely heavily on wheat import.
When analyzing land use/cover change in the MWCB, we also analyzed annual crop rotation system under agricultural expansion. As aforementioned, high corn and soybean prices have affected three crop rotation systems: continuous corn, continuous soybean, and corn-soybean/soybean-corn. Throughout this analysis, there were obvious increases in both continuous corn cropping and continuous soybean cropping. Corn-soybean/soybean-corn rotation has long been considered beneficial to soil quality improvements and agricultural productivity [6,8,9,10,11]. Therefore, a large transition into continuous corn or continuous soybean cropping would potentially lead to soil erosion and other environmental problems.

5. Conclusions

This study explores the spatial patterns of agricultural expansion and crop rotation systems in the MWCB during 2006–2013 when there is a doubling of corn and soybean prices. We find that corn and soybean continuously expand whereas most other crops shrink. Grassland is the most affected, with a total net loss of 3.9 million acres. Grassland loss is mainly concentrated along the western margin of the MWCB, an area with competing demand for limited water supply. This region is also home to many important ecosystems, including native grassland and grassland. Large amount of land previously protected under the CRP left the program since 2007. One of the likely outcomes is the resumption of agricultural production. Grasslands provide important breeding habitats for wildlife, especially grassland-dependent species. Large acres of grassland loss can cause detrimental impacts on our environment and biodiversity. Therefore, it is important to design government policy in a way that encourages CRP enrollment and to ensure that the most sensitive land does not leave the program. Wheat to corn/soybean conversion occurs in top wheat-producing states, totaling 2.5 million acres. With respect to agronomic practices, the amount of corn planted on corn increased by 23% between 2006 and 2013, whereas the amount of continuous soybean cropping fluctuated over time. Land use/cover change rates calculated in this study can be used to assess future land use scenarios as well as their social and environmental consequences.

Acknowledgments

The authors would like to thank Larry Barnthouse, Thomas Crist, John Maingi, and M. Henry H. Stevens for their valuable time and insightful feedback throughout this project. Comments on the manuscript from two anonymous peer reviewers were greatly appreciated.

Author Contributions

This paper is a joint work of the two authors. Meimei Lin conceived and performed the study and wrote the manuscript. Mary C. Henry contributed to research ideas, development, instruction, and improvement aspects of the article. Both have read and approved the final manuscript.

Conflicts of Interest

The authors declare no conflict of interest.

References

  1. United Nations. World Population Prospects: The 2012 Revision, Key Findings and Advance Tables; United Nations: New York, NY, USA, 2013. [Google Scholar]
  2. Tilman, D. Forecasting Agriculturally Driven Global Environmental Change. Science 2001, 292, 281–284. [Google Scholar] [CrossRef] [PubMed]
  3. U.S. Department of Energy Energy Information Administration. Available online: http://www.eia.doe.gov/emeu/mer/renew.html (accessed on 8 July 2016).
  4. Wallander, S.; Claassen, R.; Nickerson, C. The Ethanol Decade: An Expansion of U.S. Corn Production, 2000-2009; USDA Economic Research Service: Washington, DC, USA, 2011.
  5. United States Department of Agriculture National Agricultural Statistics Service CropScape—Cropland Data Layer. Available online: http://nassgeodata.gmu.edu/CropScape/ (accessed on 5 August 2015).
  6. Bullock, D.G. Crop rotation. Crit. Rev. Plant Sci. 1992, 11, 309–326. [Google Scholar] [CrossRef]
  7. Mitchell, C.C.; Entry, J.A. Soil C, N and crop yields in Alabama’ long-term ‘Old Rotation’ cotton experiment. Soil Tillage Res. 1998, 47, 331–338. [Google Scholar] [CrossRef]
  8. Karlen, D.L.; Hurley, E.G.; Andrews, S.S.; Cambardella, C.A.; Meek, D.W.; Duffy, M.D.; Mallarino, A.P. Crop rotation effects on soil quality at three northern corn/soybean belt locations. Agron. J. 2006, 98, 484–495. [Google Scholar] [CrossRef]
  9. Meese, B.G.; Carter, P.R.; Oplinger, E.S.; Pendleton, J.W. Corn/soybean rotation effect as influenced by tillage, nitrogen, and hybrid/cultivar. J. Prod. Agric. 1991, 4, 74–80. [Google Scholar] [CrossRef]
  10. Porter, P.M.; Lauer, J.G.; Lueschen, W.E.; Ford, J.H.; Hoverstad, T.R.; Oplinger, E.S.; Crookston, R.K. Environment affects the corn and soybean rotation effect. Agron. J. 1997, 89, 441–448. [Google Scholar] [CrossRef]
  11. Landis, D.A.; Gardiner, M.M.; van der Werf, W.; Swinton, S.M. Increasing corn for biofuel production reduces biocontrol services in agricultural landscapes. Proc. Natl. Acad. Sci. USA 2008, 105, 20552–20557. [Google Scholar] [CrossRef] [PubMed]
  12. Westcott, P. U.S. ethanol expansion driving changes throughout the agricultural sector. J. Agr. Resour. Econ. 2014, 43, 319–333. [Google Scholar]
  13. Pimentel, D. Ethanol fuels: Energy balance, economics, and environmental impacts are negative. Nat. Resour. Res. 2003, 12, 127–134. [Google Scholar] [CrossRef]
  14. Pimentel, D.; Patzek, T.W. Ethanol Production Using Corn, Switchgrass, and Wood; Biodiesel Production Using Soybean and Sunflower. Nat. Resour. Res. 2005, 14, 65–76. [Google Scholar] [CrossRef]
  15. Searchinger, T.; Heimlich, R.; Houghton, R.A.; Dong, F.; Elobeid, A.; Fabiosa, J.; Tokgoz, S.; Hayes, D.; Yu, T.H. Use of U.S. Croplands for Biofuels Increases Greenhouse Gases through Emissions from Land-Use Change. Science 2008, 319, 1238–1240. [Google Scholar] [PubMed]
  16. Lunetta, R.S.; Shao, Y.; Ediriwickrema, J.; Lyon, J.G. Monitoring agricultural cropping patterns across the Laurentian Great Lakes Basin using MODIS-NDVI data. Int. J. Appl. Earth Obs. Geoinf. 2010, 12, 81–88. [Google Scholar] [CrossRef]
  17. Malcolm, S.A.; Aillery, M.; Weinberg, M. Ethanol and a Changing Agricultural Landscape, US Department of Agriculture, Economic Research Service. Available online: http://www.ers.usda.gov/webdocs/publications/err86/9206_err86_reportsummary.pdf (accessed on 12 Ocotober 2015).
  18. Carleton, A.M.; Adegoke, J.; Allard, J.; Arnold, D.L.; Travis, D.J. Summer season land cover-Convective cloud associations for the midwest U.S. “Corn Belt”. Geophys. Res. Lett. 2001, 28, 1679–1682. [Google Scholar] [CrossRef]
  19. Wright, C.K.; Wimberly, M.C. Recent land use change in the Western Corn Belt threatens grasslands and wetlands. Proc. Natl. Acad. Sci. USA 2013, 110, 4134–4139. [Google Scholar] [CrossRef] [PubMed]
  20. Johnston, C.A. Agricultural expansion: Land use shell game in the U.S. Northern Plains. Landsc. Ecol. 2013, 29, 81–95. [Google Scholar] [CrossRef]
  21. Medley, K.E.; Okey, B.W.; Barrett, G.W.; Lucas, M.F.; Renwick, W.H. Landscape change with agricultural intensification in a rural watershed, southwestern Ohio, USA. Landsc. Ecol. 1995, 10, 161–176. [Google Scholar] [CrossRef]
  22. Renwick, W.H.; Vanni, M.J.; Zhang, Q.; Patton, J. Water Quality Trends and Changing Agricultural Practices in a Midwest U.S. Watershed, 1994–2006. J. Environ. Qual. 2008, 37, 1862. [Google Scholar] [PubMed]
  23. US Government Accountability Office. Agricultural Conservation: Farm Program Payments pre an Important Factor in Landowner’s Decisions to Convert Grassland to Cropland; Report to Congressional Requesters, GAO-07-1054; US Government Accountability Office: Washington, DC, USA, 2007.
  24. Energy Independence and Security Act of 2007, Proceedings of H.R.6 110th Congress, Washington, DC, USA. Available online: https://www.congress.gov/bill/110th-congress/house-bill/6 (accessed on 6 September 2014).
  25. Claassen, R.; Carriazo, F.; Cooper, J.C.; Hellerstein, D.; Ueda, K. Grassland to Cropland Conversion in the Northern Plains: The Role of Crop Insurance, Commodity, and Disaster Programs; Economic Research Report No. ERR-120; US Department of Agriculture Economic Research Service: Washington, DC, USA, 2011.
  26. Foley, J.A.; DeFries, R.S.; Asner, G.; Barford, C.C.; Bonan, G.; Carpenter, S.R.; Chapin, F.; Coe, M.; Daily, G.; Gibbs, H.K.; et al. Global Consequences of Land Use. Science 2005, 309, 570–574. [Google Scholar] [CrossRef] [PubMed]
  27. Green, R.E. Farming and the Fate of Wild Nature. Science 2005, 307, 550–555. [Google Scholar] [CrossRef] [PubMed]
  28. Moss, B. Water pollution by agriculture. Philos. Trans. R. Soc. Lond. 2008, 363, 659–666. [Google Scholar] [CrossRef] [PubMed]
  29. Montgomery, D.R. Soil erosion and agricultural sustainability. Proc. Natl. Acad. Sci. USA 2007, 104, 13268–13272. [Google Scholar] [CrossRef] [PubMed]
  30. Atwell, R.C.; Schulte, L.A.; Westphal, L.M. Landscape, community, countryside: Linking biophysical and social scales in US Corn Belt agricultural landscapes. Landsc. Ecol. 2009, 24, 791–806. [Google Scholar] [CrossRef]
  31. Laingen, C. Delineating the 2007 Corn Belt region. Appl. Geogr. Conf. 2012, 35, 173–181. [Google Scholar]
  32. USDA. Conservation Policy. U.S. Department of Agriculture Natural Resources & Environment. Available online: http://www.ers.usda.gov/Briefing/ConservationPolicy/background.htm (accessed on 9 July 2015).
  33. Riffell, S.; Scognamillo, D.; Burger, L.W. Effects of the Conservation Reserve Program on northern bobwhite and grassland birds. Environ. Monit. Assess. 2008, 146, 309–323. [Google Scholar] [CrossRef] [PubMed]
  34. Dale, V.H.; Kline, K.L.; Wiens, J.; Fargione, J. Biofuels: Implications for Land Use and Biodiversity; Biofuels and Sustainability Reports; Ecological Society of America: Washington, DC, USA, 2010. [Google Scholar]
Figure 1. Study area of the U.S. Midwest Corn Belt (MWCB) including nine states: Illinois, Indiana, Iowa, Kansas, Minnesota, Missouri, Nebraska, Ohio, and South Dakota.
Sustainability 08 01177 g001
Figure 2. Short-term trends of major crops (corn, soybeans, and wheat) in the MWCB (including nine Corn Belt states) between 2006 and 2013, extracted from CDL data layers.
Sustainability 08 01177 g002
Figure 3. Trends of major land uses in the MWCB between 2006 and 2013, extracted from CDL data.
Sustainability 08 01177 g003
Figure 4. Percent corn and soybean cover at 5600-m spatial resolution from the 2013 NASS CDL (each grid cell representing an area of 31.3-km2), and the location of ethanol plants within the MWCB.
Sustainability 08 01177 g004
Figure 5. Percent wheat cover at 5600-m spatial resolution from the 2013 NASS CDL (each grid cell representing an area of 31.3-km2).
Sustainability 08 01177 g005
Figure 6. Percent small grains cover at 5600-m spatial resolution from the 2013 NASS CDL (each grid cell representing an area of 31.3-km2).
Sustainability 08 01177 g006
Figure 7. Agricultural expansion in the MWCB during 2007–2012. (A) Absolute change rate from grassland in 2007 to corn or soybeans in 2012 (GRCS); (B) Absolute change rate from corn or soybeans in 2007 to grassland in 2012 (CSGR). The spatial resolution is 5600-m with each grid cell representing an area of 31.3-km2.
Sustainability 08 01177 g007
Figure 8. Total area (×1000 km2) enrolled in the CRP in the MWCB (calculated by adding up the amount of land in CRP in all nine MWCB states) and annual U.S. bioethanol production (in billion gallons), 2006–2013. Note that 2007 was the year of passage of the “Energy Independence and Security Act of 2007”, which mandated the blending of corn ethanol into the national gasoline supply. Data sources: USDA Farm Service Agency (FSA) and Renewable Fuels Association (RFA).
Sustainability 08 01177 g008
Figure 9. Agricultural expansion in the MWCB during 2007–2012. (A) Absolute change rate from wheat in 2007 to corn or soybeans in 2012 (WHCS); (B) Absolute change rate from corn or soybeans in 2007 to wheat in 2012 (CSWH). The spatial resolution is 5600-m with each grid cell representing an area of 31.3-km2.
Sustainability 08 01177 g009
Figure 10. Agricultural expansion in the MWCB during 2007–2012. (A) Absolute change rate from small grains in 2007 to corn or soybeans in 2012 (GNCS); (B) Absolute change rate from corn or soybeans in 2007 to small grains in 2012 (CSGN). The spatial resolution is 5600-m with each grid cell representing an area of 31.3-km2.
Sustainability 08 01177 g010
Figure 11. Agricultural expansion in the MWCB during 2007–2012. (A) Absolute change rate from other crops in 2007 to corn or soybeans in 2012 (OCCS); (B) Absolute change rate from corn or soybeans in 2007 to other crops in 2012 (CSOC). The spatial resolution is 5600-m with each grid cell representing an area of 31.3-km2.
Sustainability 08 01177 g011
Figure 12. The amount of corn and soybeans in different cropping patterns (Corn-Corn, Soybeans-Soybeans, Corn-soybeans/Soybeans-Corn) by examining biannual crop rotation and the percentage of the total area that is in rotation and not in rotation (bar plots), according to the USDA Cropland Data Layer during 2006–2013.
Sustainability 08 01177 g012
Table 1. Land use/cover in the MWCB extracted from the 2013 CDL layer (by decreasing acreage), and applicable codes from any of the eight CDL layers.
Classification Class2013 Area (×103 km2)% of RegionCDL Codes a
Grassland426.0728.34%176
Corn269.2717.91%1, 12, 13, 241
Forest and shrubland236.1215.71%141, 142, 143, 152
Soybeans204.5513.61%5, 239, 240
Developed and barren102.776.84%121, 122, 123, 124, 131
Wetlands69.274.61%190, 195
Wheat66.254.41%22, 23, 24, 26, 225, 236, 238
Small grains (barley, oats, etc.)58.243.87%21, 25, 27, 28, 29, 30, 31, 32, 33, 36, 37, 38, 39
Open water29.491.96%92, 111
Other crops (sunflower, canola, alfalfa, canola, etc.)22.861.52%2, 3, 4, 6, 10, 11, 14, 41, 42, 43, 44, 46, 47, 48, 50, 52, 53, 54, 55, 57, 58, 59, 60, 67, 68, 69, 70, 71, 74, 76, 205, 206, 207, 209, 216, 219, 220, 221, 222, 224, 226, 229, 235, 237, 242, 243, 246, 247, 249, 254
Fallow/idle cropland18.291.22%61
a Refer to CDL metadata for detailed information on individual CDL codes [5].
Table 2. Total areas of grassland to corn/soybeans change and corn/soybeans to grassland change from 2007 to 2012.
Area, ×103 km2 (×103 Acres)
StateGrassland to Corn/SoybeansCorn/Soybeans to GrasslandGrassland Net Loss
Illinois0.79 (196)0.16 (39)0.63 (156)
Indiana0.55 (135)0.09 (23)0.45 (112)
Iowa3.14 (775)0.22 (55)2.91 (720)
Kansas1.31 (323)0.22 (55)1.09 (268)
Minnesota1.35 (333)0.03 (8)1.31 (325)
Missouri2.58 (637)0.13 (33)2.45 (605)
Nebraska3.28 (810)0.11 (28)3.16 (782)
Ohio0.86 (212)0.08 (21)0.77 (191)
South Dakota2.94 (727)0.09 (23)2.85 (705)
Sum16.78 (4147)1.15 (284)15.64 (3863)
Table 3. Total areas of wheat to corn/soybeans change and corn/soybeans to wheat change from 2007 to 2012.
Area, ×103 km2 (×103 Acres)
StateWheat to Corn/SoybeansCorn/Soybeans to WheatWheat Net Loss
Illinois1.43 (355)0.79 (195)0.65 (160)
Indiana0.62 (154)0.51 (127)0.11 (27)
Iowa0.01 (1)0.01 (1)0.00 (0)
Kansas5.46 (1,348)3.29 (812)2.17 (536)
Minnesota3.41 (844)1.84 (455)1.57 (389)
Missouri1.19 (294)0.90 (222)0.29 (72)
Nebraska1.75 (432)0.70 (174)1.05 (259)
Ohio1.46 (362)0.73 (181)0.73 (181)
South Dakota5.09 (1259)1.44 (355)3.66 (904)
Sum20.43 (5048)10.20 (2522)10.23 (2526)
Table 4. Total areas of small grains to corn/soybeans change and corn/soybeans to small grains change from 2007 to 2012.
Area, ×103 km2 (×103 Acres)
StateSmall Grains to Corn/SoybeansCorn/Soybeans to Small GrainsSmall Grains Net Loss
Illinois0.03 (7)0.03 (7)0 (0)
Indiana0.02 (4)0.05 (14)−0.04 (−10)
Iowa0.10 (25)0.20 (50)−0.10 (−25)
Kansas0.31 (77)0.15 (36)0.17 (41)
Minnesota0.45 (112)0.58 (143)−0.13 (−31)
Missouri0.00 (0)0.01 (4)−0.01 (−4)
Nebraska0.91 (224)0.37 (92)0.54 (132)
Ohio0.04 (9)0.09 (23)−0.06 (−14)
South Dakota0.83 (204)0.58 (143)0.25 (61)
Sum2.68 (663)2.07 (511)0.61 (152)
Table 5. Total areas of other crops to corn/soybeans change and corn/soybeans to other crops change from 2007 to 2012.
Area, ×103 km2 (×103 Acres)
StateOther Crops to Corn/SoybeansCorn/Soybeans to Other CropsOther Crops Net Loss
Illinois0.15 (38)0.03 (8)0.12 (30)
Indiana0.10 (26)0.03 (8)0.07 (18)
Iowa0.01 (2)0.00 (0)0.01 (2)
Kansas1.06 (263)0.53 (130)0.53 (133)
Minnesota1.29 (319)1.21 (298)0.08 (21)
Missouri0.74 (182)0.57 (141)0.17 (41)
Nebraska0.29 (71)0.26 (63)0.03 (8)
Ohio0.02 (6)0.01 (2)0.01 (4)
South Dakota0.33 (81)0.43 (106)−0.10 (−25)
Sum4.00 (988)3.07 (758)0.93 (230)
Table 6. Percent (%) and the amount (×1000 km2) of crop rotations from 2006 to 2007.
20062007OtherTotal
CornSoybeansWheatGrassland
Corn32.4% (72.4)48.9% (109.2)2.9% (6.6)7.9% (17.5)7.9% (17.6)100%
Soybeans63.2% (132.7)13.8% (28.9)7.6% (16)8.8% (18.4)6.6% (13.9)100%
Wheat19.5% (14.4)10.1% (7.4)30.1% (22.2)18.4% (13.5)21.9% (16.1)100%
Grassland2.9% (13.5)2% (9.2)1.3% (6.3)81.3% (380.6)12.5% (58.4)100%

