1. Introduction
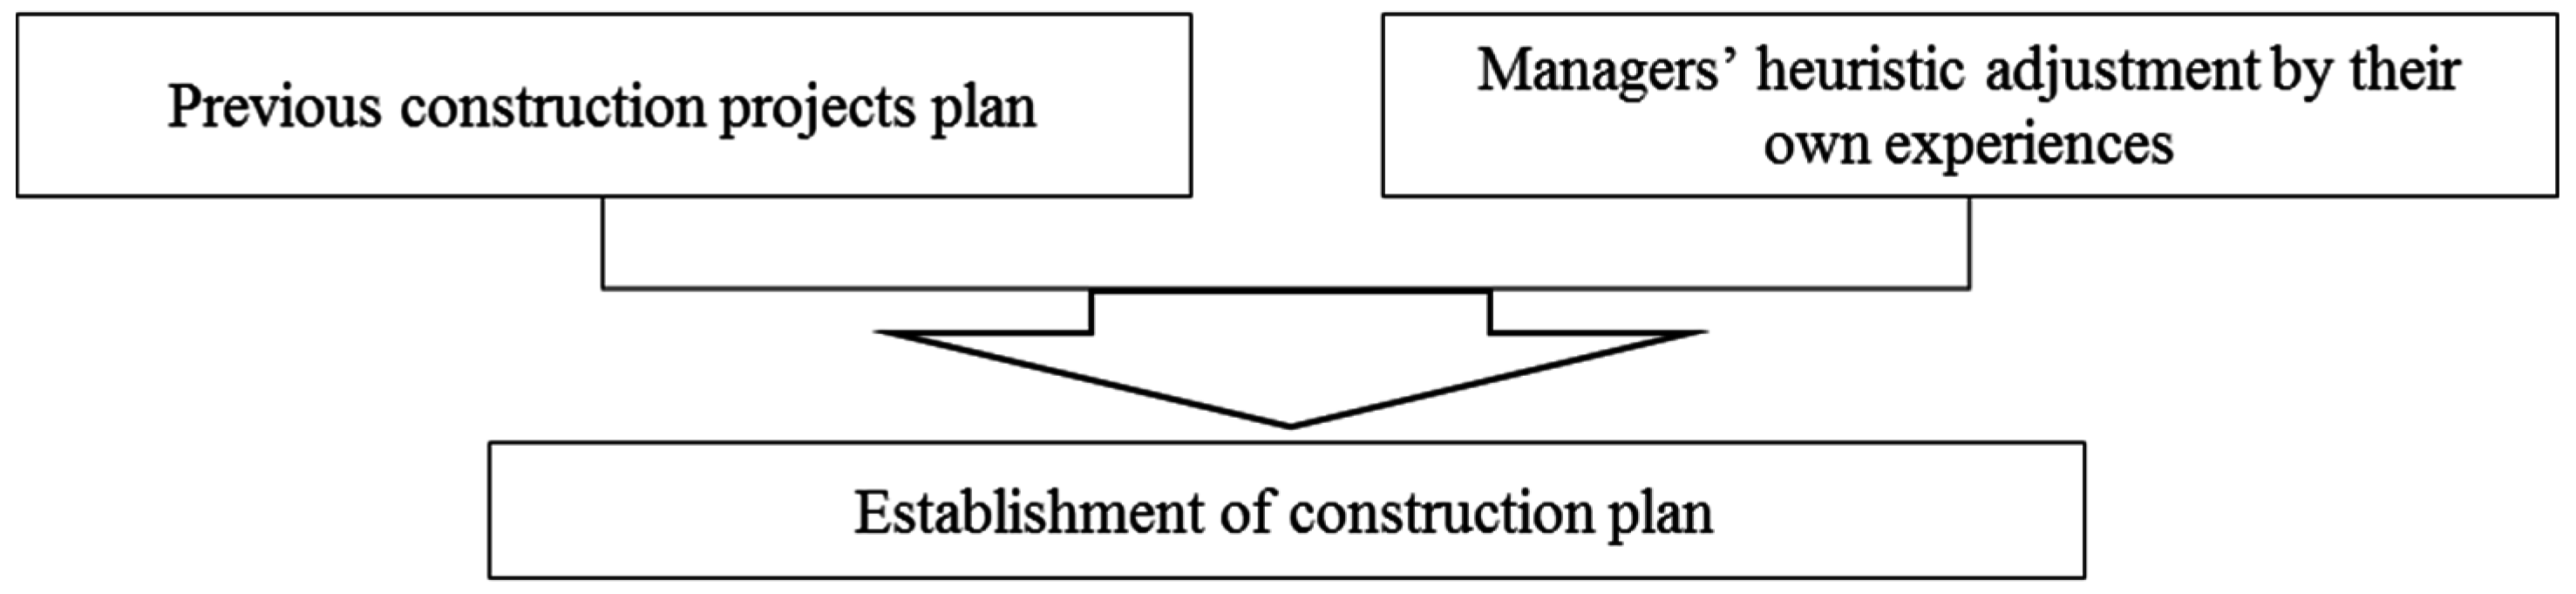
Due to the increasing size and complexity of construction projects, traditional construction planning is no longer sufficient for producing workable plans that incorporate all necessary project details, such as design complexities, learning curves, and the coordination process. Such traditional construction methods require construction managers to utilize data from previous projects and make heuristic adjustments to establish on-site construction plans. However, with the radical shifts now being seen, construction planning that refers to previous projects’ data cannot ensure the predicted level of productivity. Since construction projects have become more complex [
1], managers’ heuristics cannot encompass all of the necessary managerial and operational details. On-site work now suffers from constant modifications and changes to project conditions [
2]. Such inadequate planning can result in delays [
3] and cost overruns stemming from on-site operational problems.
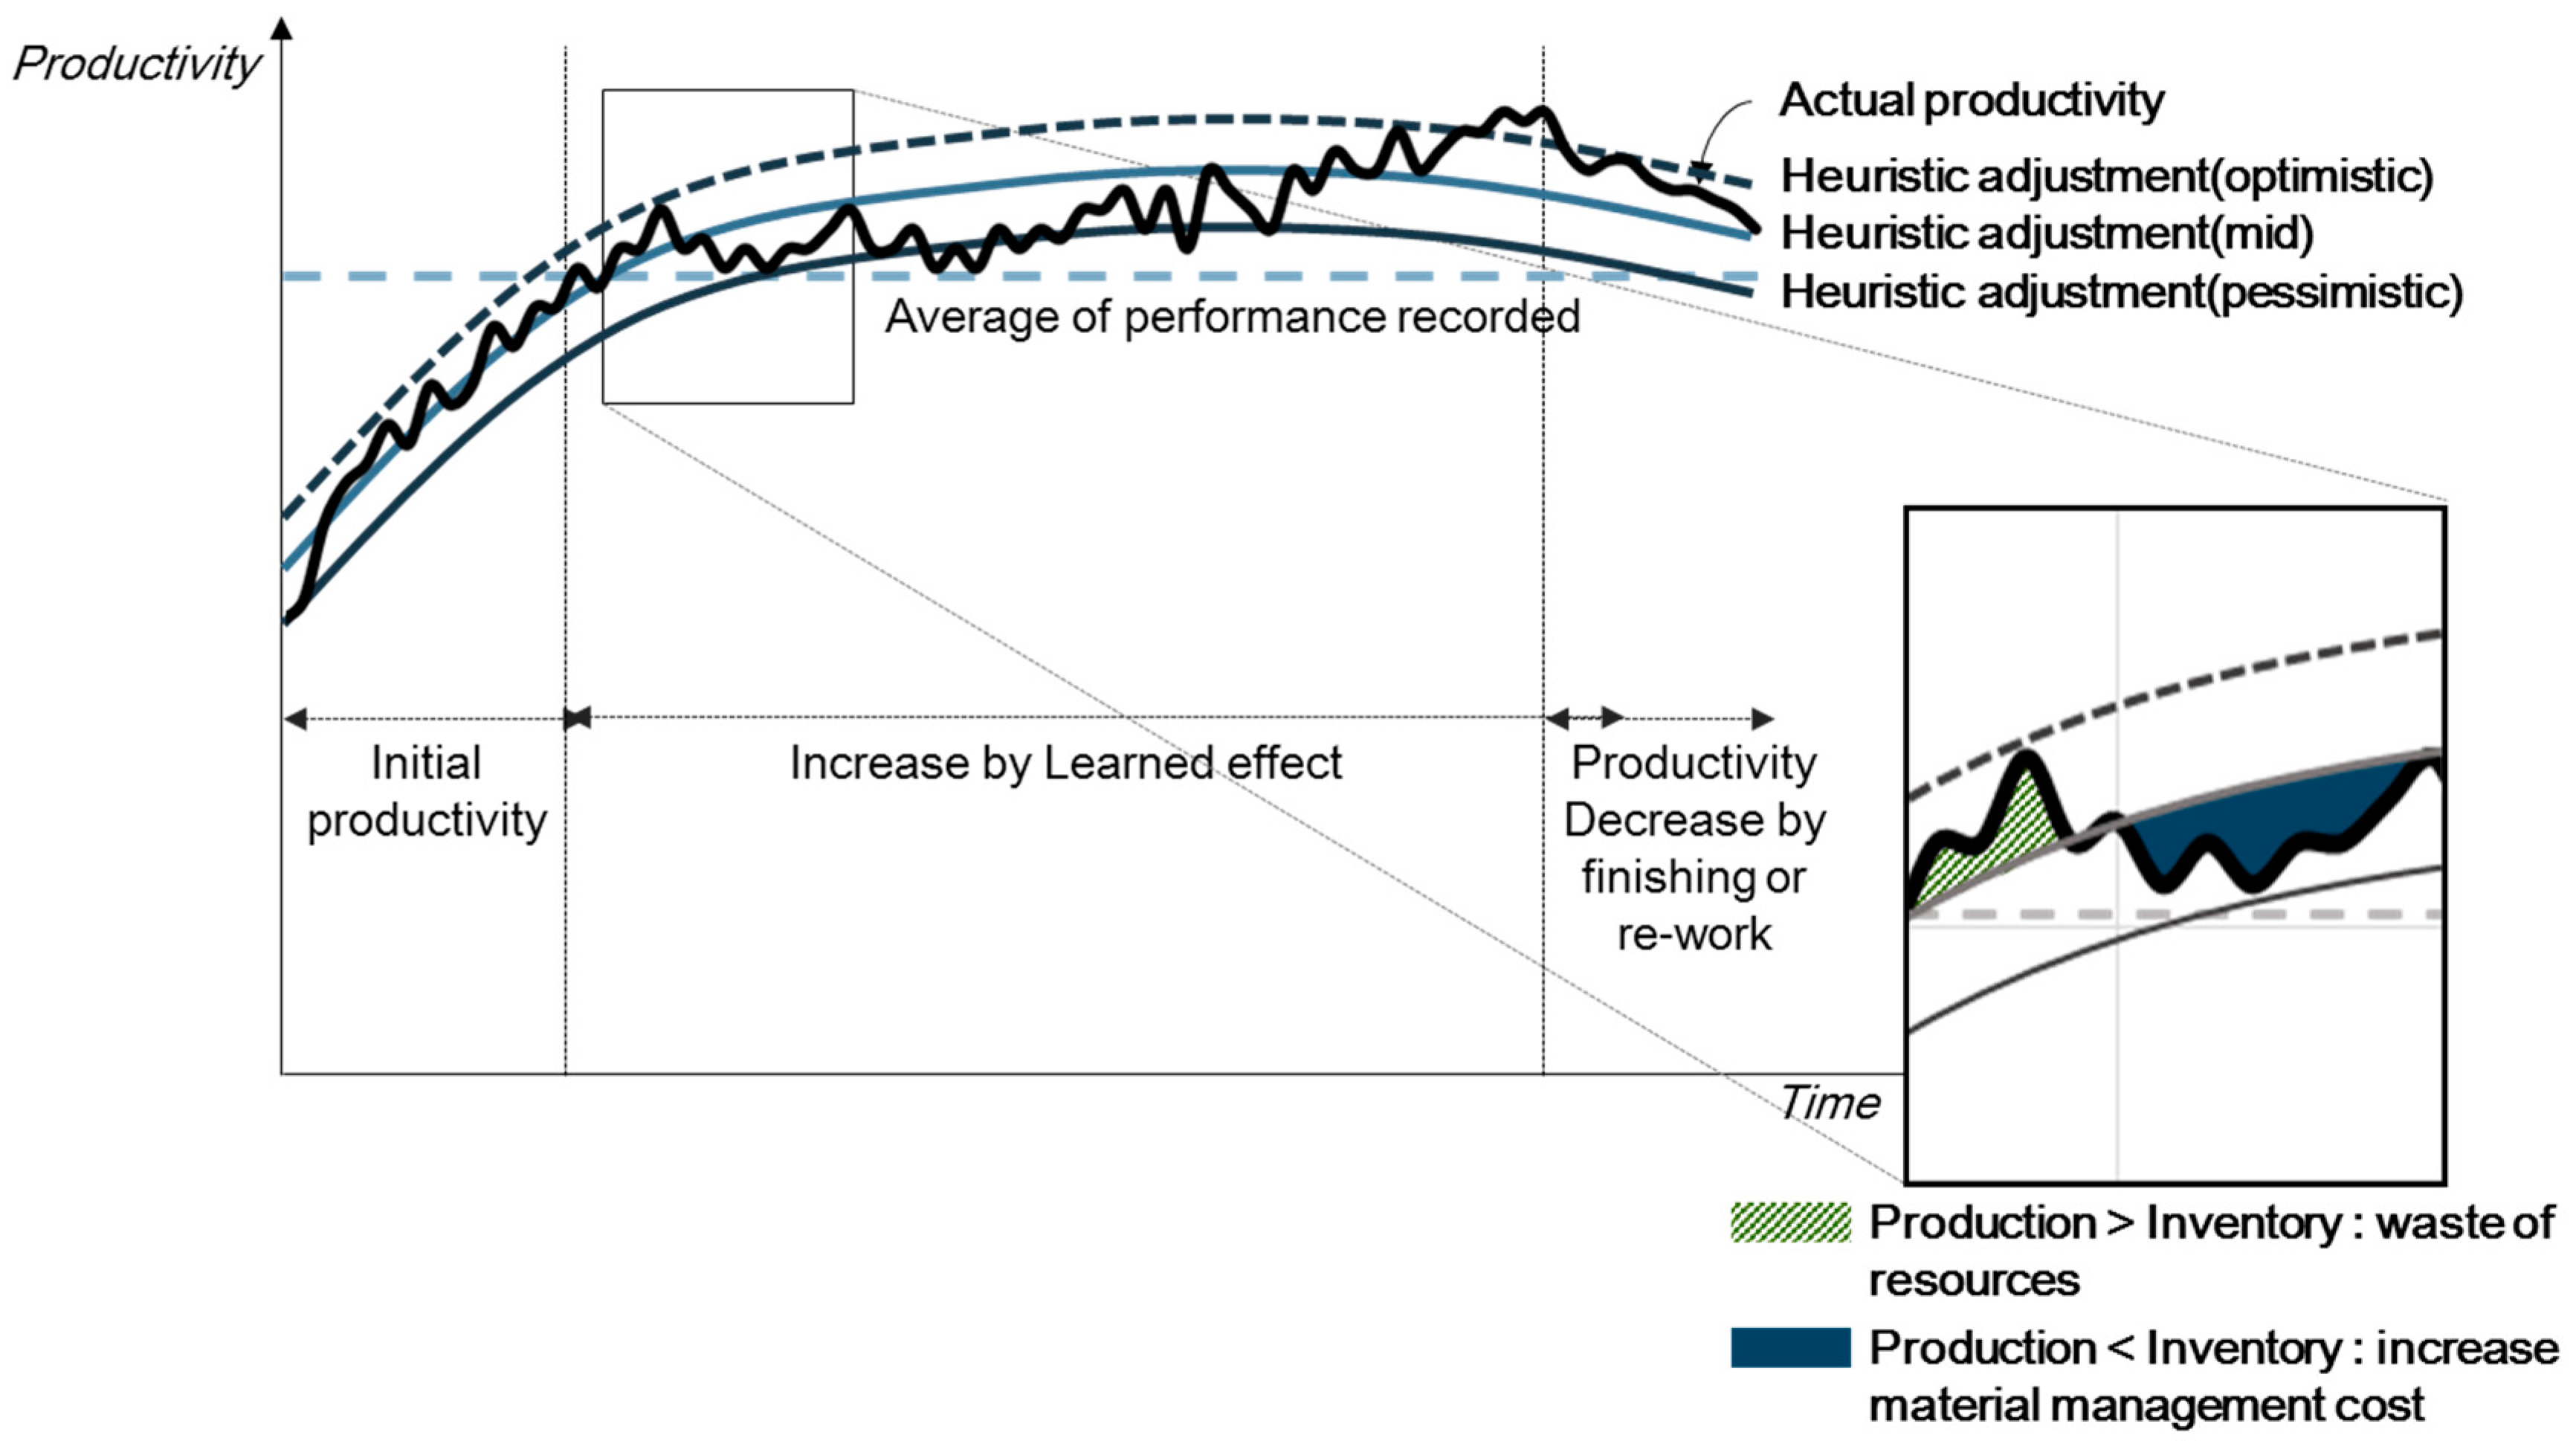
This variability between planned and actual performance results in managerial inefficiency and, ultimately, lower-quality outcomes. Such differences lead to the supply of materials not coinciding with demand on the construction site; construction managers must then wrestle with an excess or lack of materials. If the actual performance is greater than expected, materials become scarce and labor and equipment are wasted. On the other hand, if the actual performance is lower than expected, materials become excessive; construction costs then increase due to interest accrual and inventory management. Thus, reliable planning is extremely important to managerial efficiency and waste reduction. However, since construction projects are inherently dynamic and complex, the work productivity on site can vary daily, according to the type and number of mitigating factors [
4,
5]. Productivity dynamics can proliferate such variations between planned and actual production, resulting in an exacerbation of on-site problems.
Since productivity on construction sites is dynamic, it is challenging to develop sufficiently reliable construction plans. Each construction project is unique and complex. First, projects include numerous risks and uncertainty [
6]. For instance, developments differ in location, design, level of skilled labor required, and team composition. The newness of the construction environment also adds unknowns to the execution process, so that planning based on historical data cannot guarantee the expected performance. This persistent newness results in frequent modifications to the planned schedule. Also, a variety of operational and managerial factors influence productivity. Construction work involves multiple processes and the complex interactions of a wide variety of components that are connected by nonlinear relationships [
5]. Moreover, since a construction project involves numerous stakeholders (including owners, designers, contractors, and the government), coordination of all of the relevant participants can be challenging [
7]. Finally, construction projects operate under numerous constraints, in dynamic environments, and require the coordination of multiple tasks [
8]. Such complexity adds unpredictability, and prudent planning is required.
Reliable predictions of productivity at the operational level minimize uncertainties, facilitate efficiency, and decrease waste in terms of time, cost, and materials. However, “construction companies still lack the ability to properly plan, estimate, and execute projects in a consistent, efficient, and reliable manner” [
2]. Existing planning and control techniques are insufficient for predicting reliable and adequate on-site performance. However, computer simulations can be used to improve a plan’s reliability, by explicitly incorporating performance factors and mutual causal relationships. Such simulations can be utilized to quantify and validate the efficiency of the construction process [
6]. In addition, simulation models represent the: (1) overall logic of the multitude of activities required to construct a building; (2) resources involved in performing the work (e.g., labor, equipment, management, etc.); and (3) environment in which the project is being built (e.g., site conditions, labor pool, market situation, etc.) [
9]. Using computer simulation tools allows construction managers to build consistent plans that consider critical productivity factors.
Furthermore, computer simulations automate the planning process, allowing for the integration of Building Information Models (BIM) that contain all of the information necessary for development. BIM design applications are more than just design tools; most BIM design applications also interface with other applications, allowing for energy analyses, cost estimations, and so on [
10]. With the increasing amount of information available and BIM’s improved process annotations, information visualization has become central to the overall construction process [
10]. In this context, integrating construction operation simulations with BIM would facilitate time and cost efficiency, and generally streamline the process.
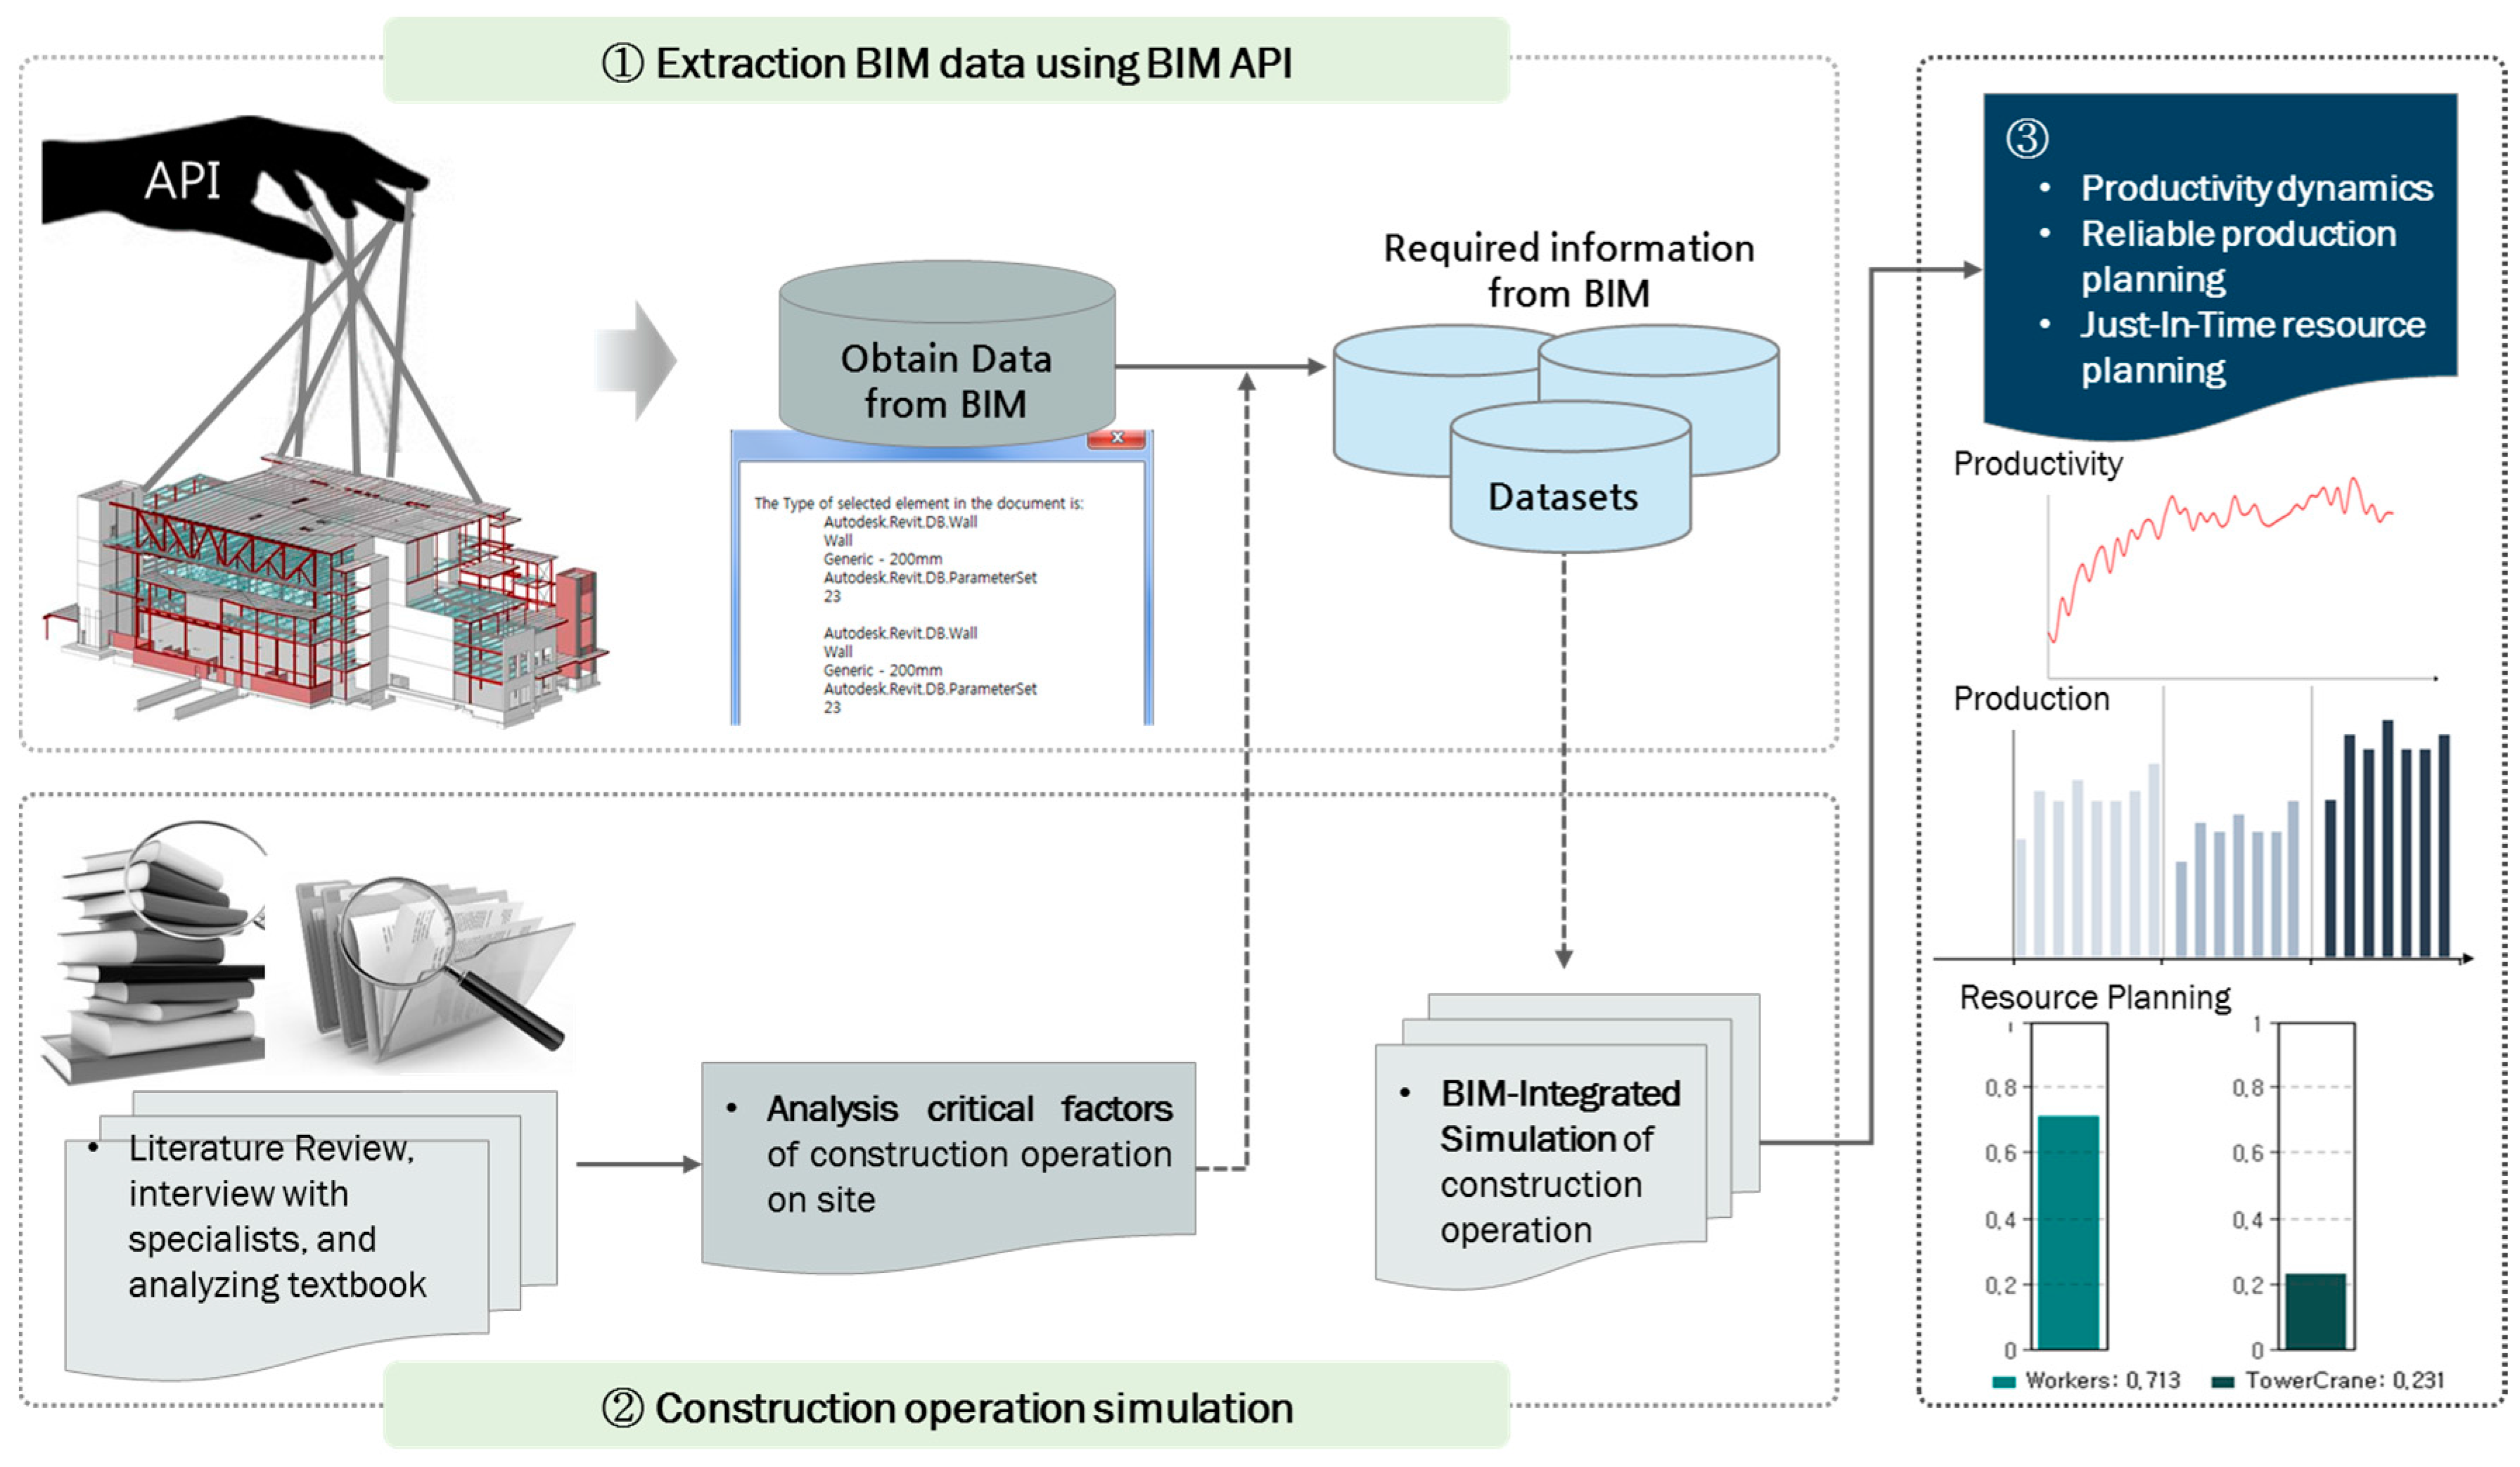
In this regard, our research developed a BIM-integrated simulation framework for predicting reliable productivity dynamics by considering the factors that affect productivity at the operational level. Our BIM-integrated planning framework alleviates the difficulties that currently plague reliable construction planning, and allows for managerial efficiency as well as technical advancement. Above all, since BIM is a digital representation of the functional and physical characteristics of a building [
11], it allows for the early incorporation of the unique characteristics of a building into the planning process. Also, since simulation models represent the comprehensive production process, including the dynamic and complex interaction of sub-processes [
12], our framework allows us to synthetically consider diverse factors and repeatedly run construction project in a virtual space, without risk. In the BIM-integrated simulation framework suggested here, simulations were fed data on the building elements that had already been generated by the BIM tool. The complete simulation performed the construction operation in a virtual world, and generated accurate forecasts of productivity dynamics that were more reliable than those developed by traditional methods.
2. Literature Review
This chapter reviews current studies on the use of computer simulation in construction, lean construction practices, and BIM applications used in our BIM-integrated simulation framework for Just-In-Time production planning. First of all, whereas computer simulation techniques can now be combined with advanced tools to analyze construction projects, difficulties with modeling simulations and unreliable data usage continue to inhibit the application of simulations in the construction management field. Additionally, while the construction industry has improved in many ways ranging from management practices to technical developments, to apply lean principles, lean construction should be emphasized (including all parties along the supply chain). While BIM’s benefits to the construction industry are clear, its utilization in the construction management domain remains narrow.
2.1. Computer Simulation in Construction
Increasingly, simulation models are being used as problem-solving and decision-making tools in many industries, especially manufacturing [
13]. Simulation has also long been an established method for analyzing both production and logistics [
14]. Particularly, the manufacturing industry has successfully implemented simulations to improve production processes [
15]. The popularity of simulation stems from its ability to make models of complex systems [
16]. Simulations offer realistic representations of the interactions among a variety of systems’ diverse components [
16]. Despite these advantages, in the construction industry, the use of simulation for planning purposes has been largely limited to academic research. This is because simulation modeling is a time-consuming and error-prone process [
12,
17,
18].
Certain researchers have argued that 4D simulations should be considered appropriate for use in the construction industry. However, 4D simulations only allow for the visualization of construction schedules [
19]. In this research, we used 4D models instead of 4D simulations; references to “simulations” should be understood as including discrete-event simulations, system dynamics, agent-based simulations, and multi-method simulations. Currently, schedules used to establish 4D models are created via traditional construction planning methods, using historical data and heuristic adjustments. Thus, 4D models cannot offer either optimal or reliable plans; they remain on the level of visualization, not planning. If schedules are not developed in a reliable manner, construction managers can only use 4D models as visual communication tools and not as facilitators of planning, analyzing, and decision-making. To address the current limitations in this area, we have employed computer simulations as a means of developing construction plans and providing reliable schedules to 4D models.
There has been a substantial body of research on applying computer simulation technology to the construction field. The first simulation approach developed in this area was called CYCLONE [
20], which can be used to model simple cyclic networks. For example, micro-CYCLONE simulations were used to analyze concrete batch plant operations according to resource combinations and distances [
21]. However, this system was too simple to accurately model recourses, and thus tended to manipulate them in the model [
9]. Then, with the development of object-oriented process simulation, simulation tools were improved to create more practical models with better user interfaces and the flexibility to adjust the model’s scope; as a result, reliability improved. AbouRizk and Hajjar [
22] introduced Simphony as a simulation language. Exploiting the possibilities of this new simulation tool, researchers suggested a production-based framework using simulations to establish ideal project execution plans; they also discussed the requirements for extending the scope of such simulations [
2]. Subsequently, researchers have attempted to integrate simulation technology with other tools [
9]. One example was the integration of 3D-CAD (Computer-Aided Design) with computer simulations to support decision making during construction [
23]. Other researchers used discrete-event simulation for planning by designing construction operations and then visualizing the simulated operations in 3D [
24]. With the advancements that have been made with modeling tools, the potential applications of computer simulation have increased [
9]. For instance, simulation models can now simulate and analyze construction operations, and then support construction scheduling. Ultimately, they can predict the utilization of resources and identify logistics bottlenecks [
25].
However, to utilize computer simulations in the construction industry, we first need to solve limitations such as difficulties with modeling from simulations and unreliable use of data. This research is an effort to minimize the effects of these limitations and convince practitioners of the merits of using simulations in the construction industry. If researchers built standard simulations of each construction operation’s work, practitioners could use those simulations for planning by only modifying the parameters salient to the particular project. Additionally, by using BIM-provided information and integrating BIM with simulations, the reliability of the simulation’s data usage would be greatly improved. Therefore, this research suggests a new methodology for establishing reliable construction plans via a convenient and practical BIM-integrated simulation framework.
2.2. Lean Construction
Lean production, which tries to eliminate any waste of materials, time, or effort from a production process, was developed by Toyota (a Japanese car manufacturing company) [
26,
27]. It stemmed from the need to create a system of production that responded to customers’ orders (i.e., not mass production). This approach greatly increased Toyota’s productivity. Consequently, many industries have attempted to adopt the concept. In the construction industry, lean production was introduced in the mid-1990s [
27]. The major aims are the minimization of waste and maximization of value. Various tools, methods, and techniques are employed to accomplish these goals. Applying lean thinking to the construction field has led to the development of a variety of planning and control systems [
28]. For example, Mao and Zhang [
3] established a construction re-engineering process that combines lean principles and computer simulation techniques. Based on such principles, their research classified construction activities into conversion and flow activities instead of the value-added/non-value-added classification system that was standard; the resulting re-engineering process avoids confusion in classification [
3]. In this context, the application of lean principles in the construction field can improve the efficiency of construction planning.
The most important lean principle is the minimization and eventual elimination of wasted time, money, equipment, etc. [
29,
30]. On construction sites, there are many kinds of waste, such as the time crews spend waiting to begin a project or reworking incorrectly completed tasks, and inefficient handling of materials, inventory and workspace [
28]. According to parade game theory [
31], these types of waste increase with variations in flow, which in construction affects the entire supply chain. Specifically, variations in the actual and expected outcomes result in the need for buffers to manage variability in orders. However, buffers mean wasted resources spent on management and control, even when the buffers are not absolutely necessary. These, the buffers increase the production cycle and extent of the project’s duration and budget [
31,
32]. If managers fail to reliably predict production in the field, they cannot help but accept an excess or lack of stock. The alternative is to control their inventory by change-orders. As a means of preparing for this type of situation, suppliers employ some number of buffers to shield against change-orders. If this unreliable and unpredictable situation continues, participants along the supply chain cannot achieve suitable levels of cost- and time-efficiency; efficiency along the entire extent of the supply chain fails. Reliability in production allows all contractors to manage their work with a minimum of buffers, and implement Just-In-Time production. Reliable production achieves minimum waste by delivering the right quantity at the right time, maximizing the value for the client by minimizing cost overruns and duration extensions.
Reliable construction planning is essential to eliminating waste in construction projects. However, it is difficult to accurately predict the needs of a particular project, because of their inherent uniqueness and complexity. In addition, productivity cannot be predicted at a normal or static rate because it involves dynamic interactions and complicated variables that come together in a variety of complex systems [
33]. Productivity dynamics generated from new labor, a unique learning curve, or changes in the site’s conditions can all lead to waste. Therefore, construction managers should consider such variables when planning. To accomplish this goal, we developed a BIM-integrated simulation framework. This framework will assist in the prediction of productivity dynamics, contribute to minimizing inventory on site, and increase reliability with regards to orders. The result will be a decrease in buffers and a realization of the key principles of lean construction.
2.3. Application of BIM
BIM is a remarkable technology regularly employed in the Architecture/Engineering/Construction (AEC) industry [
34]. It was developed as a tool for engineers to use to generate and manage building information and facilitate three-dimensional design [
35]. BIM applications are rapidly becoming more common in the construction industry because they are useful for reducing cost and time, and enhancing project quality [
36]. The major merit of this technology is the visual enhancements it provides, which are useful means of facilitating communication among stakeholders. In addition to providing a means of visualizing 3D geometric expressions, BIM incorporates a variety of process data useful for analyzing constructability. Furthermore, in BIM, architectural design is integrated with energy simulations to efficiently and accurately apply simulation input [
34]. Geometric information is also integrated into structural simulations to analyze structural safety; detailed models are produced that reflect the uniqueness and authenticity of a building without excessive geometric simplifications [
37]. Likewise, BIM is utilized in many other aspects of construction, such as analyses of building energy, structure, and constructability.
Rapid improvements in BIM technology have made building performance evaluations easier and quicker to complete; for example, energy consumption [
34,
38] and structural design analyses [
37], and structural evaluations during construction [
39] use BIM data to obtain the details necessary for a thorough investigation of a building’s performance. Construction management also uses BIM to assist in visual communication among all key parties, the integration necessary to obtain new managerial knowledge, and automation that improves managerial efficiency. Yet in spite of these important uses, in the construction management field BIM data continue to be utilized for only simple and partial purposes. For instance, according to a study on project scheduling via the integration of BIM with construction process simulations [
1,
19], researchers only used BIM data to obtain the quantities of materials needed. Although quantity takeoff data is necessary when determining the duration of the construction process [
25], on its own it is not sufficient for reliable construction planning. Specifically, operational and managerial data are needed, such as workable hours, amount of skilled labor, level of difficulty, and so on.
5. Application for BIM-Integrated Simulation Method
In this section, we discuss the application of the BIM-integrated simulation method to a steel erection project, in order to examine the applicability of the method for actual construction projects. Steel erection is one of the most important processes on the construction site; it has critical effects on a project’s duration and cost. Consequently, steel erection work is one of the most actively-managed areas; accuracy is essential to reliable production planning. Therefore, by applying this method to steel erection work, we were able to validate the applicability of the method and minimize any excess money and time that would need to be spent on this step of the construction.
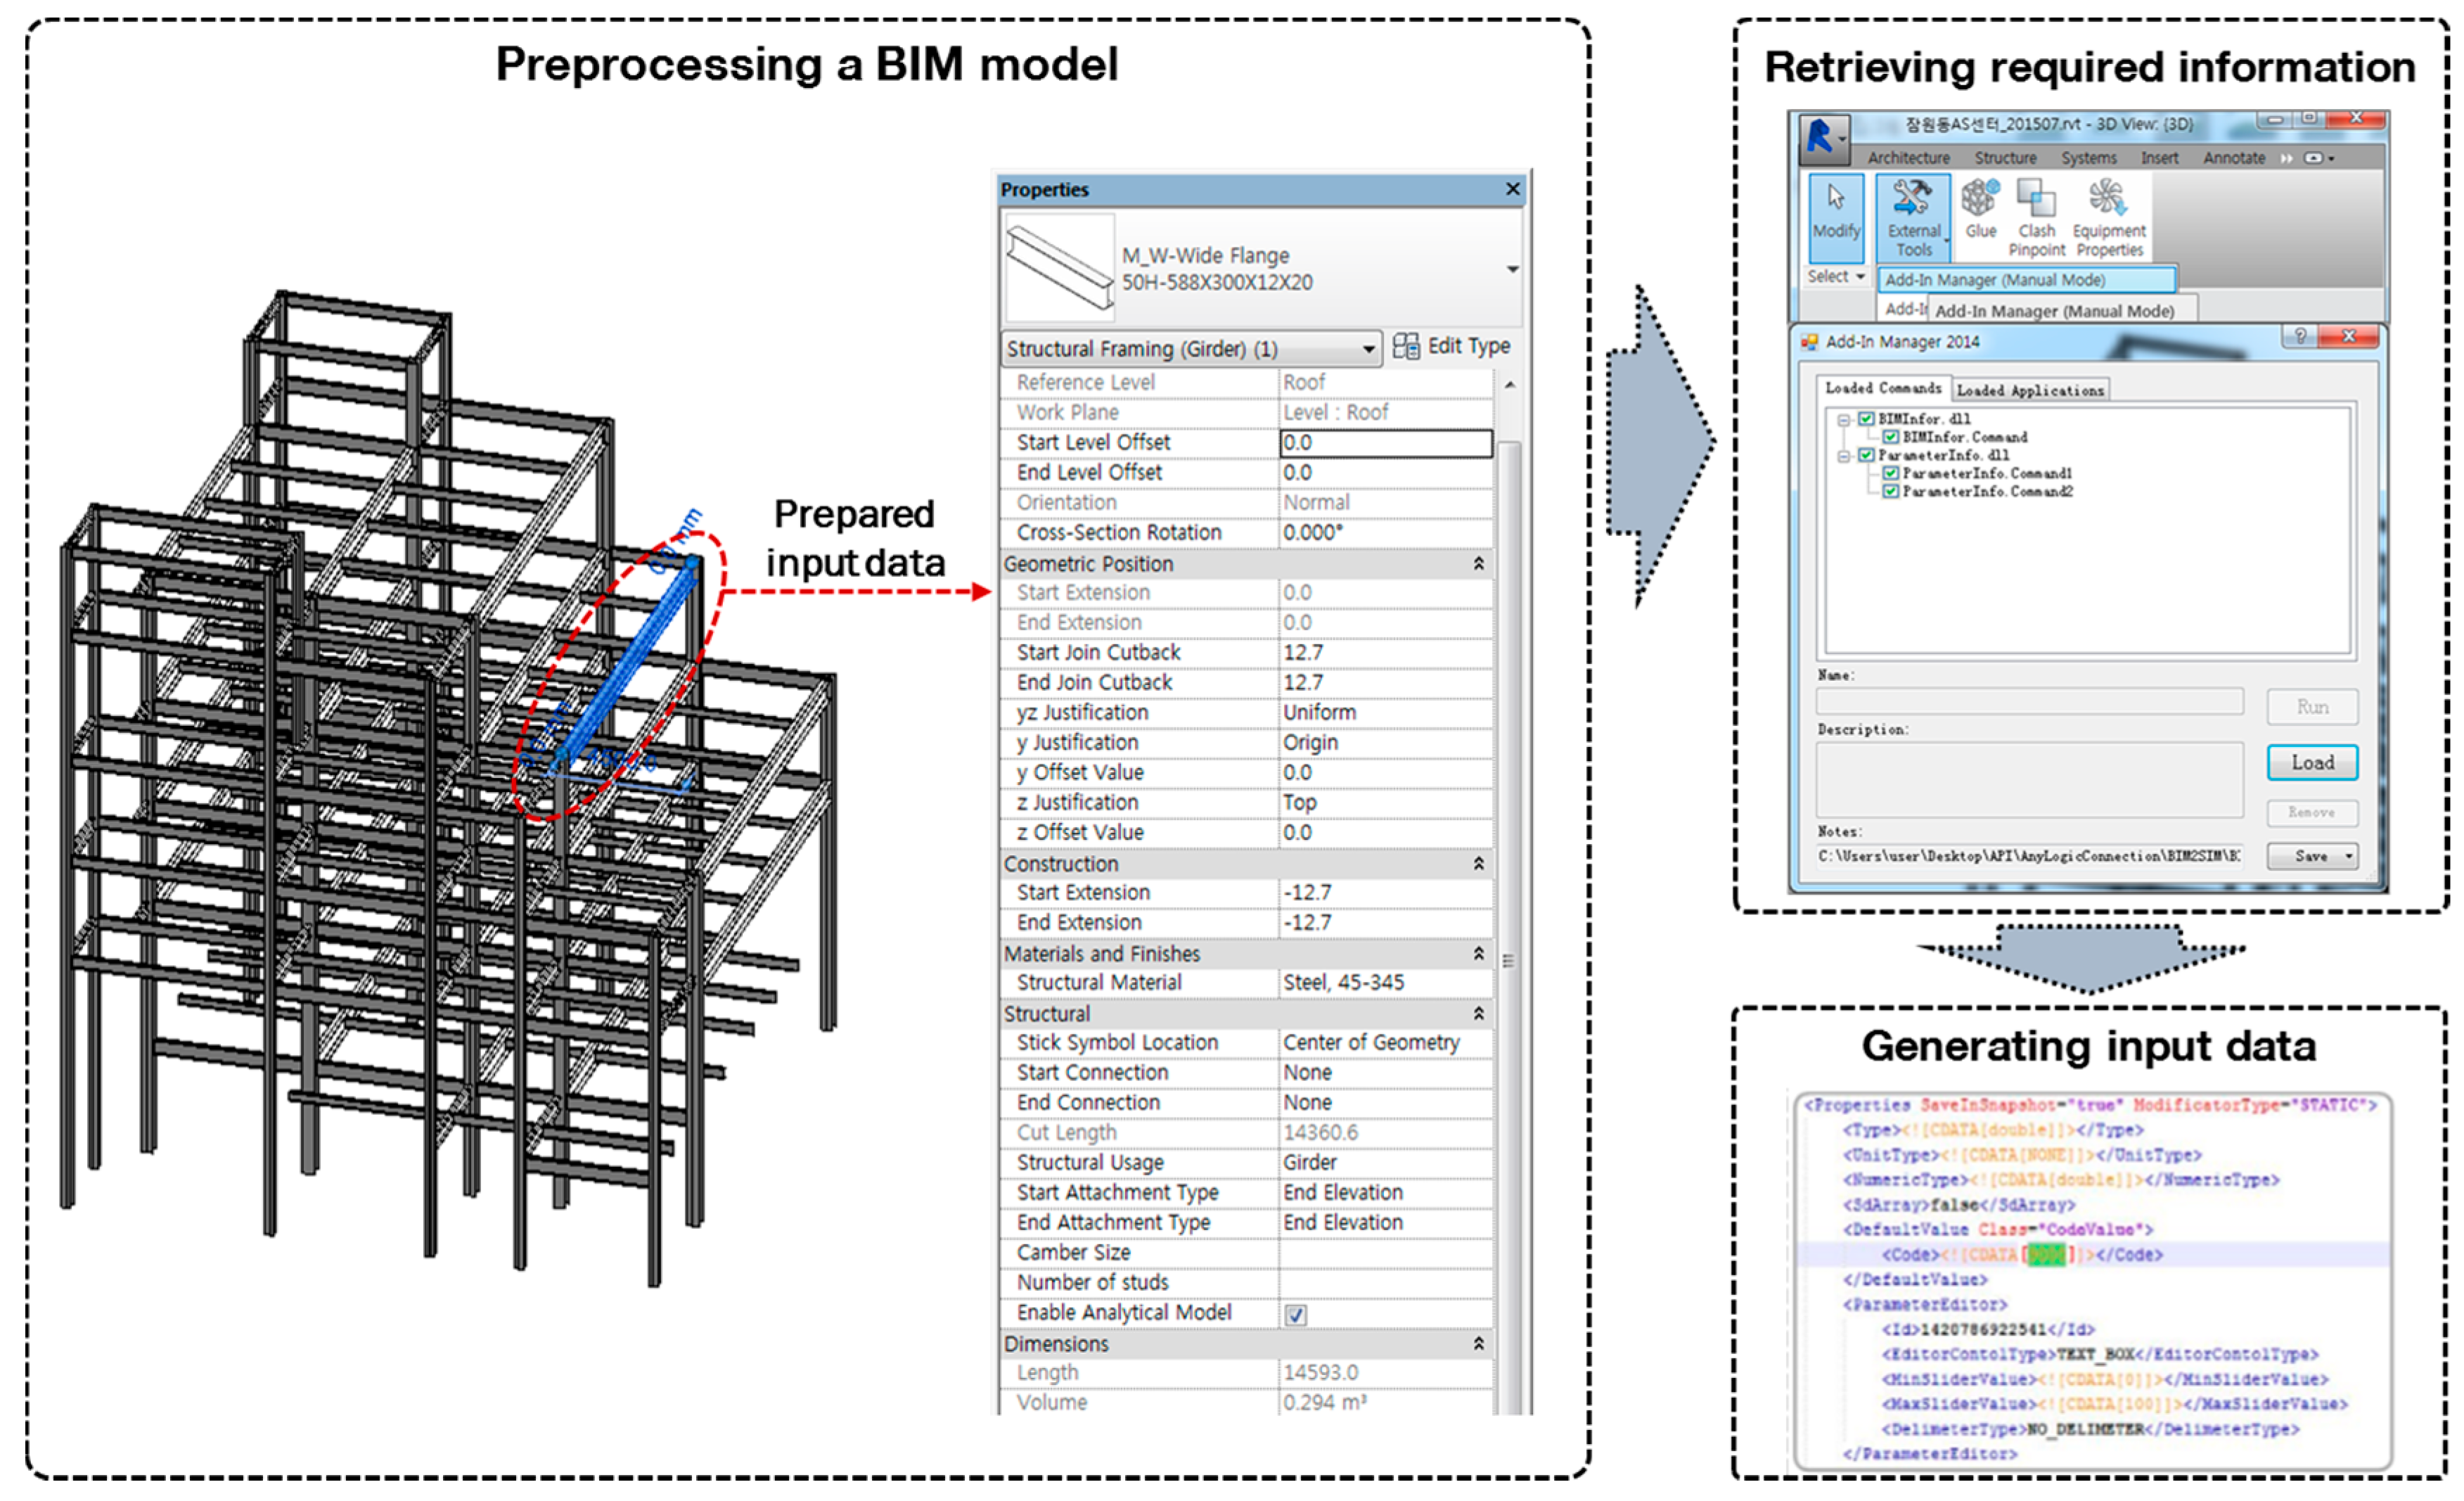
5.1. Preprocessing BIM Data Used for Planning
We prepared a steel-structure BIM model for an actual construction project in Seoul. The building’s area was approximately 390 m
2, and the site area was approximately 650 m
2. The building had a basement and four above-ground floors. The structure was steel-reinforced concrete. We only modeled the steel elements of the structure to test our method for steel erection work (see
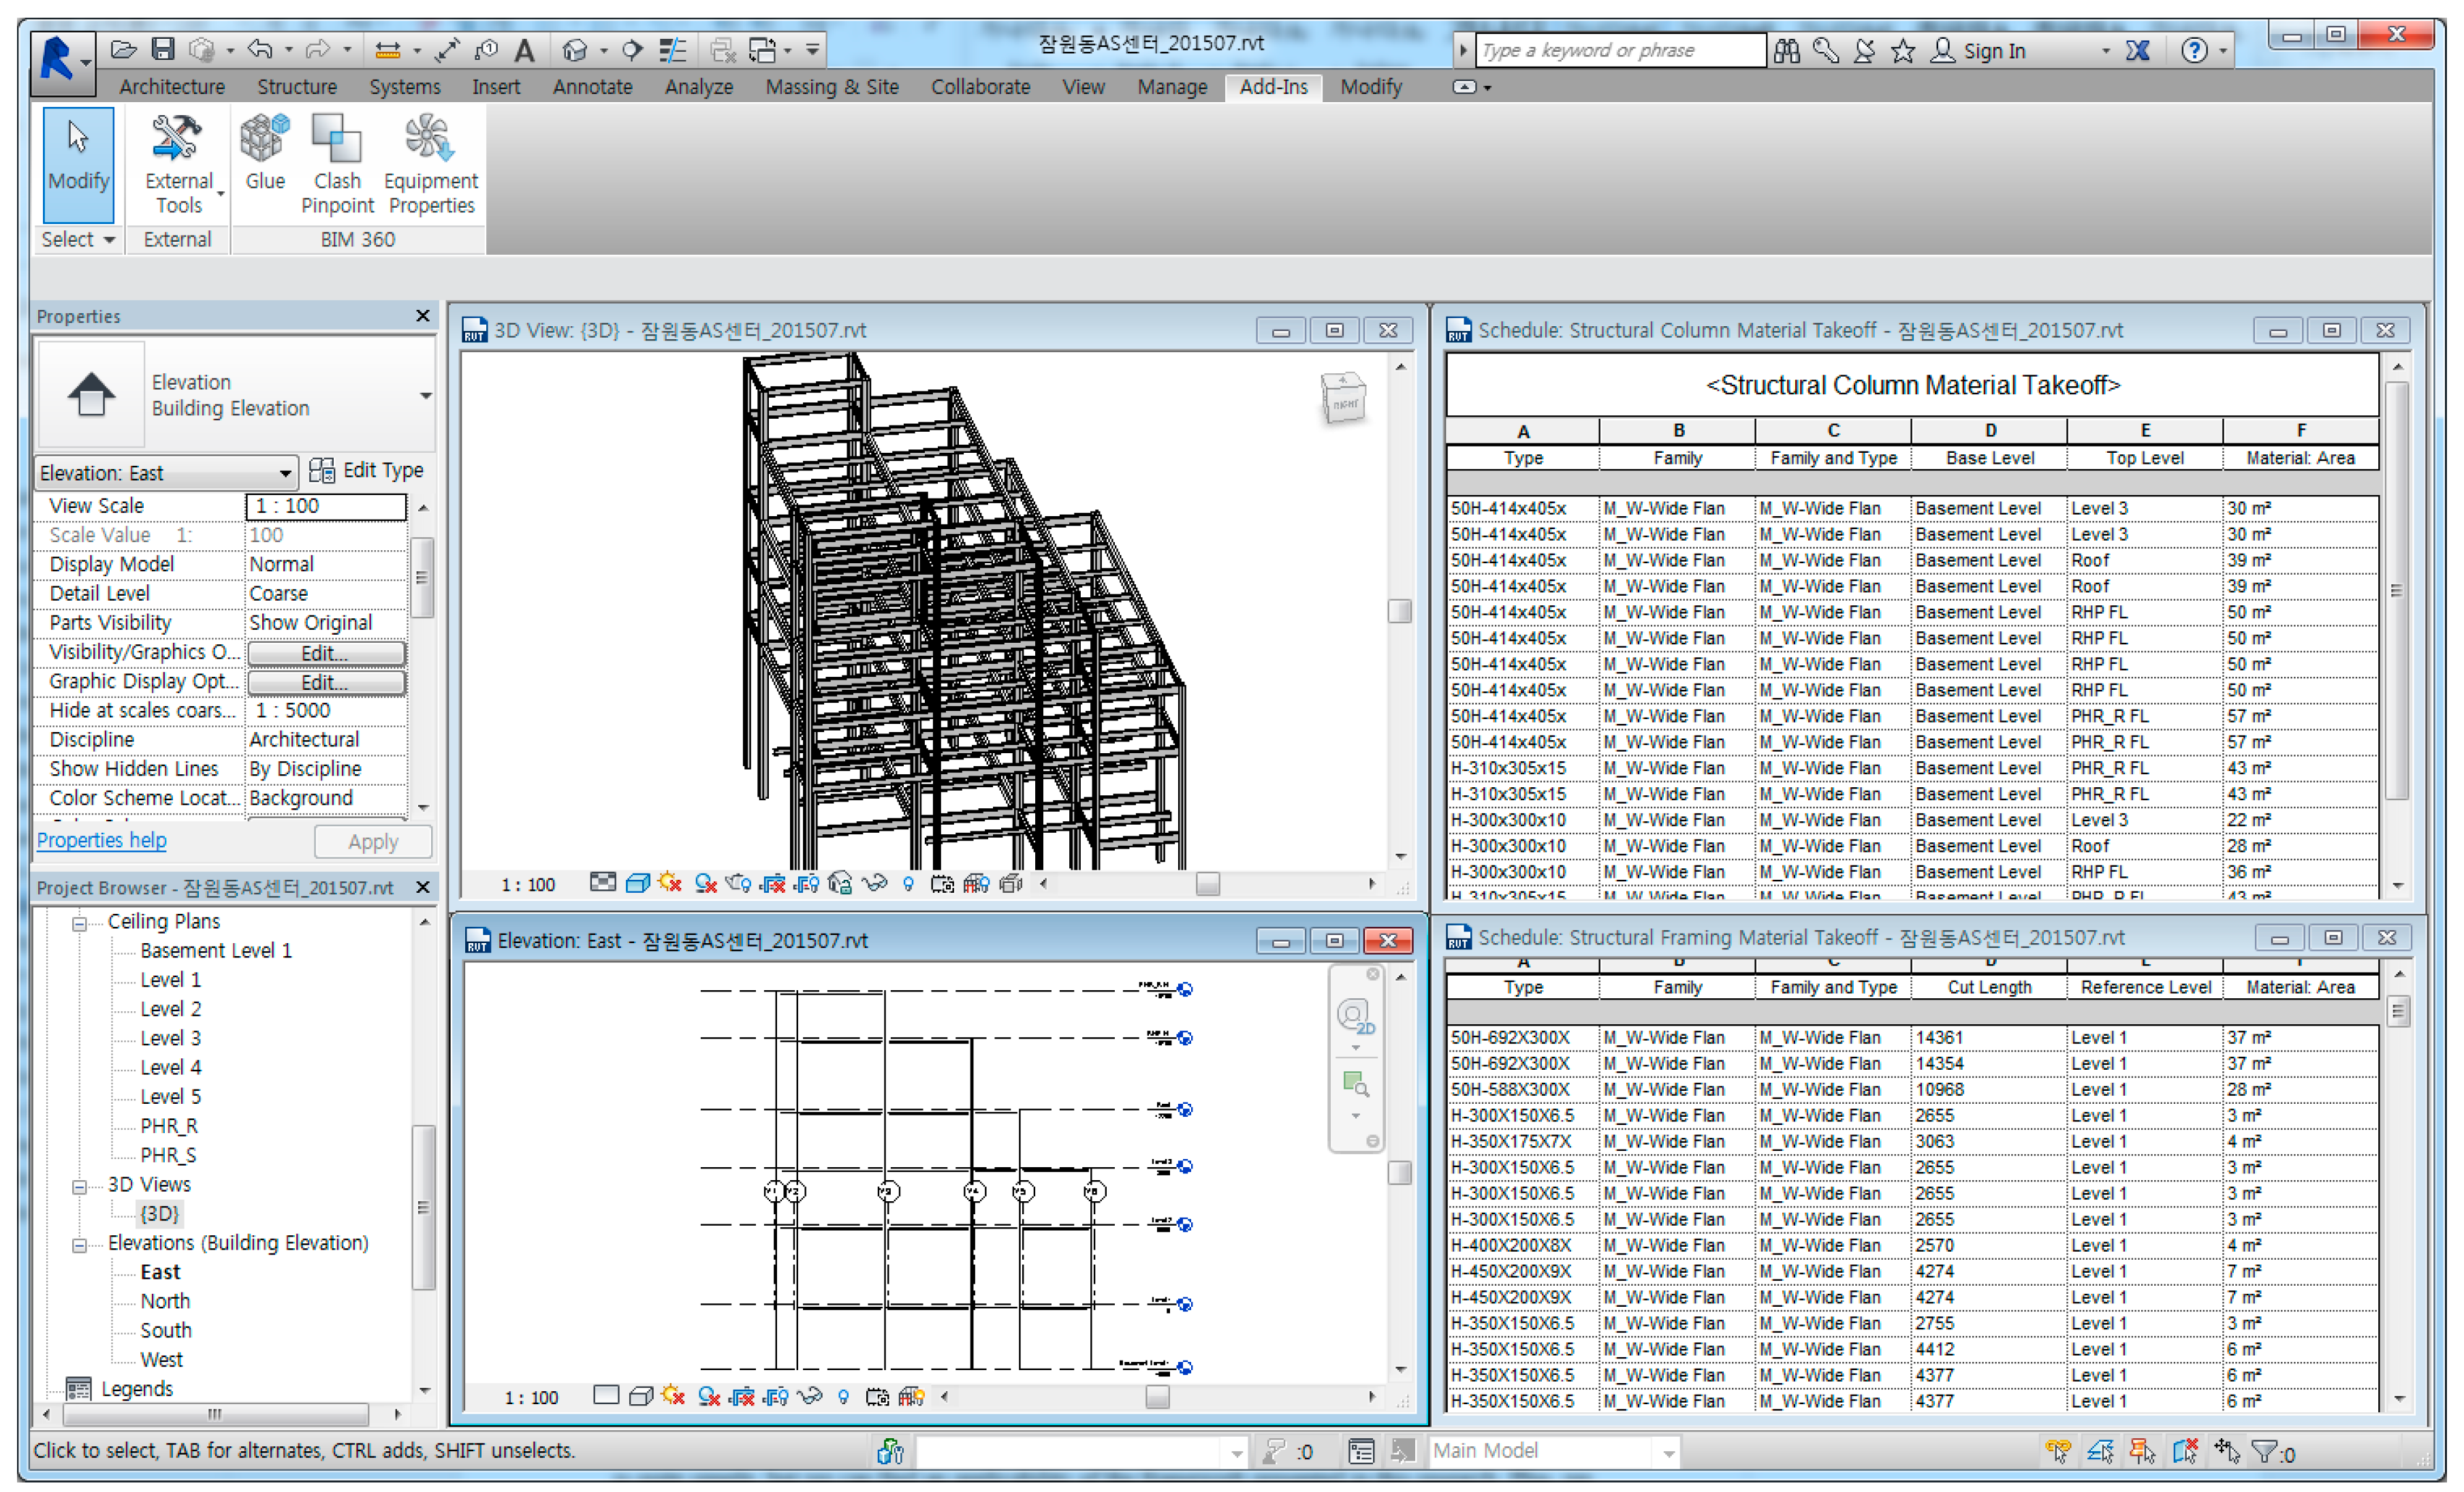
Figure 8). The BIM model offered all of the necessary information, such as the number of columns and beams, size, type of each material, geometric location, and so on. These data were then used for the construction simulation model.
5.2. Implementing Commands Using BIM’s API to Extract Building Information
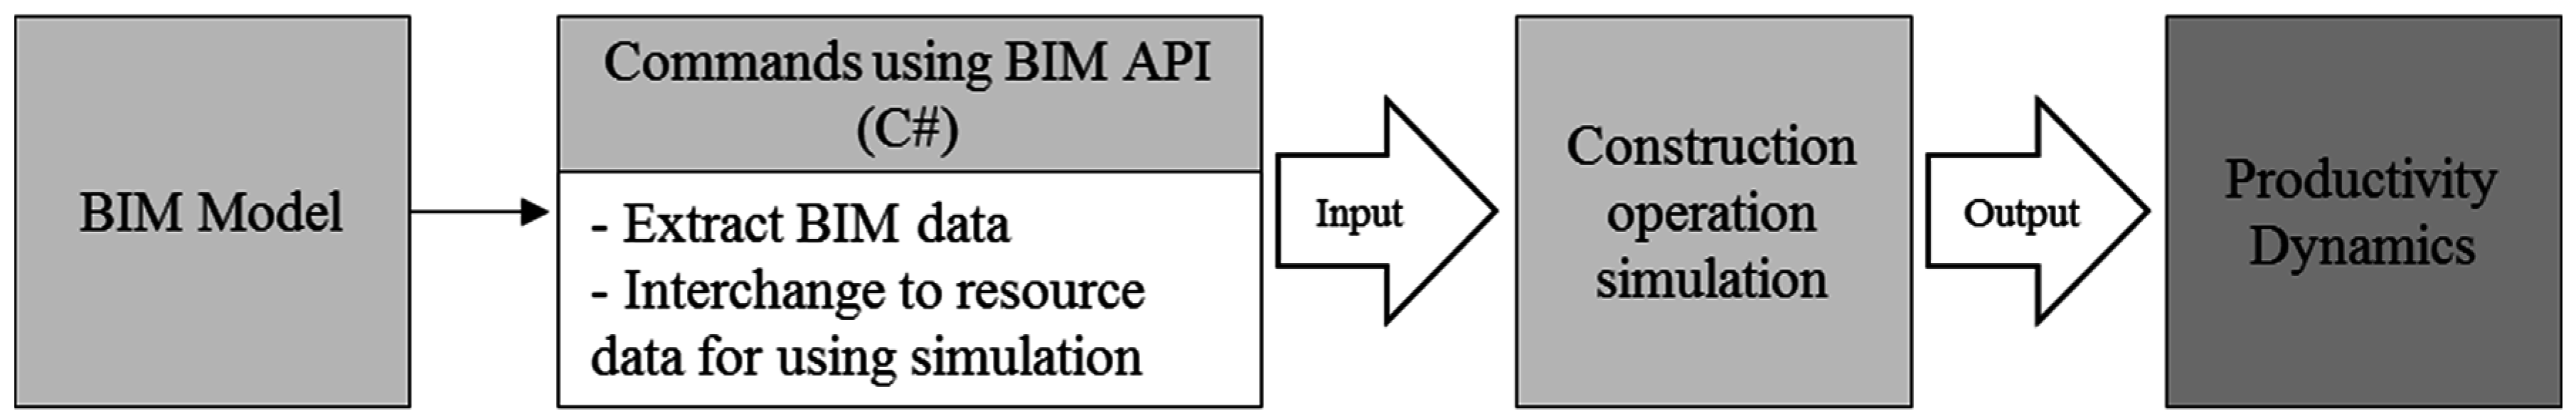
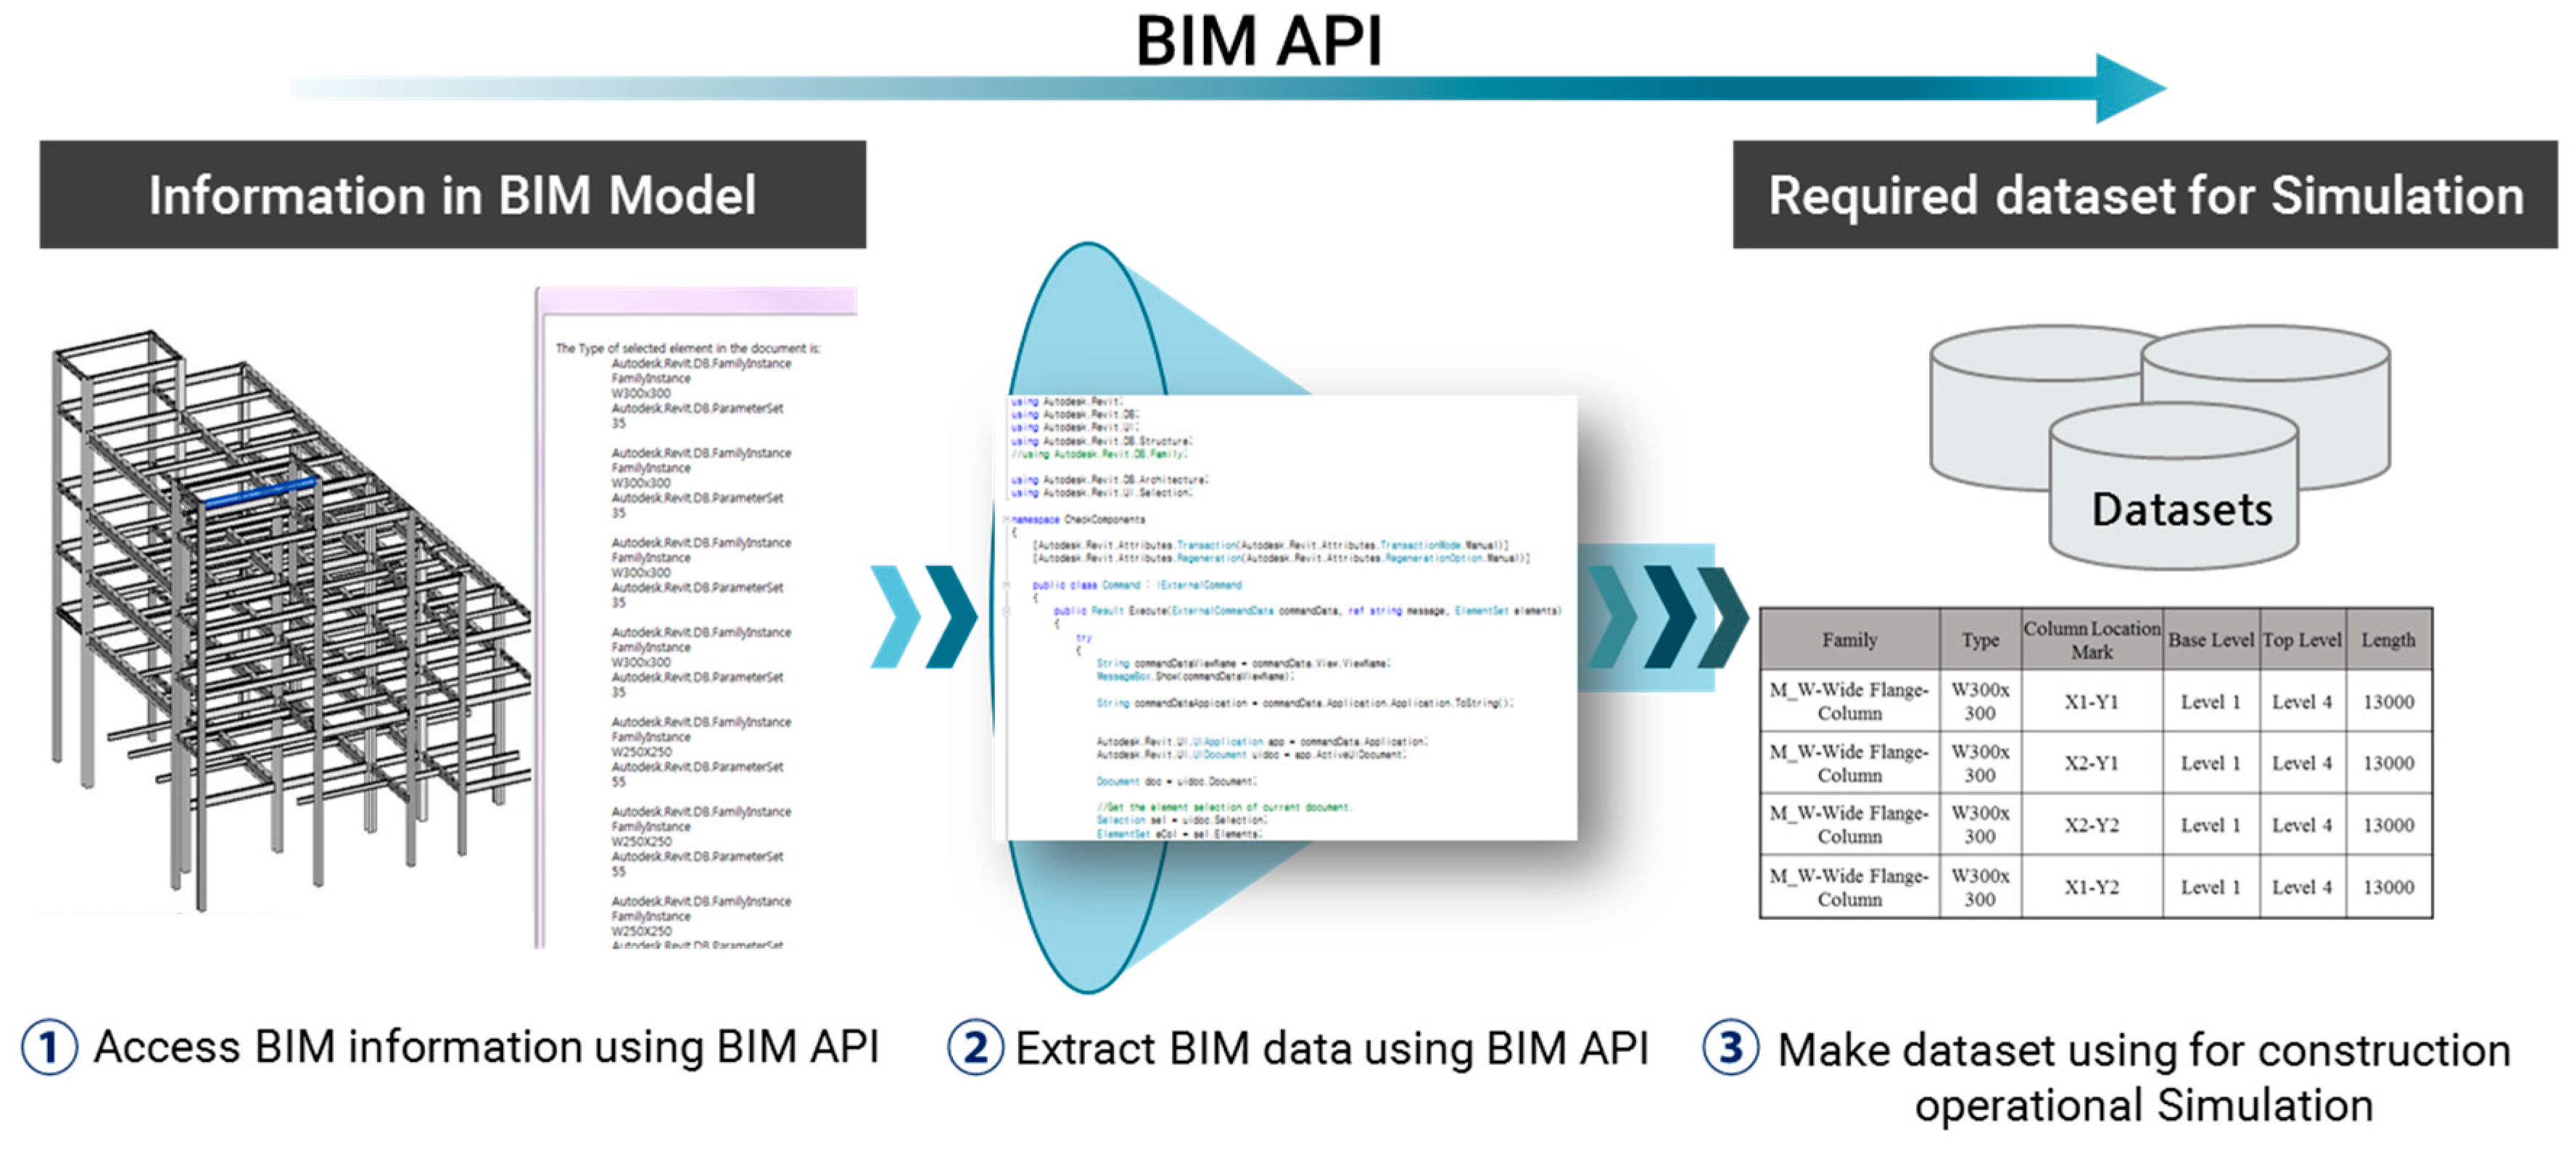
After preparing the BIM model, we developed commands using BIM’s API and the C# .NET framework languages; these commands were imported using the add-in tool from Autodesk Revit 2015. The commands allowed engineers to obtain the required information embodied in the BIM model. The commands translated the extracted building information into input resource data for use in the construction operation simulation. The procedures used to retrieve the building information can be found in
Figure 9. This process saved time, money, and effort that would otherwise have been needed to reproduce the building data already in the BIM model.
5.3. Development of the Construction Operation Simulation
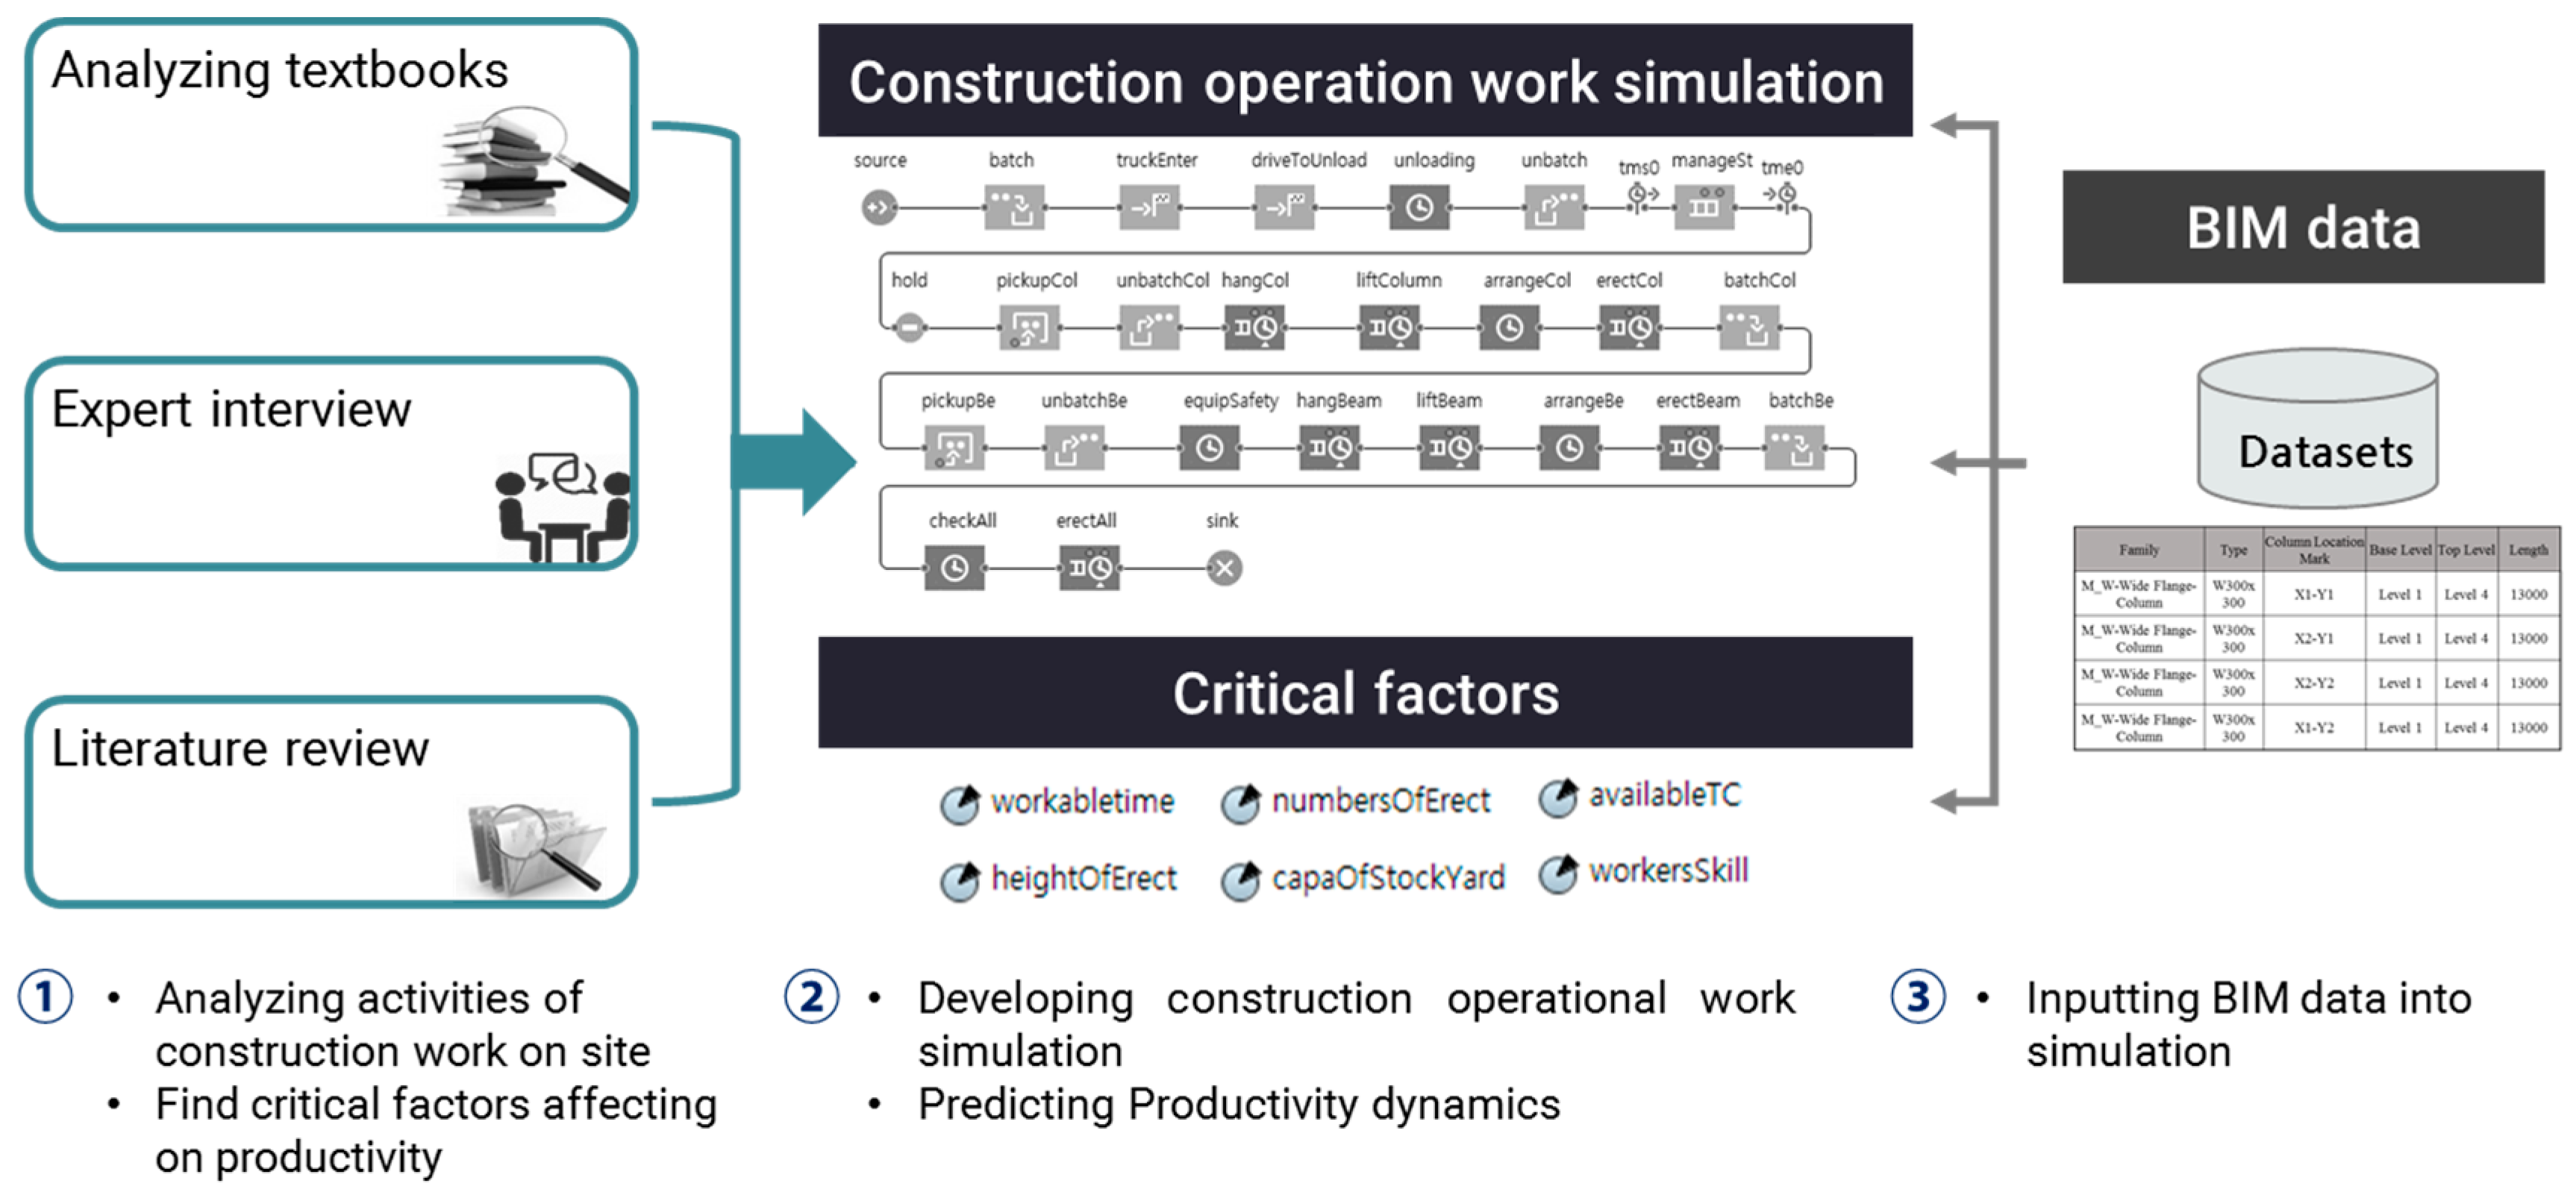
We composed a steel erection work simulation via a discrete-event simulation approach because steel erection work is generally performed as a sequence of events over time. However, we noticed that steel construction requires installed location factors such as height; thus, we interpreted steel to be a simple agent. We also conducted a literature review, expert interviews, and a textbook analysis to determine a reliable construction operation process and appropriately used the retrieved building data in the simulation environment. To properly express the steel erection work process, we first composed a simulation outline to serve as a blueprint. Then, we identified critical factors affecting work productivity by scrutinizing this type of work, interviewing experts, and reviewing the relevant literature. The Anylogic software was used to build the model. We arranged the simulation libraries and parameters into processes and resources, according to their properties. In the following section, we present our process for developing a steel erection work simulation on a construction site.
5.3.1. Composing the Simulation Outline
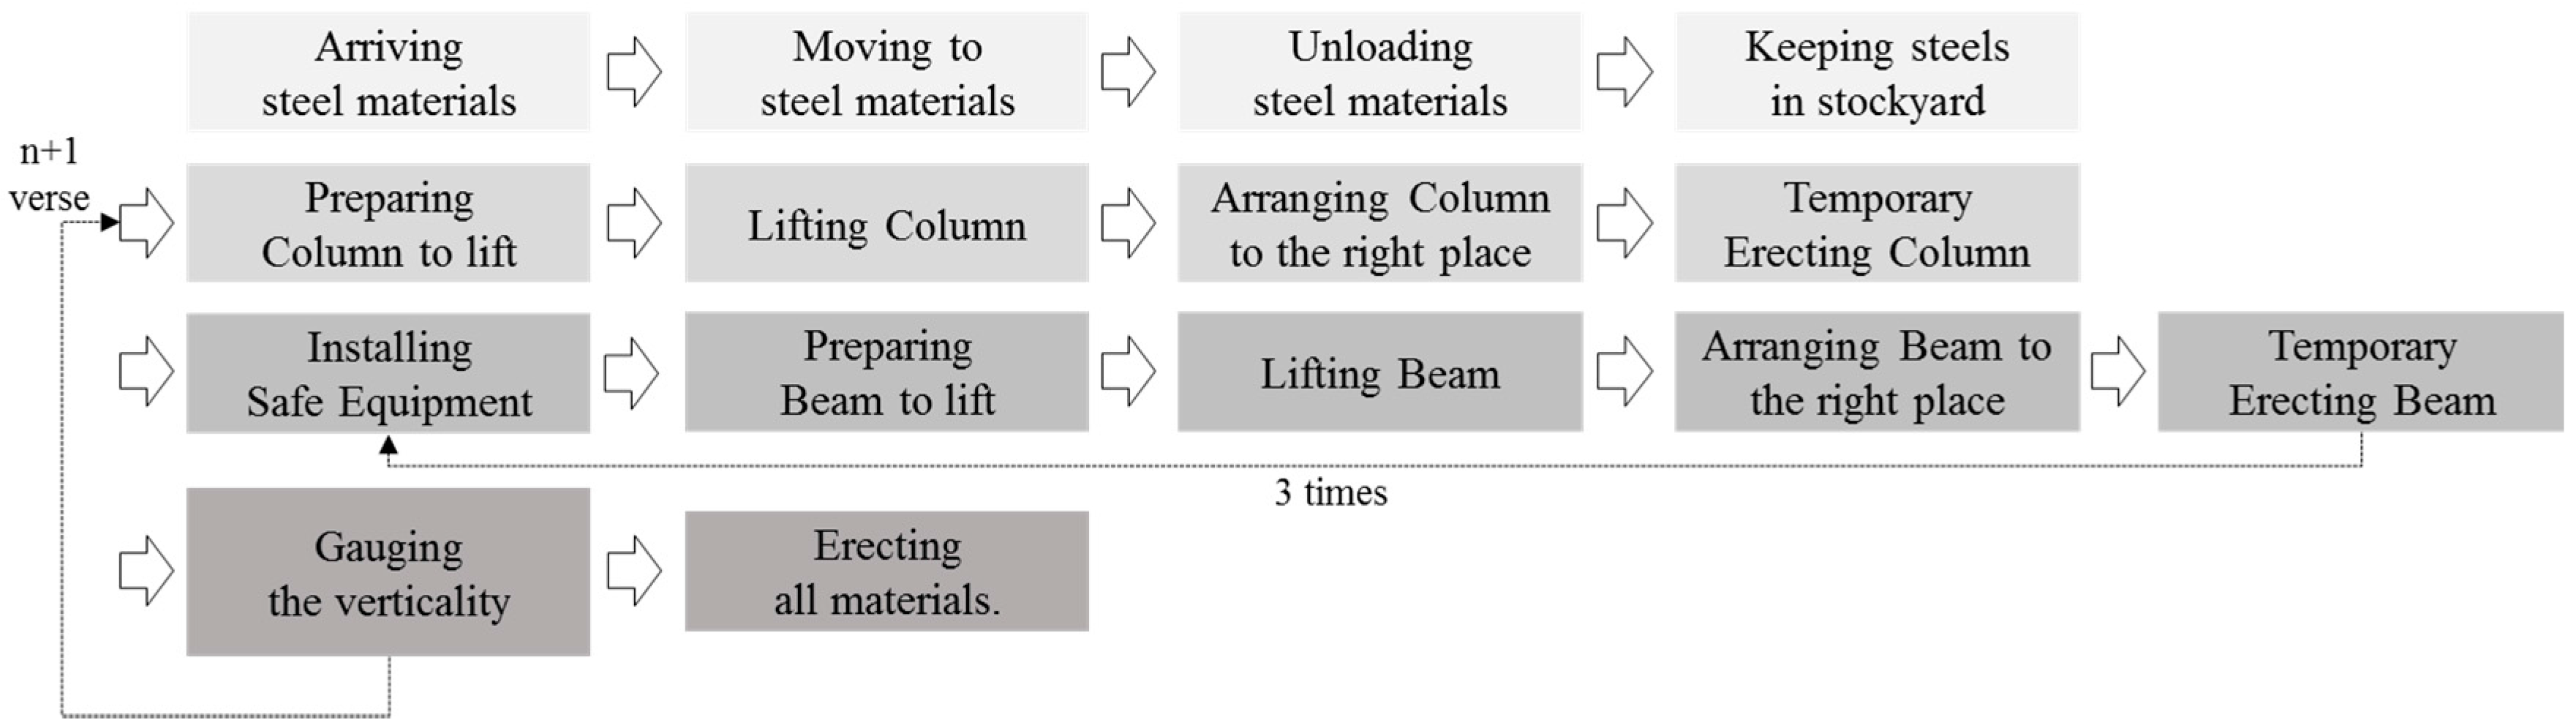
After a literature review, interviews with experts, and a textbook analysis, we built our scheme for steel erection work on a construction site (see
Figure 10). The work was divided into four sectors and fifteen operational processes. The first sector involved transporting materials to the construction site. The second was the temporary erection of the columns. The third sector was the temporary erection of the beams. The final sector included installation of all erection materials. There were four processes included in the first phase: (1) transporting the steel to the site; (2) moving the steel to the stockyard; (3) unloading the steel; and (4) maintaining the steel in the stockyard. In the second phase, there were also four processes: (1) preparing the columns to be lifted; (2) the lifting columns; (3) arranging the columns to be correctly placed; and (4) temporarily erecting the columns. In the third phase, there were five processes: (1) installing the safety device; (2) preparing the beam materials to be lifted; (3) lifting the beams; (4) arranging the beams to be correctly placed; and (5) temporarily erecting the beams/girders. The final phase was divided into two processes: (1) gauging the verticality; and (2) erecting all materials.
5.3.2. Finding the Factors Critical to the Construction Operation
We identified the critical factors that influence the productivity of steel erection work on construction sites. To verify the reliability of our conclusions, we analyzed textbooks, interviewed specialists, and reviewed the relevant literature on the topic. According to research in this field, the factors that impact steel work productivity are extremely complex and diverse, and include the constructability and completeness of the design, responsibility of the workers, surrounding conditions, construction period, site size, structure type, supply of the materials, height of the work, and so on.
Among these and other factors, we found six that were repeatedly stressed by the experts. (1) The number of workable days. Workable days are days in which it is possible to further the construction project; this exclude days with bad weather or during which unexpected accidents occur. This factor has a significant impact on productivity; it is directly connected to the time resource input value; (2) Variety of erection materials used in the same area. The more materials needed in a single area, the more time the project consumes; (3) The capacity of the stockyard. This factor influences the materials’ supply cycle; (4) The height of the project. If the steel erection work is performed above the fifteenth floor, logistics of placement become so complex and the time spent lifting becomes so prolonged that productivity is always reduced; (5) Access to a tower crane. Steel erection work requires the use of a tower crane. Thus, easy access is a critical factor to productivity; (6) Workers’ level of skill. Workers are diverse and unpredictable, and their efficiency and knowledge is critical to productivity.
5.3.3. Steel Erection Work Simulation
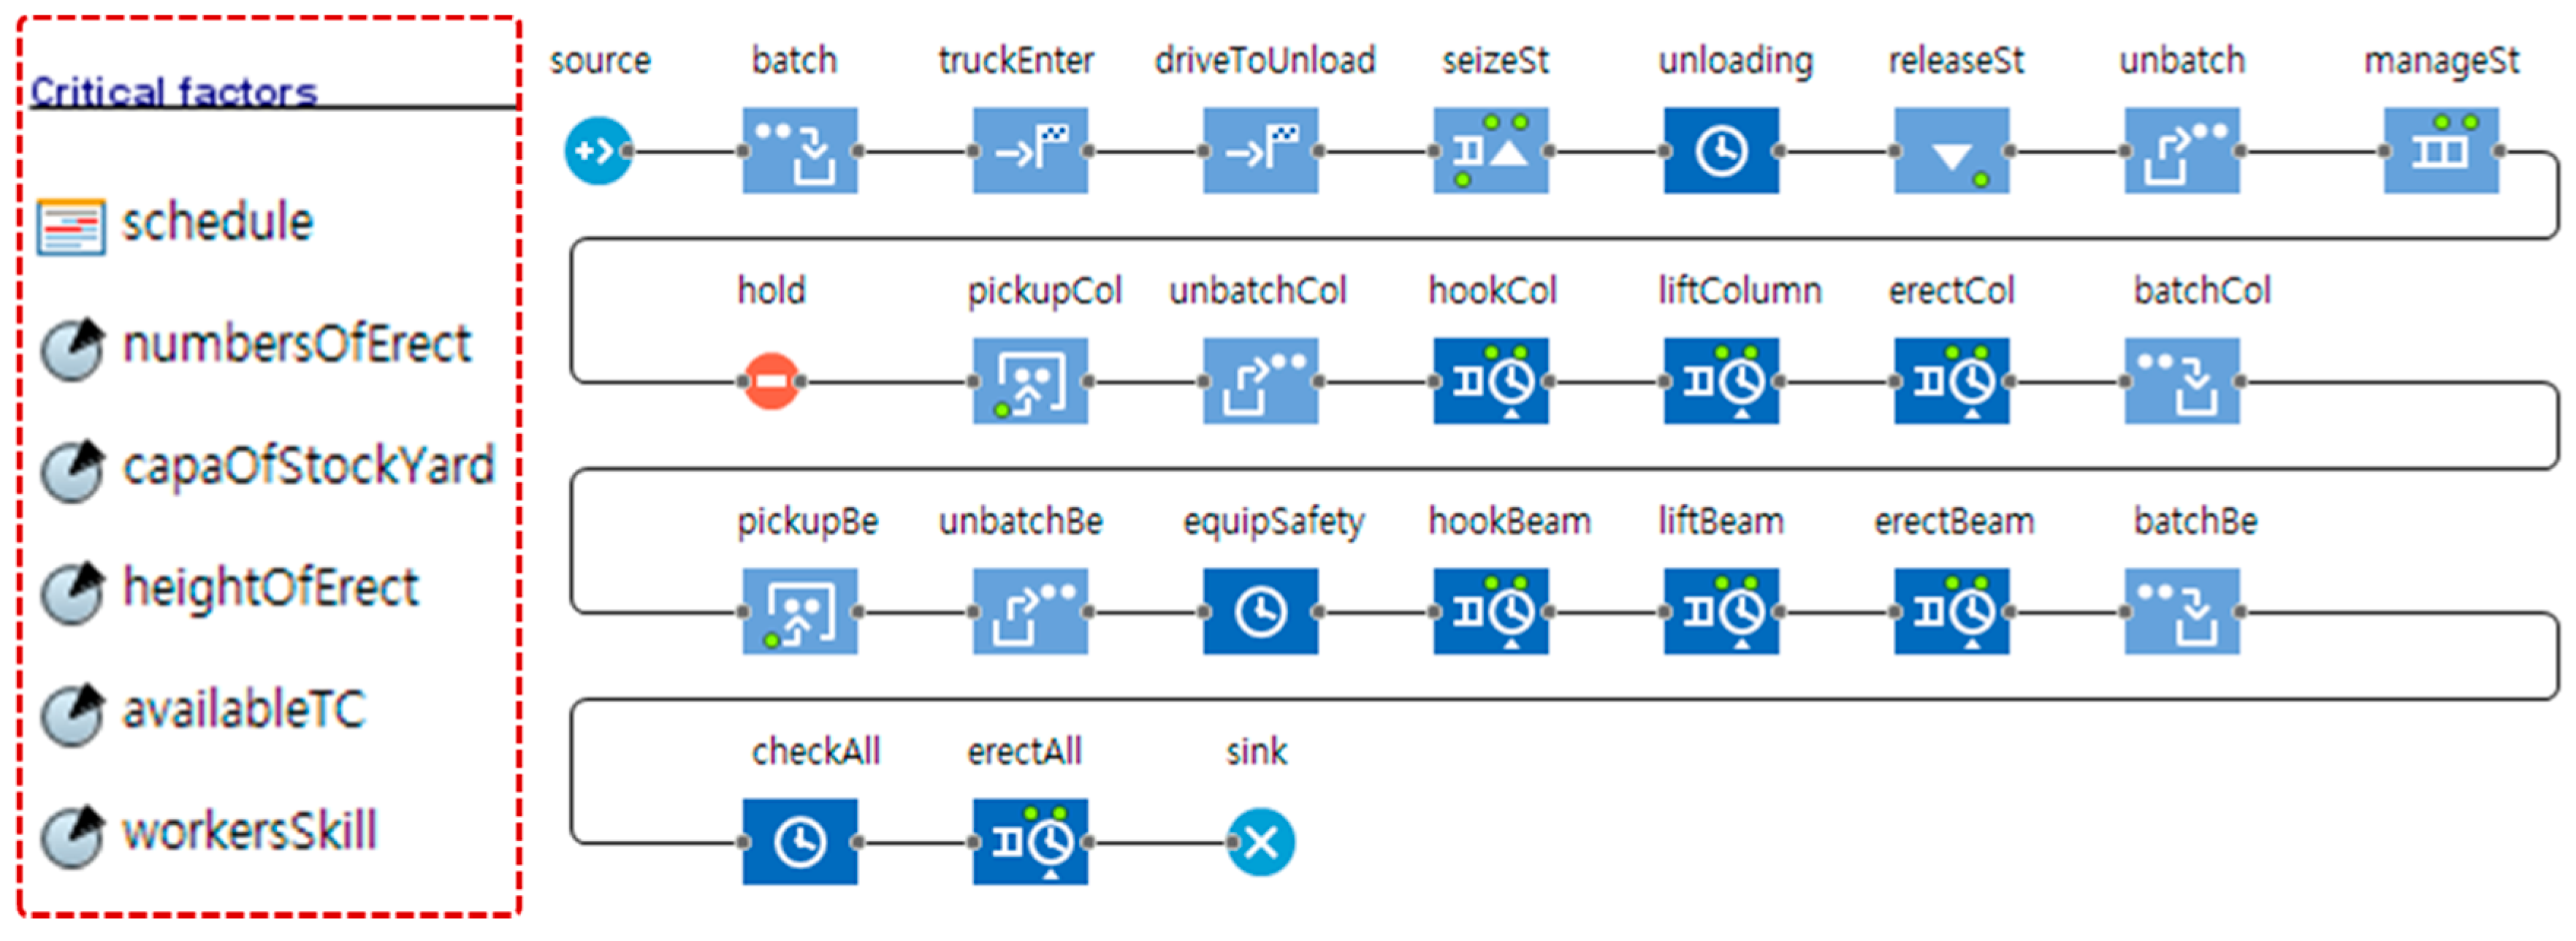
Using Anylogic, we created a simulation model based on a simulation outline and the above-discussed critical factors. The model was prepared as a discrete-event simulation (see
Figure 11). Associations among the critical factors and simulation libraries were organized according to their relation. As mentioned above, we divided the steel erection work into four sectors and expressed each as a different line in the simulation model (see
Figure 11). However, the specific simulation processes went far beyond the defined steps in the simulation outline, due to the dummy steps necessary to meaningfully control the flow of materials. The critical factors were defined as: ‘schedule’, ‘numbersOfErect’, ‘capaOfStockYard’, ‘heightOfErect’, ‘availableTC’, and ‘workersSkill’, which translated to workable days, number of erection materials, capacity of the stockyard, height of the project, access to a tower crane, and skill of the workers, respectively. The schedule and parameter simulation components in the Anylogic software were used to incorporate these factors into the simulation model.
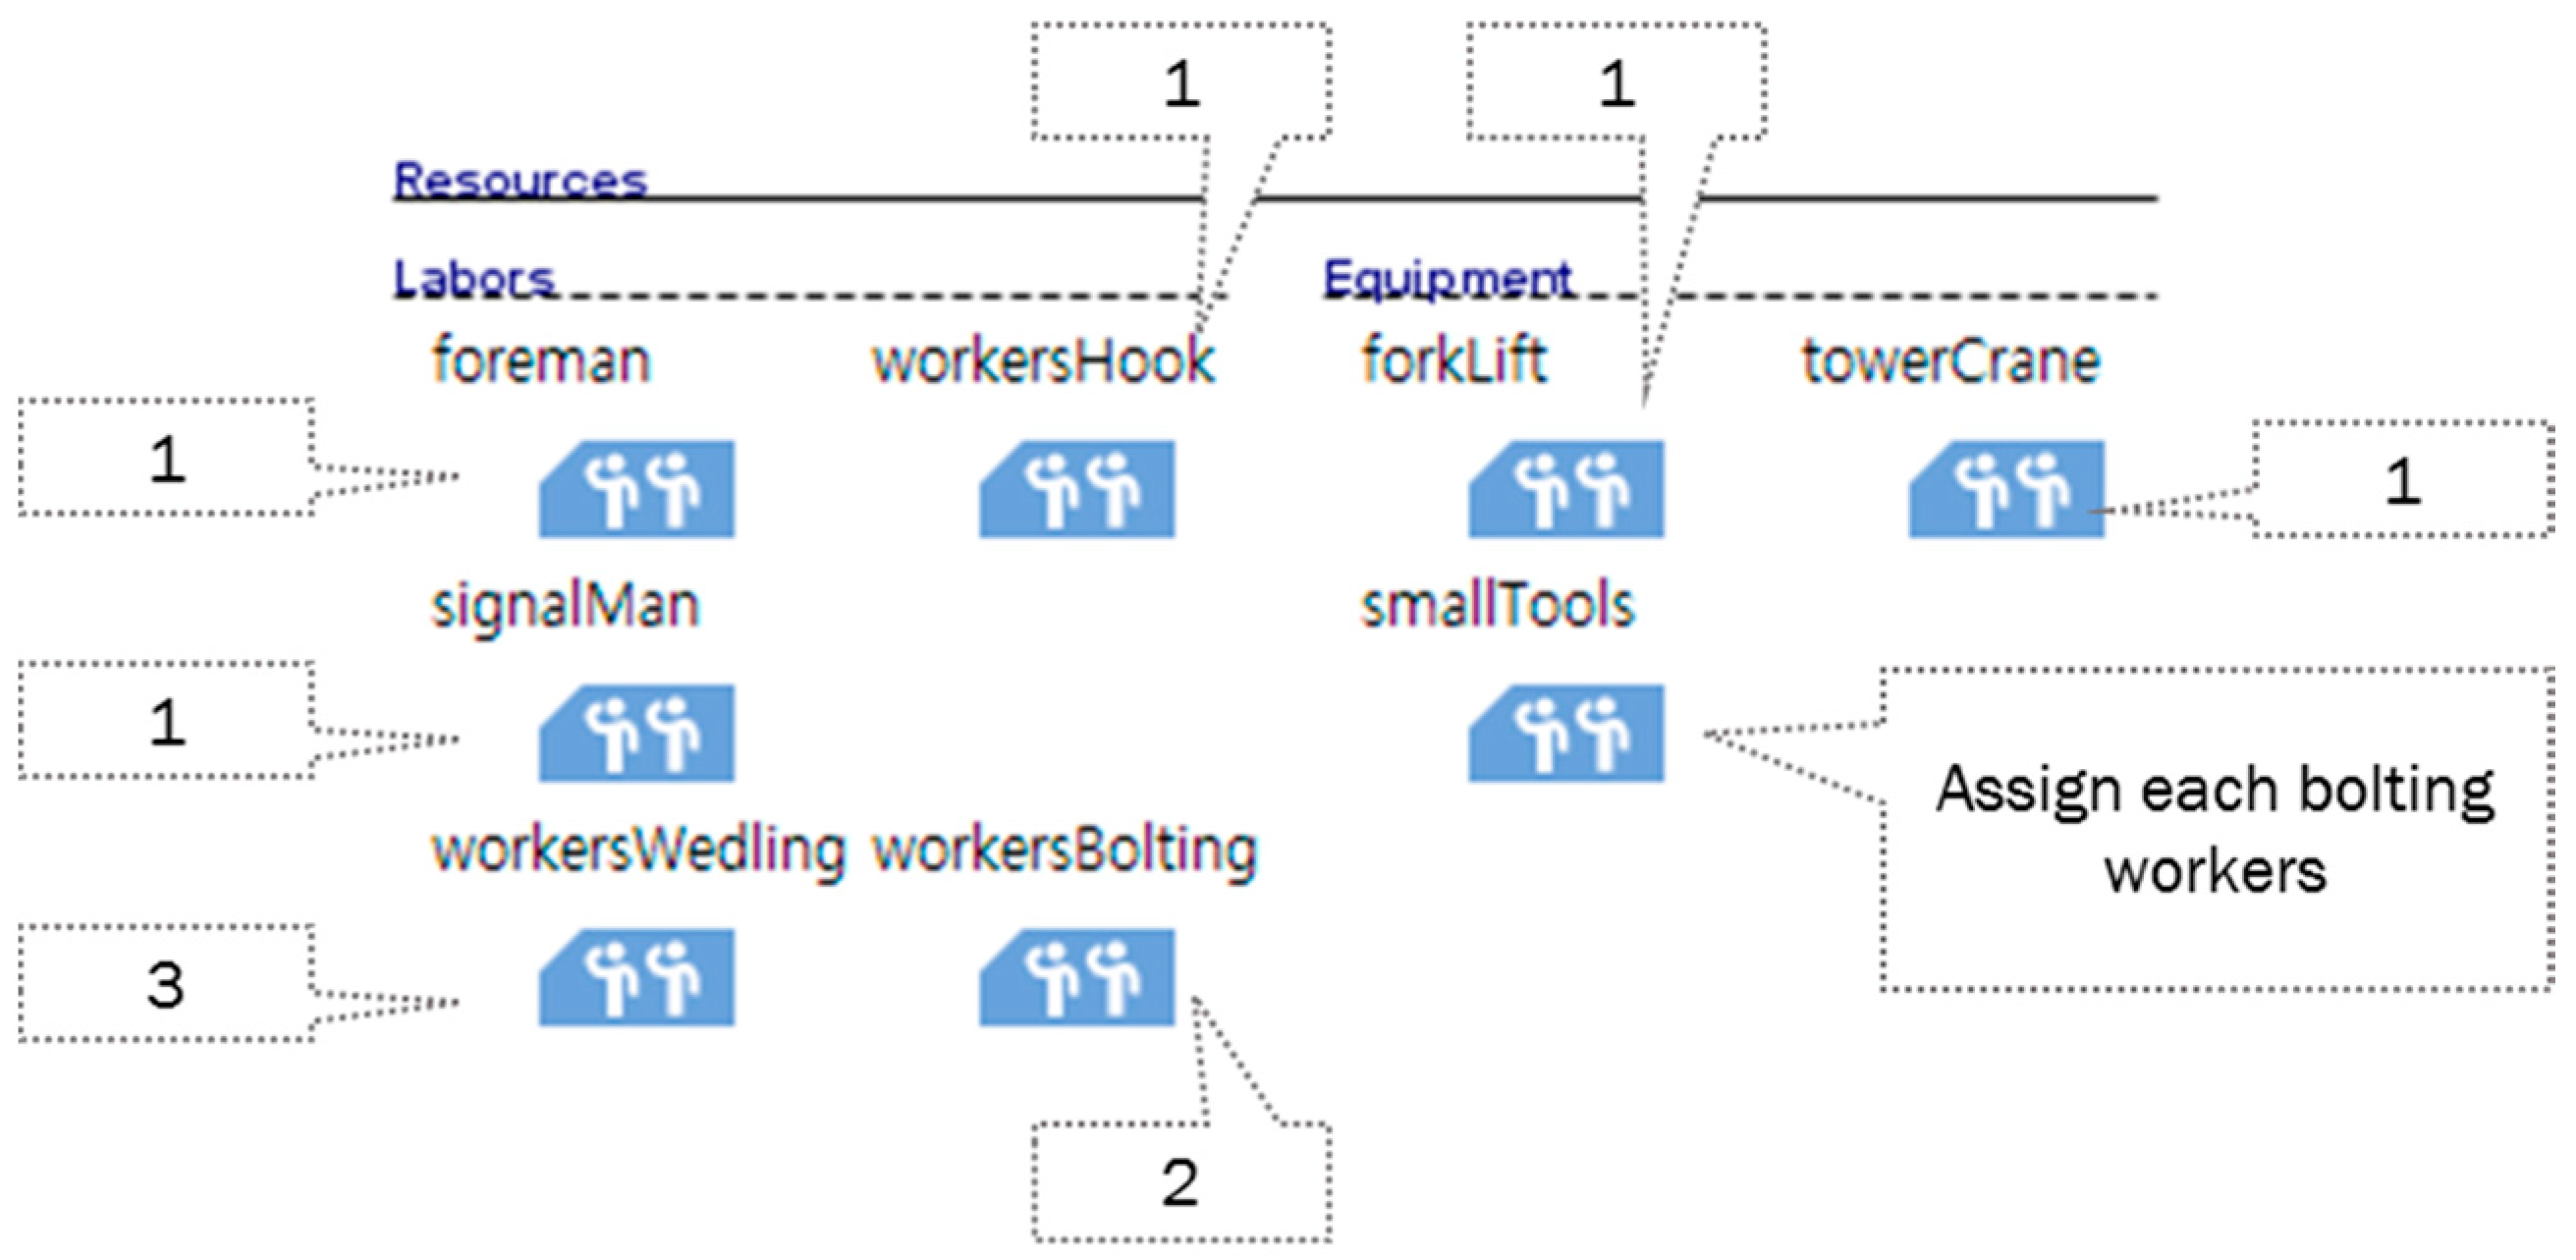
Labor and equipment were defined as resources in Anylogic (see
Figure 12). We initially divided labor into five categories: one foreman, two bolting workers, three welding workers, one worker to support the hooking materials, and one signal man to support the lifting. The initial number of workers was determined by analyzing the standard crew used in steel erection work. Additionally, we included one forklift, one tower crane, and small tools used for bolting. A forklift is used to move steel materials under 30 tons; however, it was not used in our simulation because the capacity of the forklift was not considered critical to productivity. A tower crane moves one steel beam at a time. Small tools are dummy resources and were included only to illustrate that tools were required for the bolt workers.
5.3.4. Simulation Libraries and Parameters
We determined that a number of components and parameters were necessary for steel erection work on a construction site. Both ‘Source’ and ‘Sink’ were essential to building the process model because ‘Source’ provided a starting point and ‘Sink’ an end point. Despite the volume of steel materials included in the process model, the ‘carrying materials’ sector was expressed as a single entity because it was all loaded onto a single truck. To bind the steel to a single entity, we used the ‘Batch’ component. ‘MoveTo’ was used to express a truck entering into a stockyard space. When the steel materials arrive at the stockyard, workers must spend time unloading them; we expressed this step as a ‘Delay’ component. To allocate a forklift before and after the unloading process, we added ‘Seize’ and ‘Release’ components. If materials needed to be detached from their delivery truck, we identified them individually via the ‘Unbatch’ component. We used the ‘Queue’ component to demonstrate when steel remained in the stockyard until it was required for erection.
In the second sector, the ‘temporary erecting column’ task, we selected the columns among the inventory in the stockyard via the ‘Pickup’ component. The columns could then be hooked to the lift, lifted, arranged in the correct spot, and temporarily erected. In the third sector, the ‘temporary erecting beam’ task, we followed a similar process. We first selected the beam materials via the ‘Pickup’ component, and then installed the safety equipment, hooked the beams to the lift, lifted the beams, arranged the beams on the correct spots, and then temporarily erected them.
Finally, the ‘erecting all materials’ sector followed a relatively simple set of two steps: checking the verticality of all of the materials, and firmly erecting all of the installed steel materials. In order to erect the beams after the columns were installed, we added a ‘Hold’ component between the first and second sectors. The blocking condition for ‘Hold’ was whether the number of columns in the batch was the same as the number of beams in the batch. From this component, we were able to prevent steel materials from jumping onto a ‘temporary erecting beam’ sector before the columns were erected. In
Table 1, the specific simulation components and our process of naming are described.
We presumed that 1 s in the simulation equated to 6 min in real time. We then defined the simulation input values and assumptions for each simulation step. Among these steps, we determined those directly related to productivity: ‘hookCol’, ‘liftColumn’, ‘erectCol’, ‘equipSafety’, ‘hookBeam’, liftBeam’, erectBeam’, ‘checkAll’, and ‘erectAll’. To determine the reliable productivity output provided by the simulation, we needed an accurate way of defining these nine steps. Through a literature review and interviews with experts, we configured dependable values and an appropriate distribution for the steps presented in
Table 2.
Whereas the input distribution of the construction simulation fit the beta distribution [
41], it was more difficult to obtain an amount of data sufficient to extract the beta distribution. Since triangular distribution is both simple and intuitive [
42,
43], we applied it as input data retrieved, based on data from previous literature (see
Table 2). The triangular input data used for critical simulation steps were determined by cross-checking the previous literature on this topic. The values are presented in
Table 3.
5.3.5. Steel Agent Modeling
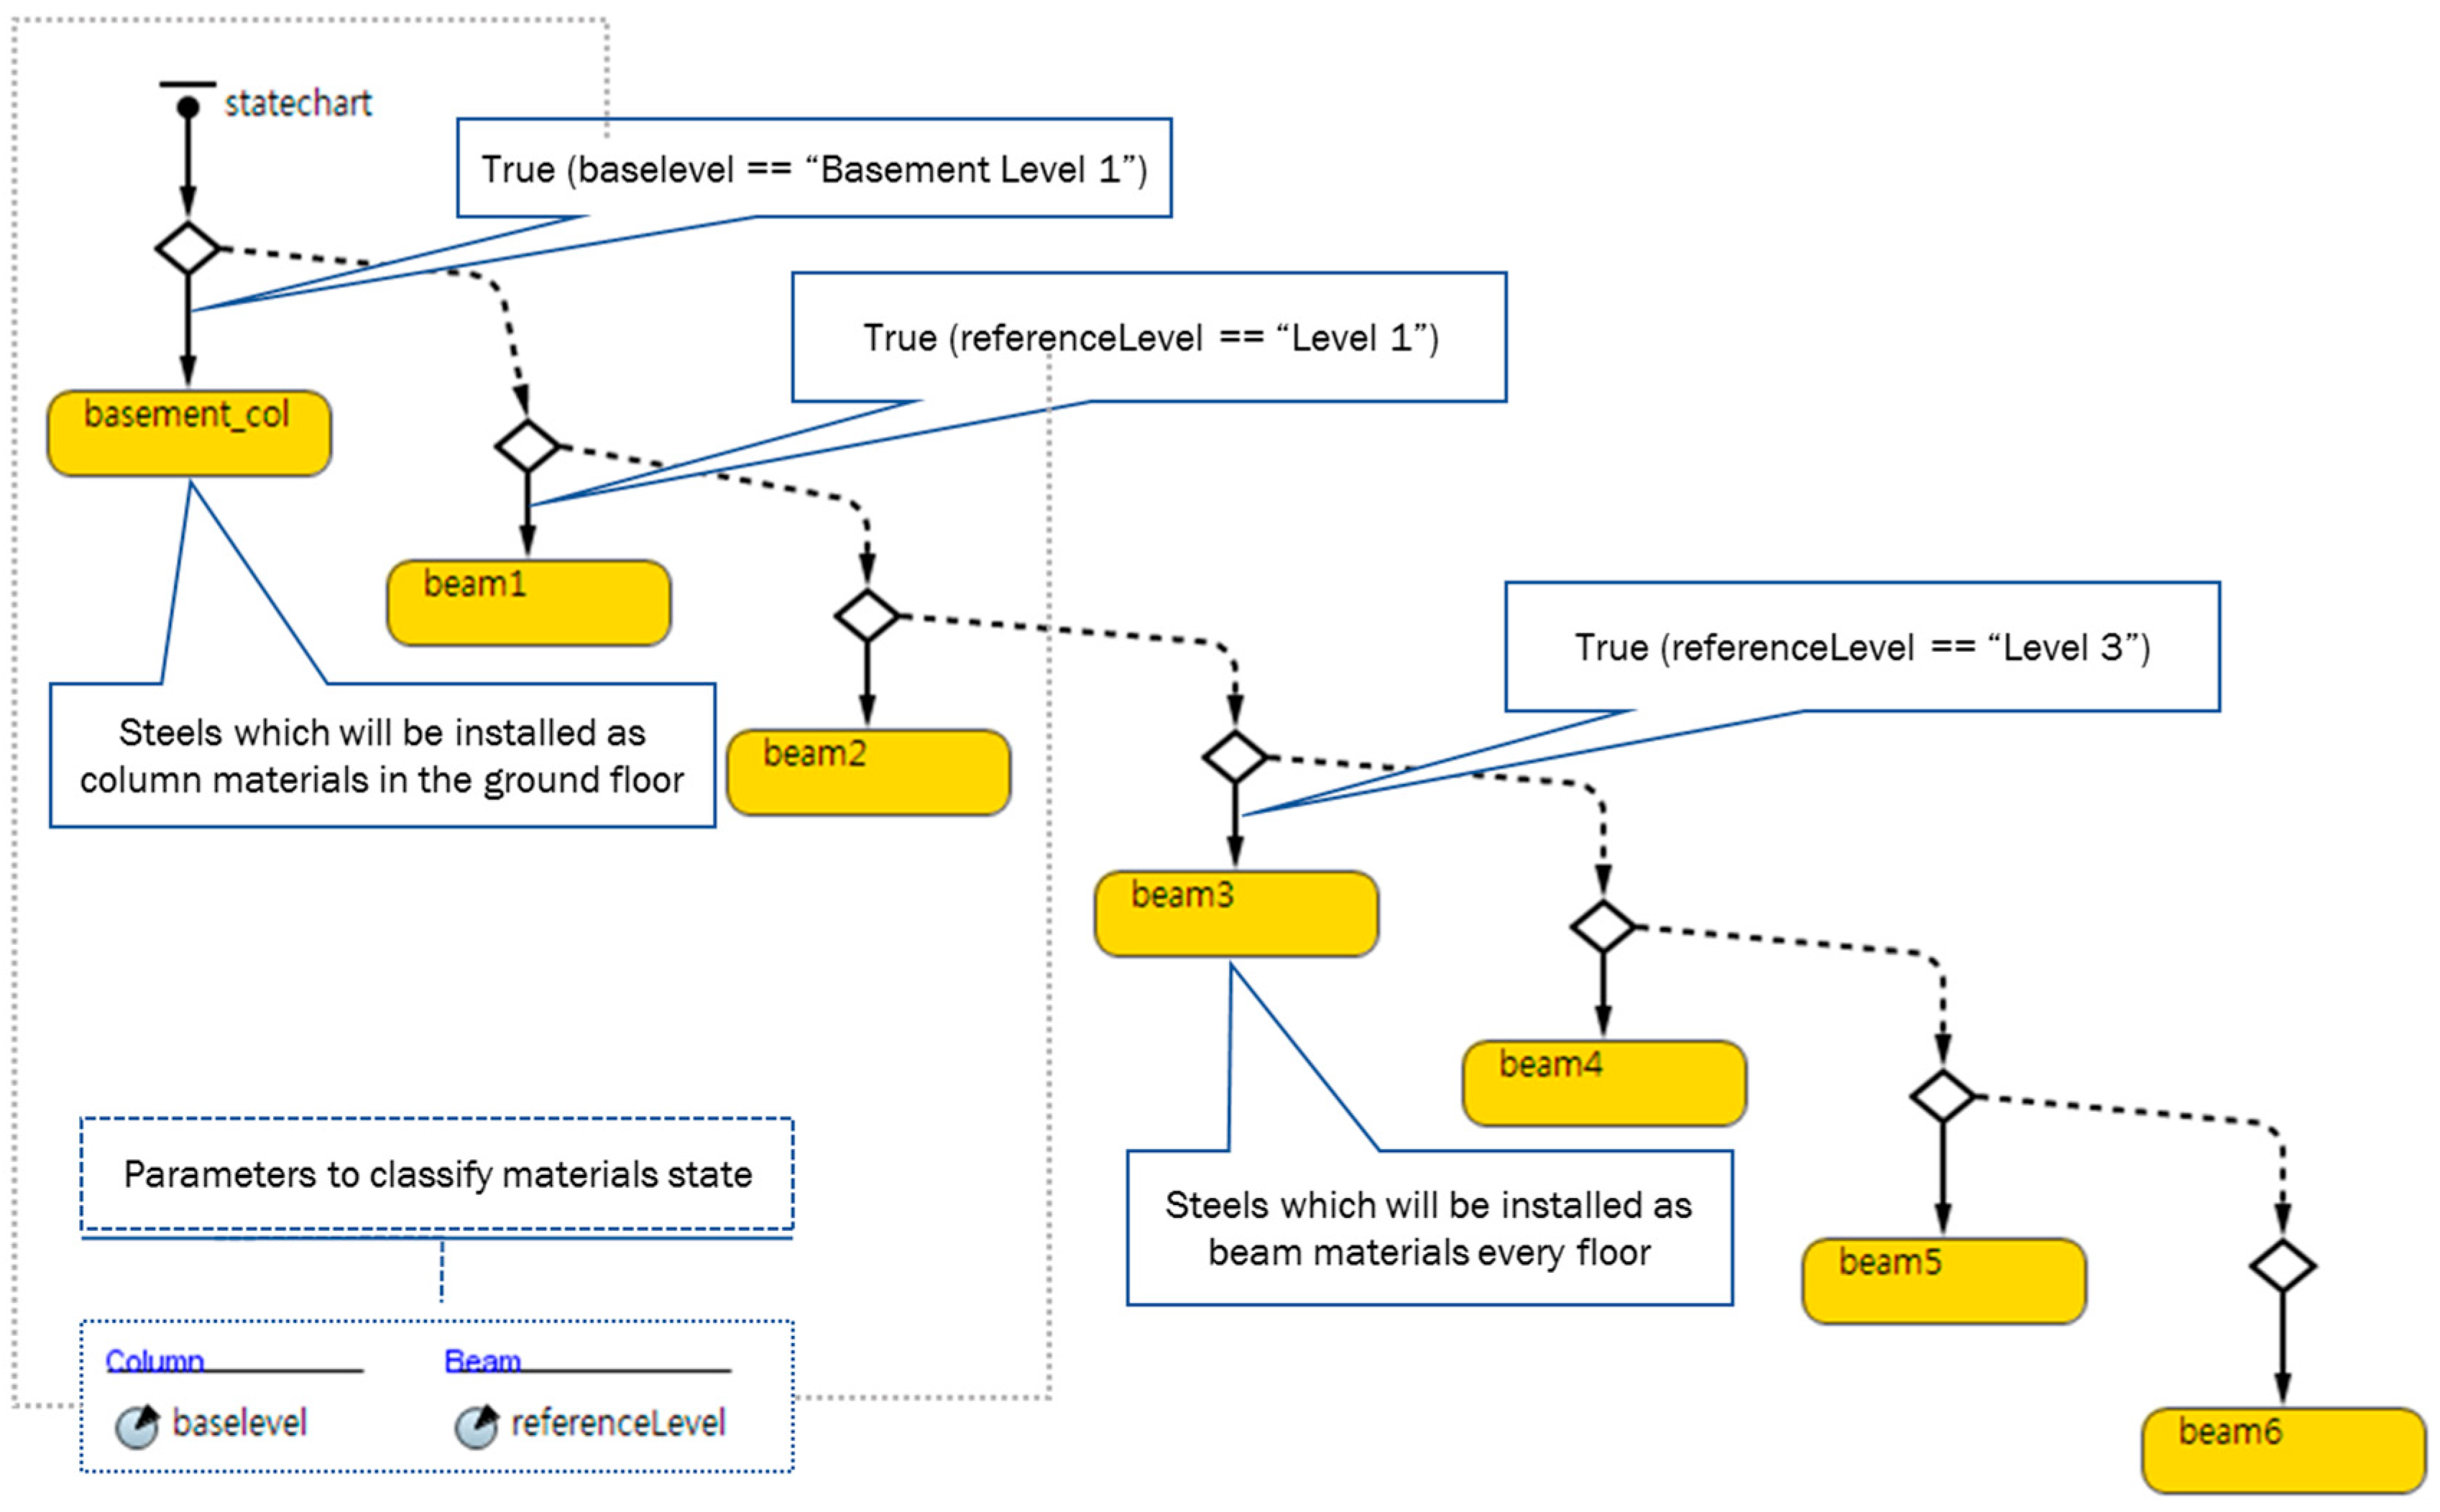
In the steel erection work model using discrete-event simulation (process-centric models), steel was used as an object in the process flow. We needed the amount of materials and the height of the erection, which were obtainable from the BIM model. After we obtained this information, we classified the steel materials according to their required order in the work process flow shown in
Figure 13. First, we sorted the columns and beams. Then, the steel was divided according to separate floors because it needed to be installed according to the floor order. In the model presented in
Figure 8, the columns were only installed on the basement level, so we created only one state for columns. Conversely, we prepared six states for the beams because they needed to be installed on all six floors. To classify these input values, we created two parameters, ‘baselevel’ and ‘referenceLevel’. After developing the commands for extracting the BIM information, we stored the base level value of the columns in ‘baselevel’ and the reference level value of the beams in ‘referenceLevel’. Since columns only had a base level and beams only had a reference level, these two parameters were all that were needed. Additionally, we reflected the height factor by dividing the state by floor.
5.4. Running the BIM-Integrated Simulation
Within the Autodesk Revit 2015 environment, we opened the prepared BIM model and added in the commands described above. By executing the process, we obtained the simulation input data extracted from the BIM model and translated it into the simulation data format. Then, we opened the Anylogic simulation application and imported the simulation input data. We also imported the steel work process model. Next, the input data model was added to the steel work process simulation. In the Anylogic simulation environment, different files can be combined if they are written in an Anylogic simulation format such as alp. We then integrated the resource input data from BIM into the steel work process simulation, performed the steel erection work process simulation, and measured the column and beam erection productivities and the overall productivity of the erection. The entire process is presented in
Figure 12. When we measured the productivity, we were able to obtain the optimal resource input combination by adjusting the input data. Consequently, the method enabled us to establish optimal resources and production plans that considered the construction project’s uniqueness and complexity.
Figure 14 shows the entire processes.
5.4.1. Model Input and Assumptions
This section describes the model input data and assumptions that were made when we applied the BIM-integrated simulation to the actual steel installation work. Based on experts’ opinions, we determined the simulation steps critical to the steel erection work simulation. These steps included hooking, lifting, erecting, installing safety equipment, and checking verticality. We analyzed the model’s input values for these steps, found historical values in a previously-published case study, cross-checked the data, then decided on minimum, maximum, and most likely values. This process was validated via the expert interviews.
We also assumed that there was one foreman who worked on the ground, one signalman for the signal, one worker who hooked the materials to the tower crane, two workers who erected the structure, and two workers who welded between the columns. We identified these values via a textbook analysis, expert interviews, and a review of the published literature on this topic. We presumed access to a forklift and tower crane, and analyzed the required use of this equipment by employing the basic analysis tools in the Anylogic simulation software. Also, the amount of materials the forklift and tower crane could move could be modified during the simulation because we considered them adjustable managerial values.
5.4.2. Role of Critical Factors and Input Assumptions
As mentioned above, we identified six critical factors affecting productivity for steel erection work: the number of workable days, amount of materials, capacity of the stockyard, height of the erection, availability of a tower crane, and skill of the workers. These critical factors were divided into those that were and were not obtainable from BIM. Then, we determined how to consider unobtainable factors in the simulation model. The method we followed for reflecting all critical factors is presented in
Table 4.
We assumed that the height of the erection increased until Floor 3, then decreased to the roof; that is, the level of the columns in the basement was 1.2, while the levels of the erecting beams on the first, second, third, fourth, fifth, and sixth floors were 1.1, 1.0, 0.9, 1.2, 1.3, and 1.3, respectively. The production values were divided into these values to reflect the predicted steel work productivity. When we added the BIM information by using the above-mentioned commands, we classified the steel materials by their height; and then, each level of height was used to predict productivity. Additionally, since workers’ levels of skill can be unpredictable, we extrapolated the optimal combination of skilled workers through an analysis of the various scenarios. Specifically, since the required number of workers will differ according to their skill, we applied a different number of workers to each process, compared their level of utilization, and extrapolated the optimal combination.
5.4.3. Results from Running the BIM-Integrated Simulation Model
We executed the BIM-integrated simulation model and built graphs of the work productivity based on the model input values and critical factors determined from the above-mentioned assumptions. The amount of materials needed for each level was determined by using BIM’s API commands. We assumed that the capacity of the stockyard was more than the sum of the number of columns and beams in order to avoid restrictions from a limited stockyard. The difficulty of the work as the height increased was a productivity-impeding factor. The entire setup of all the critical factors is presented in
Table 5.
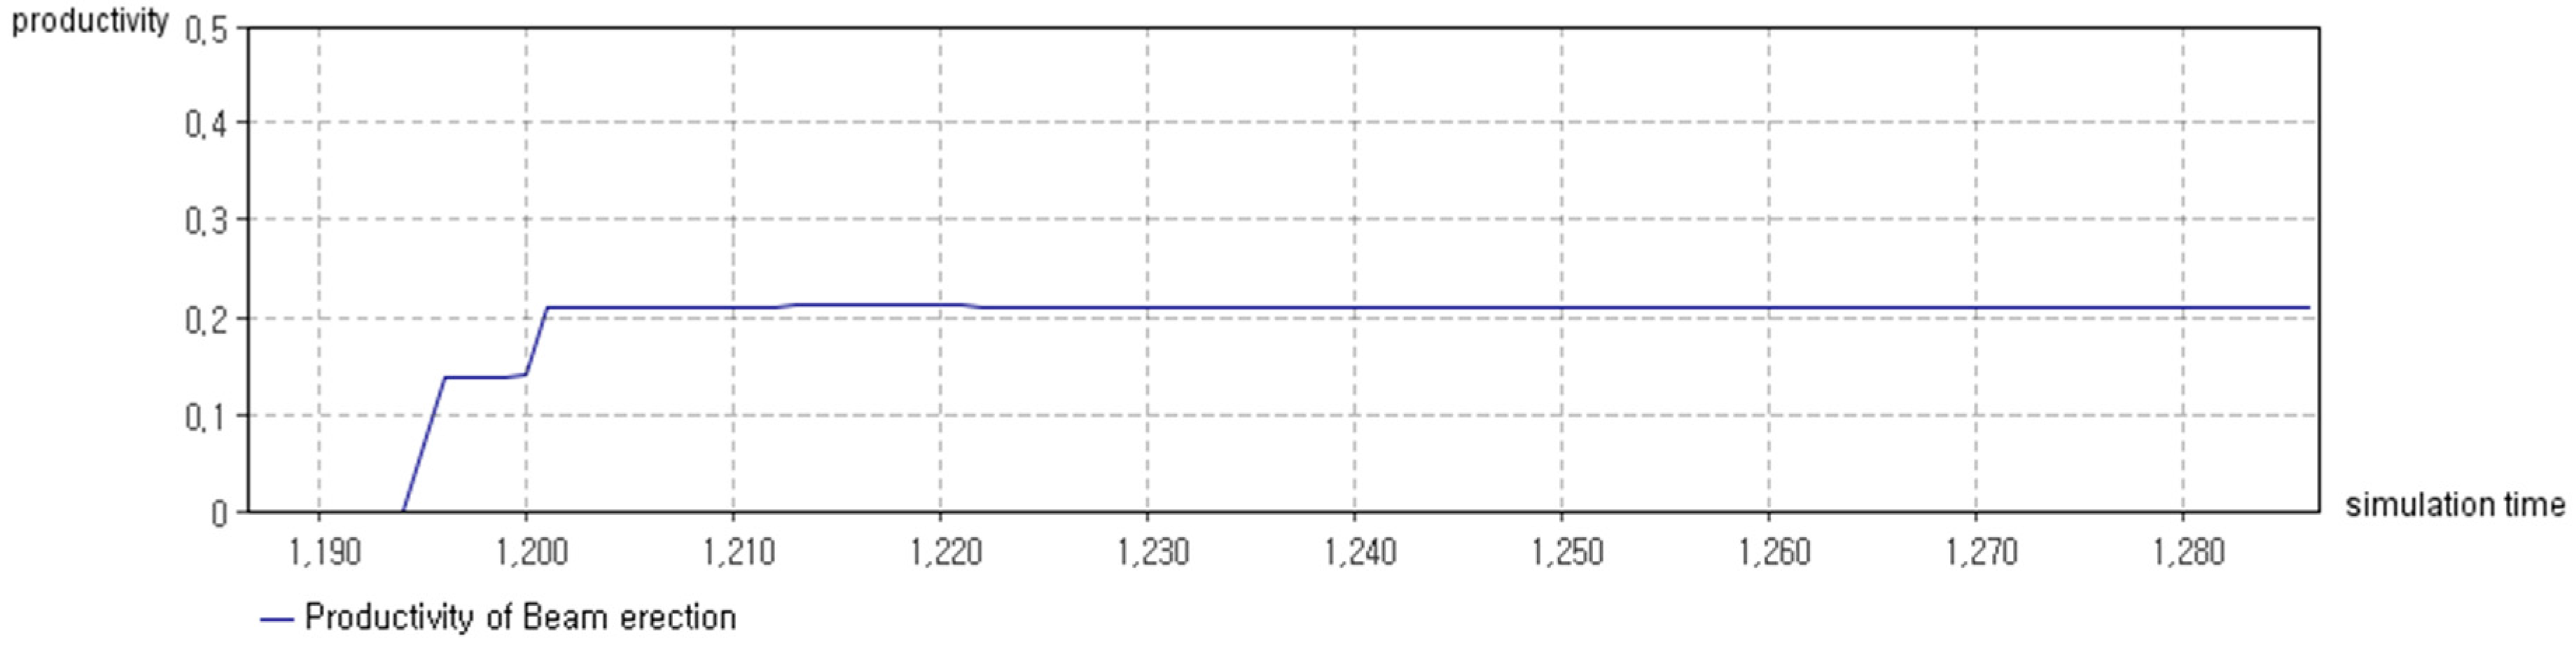
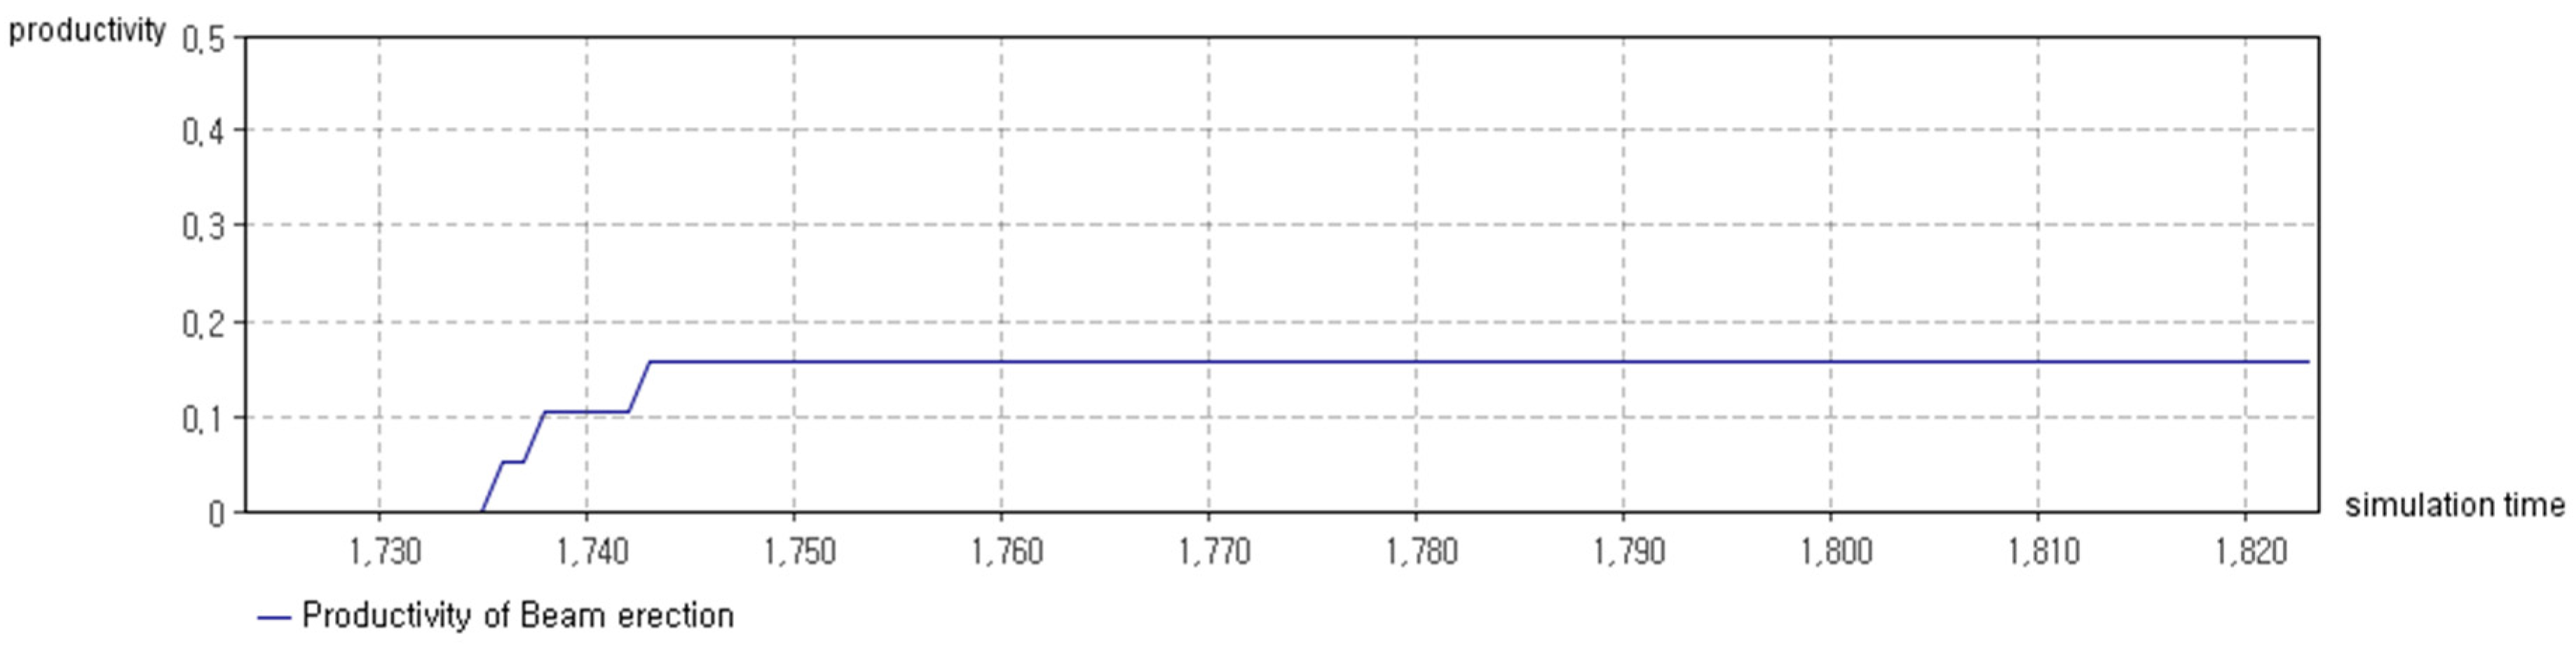
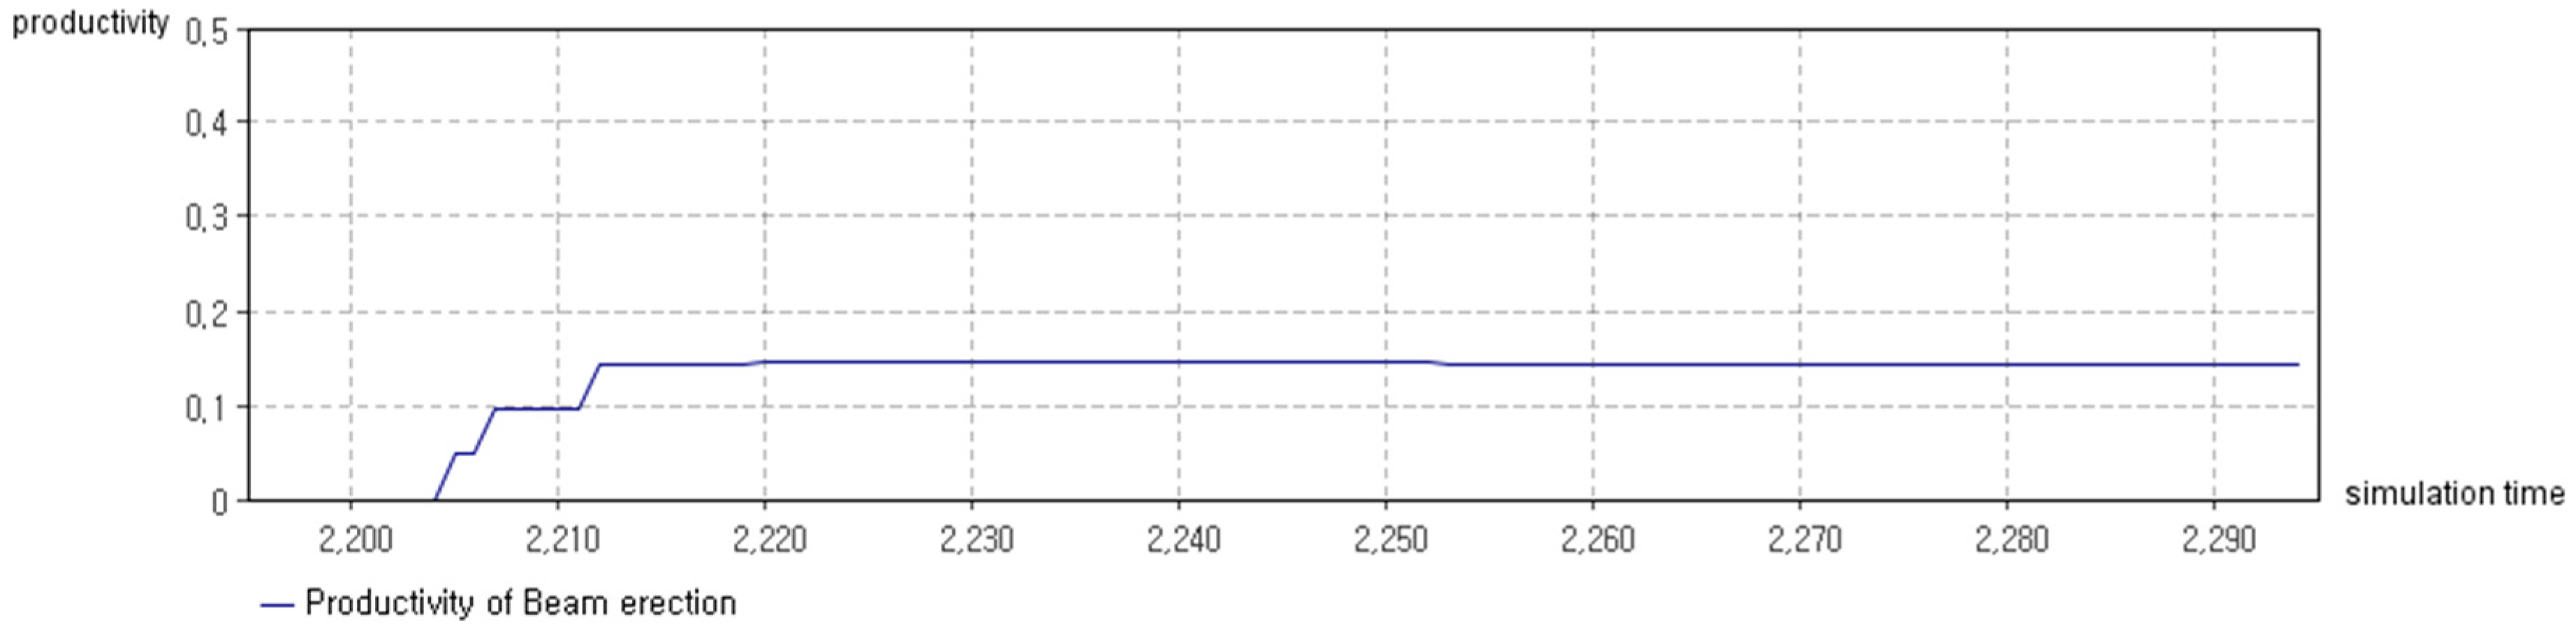
We performed our BIM-integrated simulation according to the simulation’s running conditions shown in
Figure 15,
Figure 16,
Figure 17,
Figure 18,
Figure 19,
Figure 20,
Figure 21 and
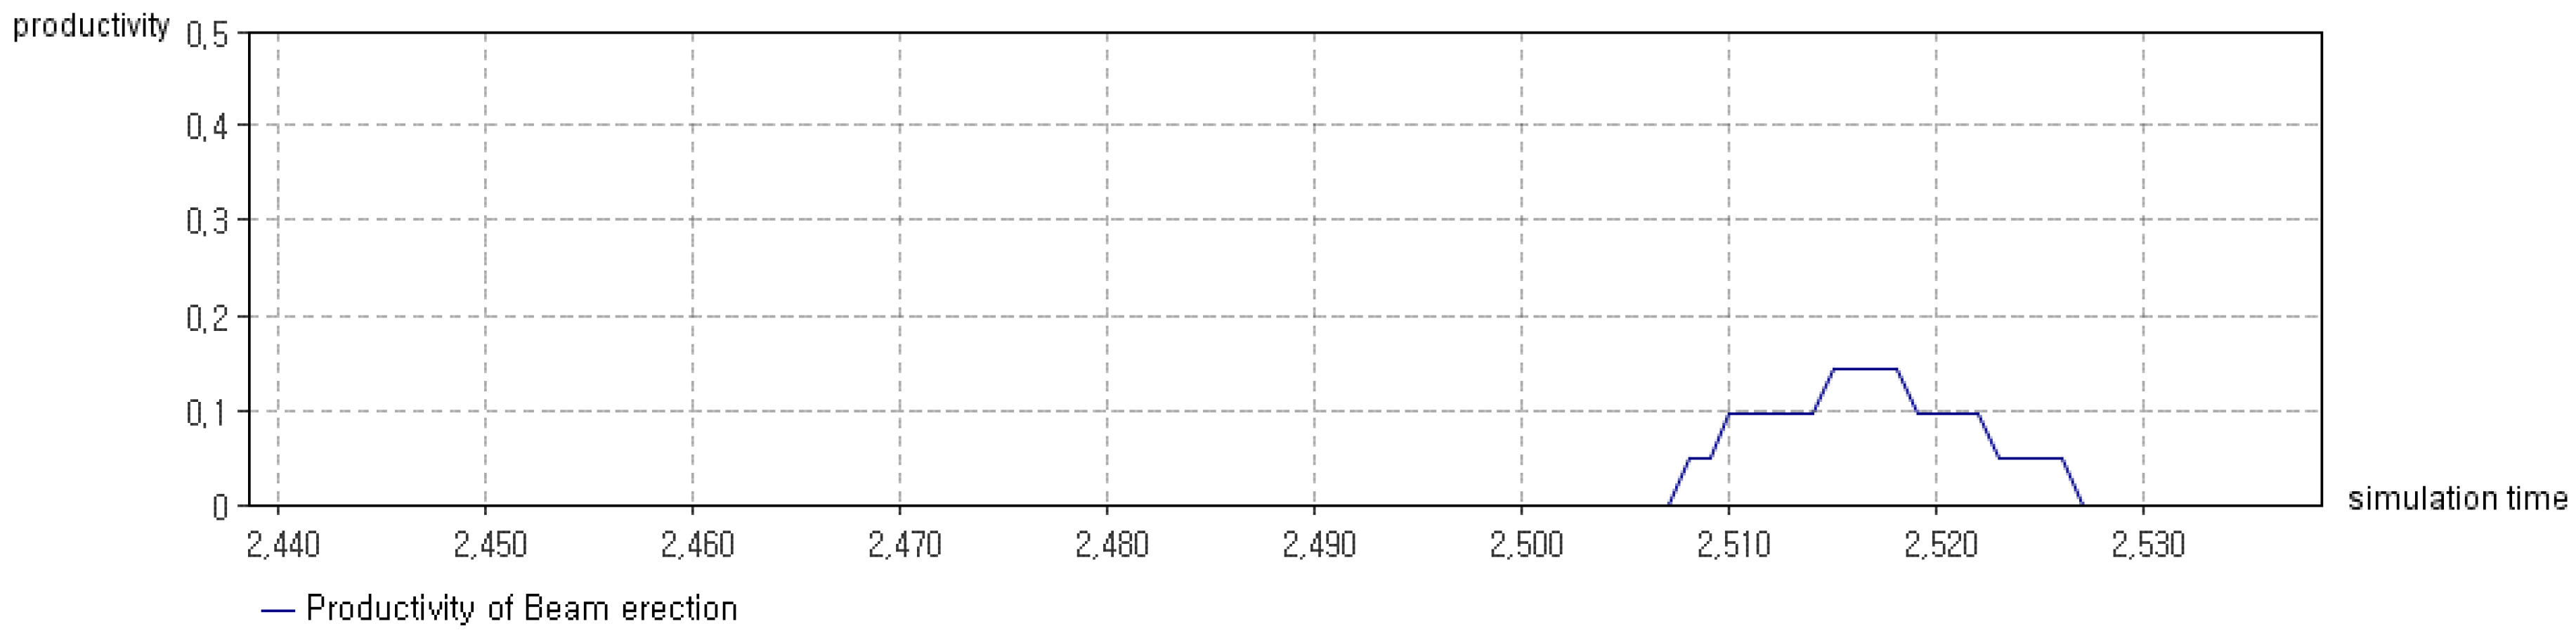
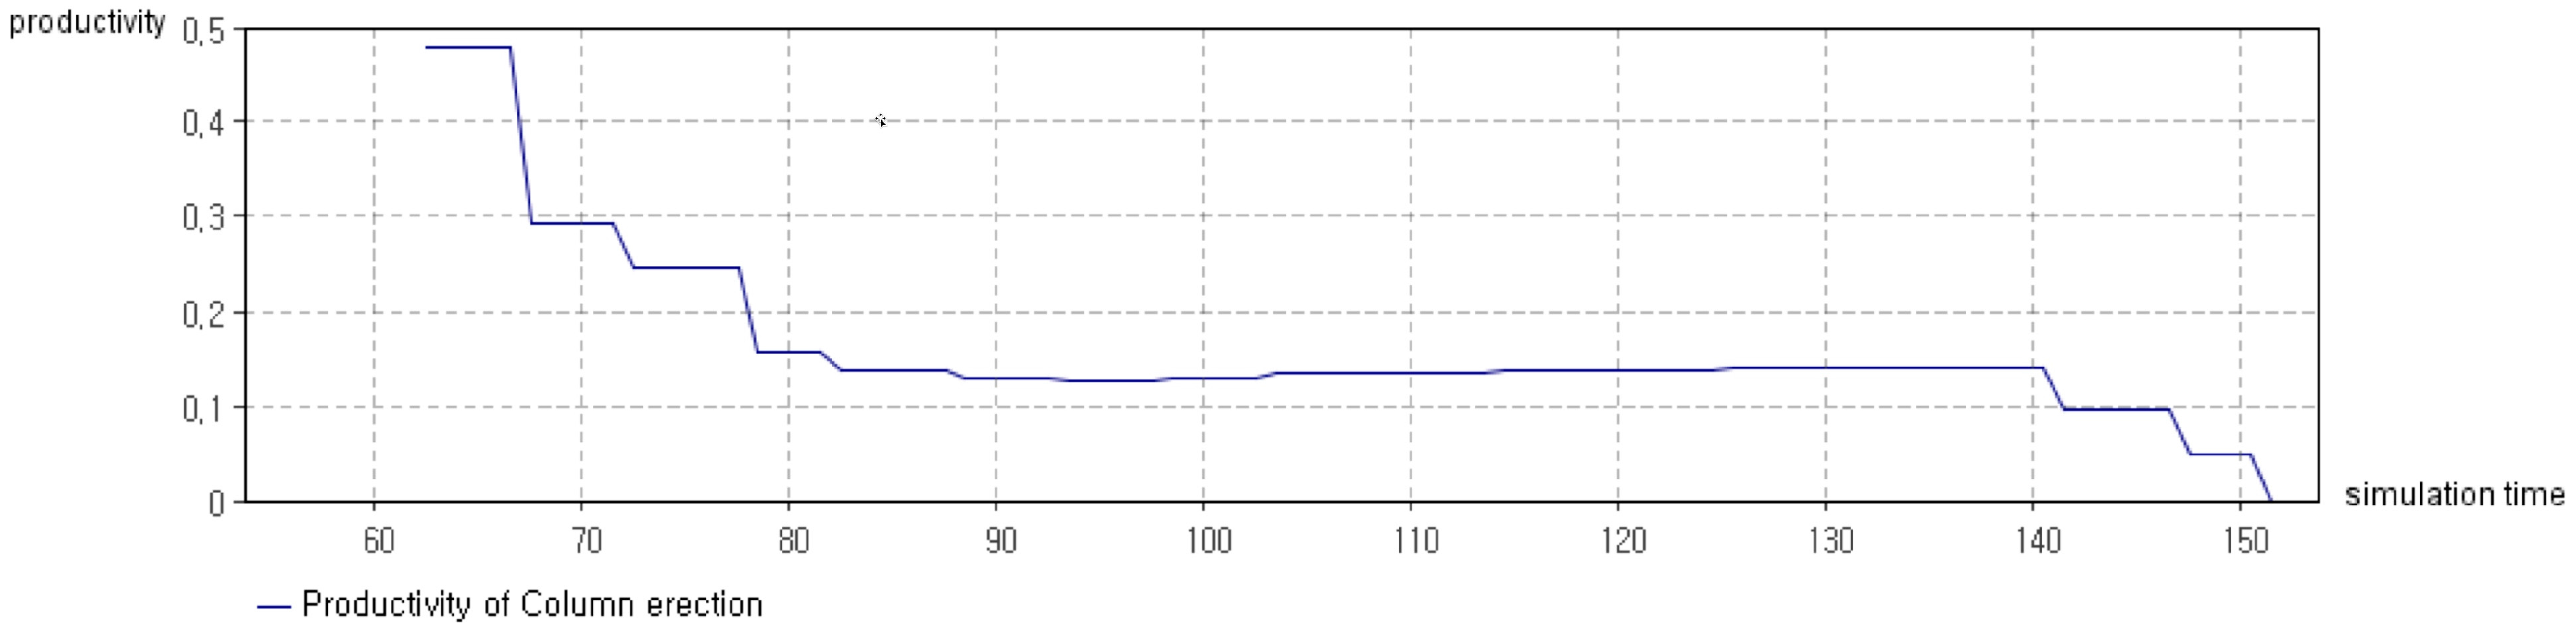
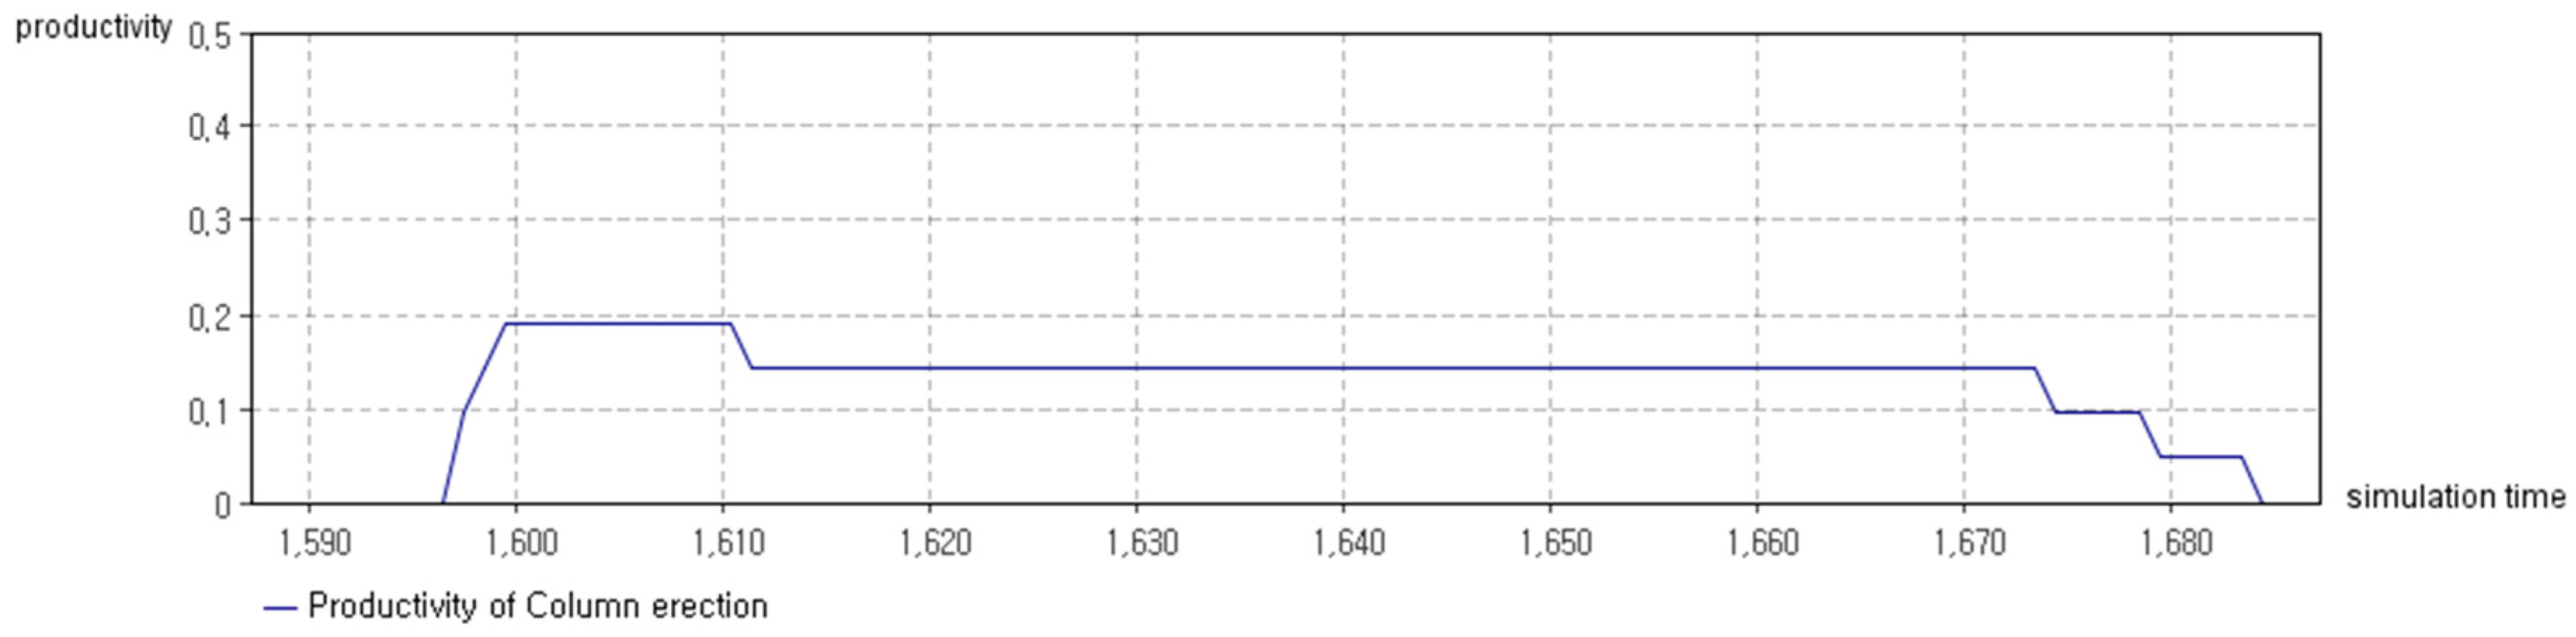
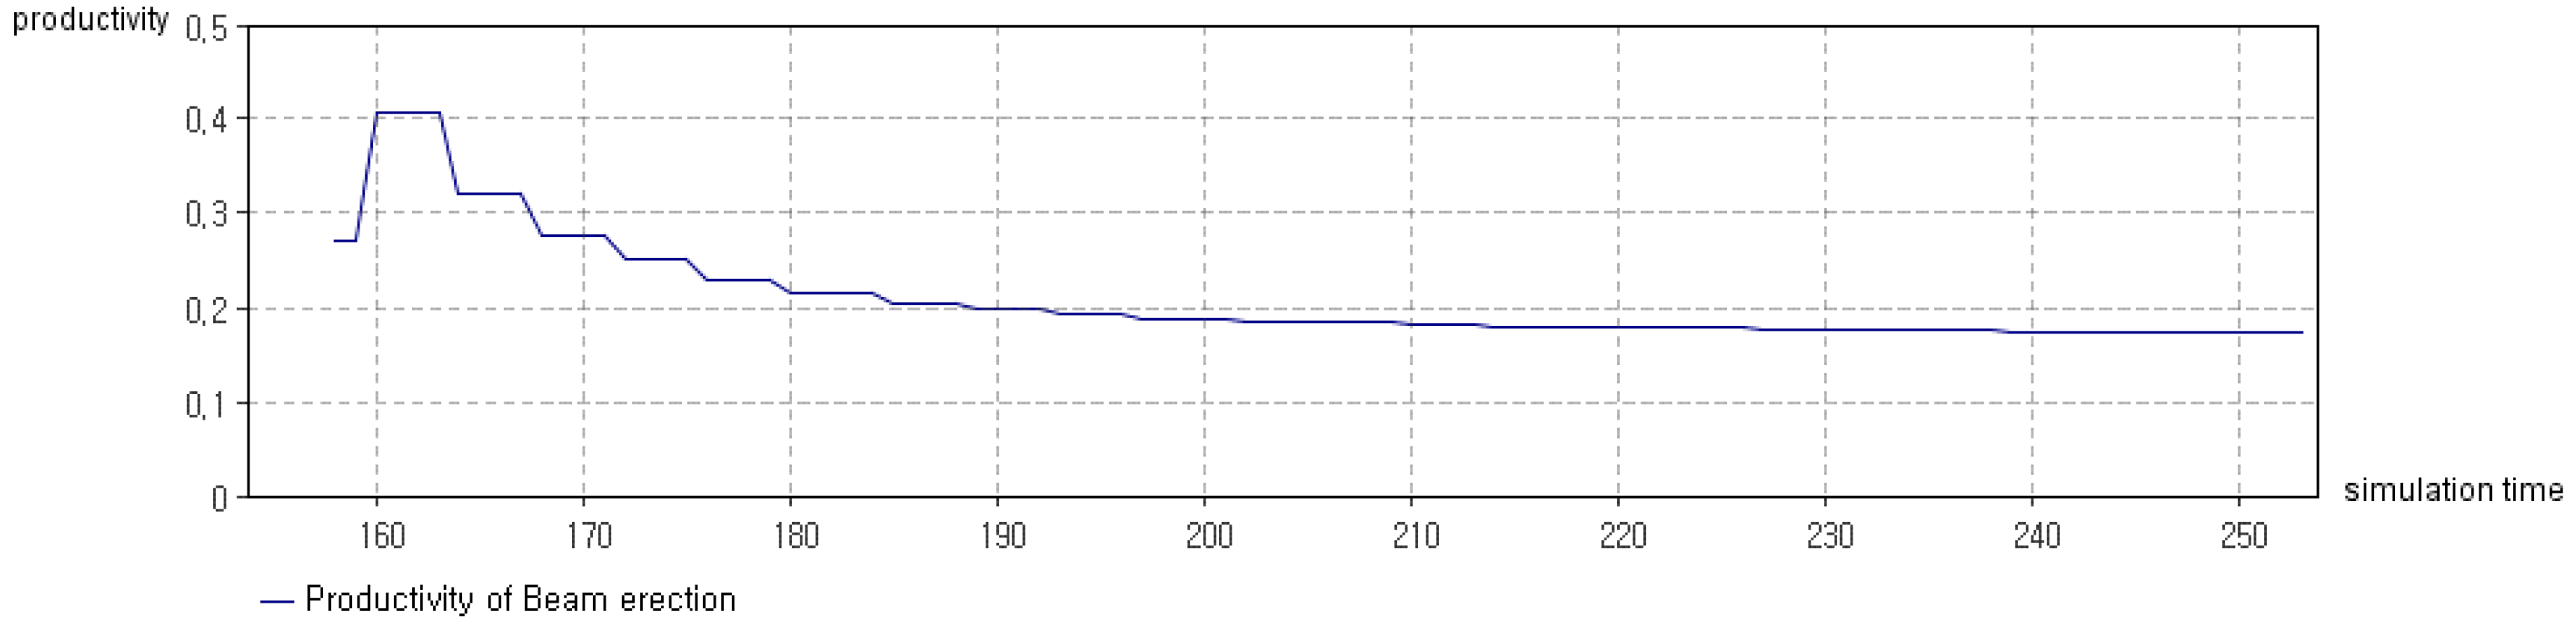
Figure 22. The installation sequence was according to height; that is, in the first set of erections, the beams on Levels 1, 2, and 3 were installed sequentially after installation of the first set of columns. Then, in the second set of erections, the beams on Levels 4, 5, and 6 were installed sequentially after installation of the second set of columns. The productivity of the beams varied according to the erection height. The difficulty of the work increased according to the following floor levels: 3, 2, 1, 4, 5, 6. Likewise, productivity increased according to the same sequence. While we supposed that the standard height was 1.0, we observed a difference if the difficulty level of work was varied more.
To allocate the production periods, we compared the times needed to complete each level of the erection work, as shown in
Table 6. The values in
Table 6 can also be seen in the graphs displayed in
Figure 15,
Figure 16,
Figure 17,
Figure 18,
Figure 19,
Figure 20,
Figure 21 and
Figure 22. The total production time broadly depended upon the amount of erection materials. According to a comparison of the Levels 1 and 2 beam erection data, although Level 1 was more difficult, the total production time was shorter because the amount of necessary materials was less. In this regard, we found that the amount of materials has a greater influence on the production schedule than the height. Thus, we assumed the variation in difficulty to be 0.1, so if the variation increased, productivity would be controlled by height.
6. Sensitivity Analysis
This section discusses the sensitivity analysis that tested the model’s reaction to changes in the input parameters. We analyzed four critical factors: the amount of erection materials, stockyard capacity, height of the erection, and availability of a tower crane. Though there were a total of six factors found to be critical, workable days and workers’ skill could not be defined or assumed before the simulation. These two factors can only be obtained by extrapolation from simulation results and/or analysis of previous research. Among the four impact factors, we analyzed the amount of erection materials and capacity of the stockyard because they could be modified by individuals involved in the construction project participants. For example, materials could be reduced by the strategic structural design of a structural designer, and the capacity of a stockyard could be adjusted by a strategic floor or path plan. Our sensitivity analysis considered these point of flexibility. The setup and results of this analysis are presented in
Table 7 and visualized in
Figure 23.
Traditionally, construction managers have accepted that productivity decreases when the amount of erection materials increases. However, according to our sensitivity analysis, productivity decreased but then recovered when the amount of erection materials regularly increased. On the other hand, when the amount was enough to disturb productivity, it decreased along with the extension of the capacity of the stockyard. With regards to construction planning, this analysis can be applied to determine the proper amount of erection materials and size of the stock yard needed.
7. Conclusions
By executing the BIM-integrated simulation, we were able to obtain a dynamic productivity plan and calculate the project’s per-hour rate of production. Compared to the traditional construction planning method, this system established a reliable construction plan from a bottom-up approach, meaning that we considered operational work and the relationships among the various activities, activities and resources, and resources themselves. This activity-based construction planning method improves reliability because the results are much closer to the actual schedule and the construction plan can be adjusted whenever the BIM model is modified. Also, when delays occur or resources change, using this BIM-integrated simulation framework is more flexible because the work is broken down into more detailed activities.
This research presented the development and application of the BIM-integrated simulation framework for reliable construction planning. From this framework, the operational level productivity is measurable, which means it can be used for whole-project planning. While BIM has been used in various construction fields ranging from predicting the energy performance of buildings to analyzing structural safety, BIM usage is relatively limited in the construction management field. This research presented a method capable of expanding BIM’s utilization in the construction management domain. Also, since BIM information can now be reused by construction engineers establishing construction plans, the framework saves time, money, and effort that would otherwise be spent reproducing construction project data.
Furthermore, the developed framework presents a new perspective on construction planning by considering construction projects’ uniqueness and complexity. Whenever the BIM model is modified during the work’s progress, users can easily regenerate construction plans because BIM is integrated with the construction work simulation. Moreover, in the simulation environment, users can synthetically manipulate complex factors and resources. Since the current planning method uses historical data and heuristic adjustments, such plans depend on historical sample data and managers’ knowledge and skill. That is, these construction plans cannot ensure consistency or accuracy. However, our framework facilitates more reliable planning by using the quantitative BIM-integrated simulation method. The end result is more reliable construction plans.
While the BIM-integrated simulation method created for this research is a technical breakthrough that represents a vast improvement in management efficiency, there were some limitations to this research. First, researchers should validate this framework by applying it to various test cases. Second, the framework should be employed in diverse types of construction beyond that of the steel erection work exampled here. Finally, the simulation results should be made visual via a BIM model; doing so would extend the applicability of this framework.


