
The Effect of Water Injection on the Control of In-Cylinder Pressure and Enhanced Power Output in a Four-Stroke Spark-Ignition Engine

Abstract
:1. Introduction
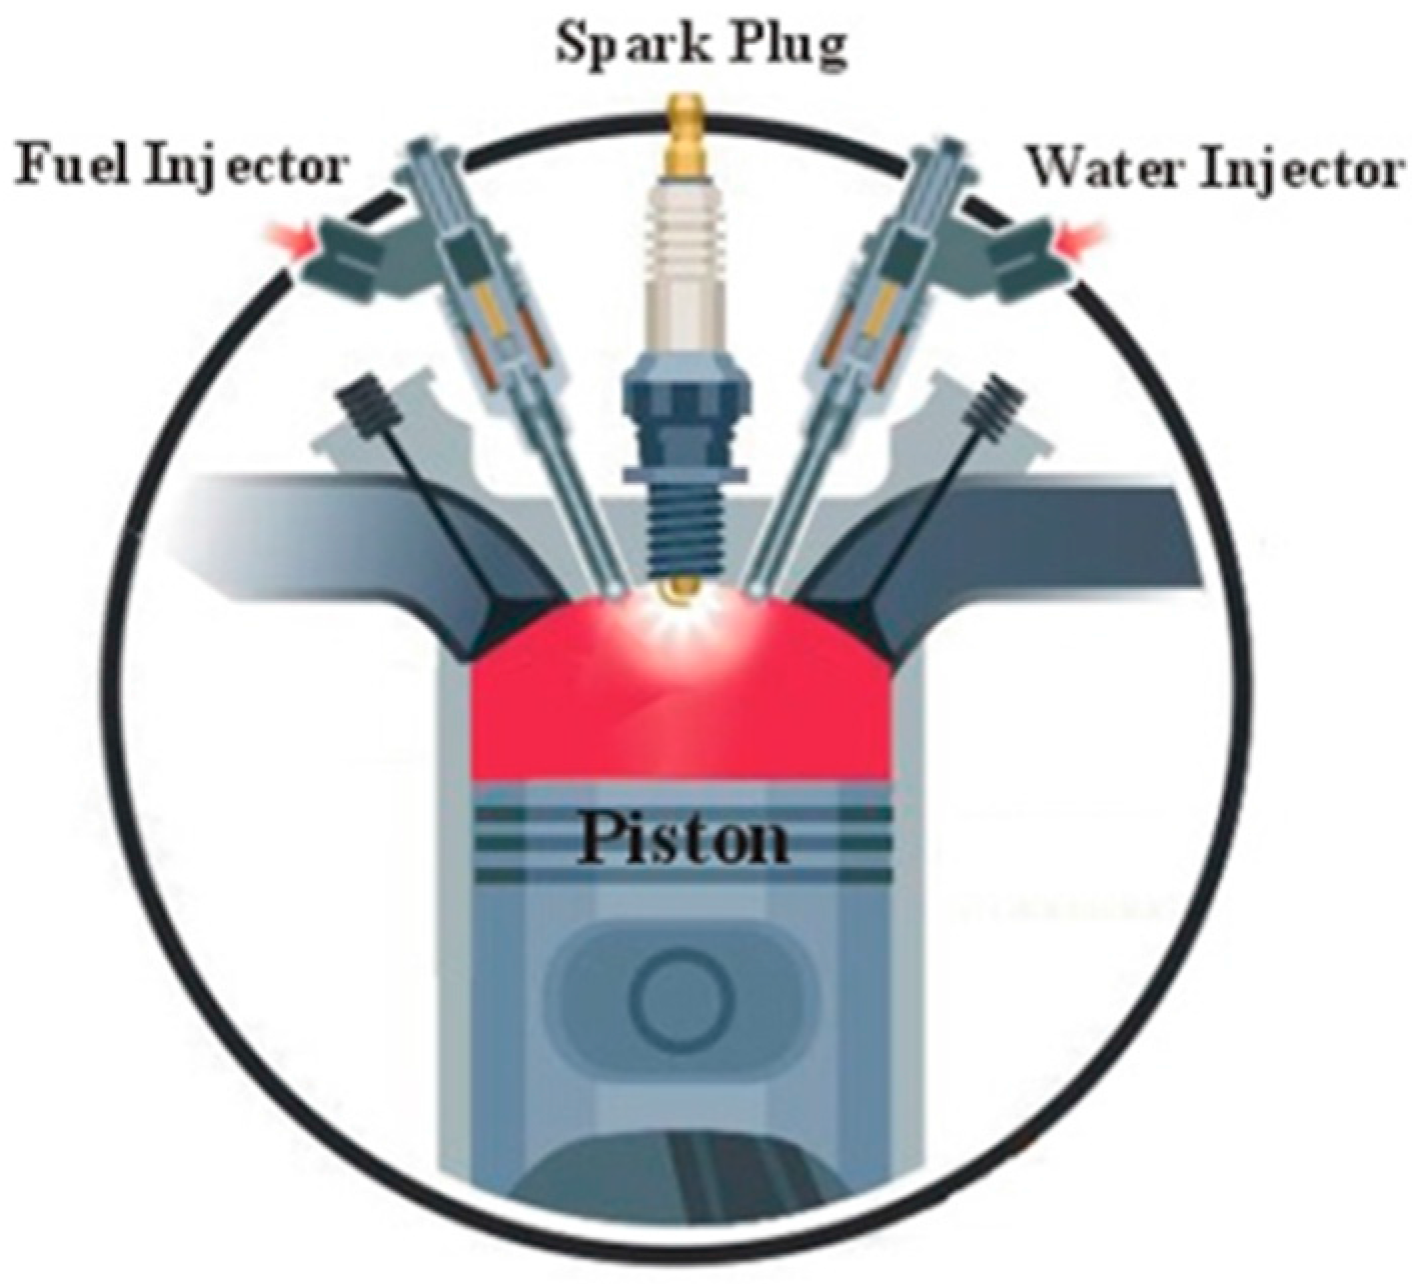
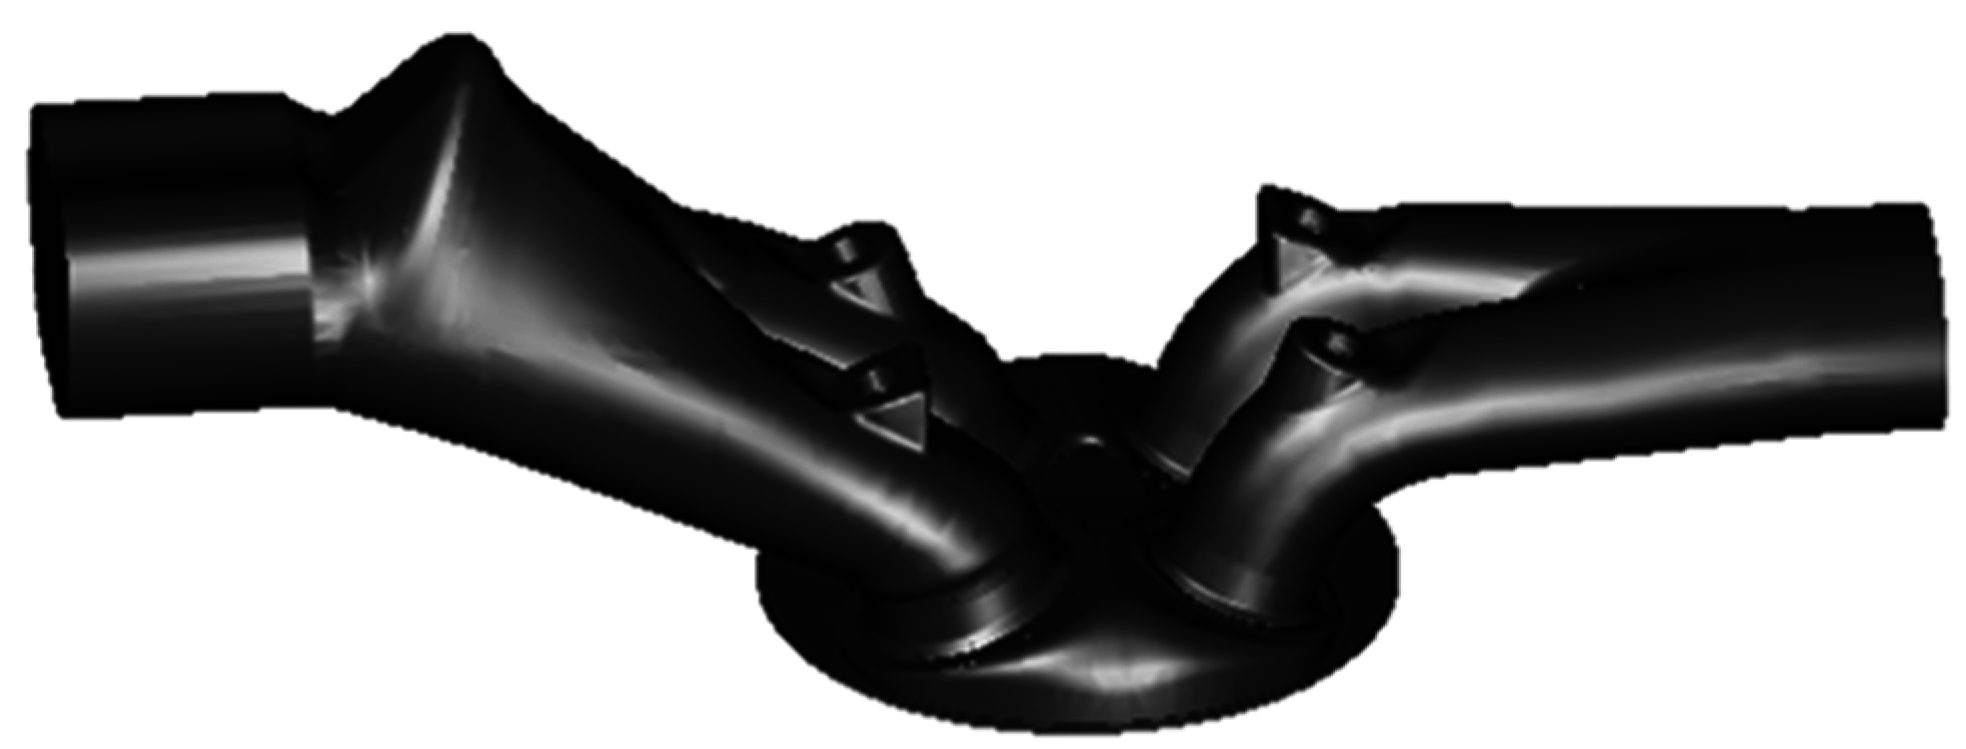
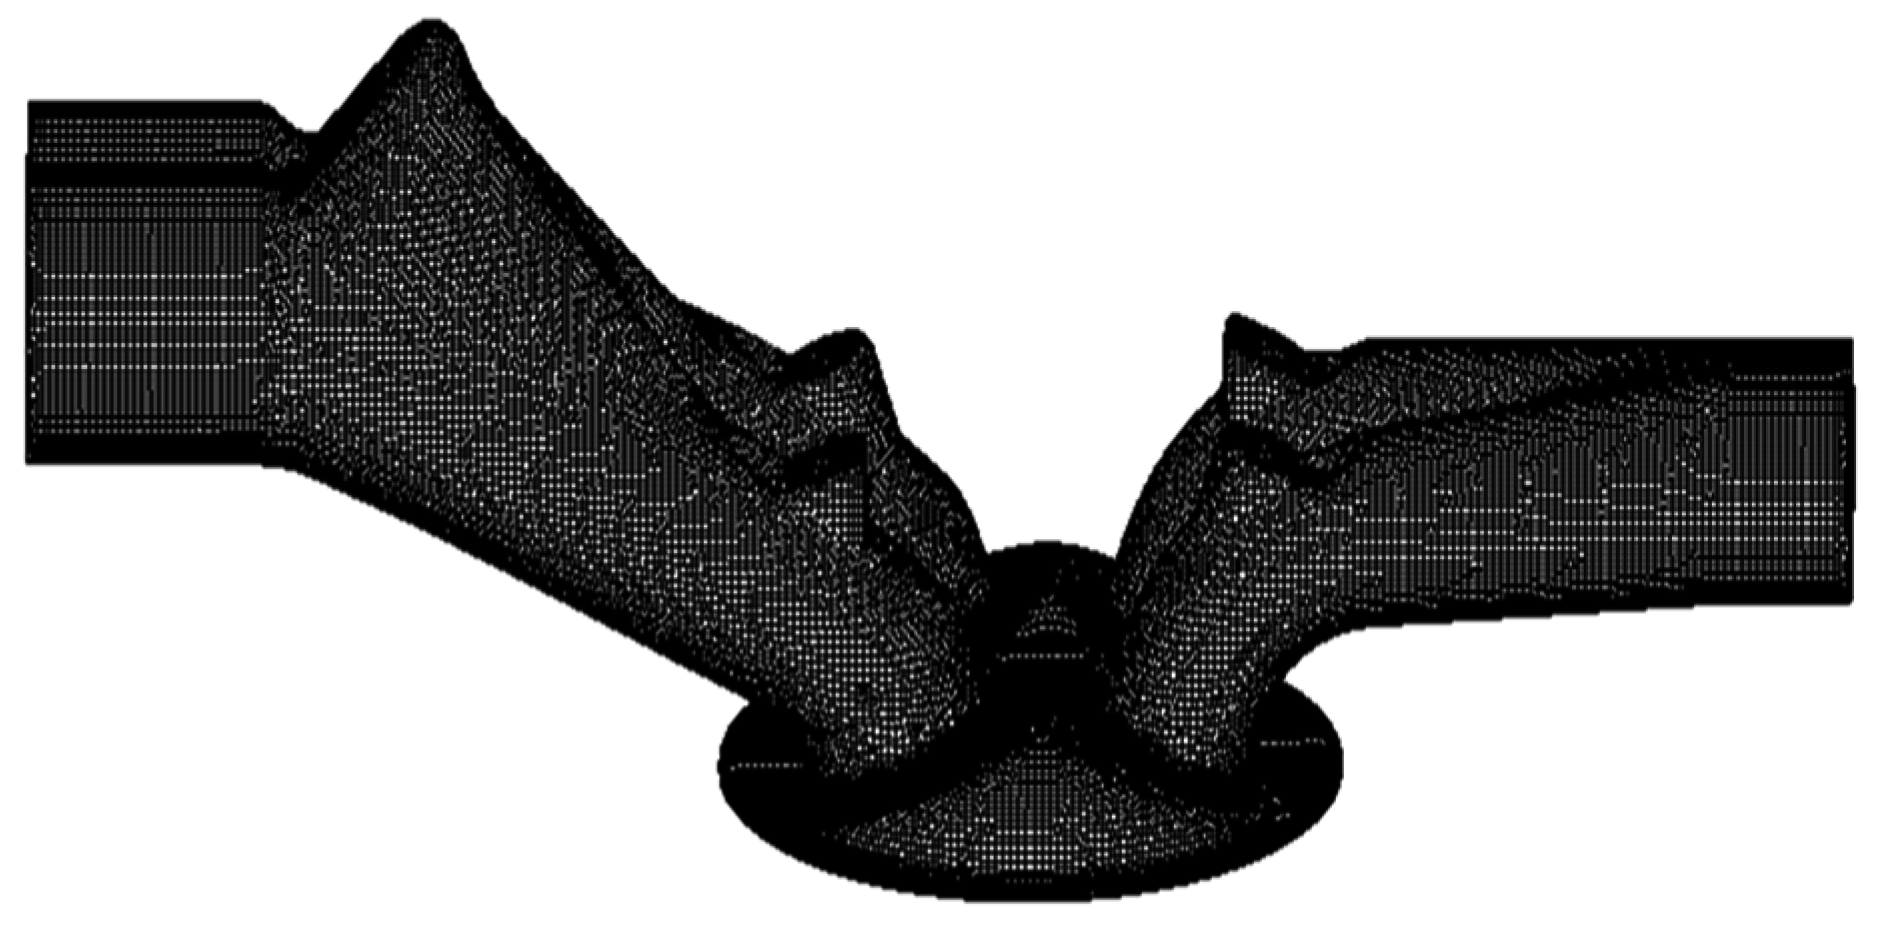
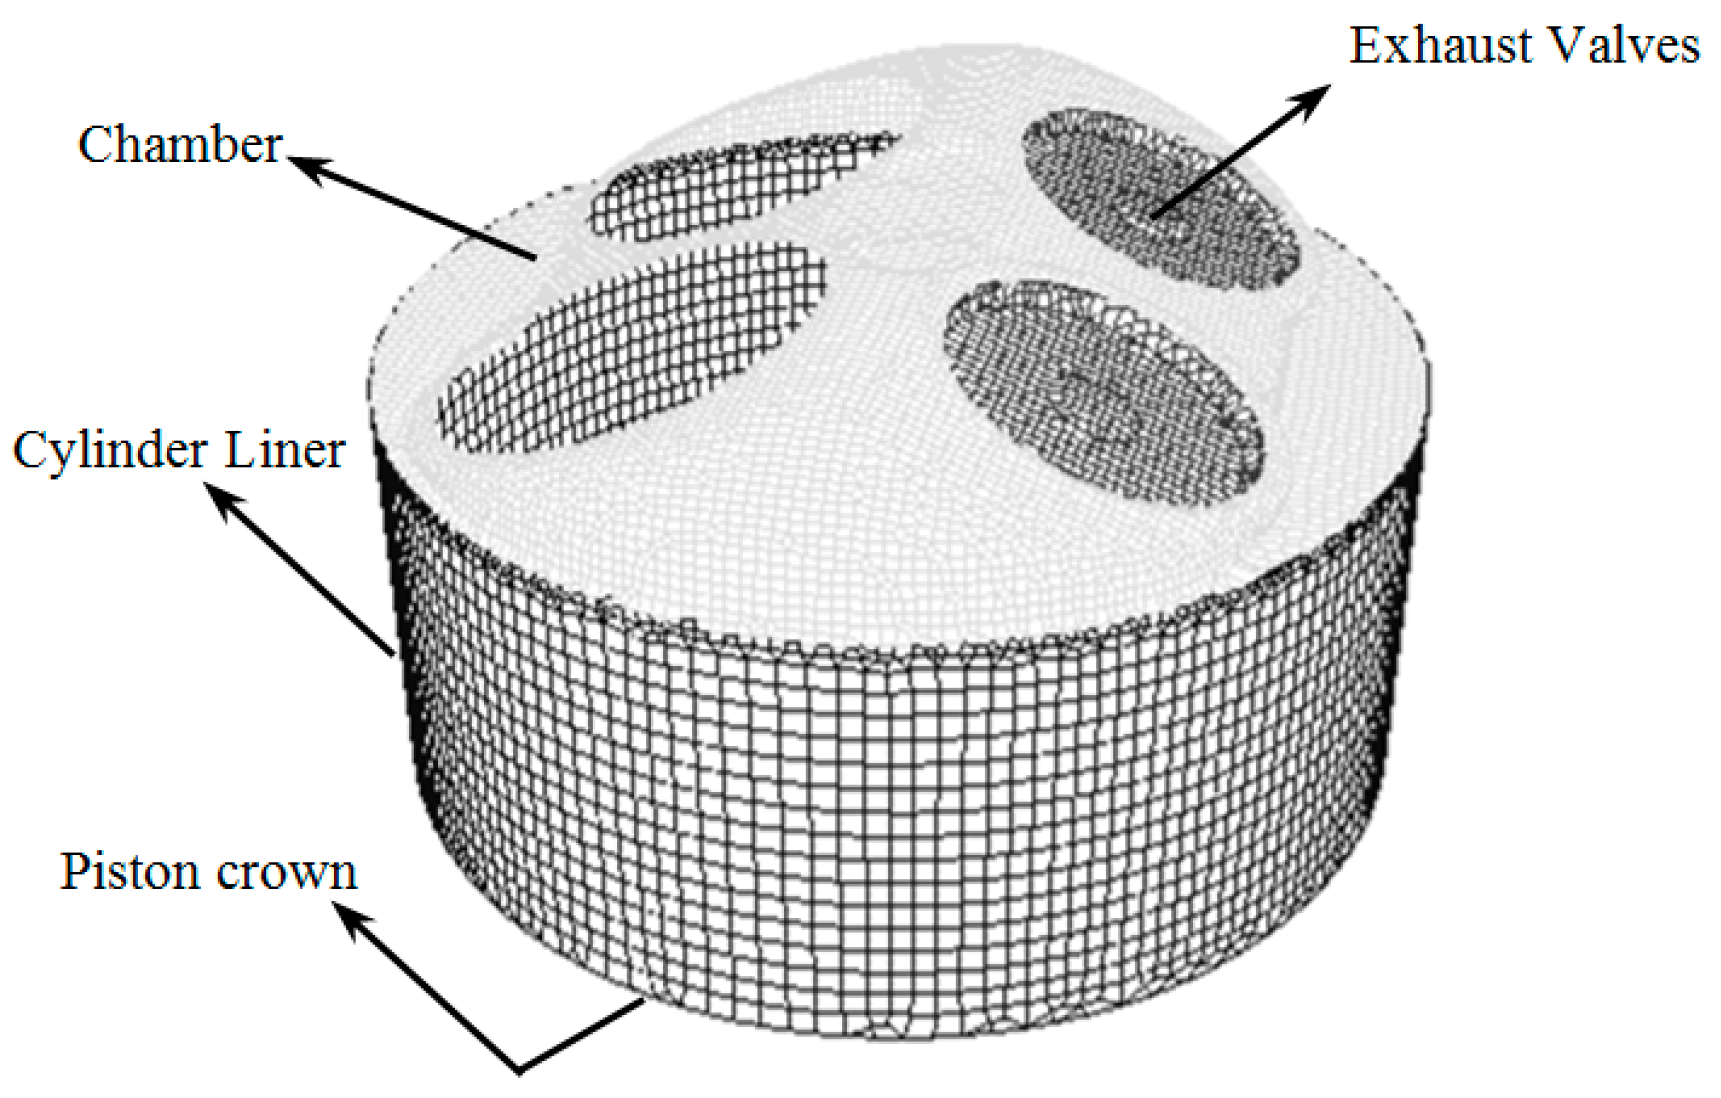
2. Studied Model
3. Results and Discussion
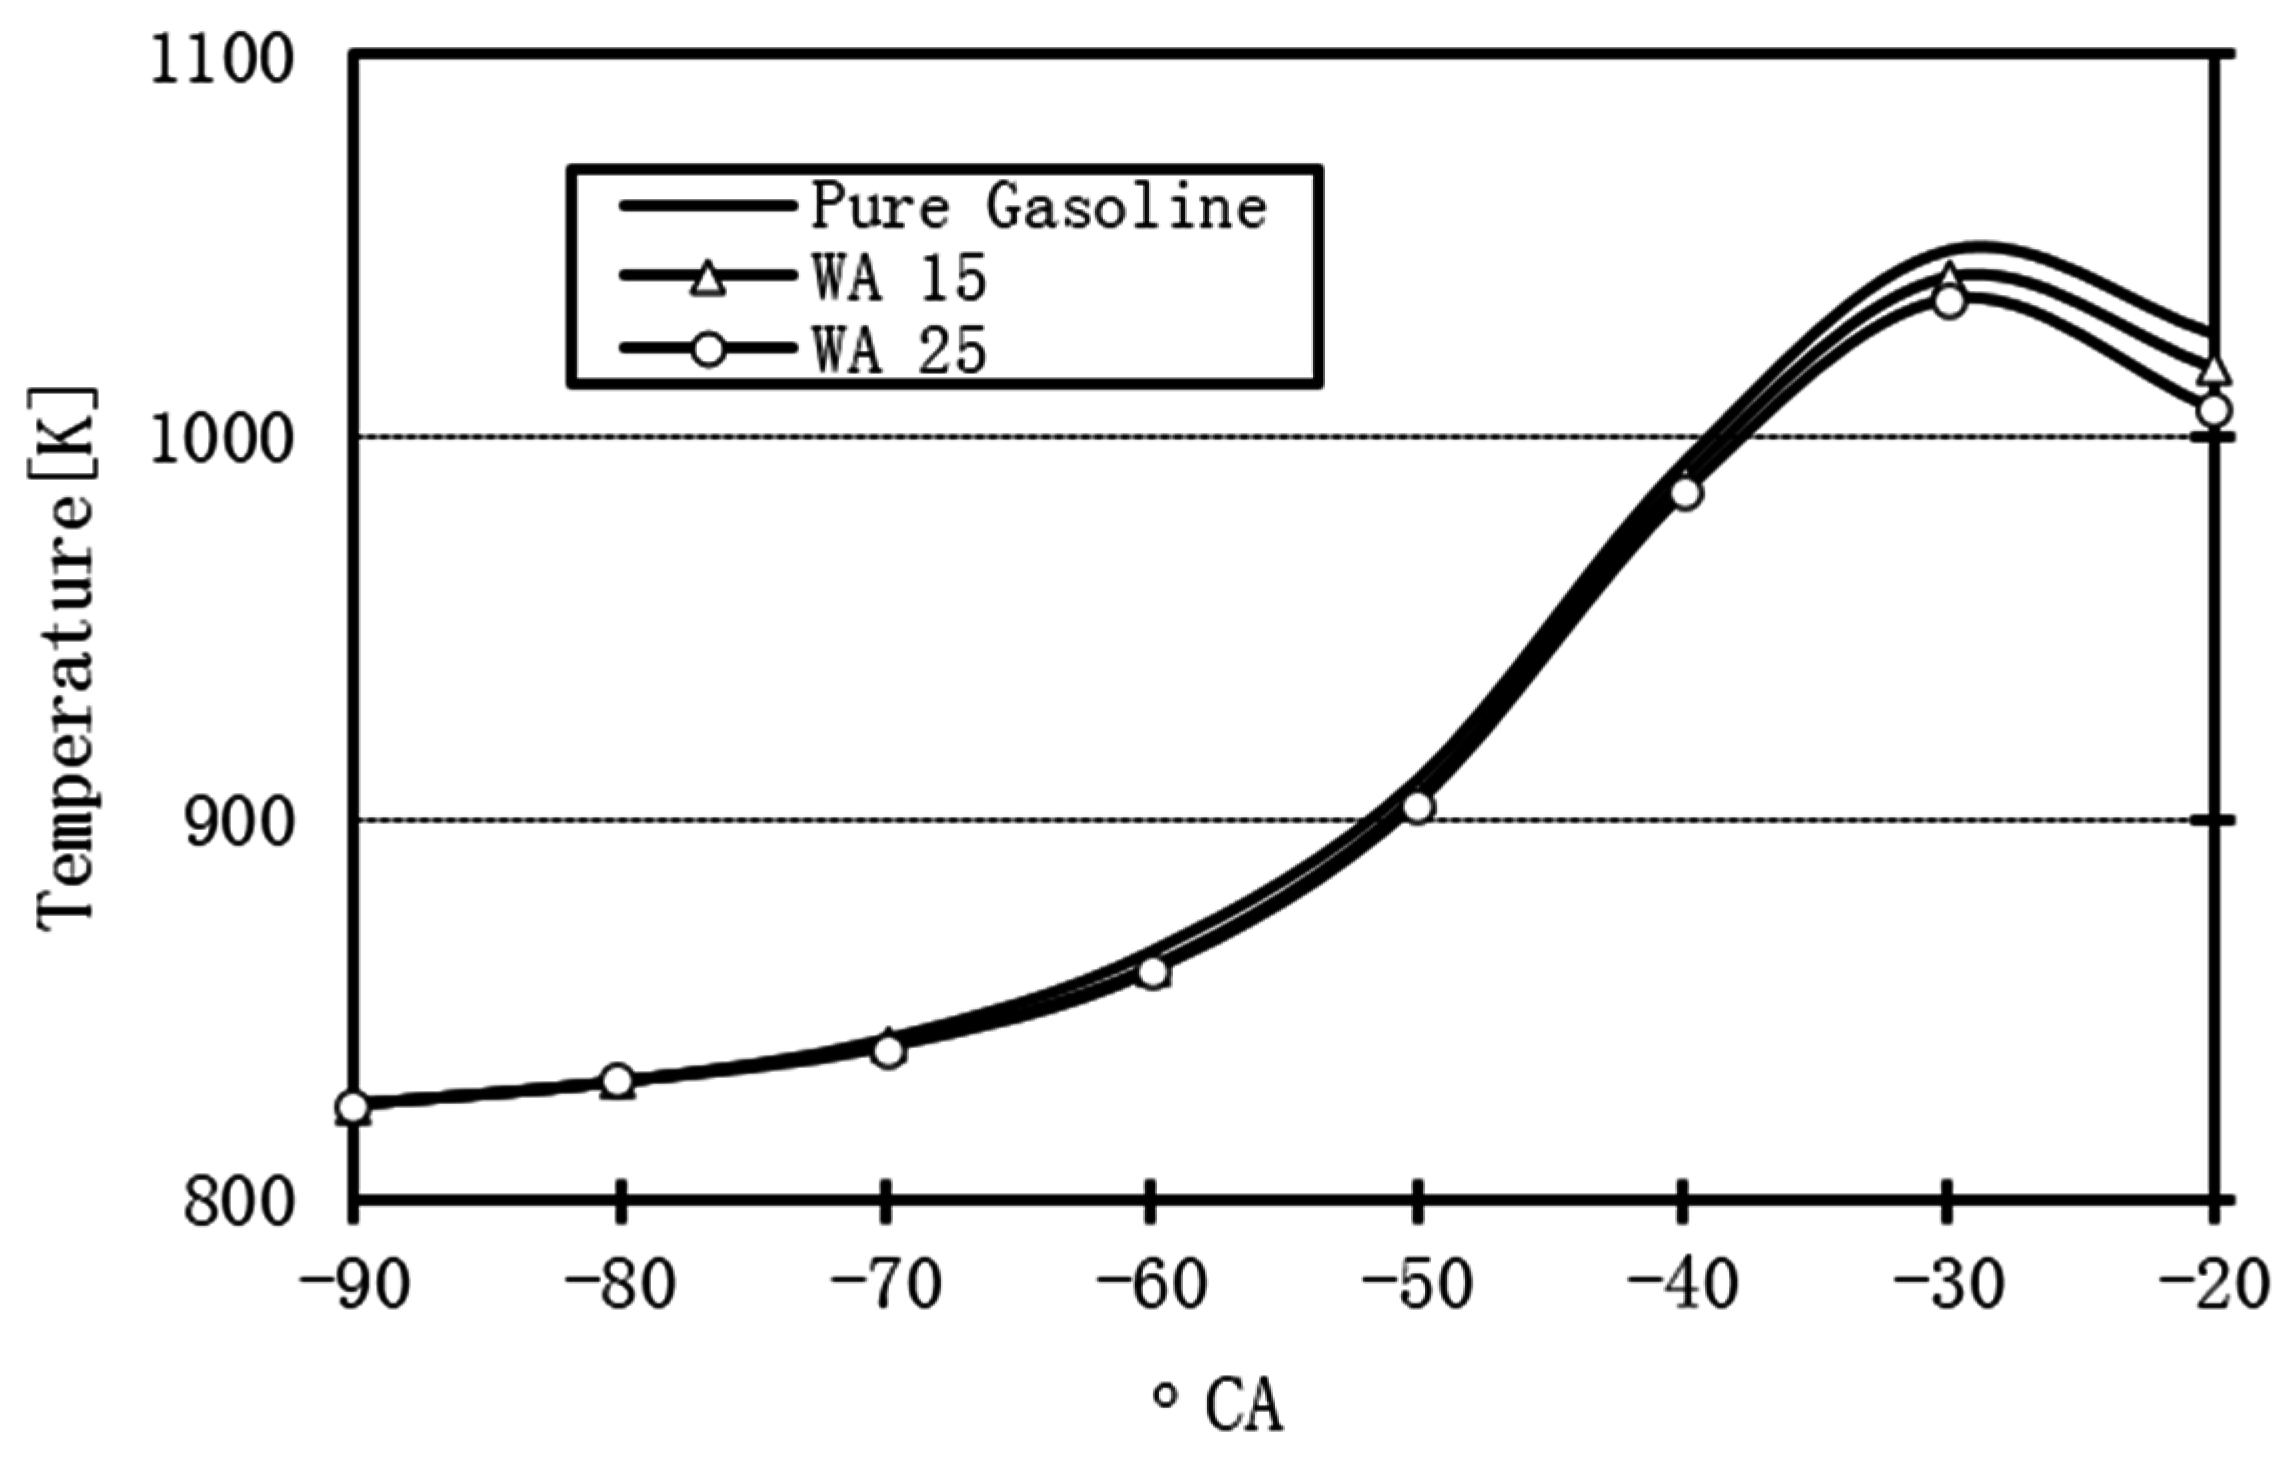
3.1. Water Addition During the Compression Stroke
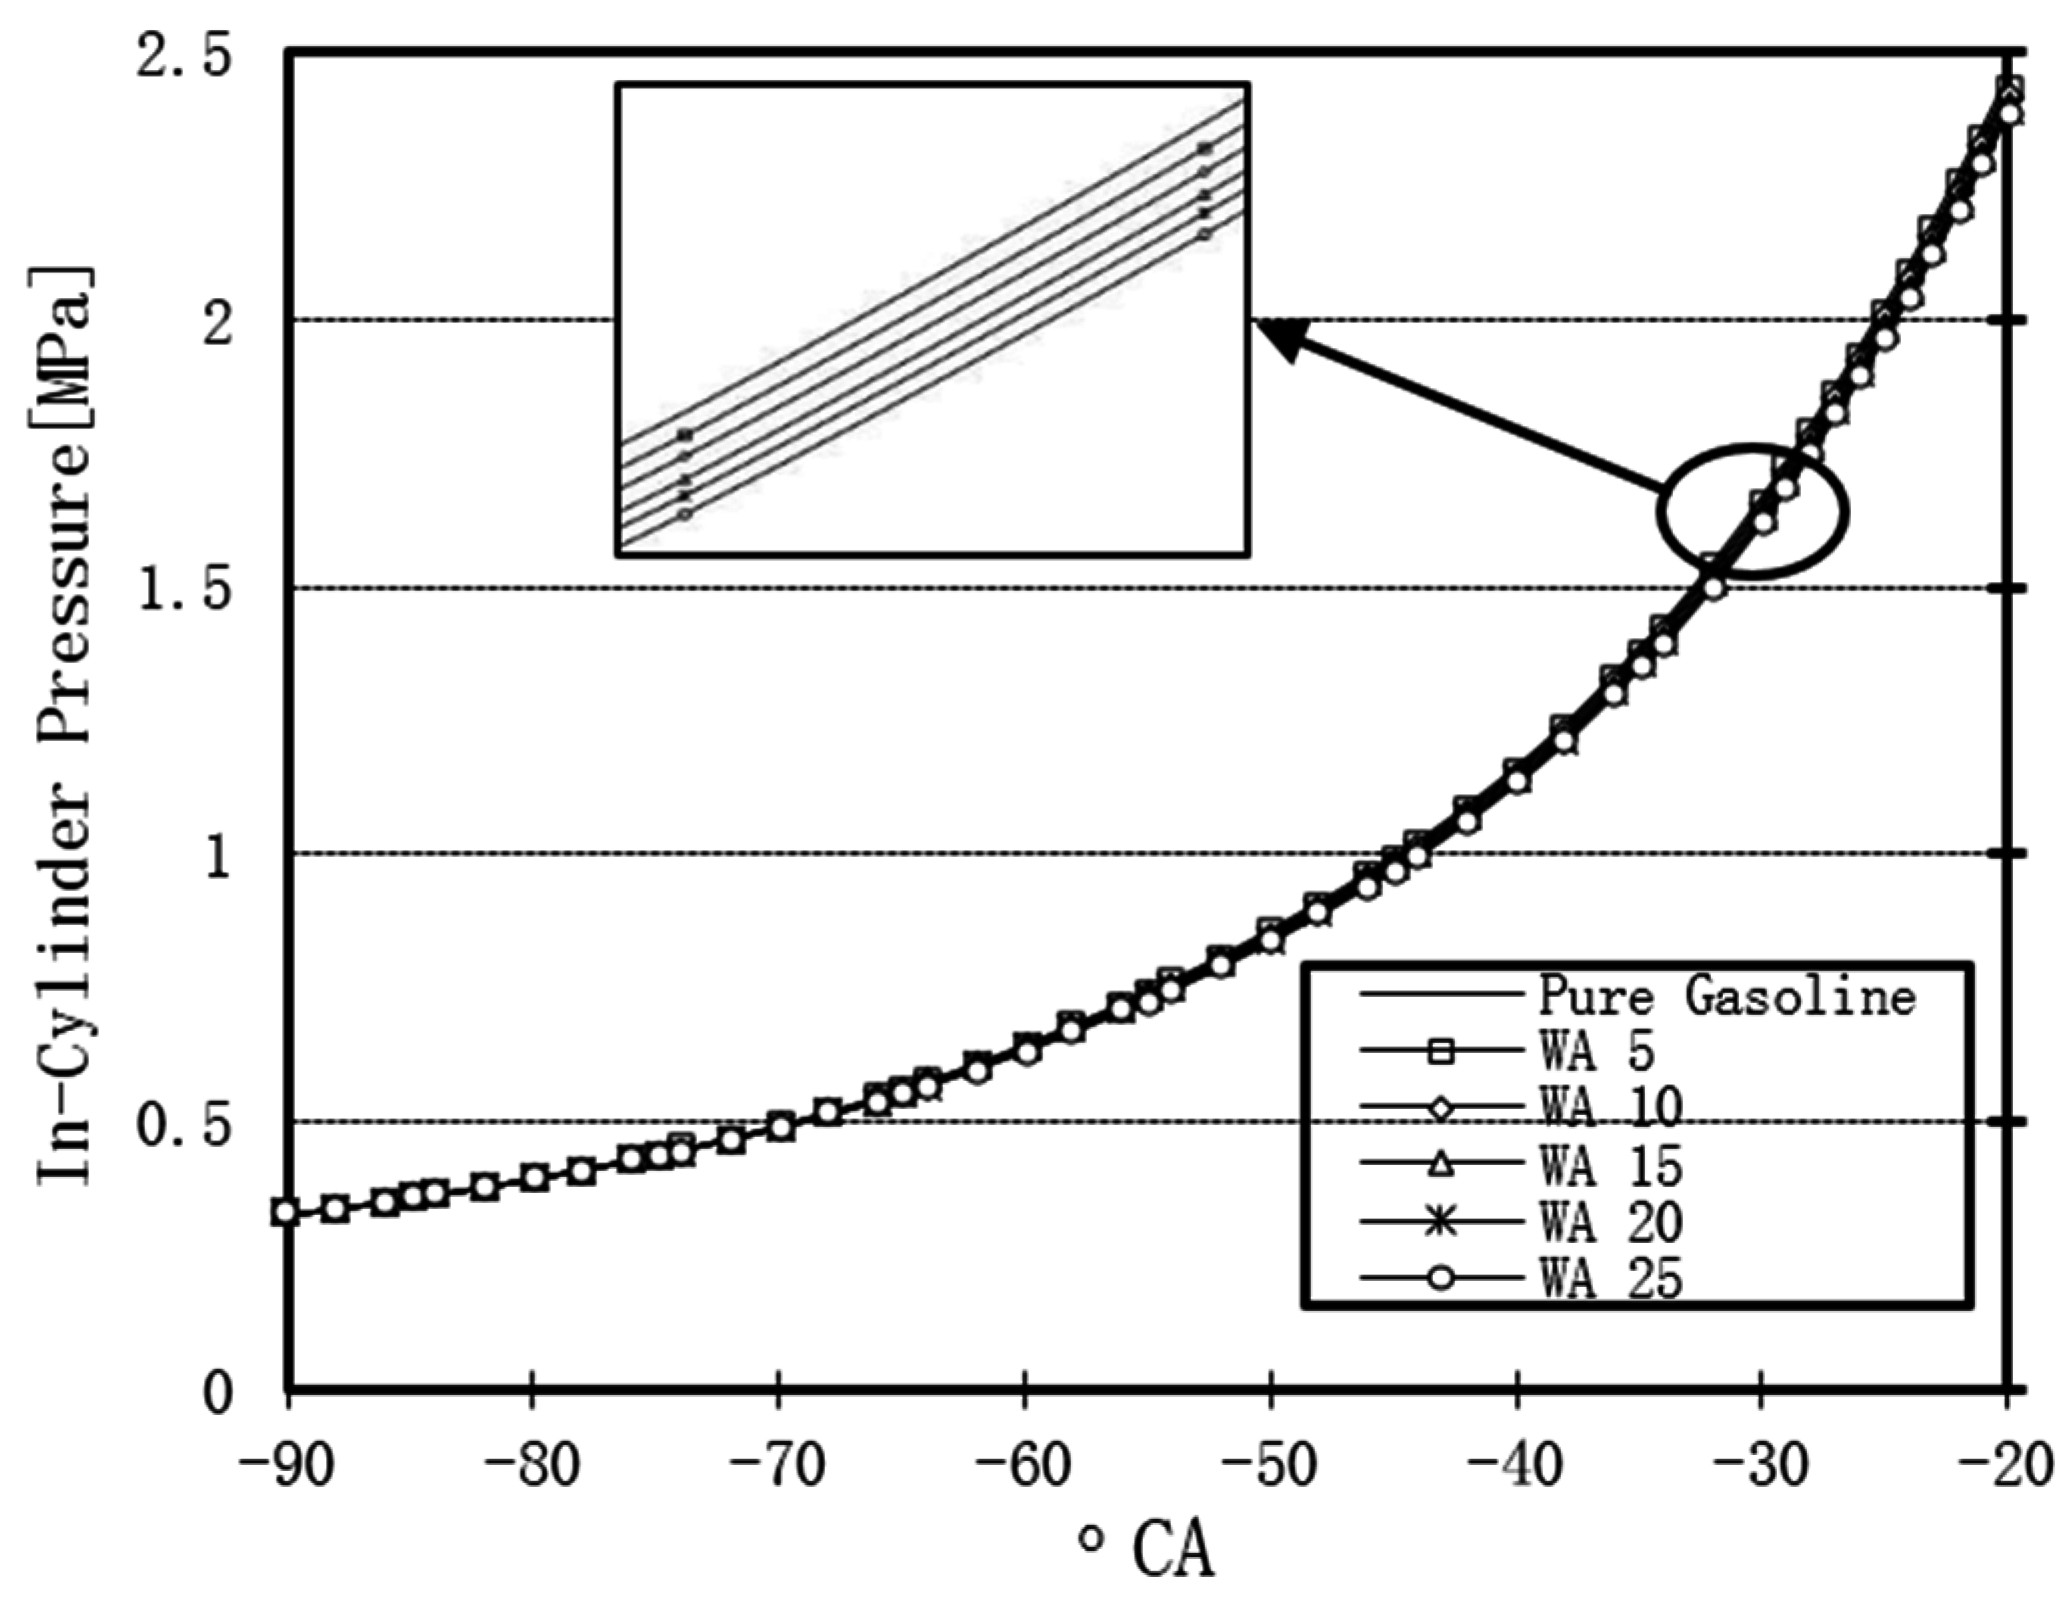
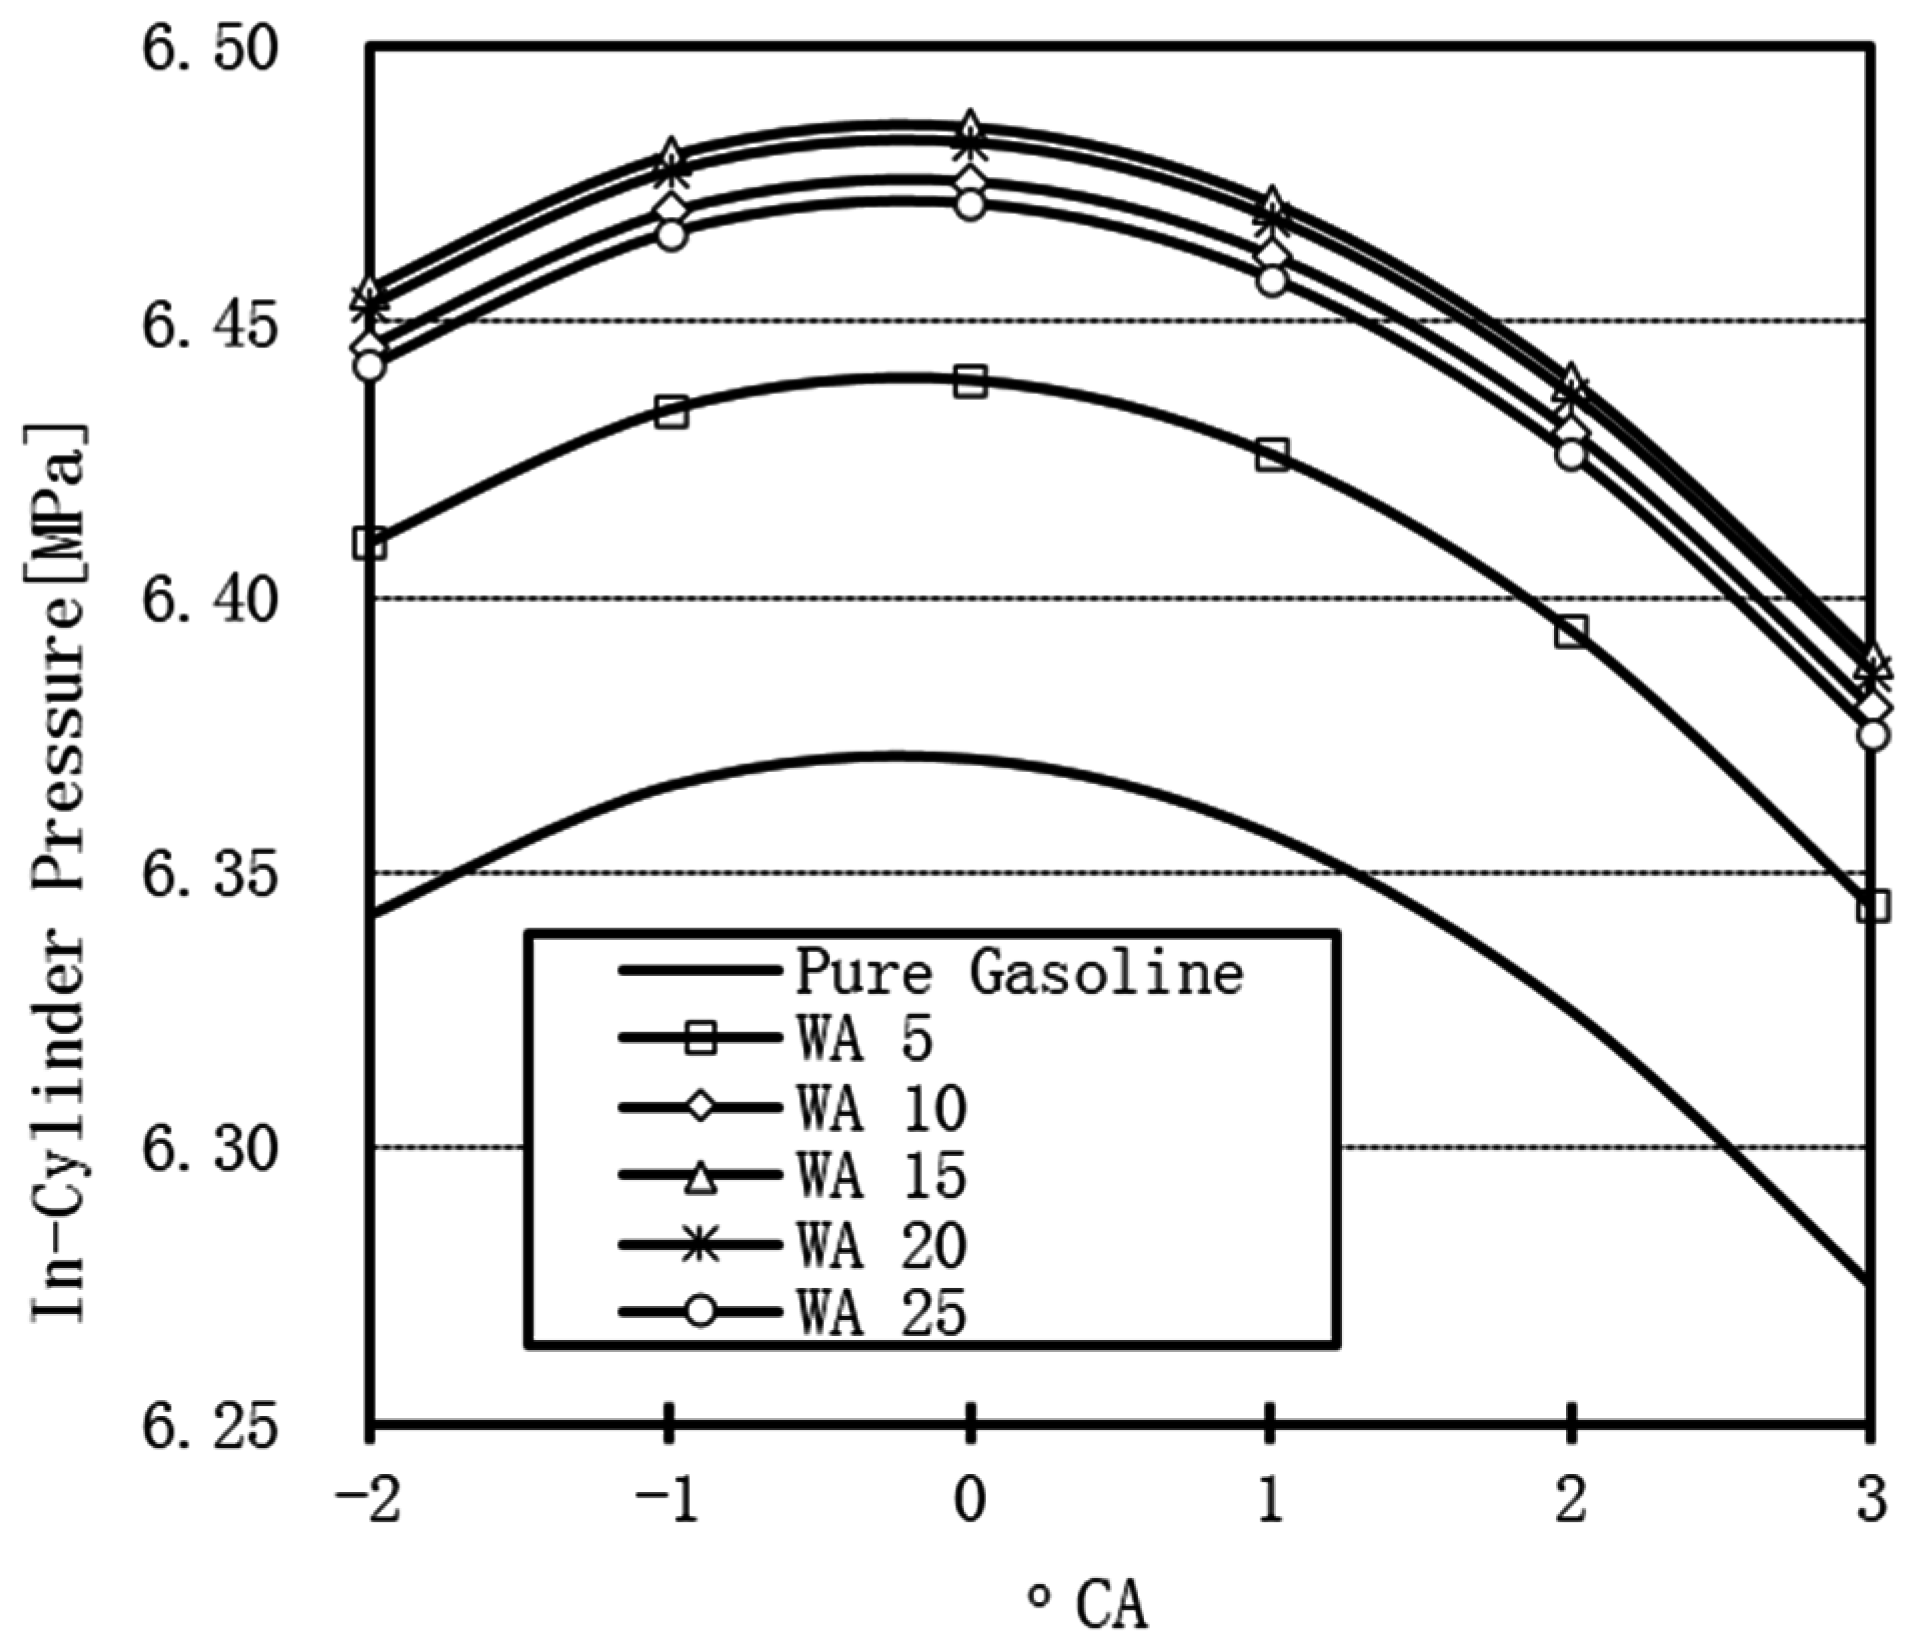
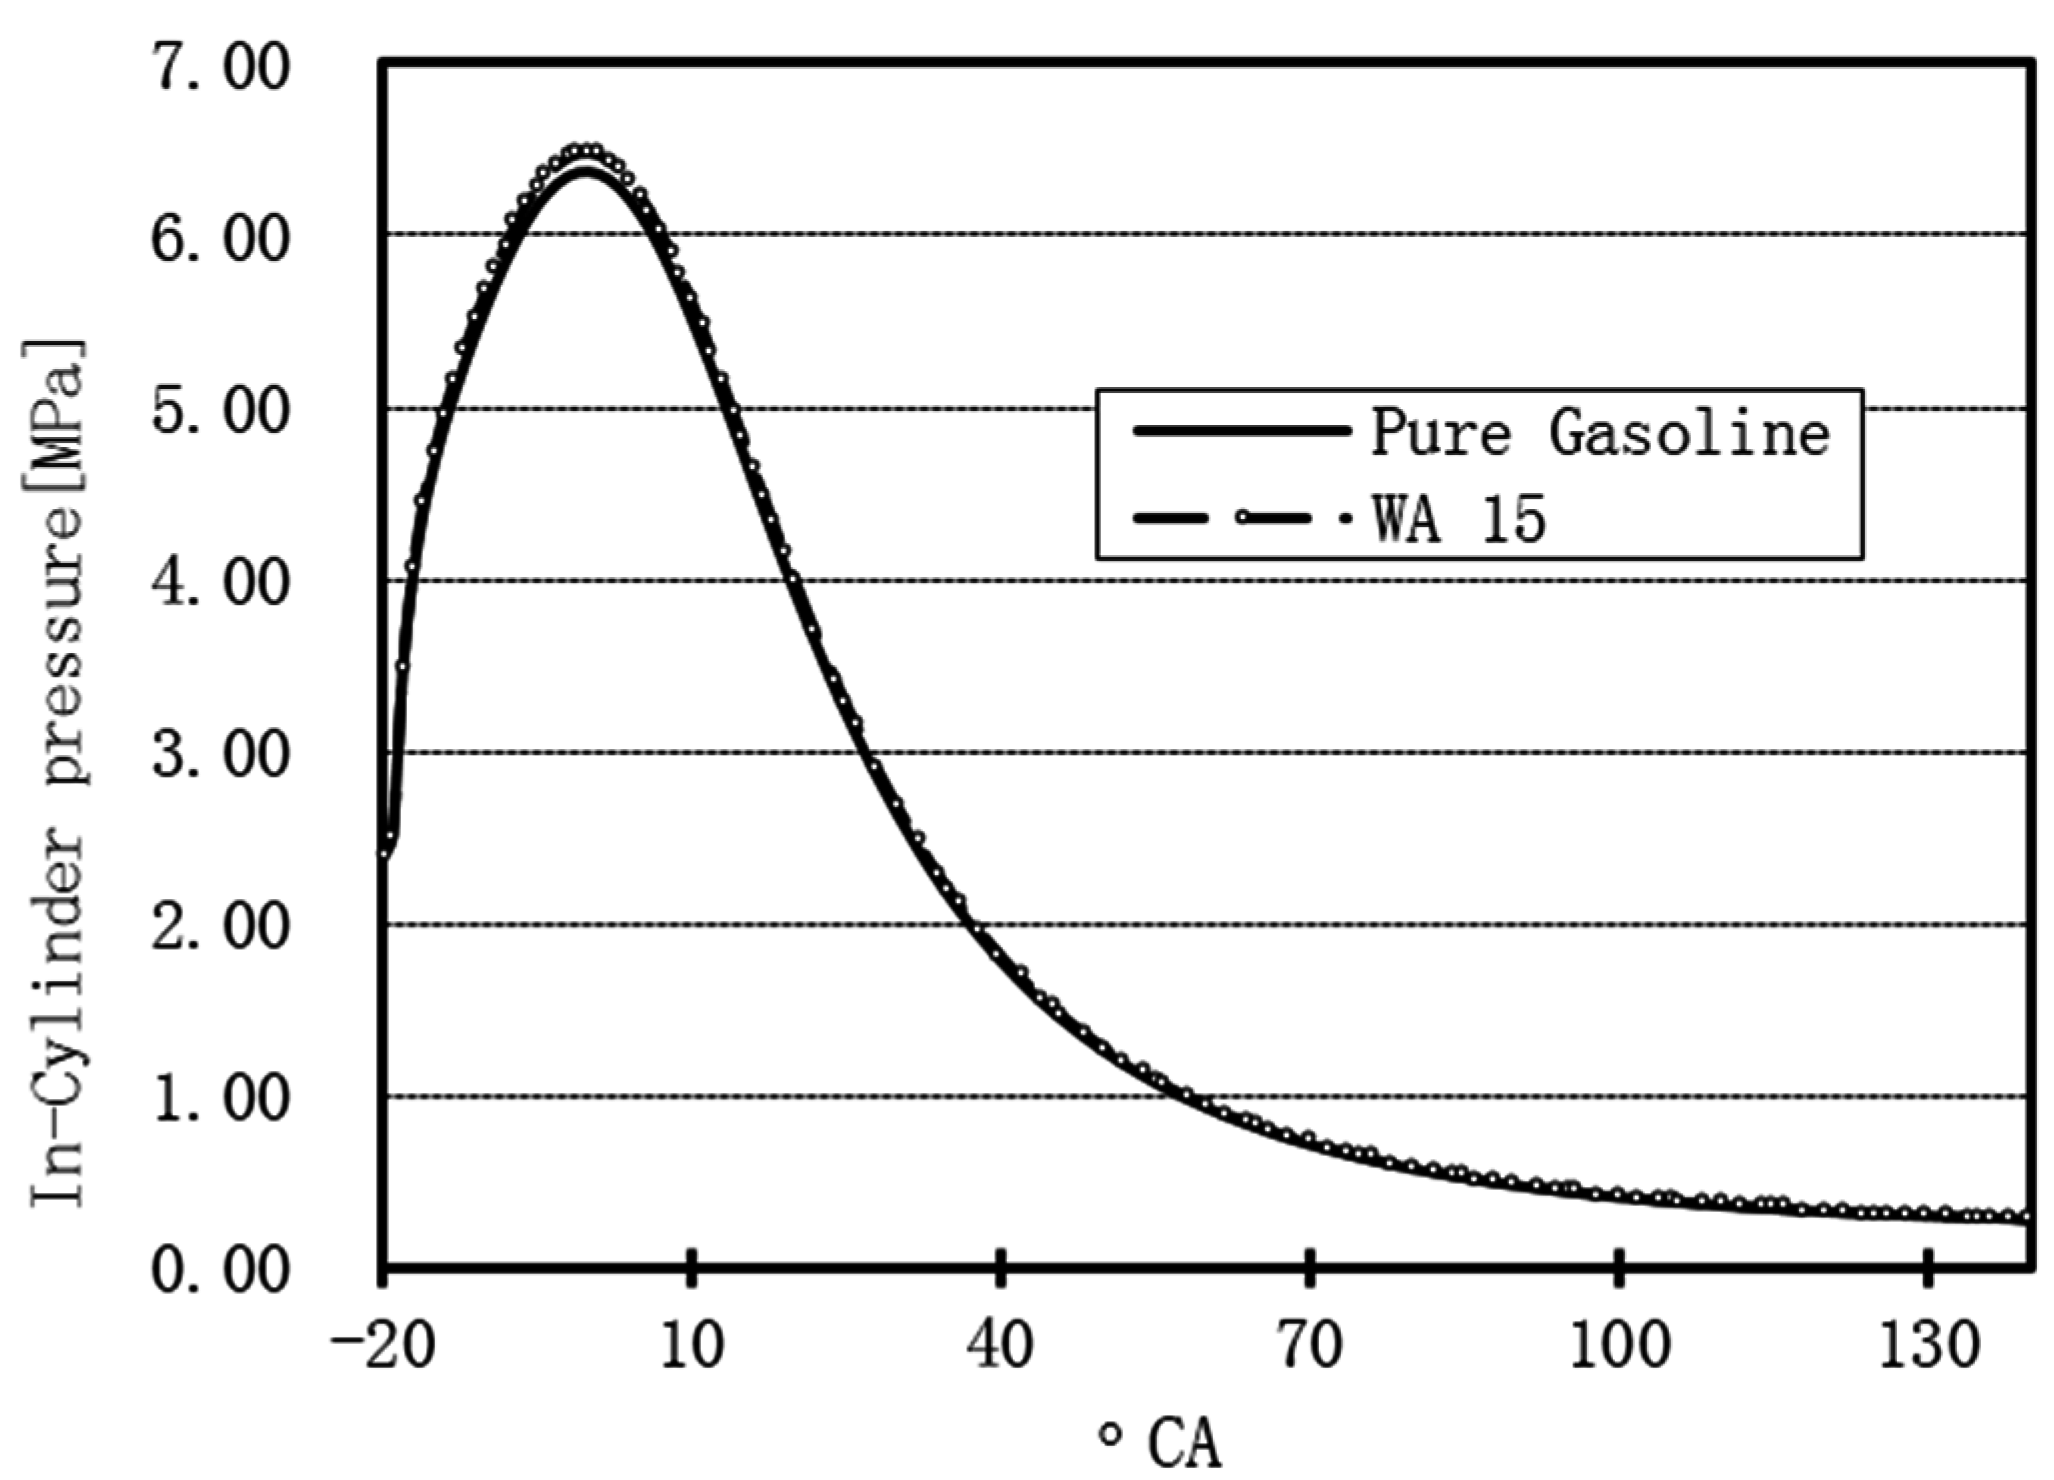
3.1.1. Effects on the In-Cylinder Pressure
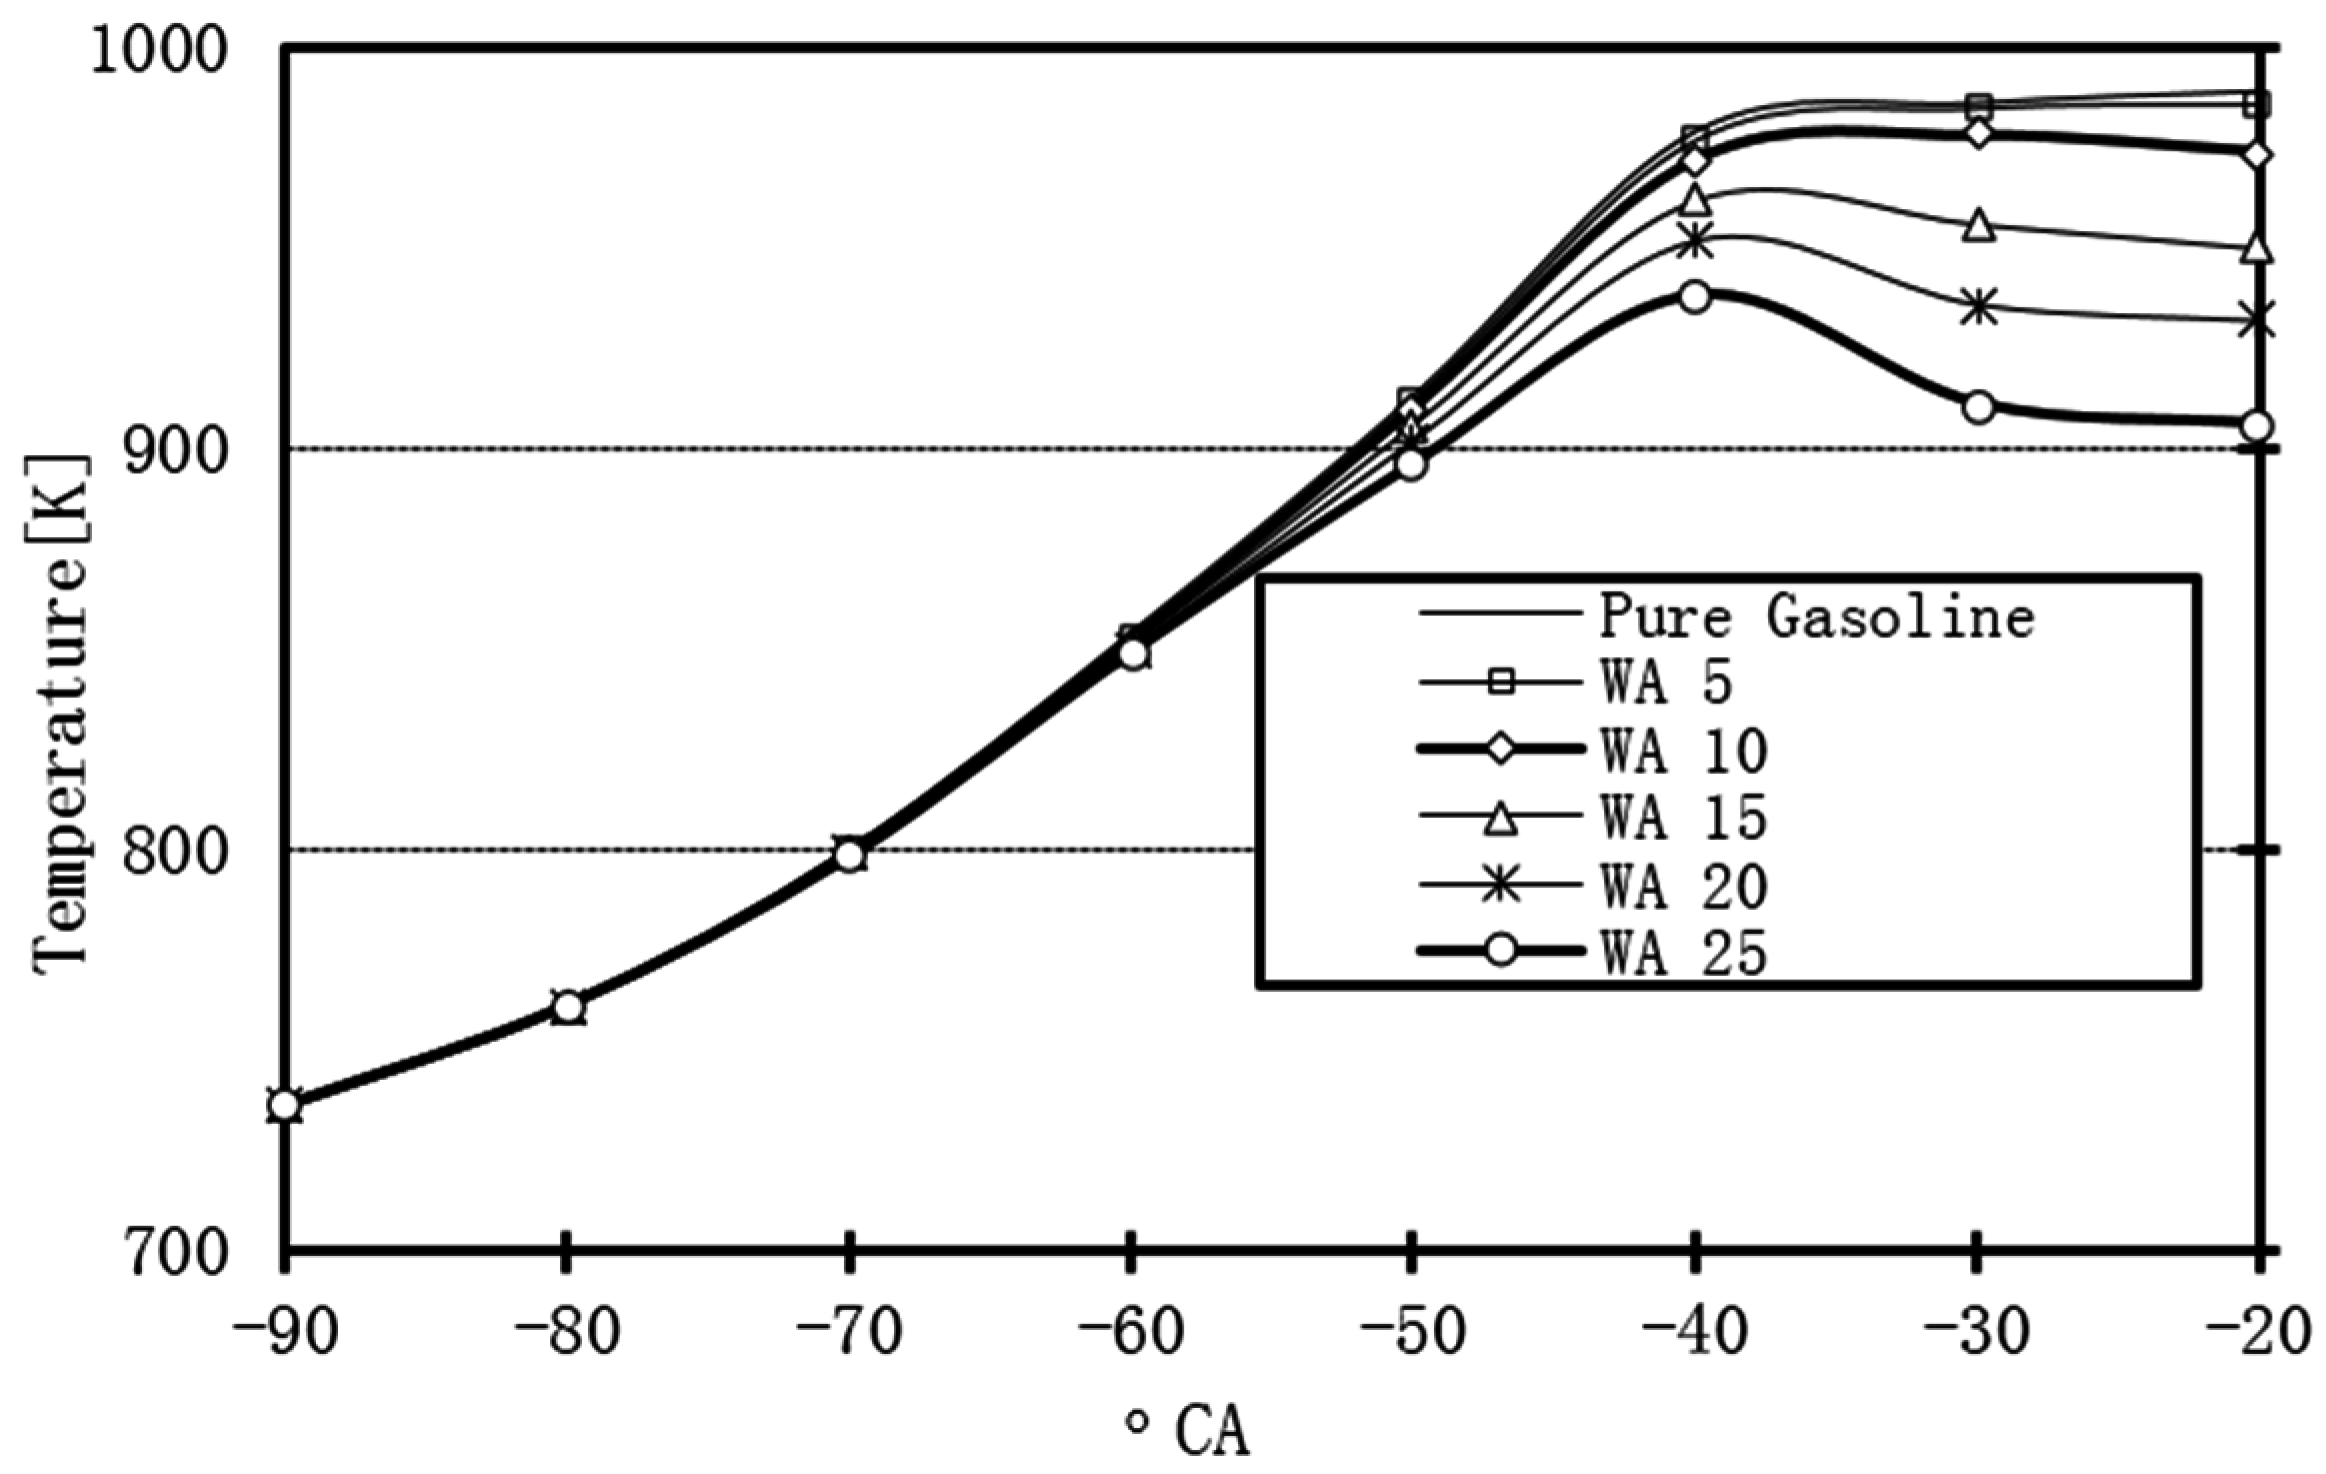
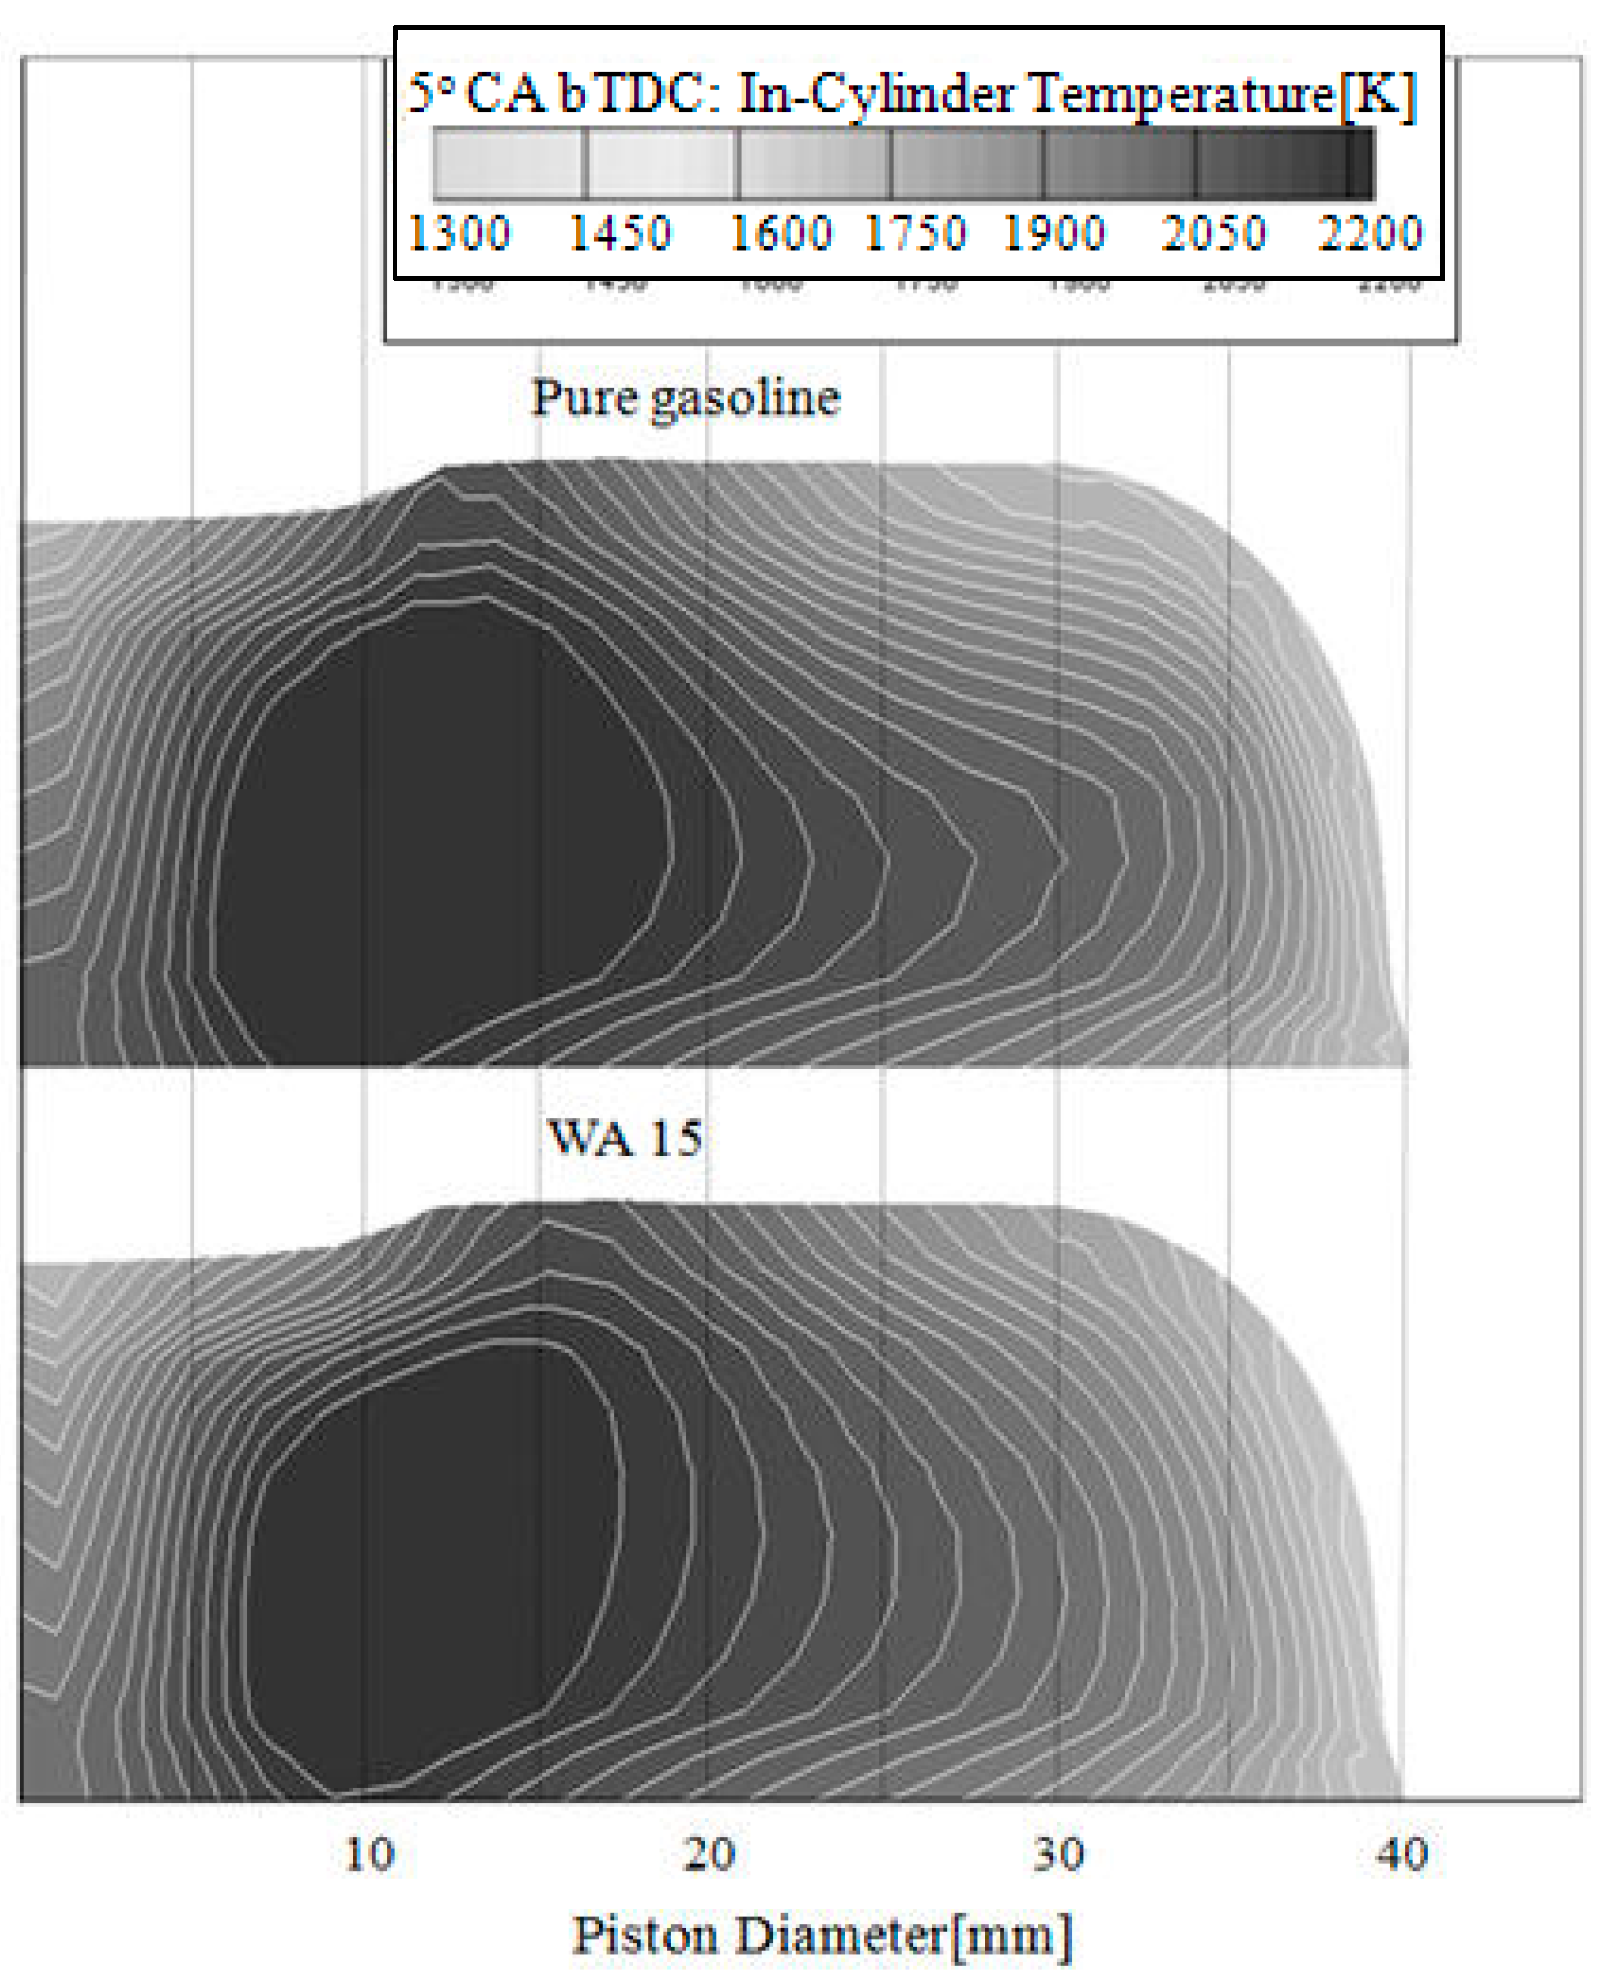
3.1.2. Effects of WI on the Reduction in Energy Losses via Heat Transfer
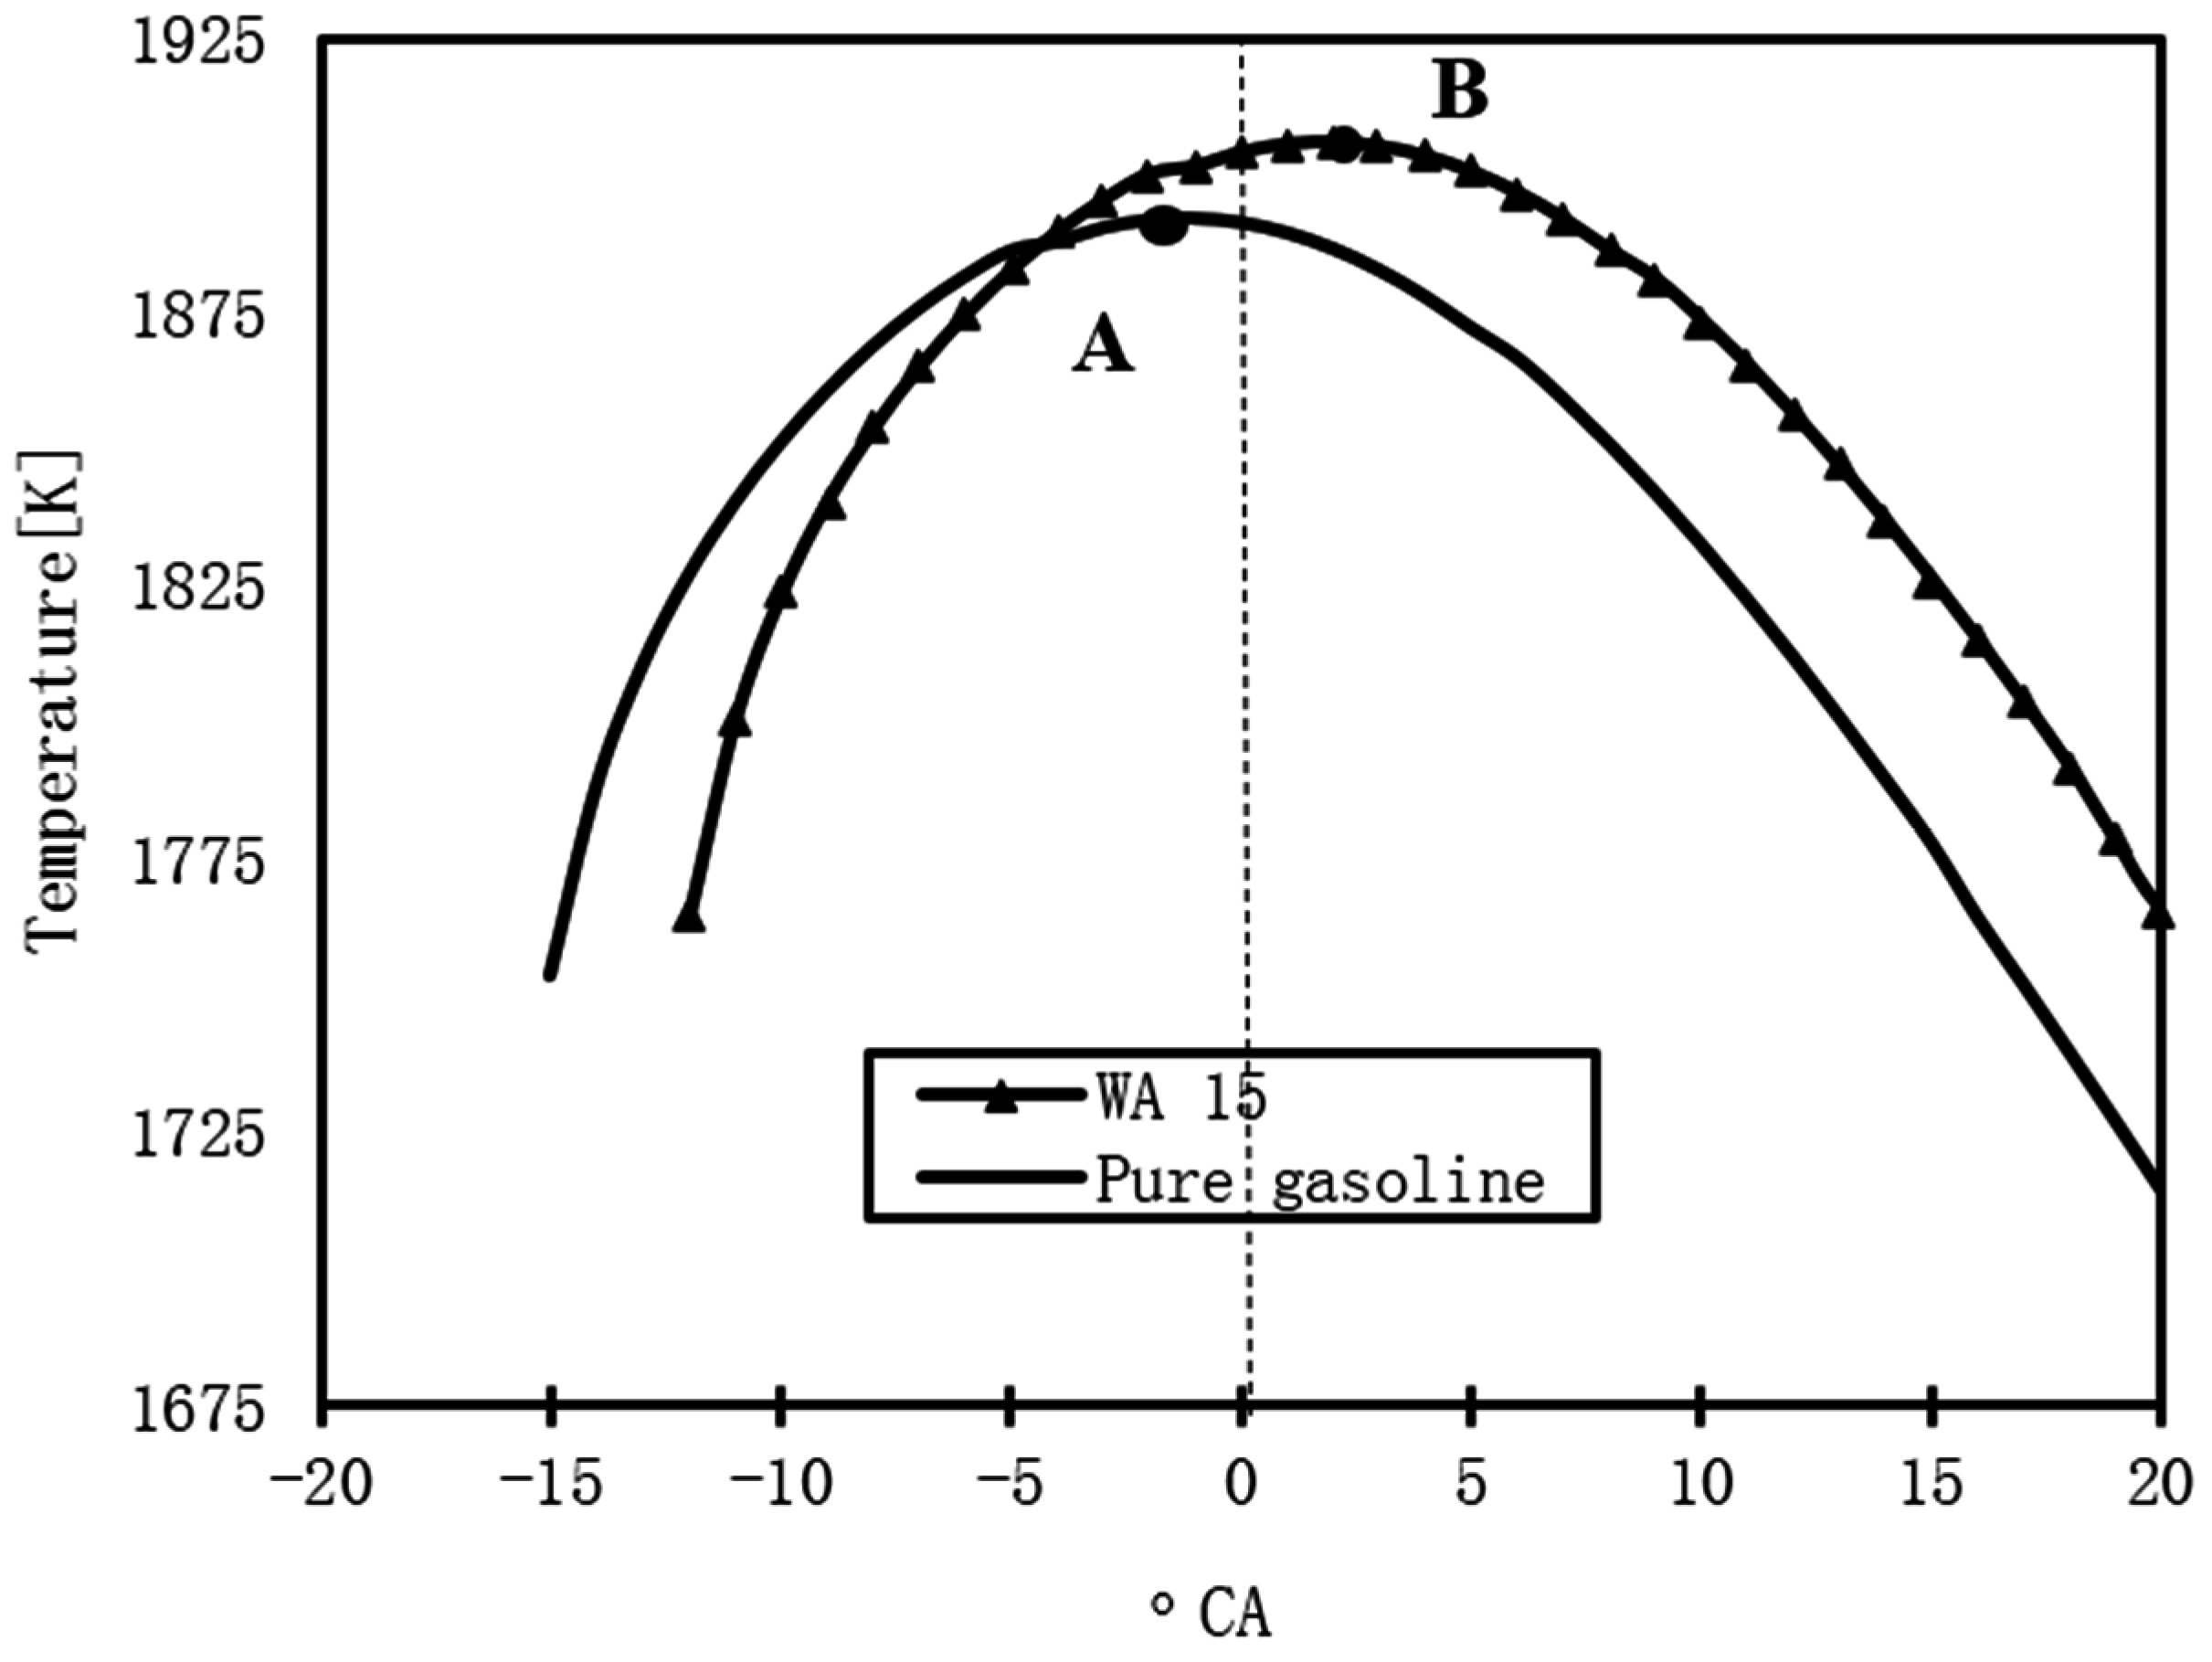
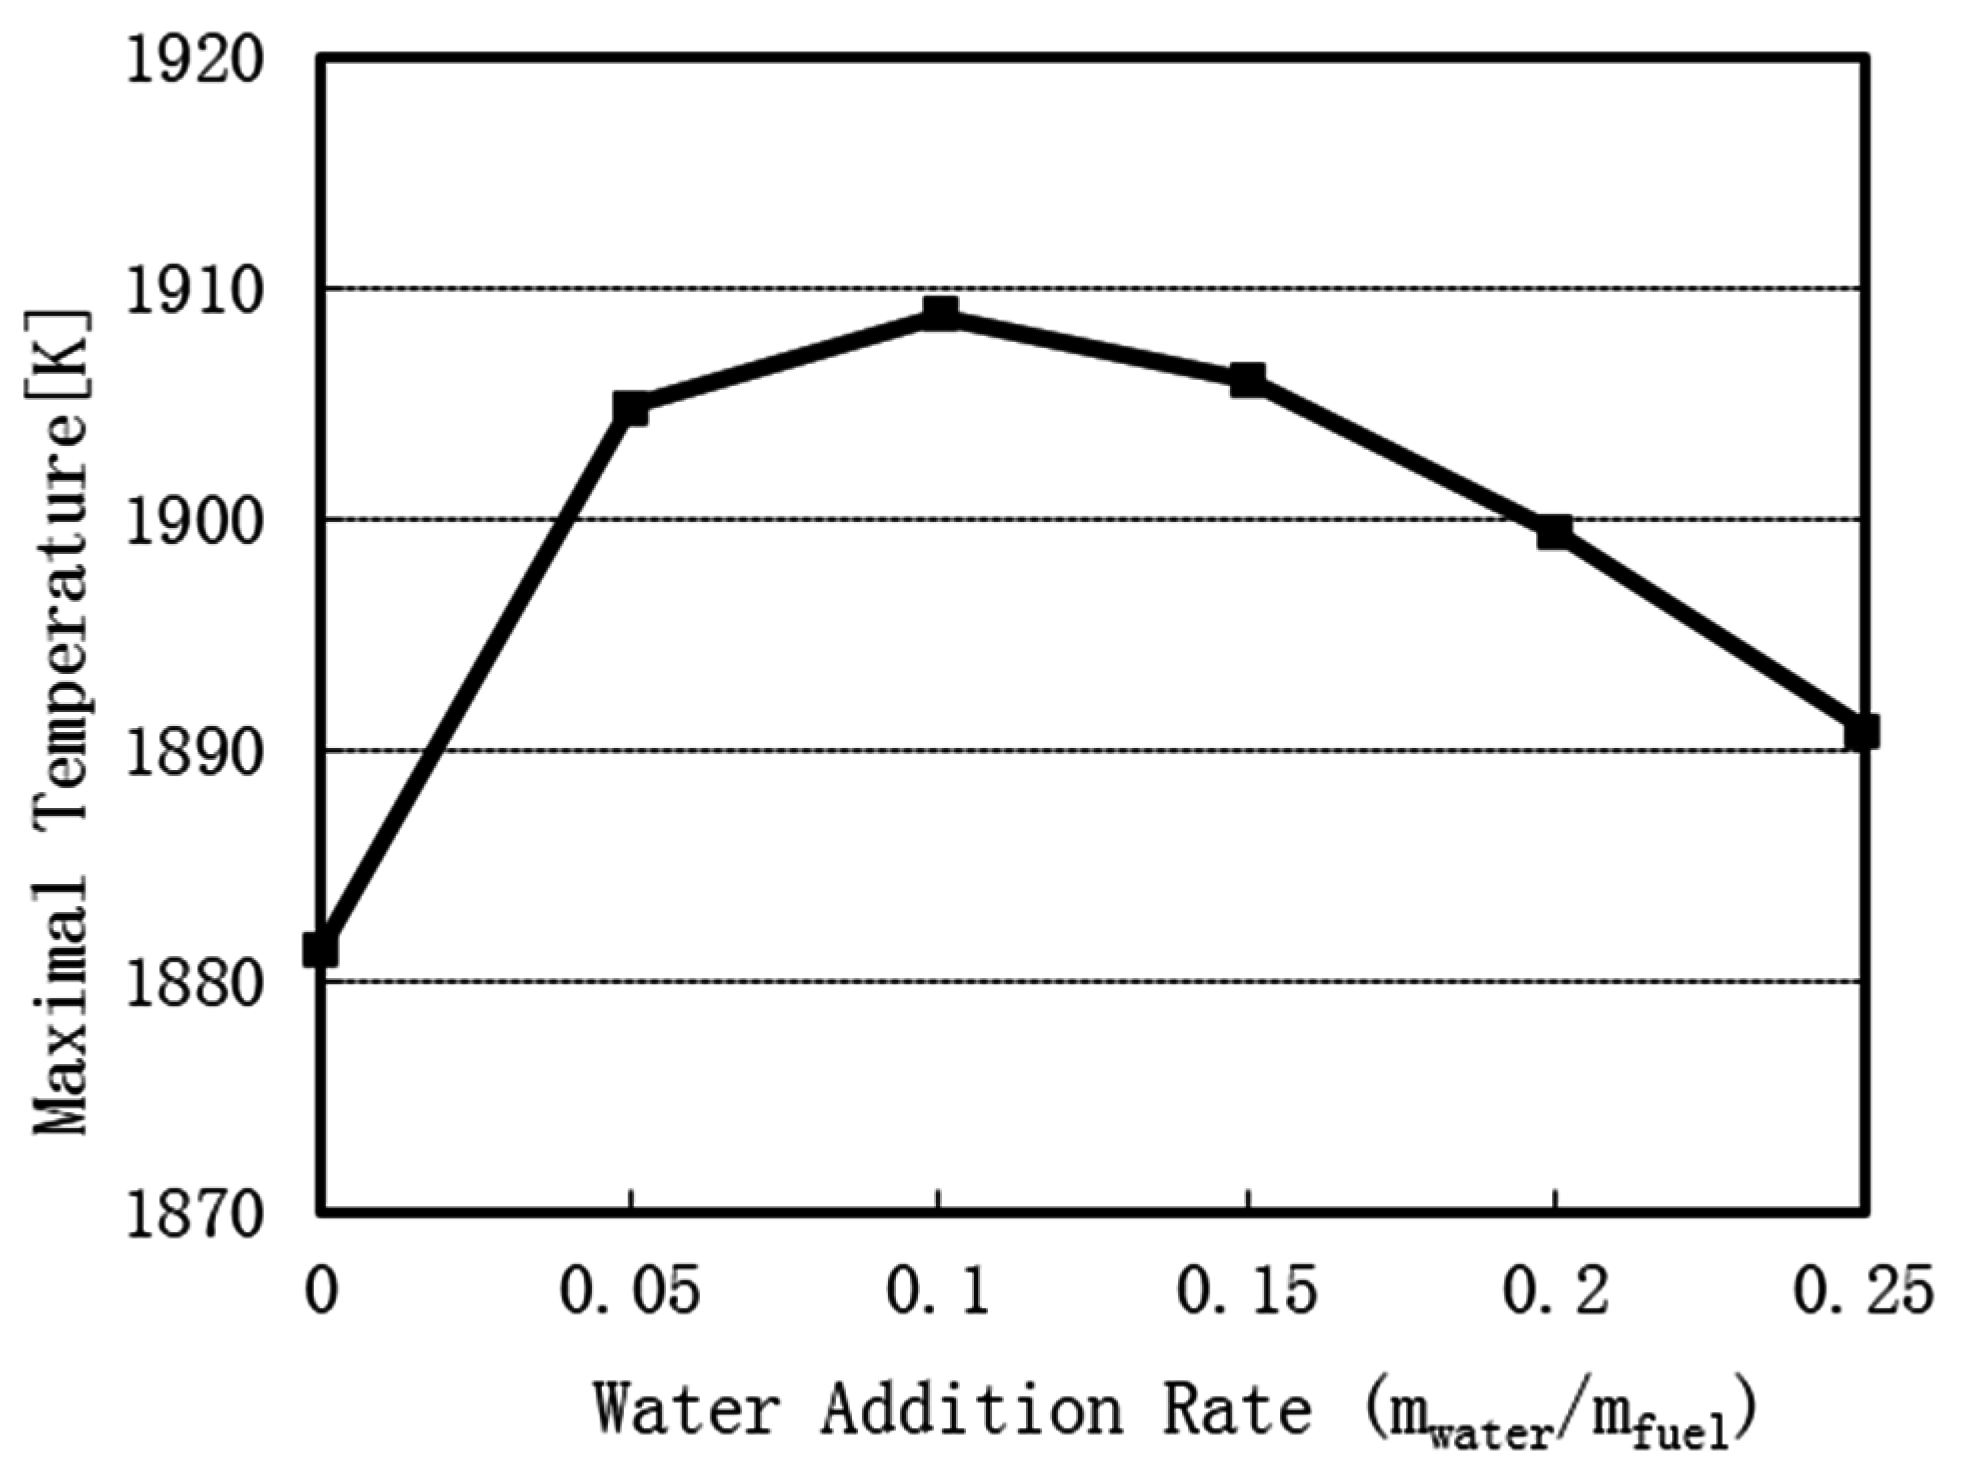
3.1.3. Effects of Water Injection on Combustion
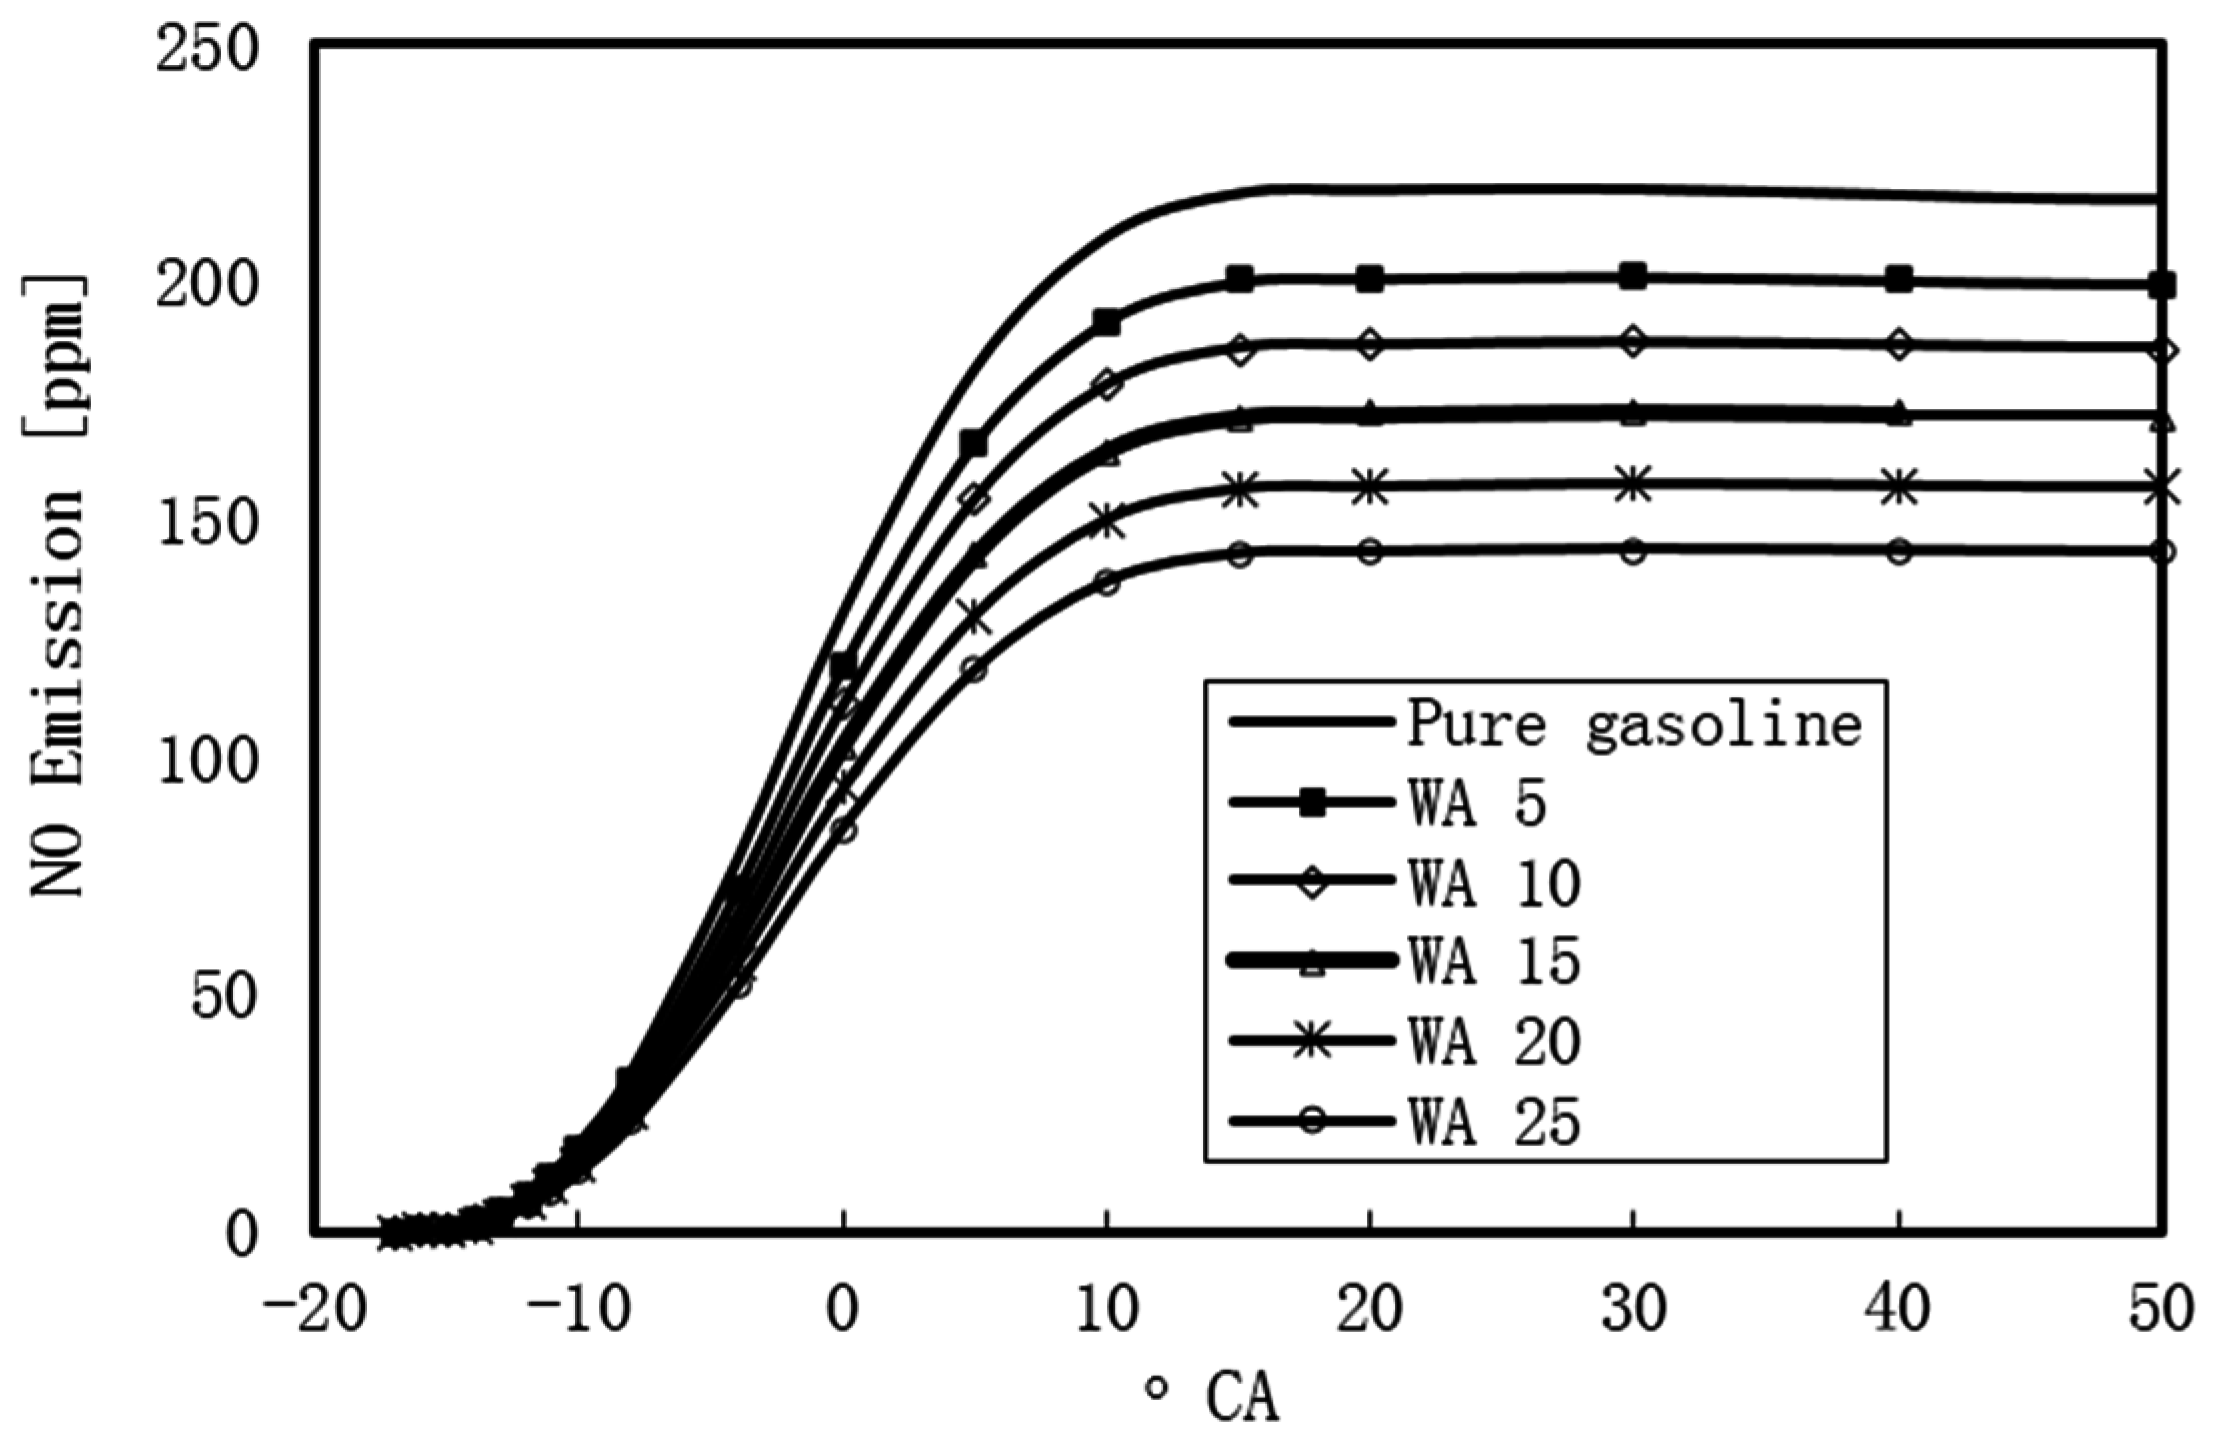
3.1.4. Effect of WI on NO Emission
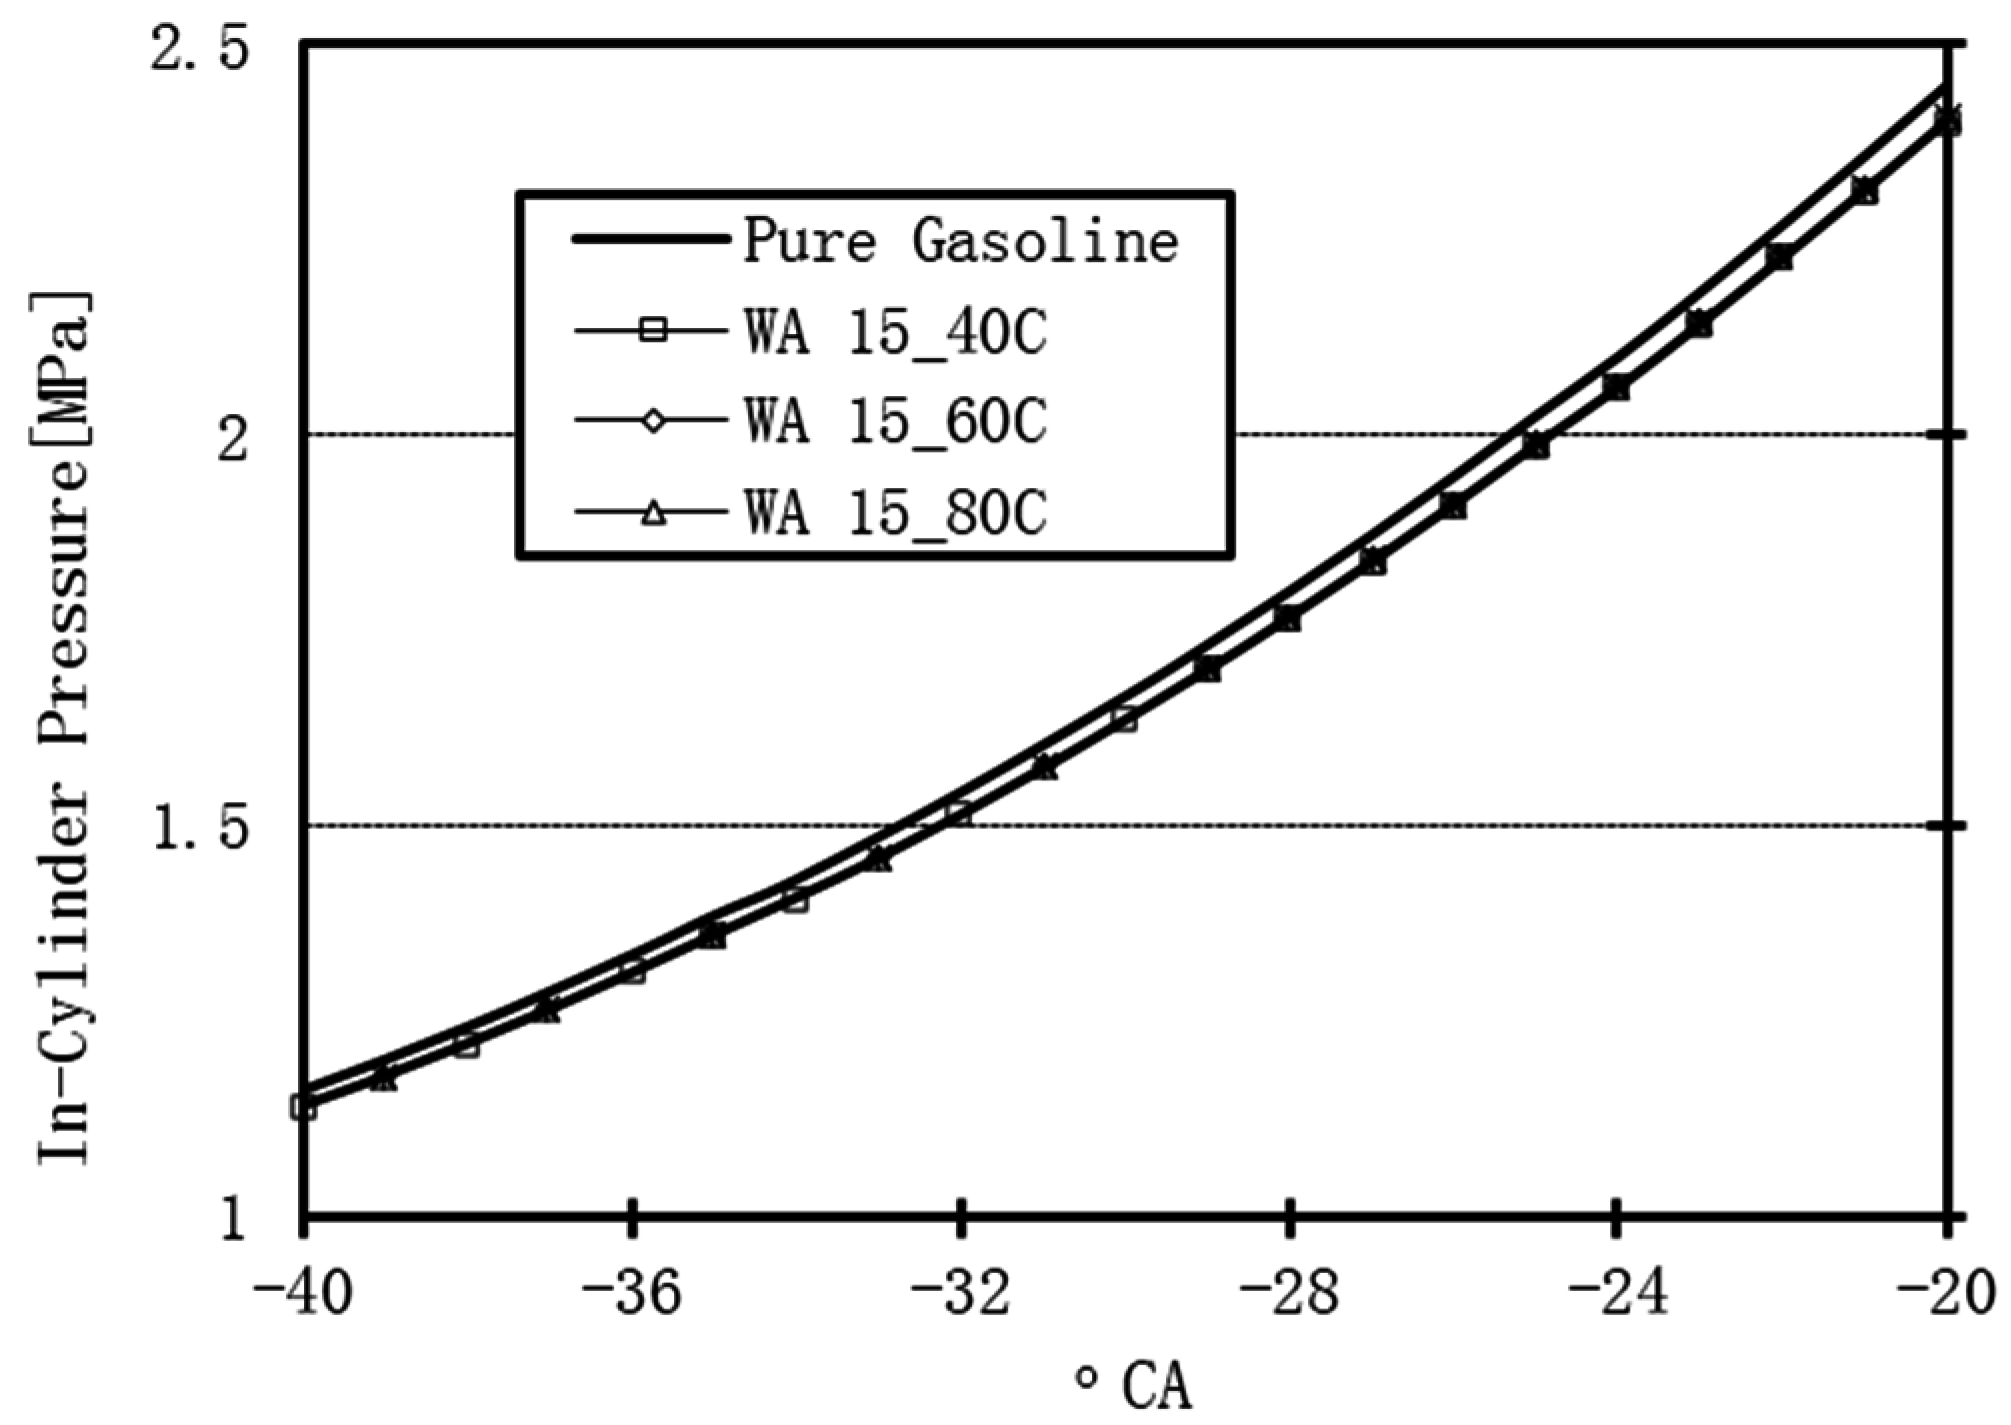
3.1.5. Effect of Water Temperature on the In-Cylinder Pressure
3.2. Water Addition During the Expansion Stroke
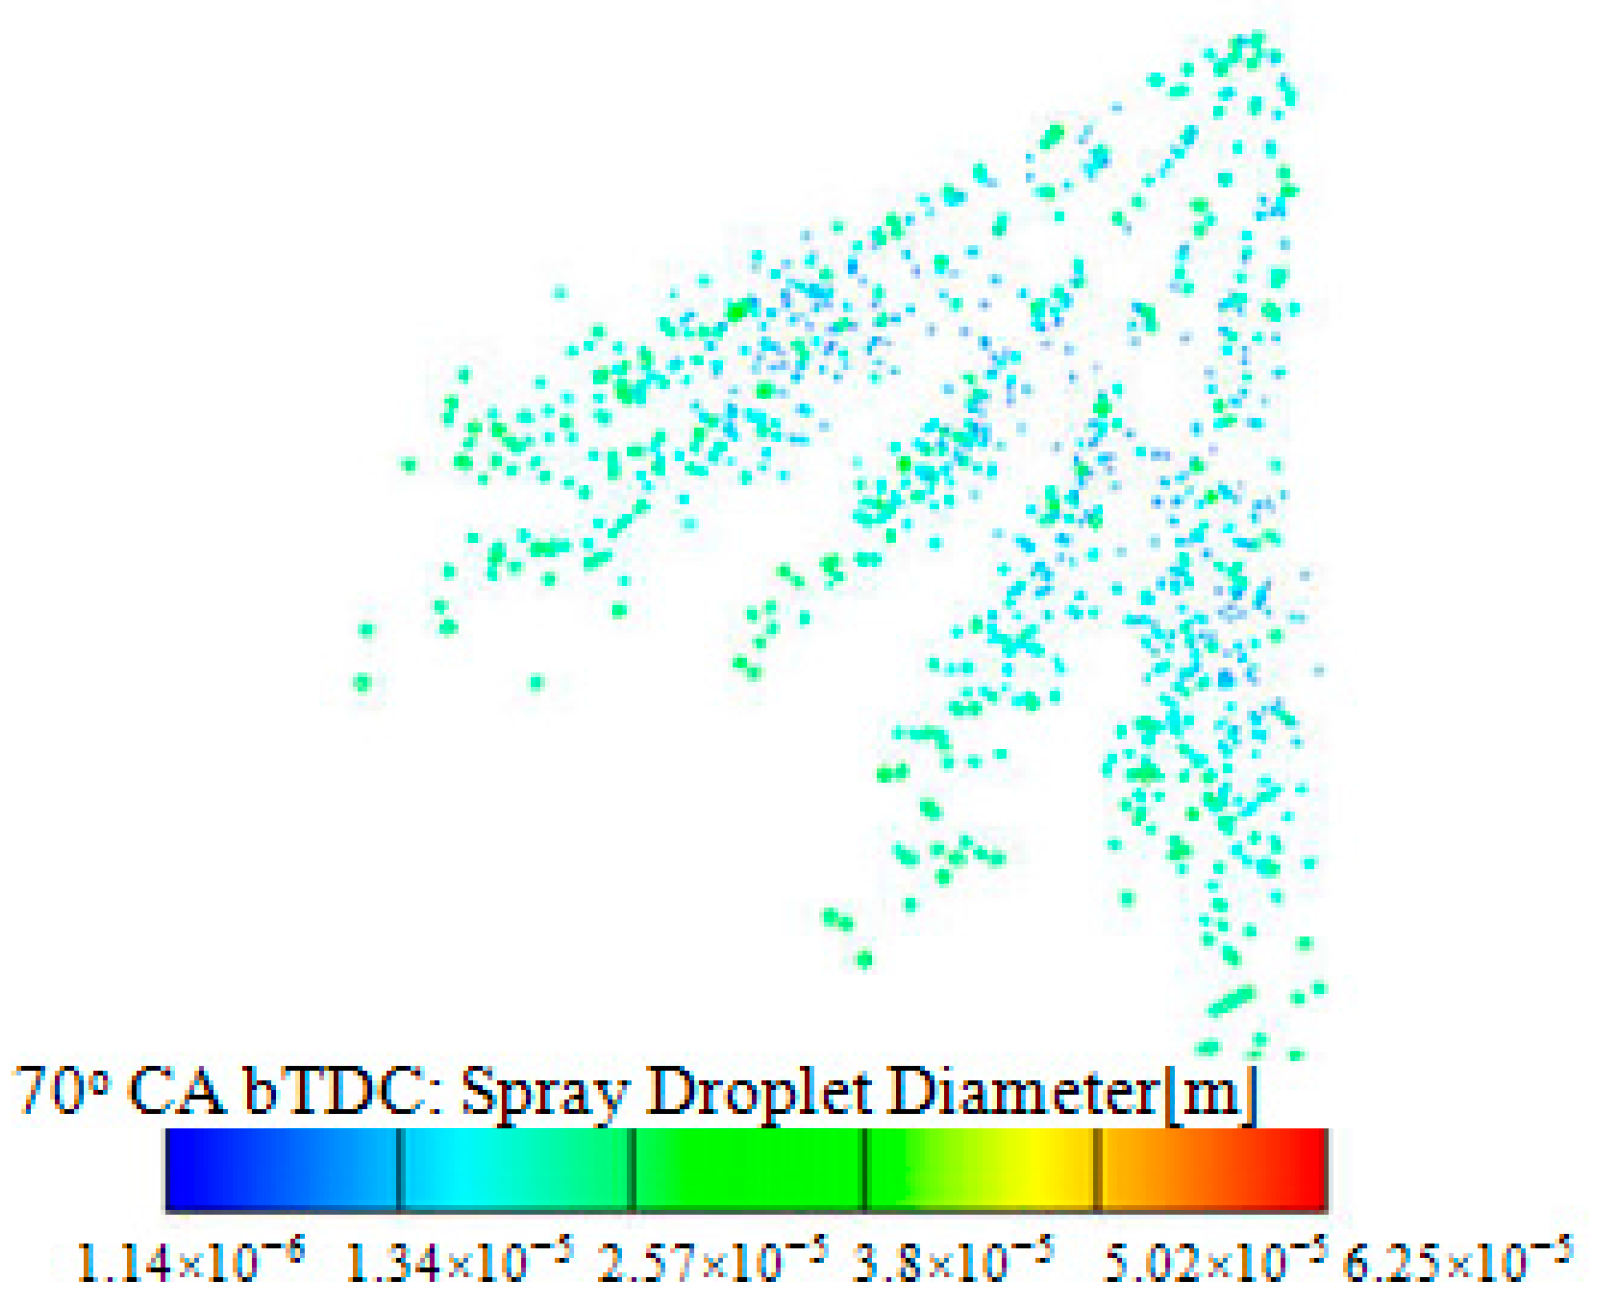
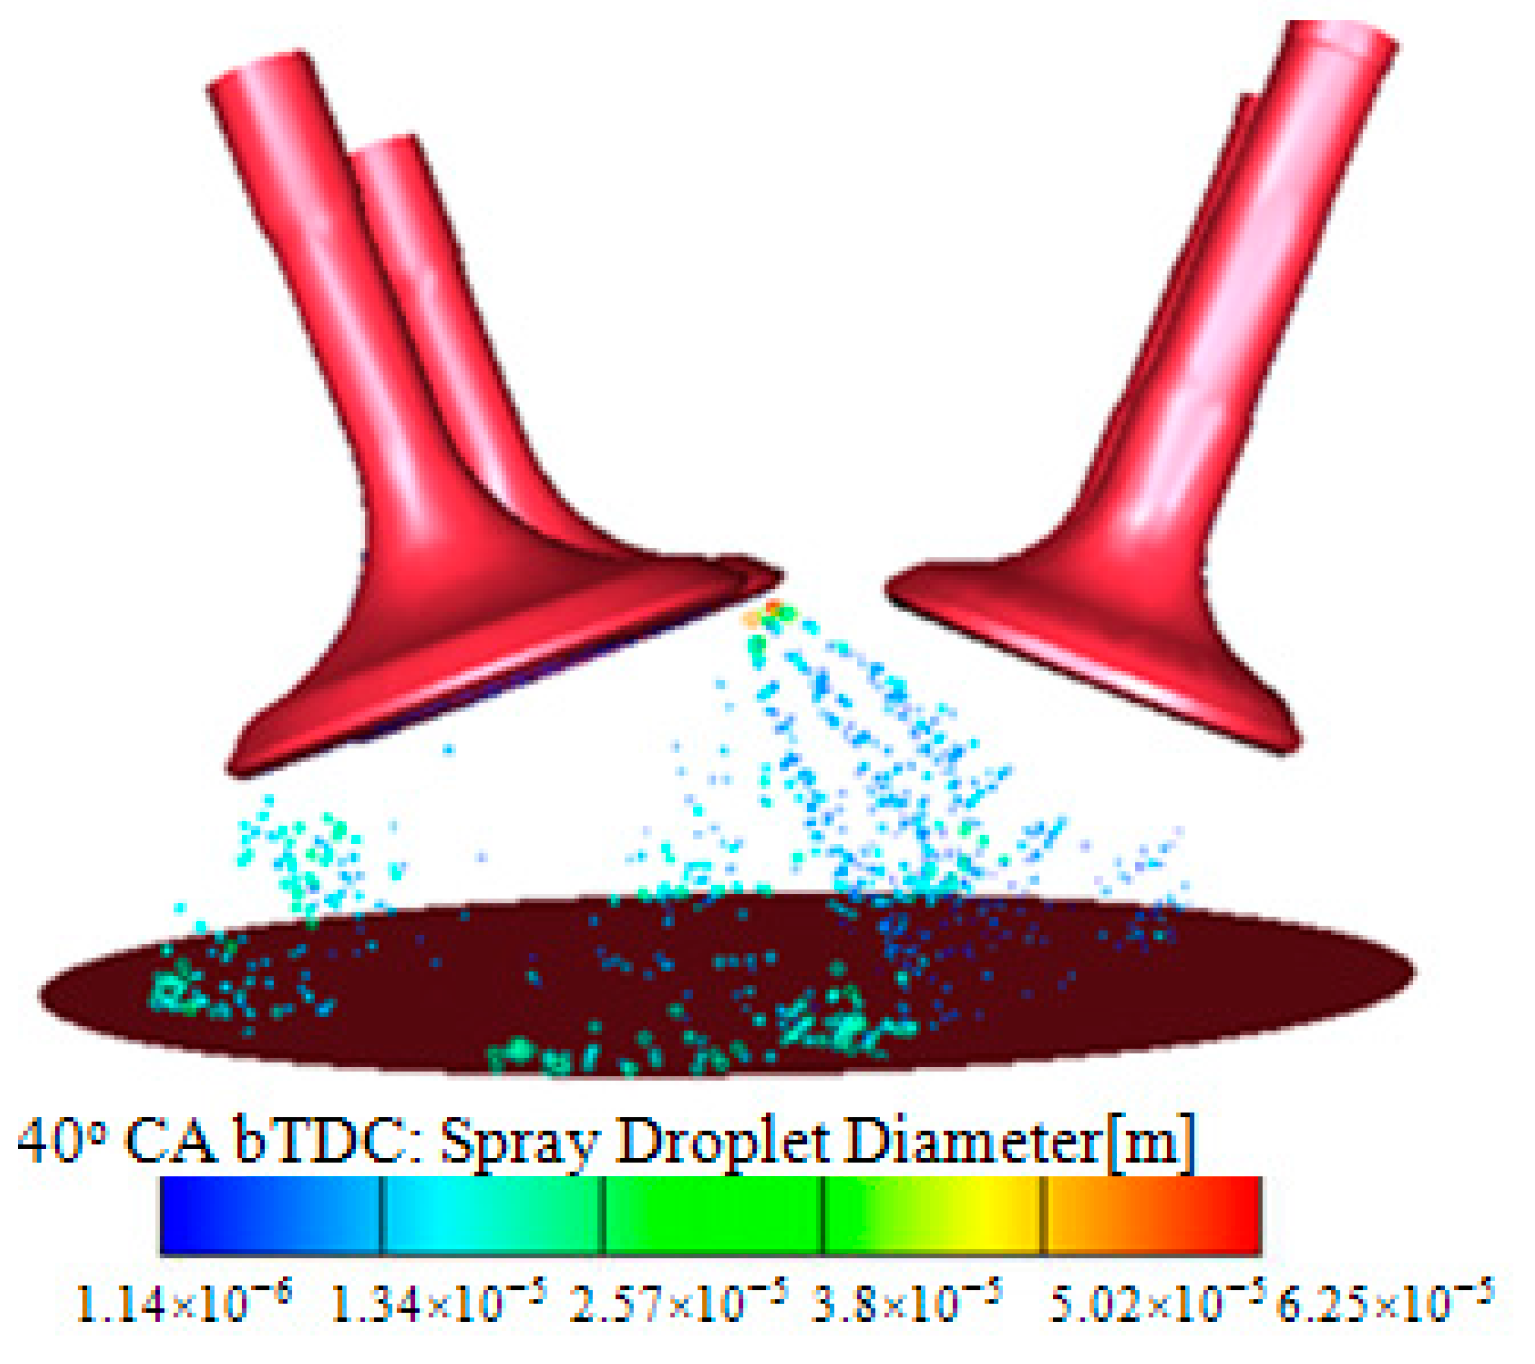
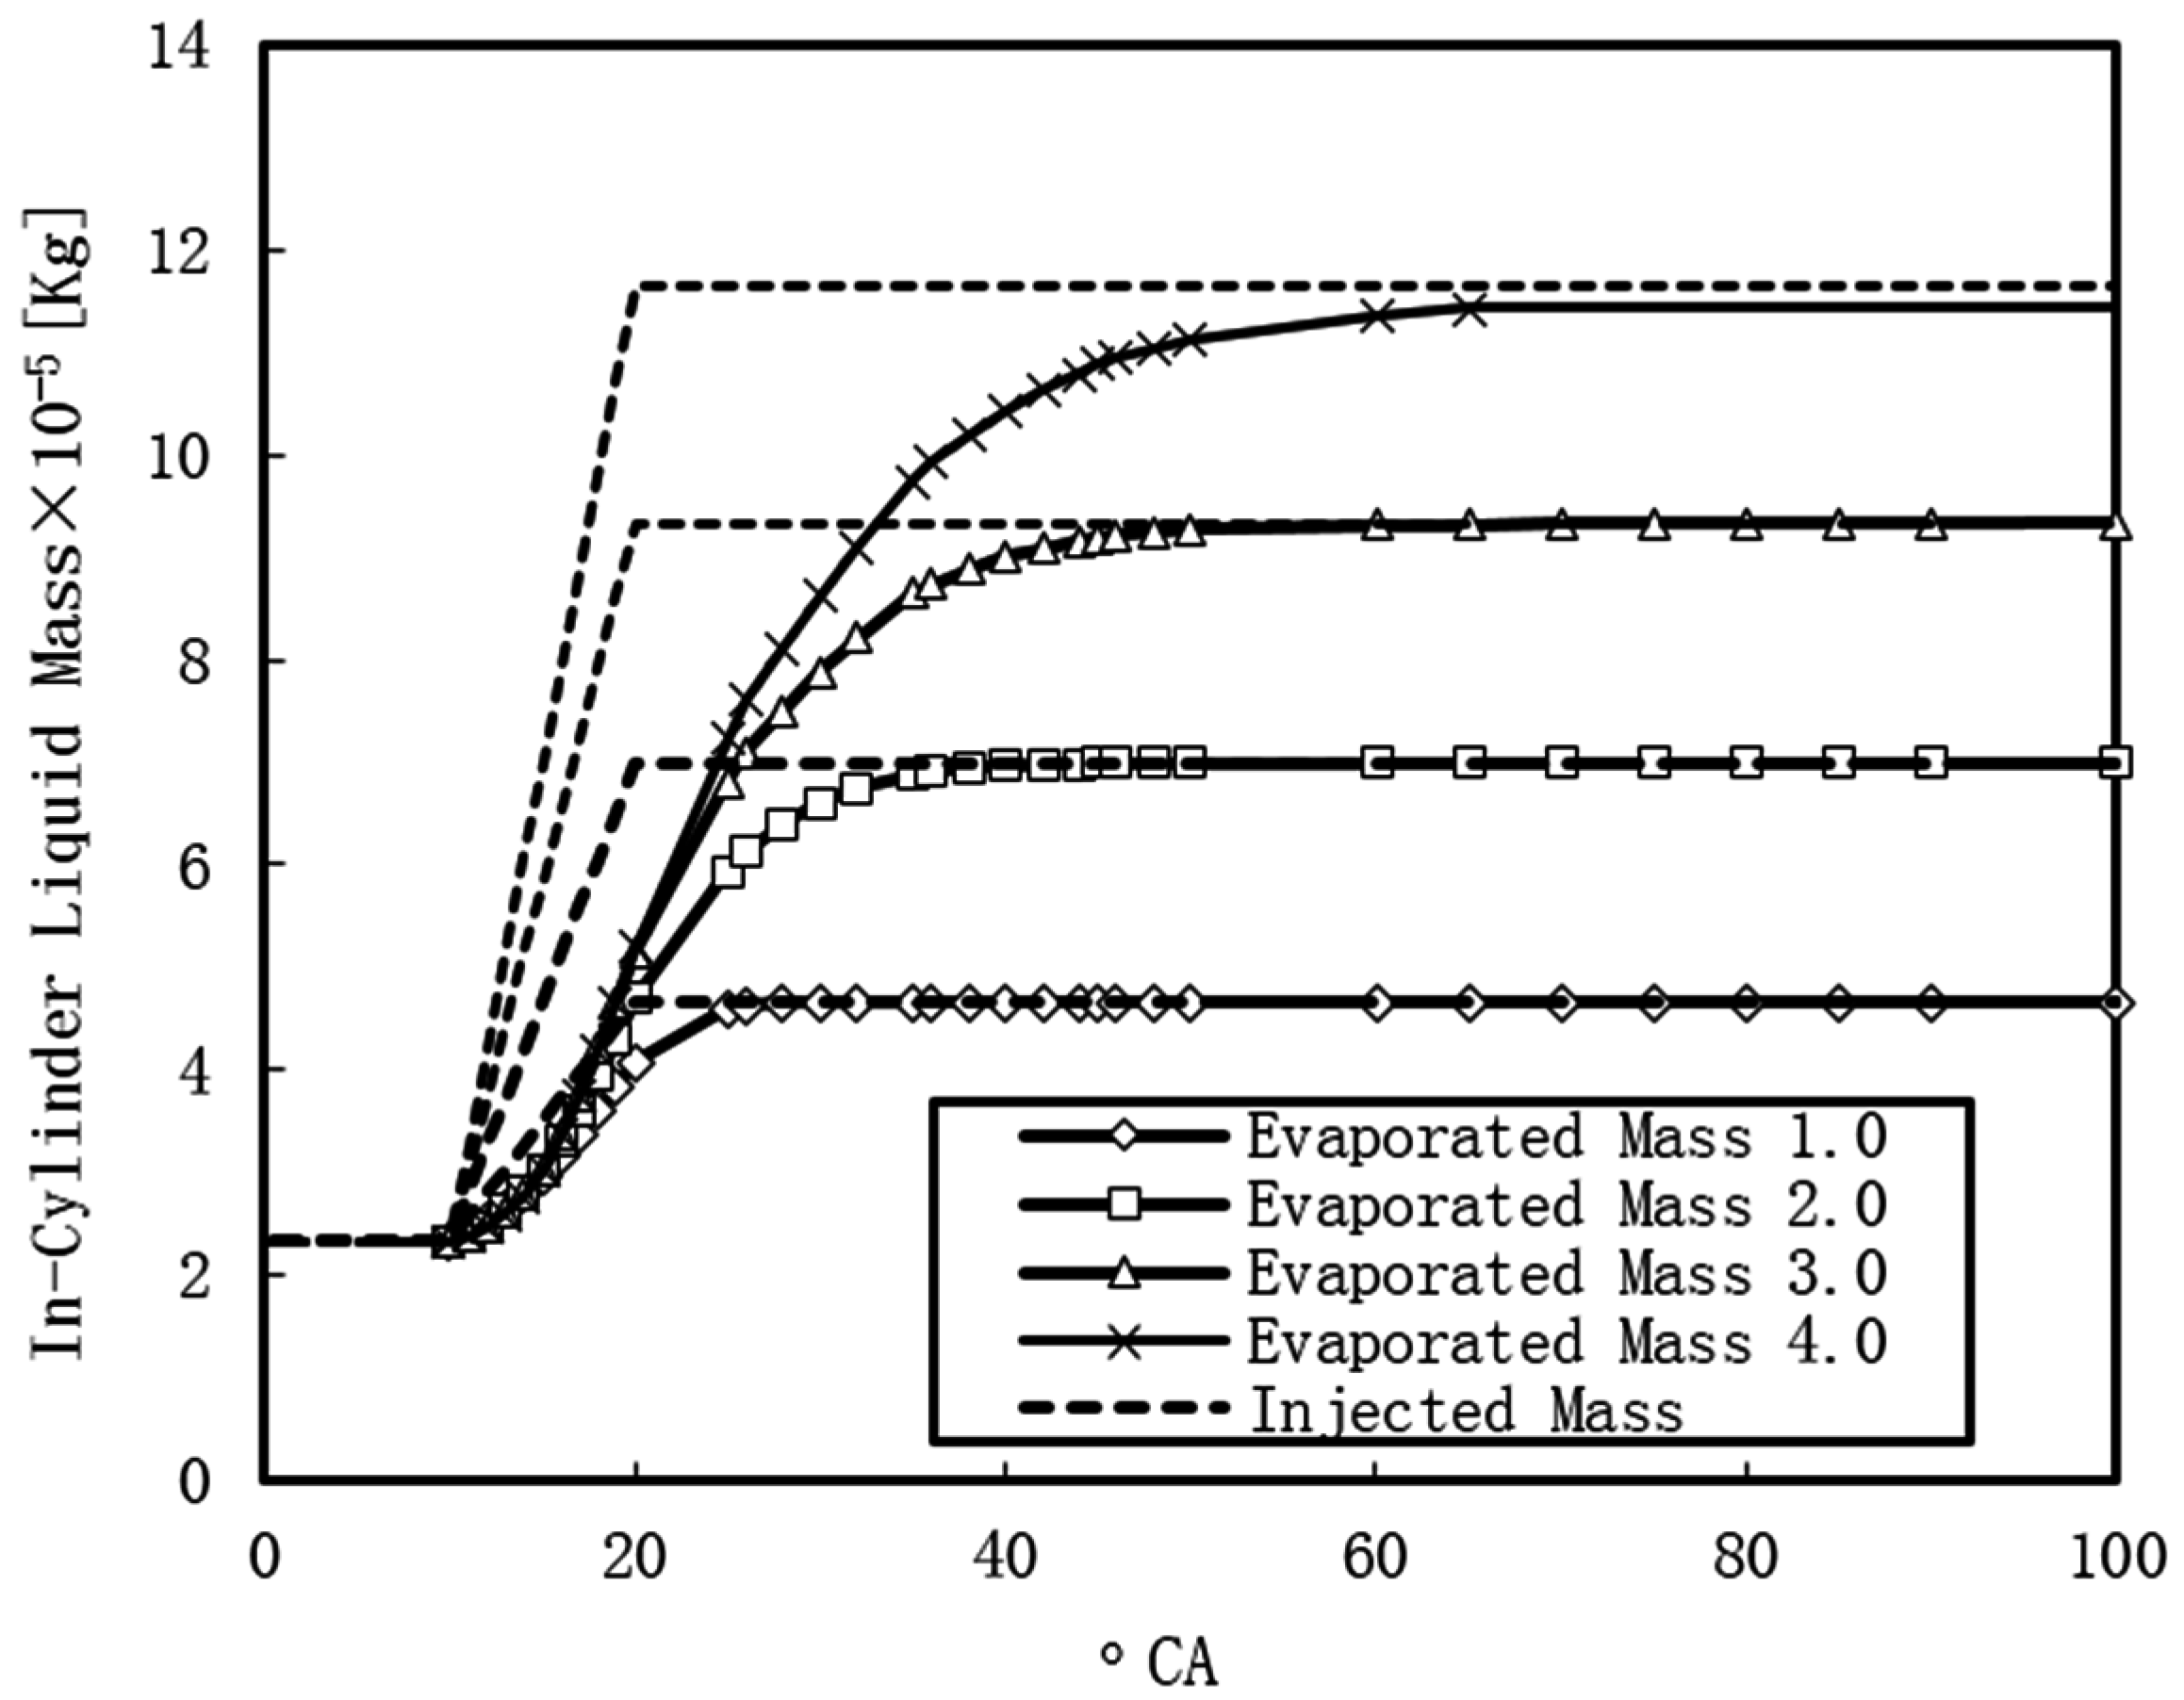
3.2.1. Evaporation of Injected Water in the Cylinder
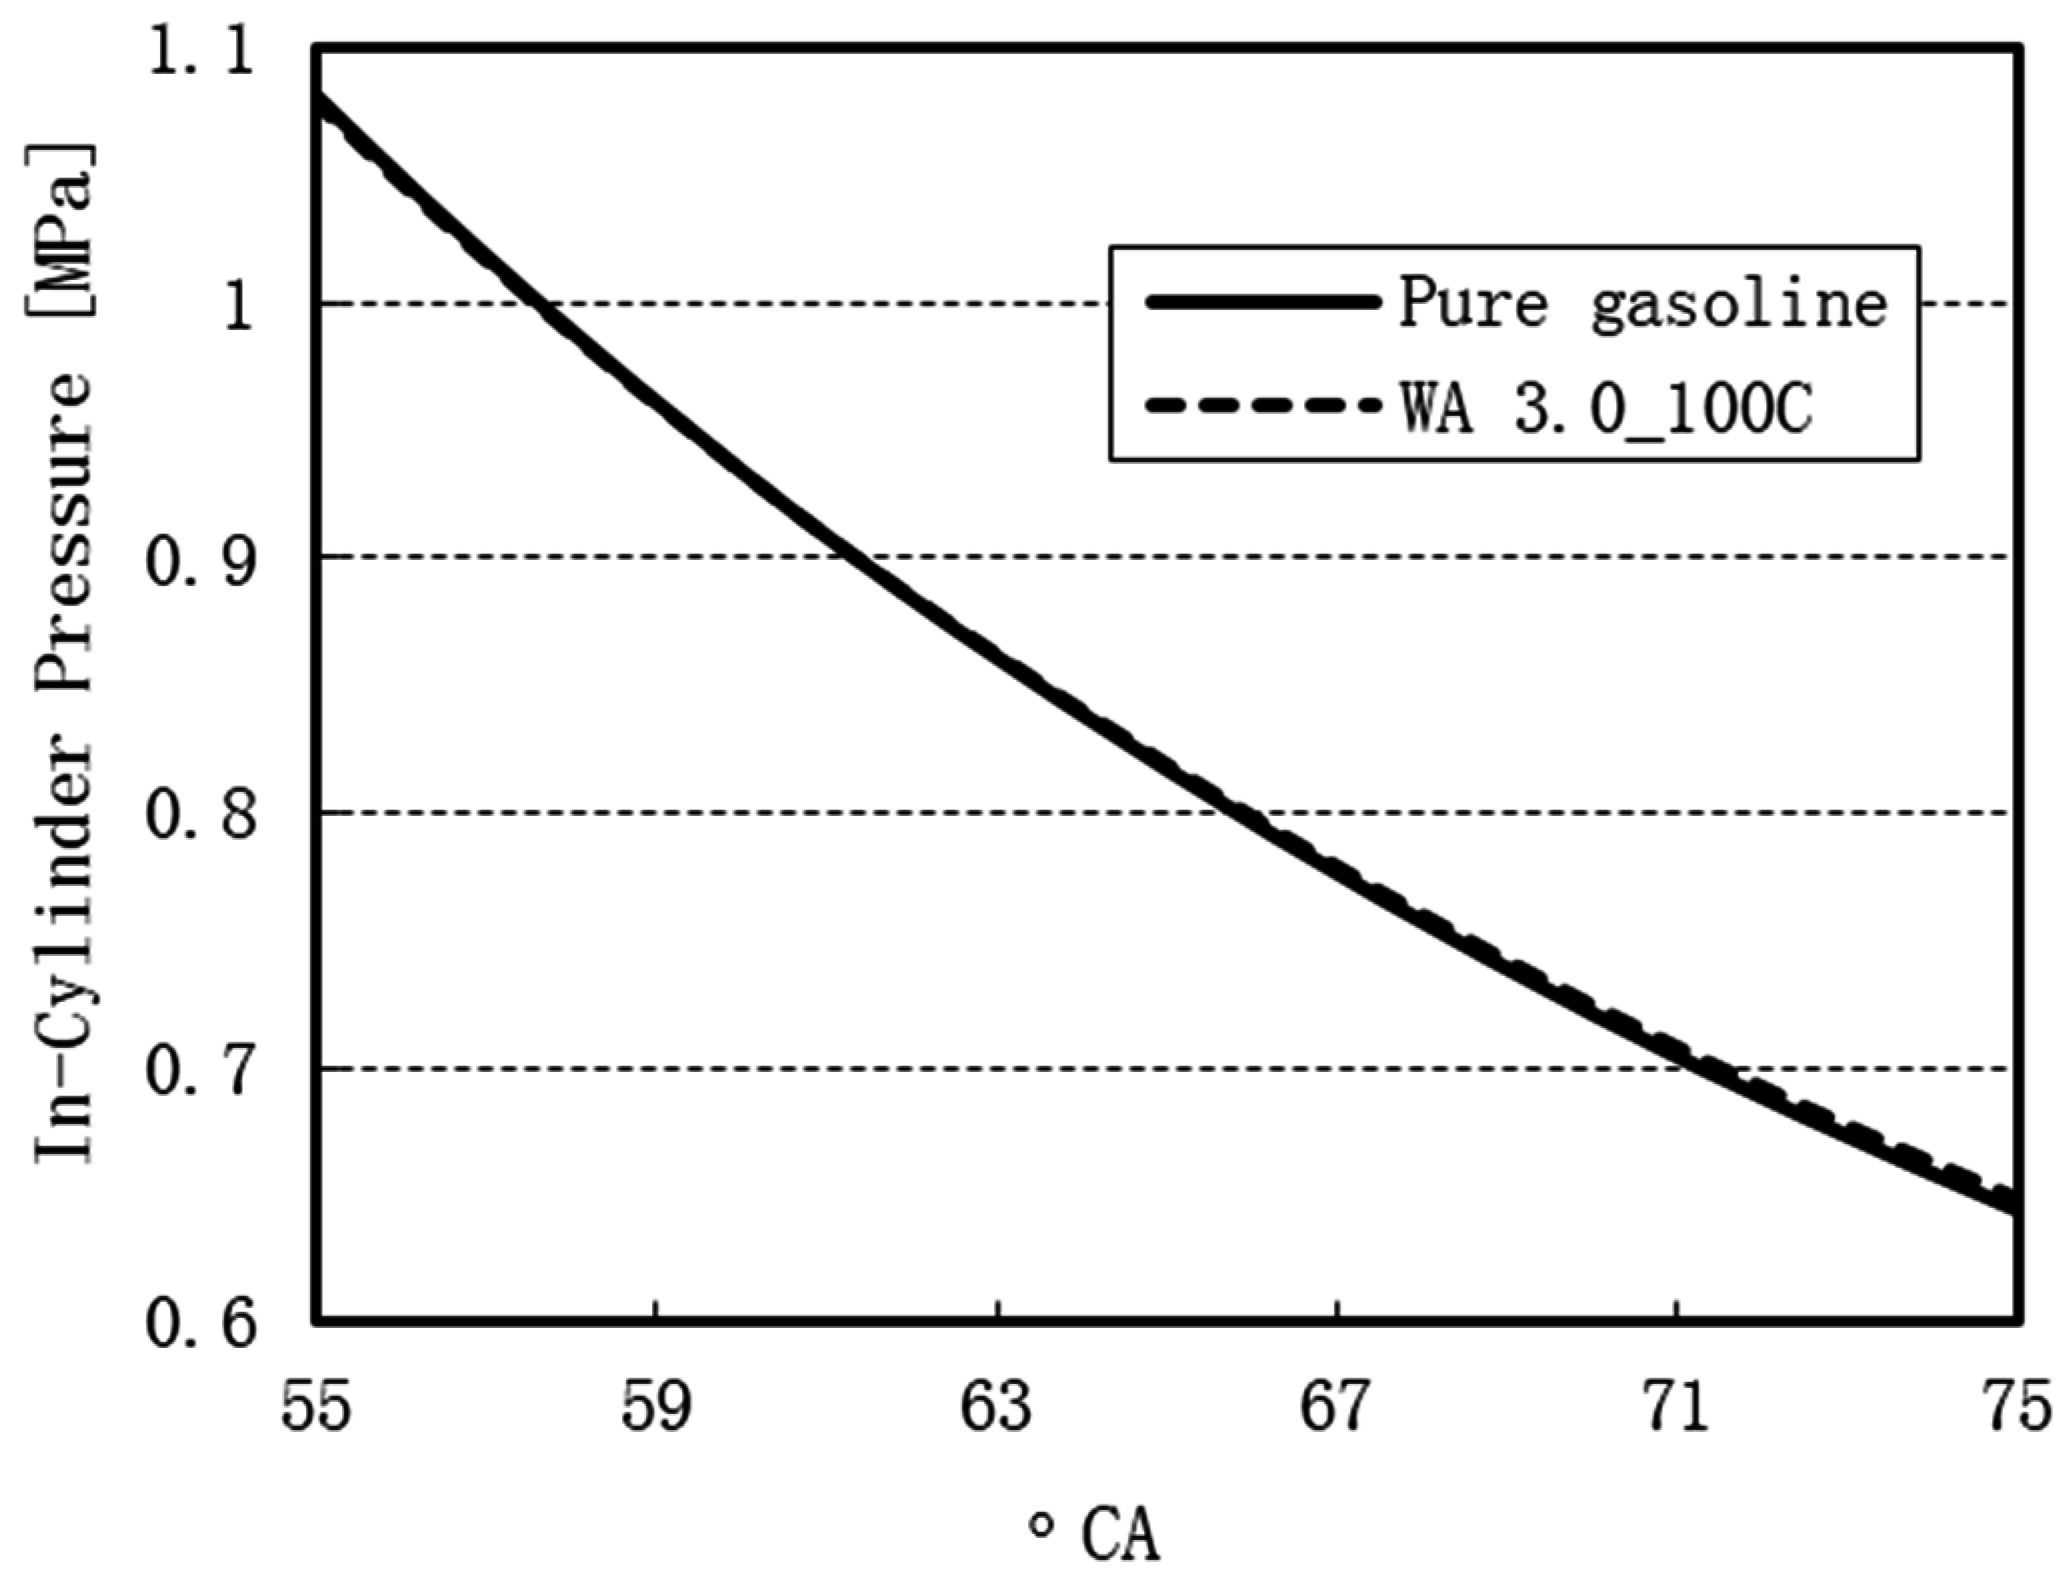
3.2.2. Effect of WI on Expansion Pressure
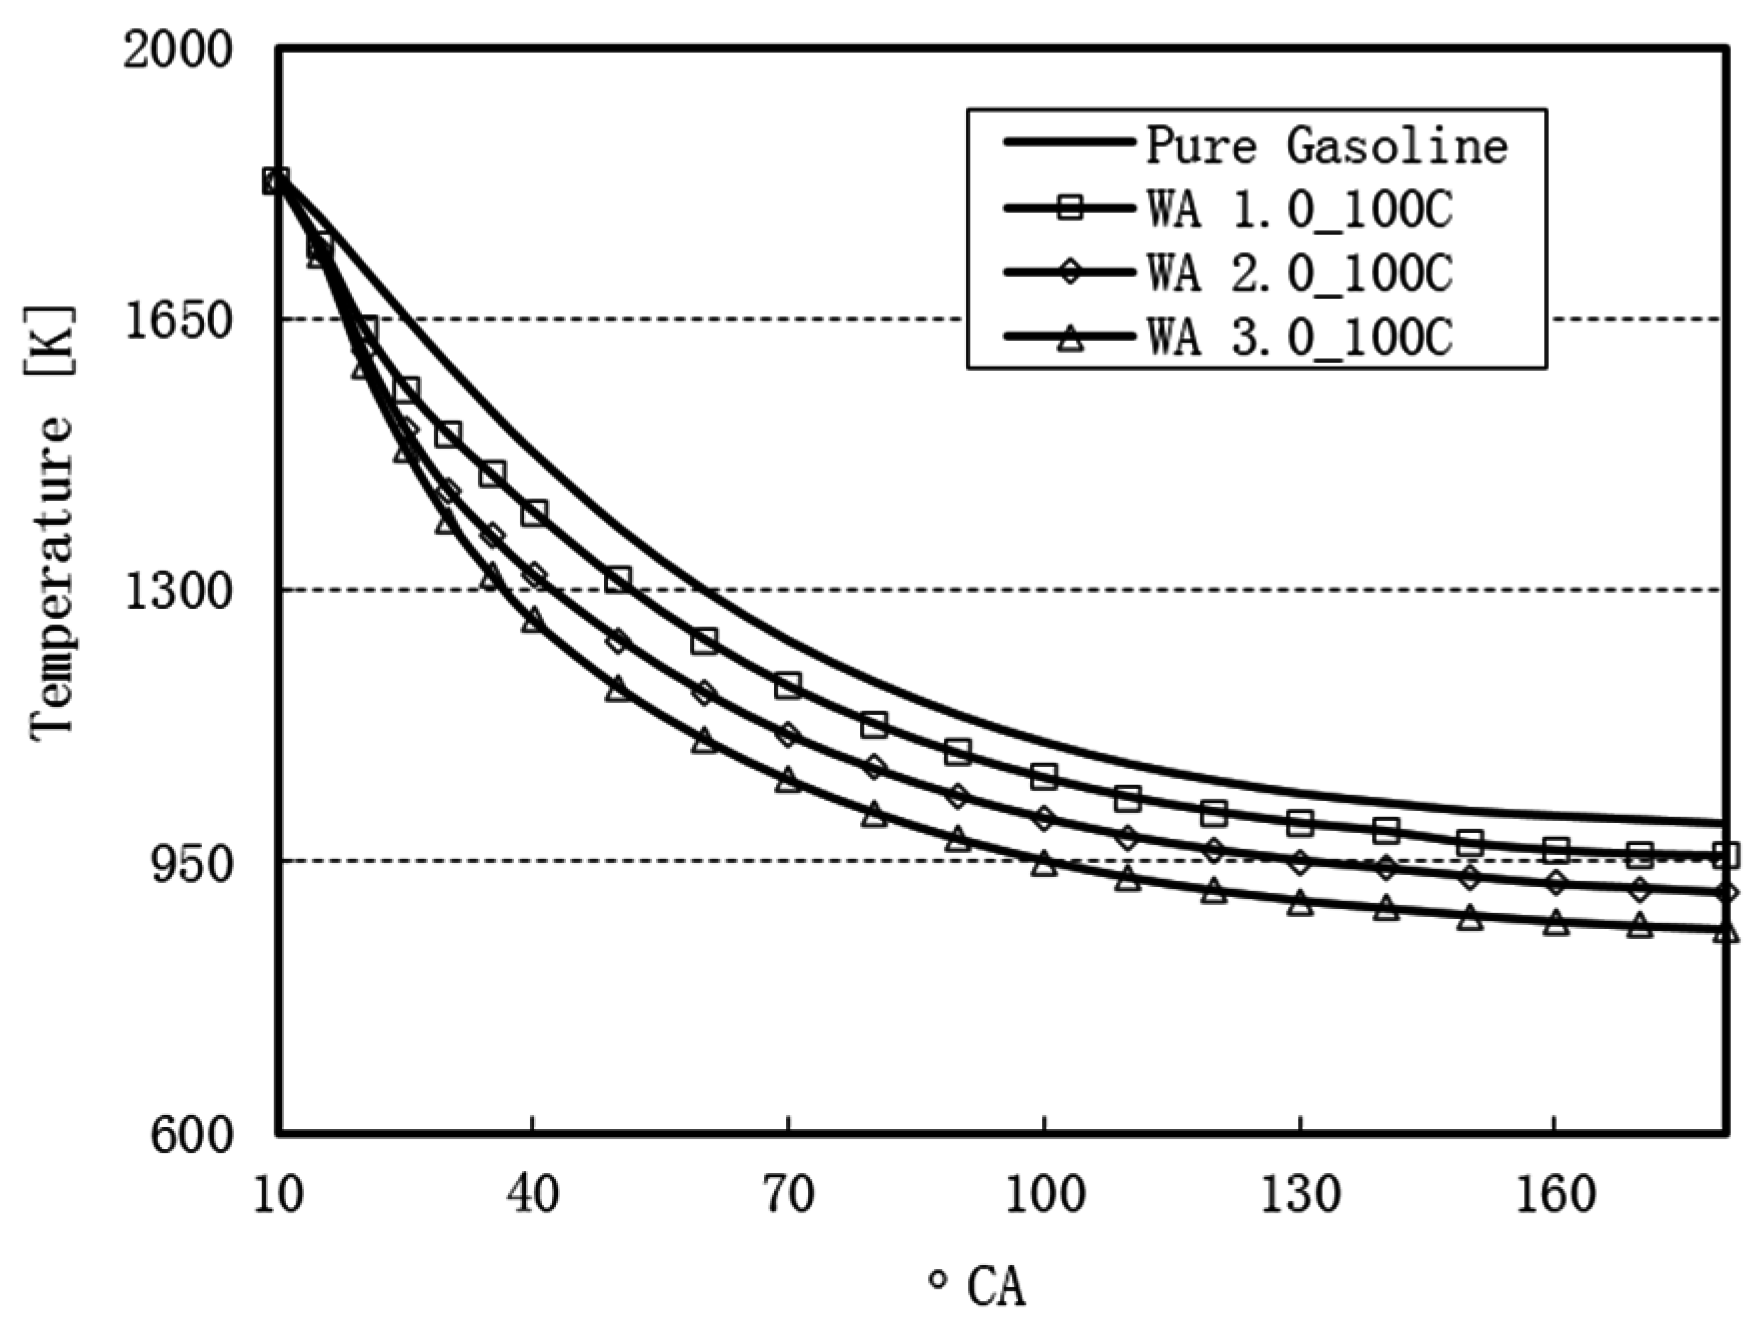
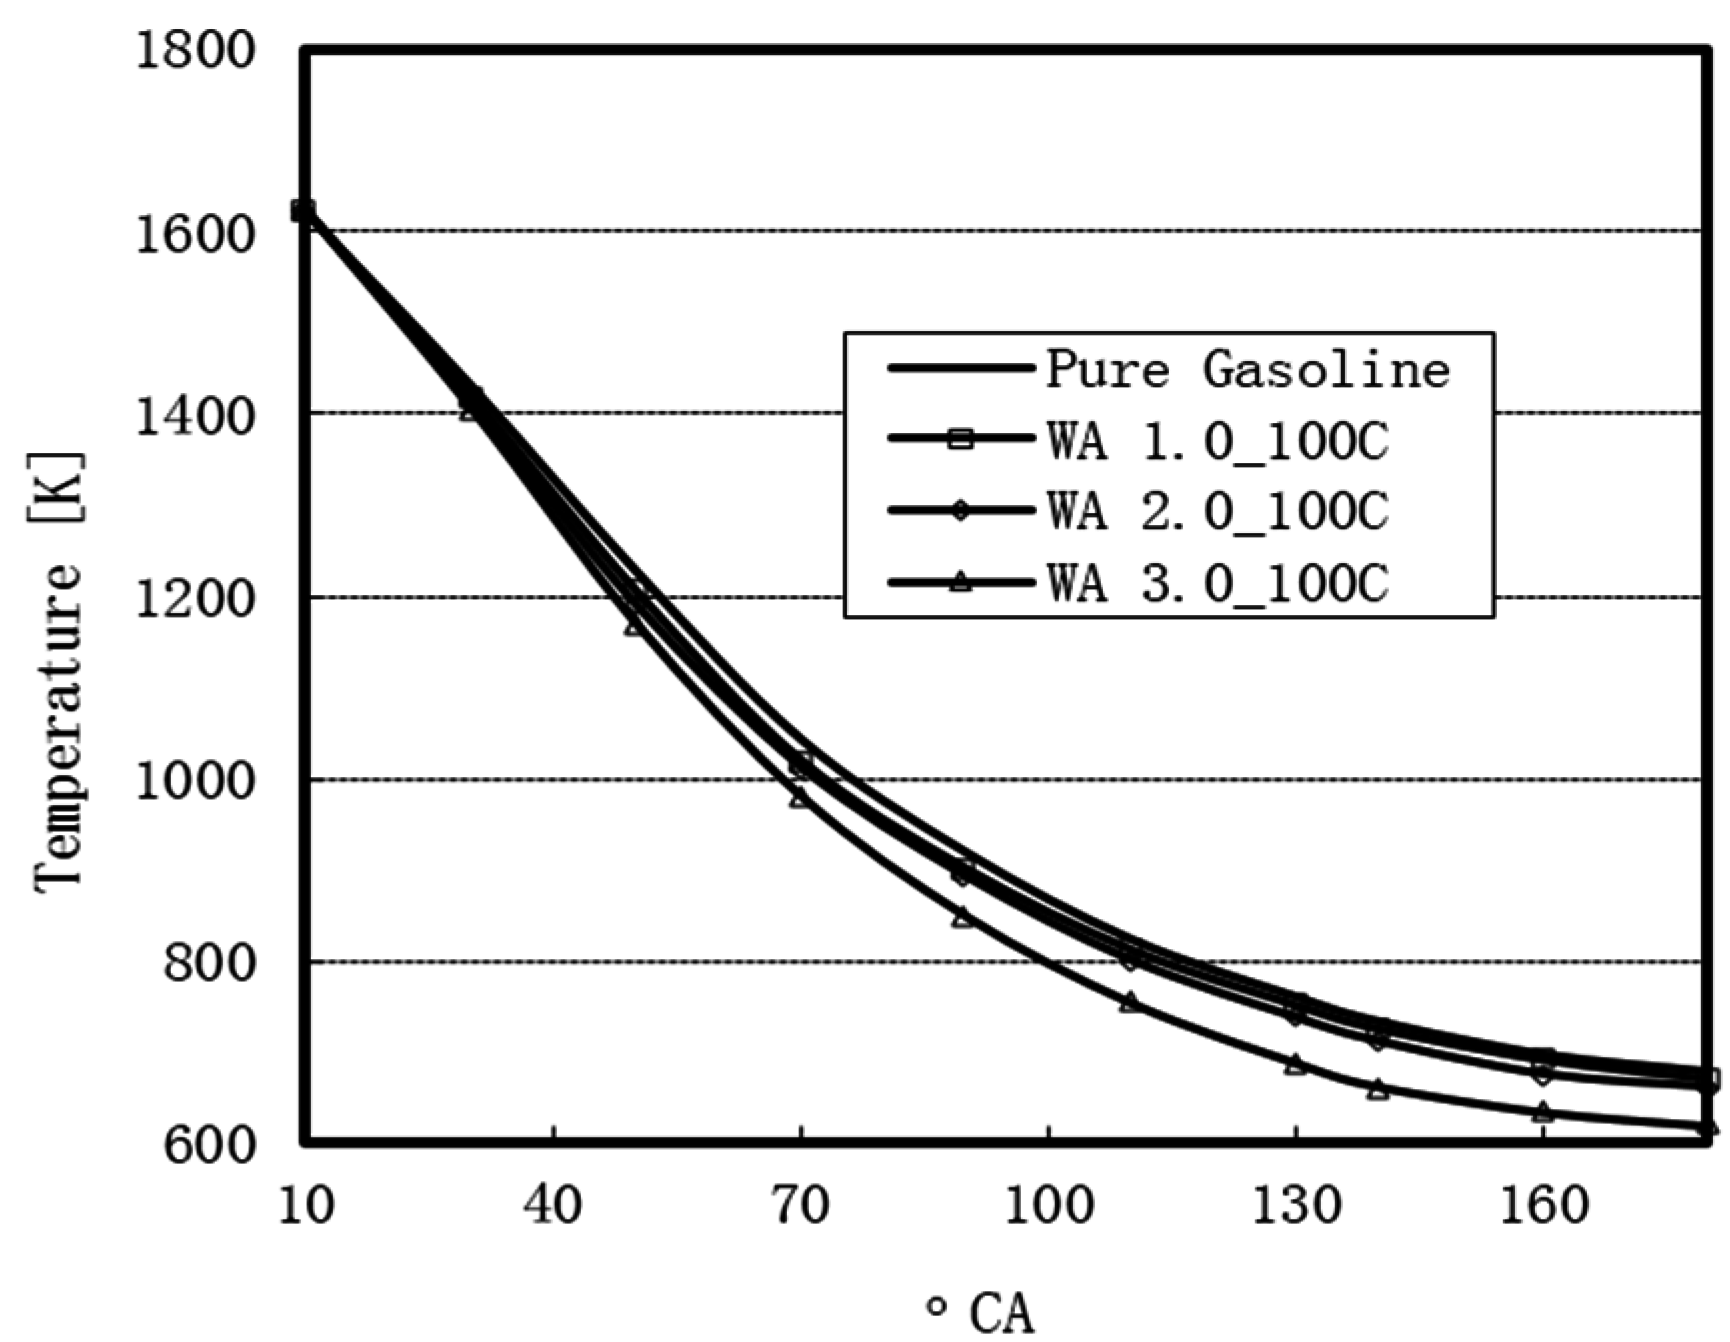
3.2.3. Effect of WI on the Reduction in Energy Losses through In-Cylinder Heat Transfer to the Exhaust Gases
3.3. Water Addition in Both Compression and Expansion Strokes
- T1: the percentage increase in the in-cylinder pressure because of the first WI.
- T2: the period for the second WI and its effect on the in-cylinder pressure due to heat absorption.
- T3: the percentage increase in the in-cylinder pressure because of evaporation during the second WI.
- T4: the percentage increase in the in-cylinder pressure due to the combined effect of the two water injections.
4. Conclusions
- (1)
- WI in the compression stroke facilitated a reduction in compression work, a 34% reduction in NO emission for the WA 25 case, and an increase in the peak pressure by a margin of about 2% for WA 15.
- (2)
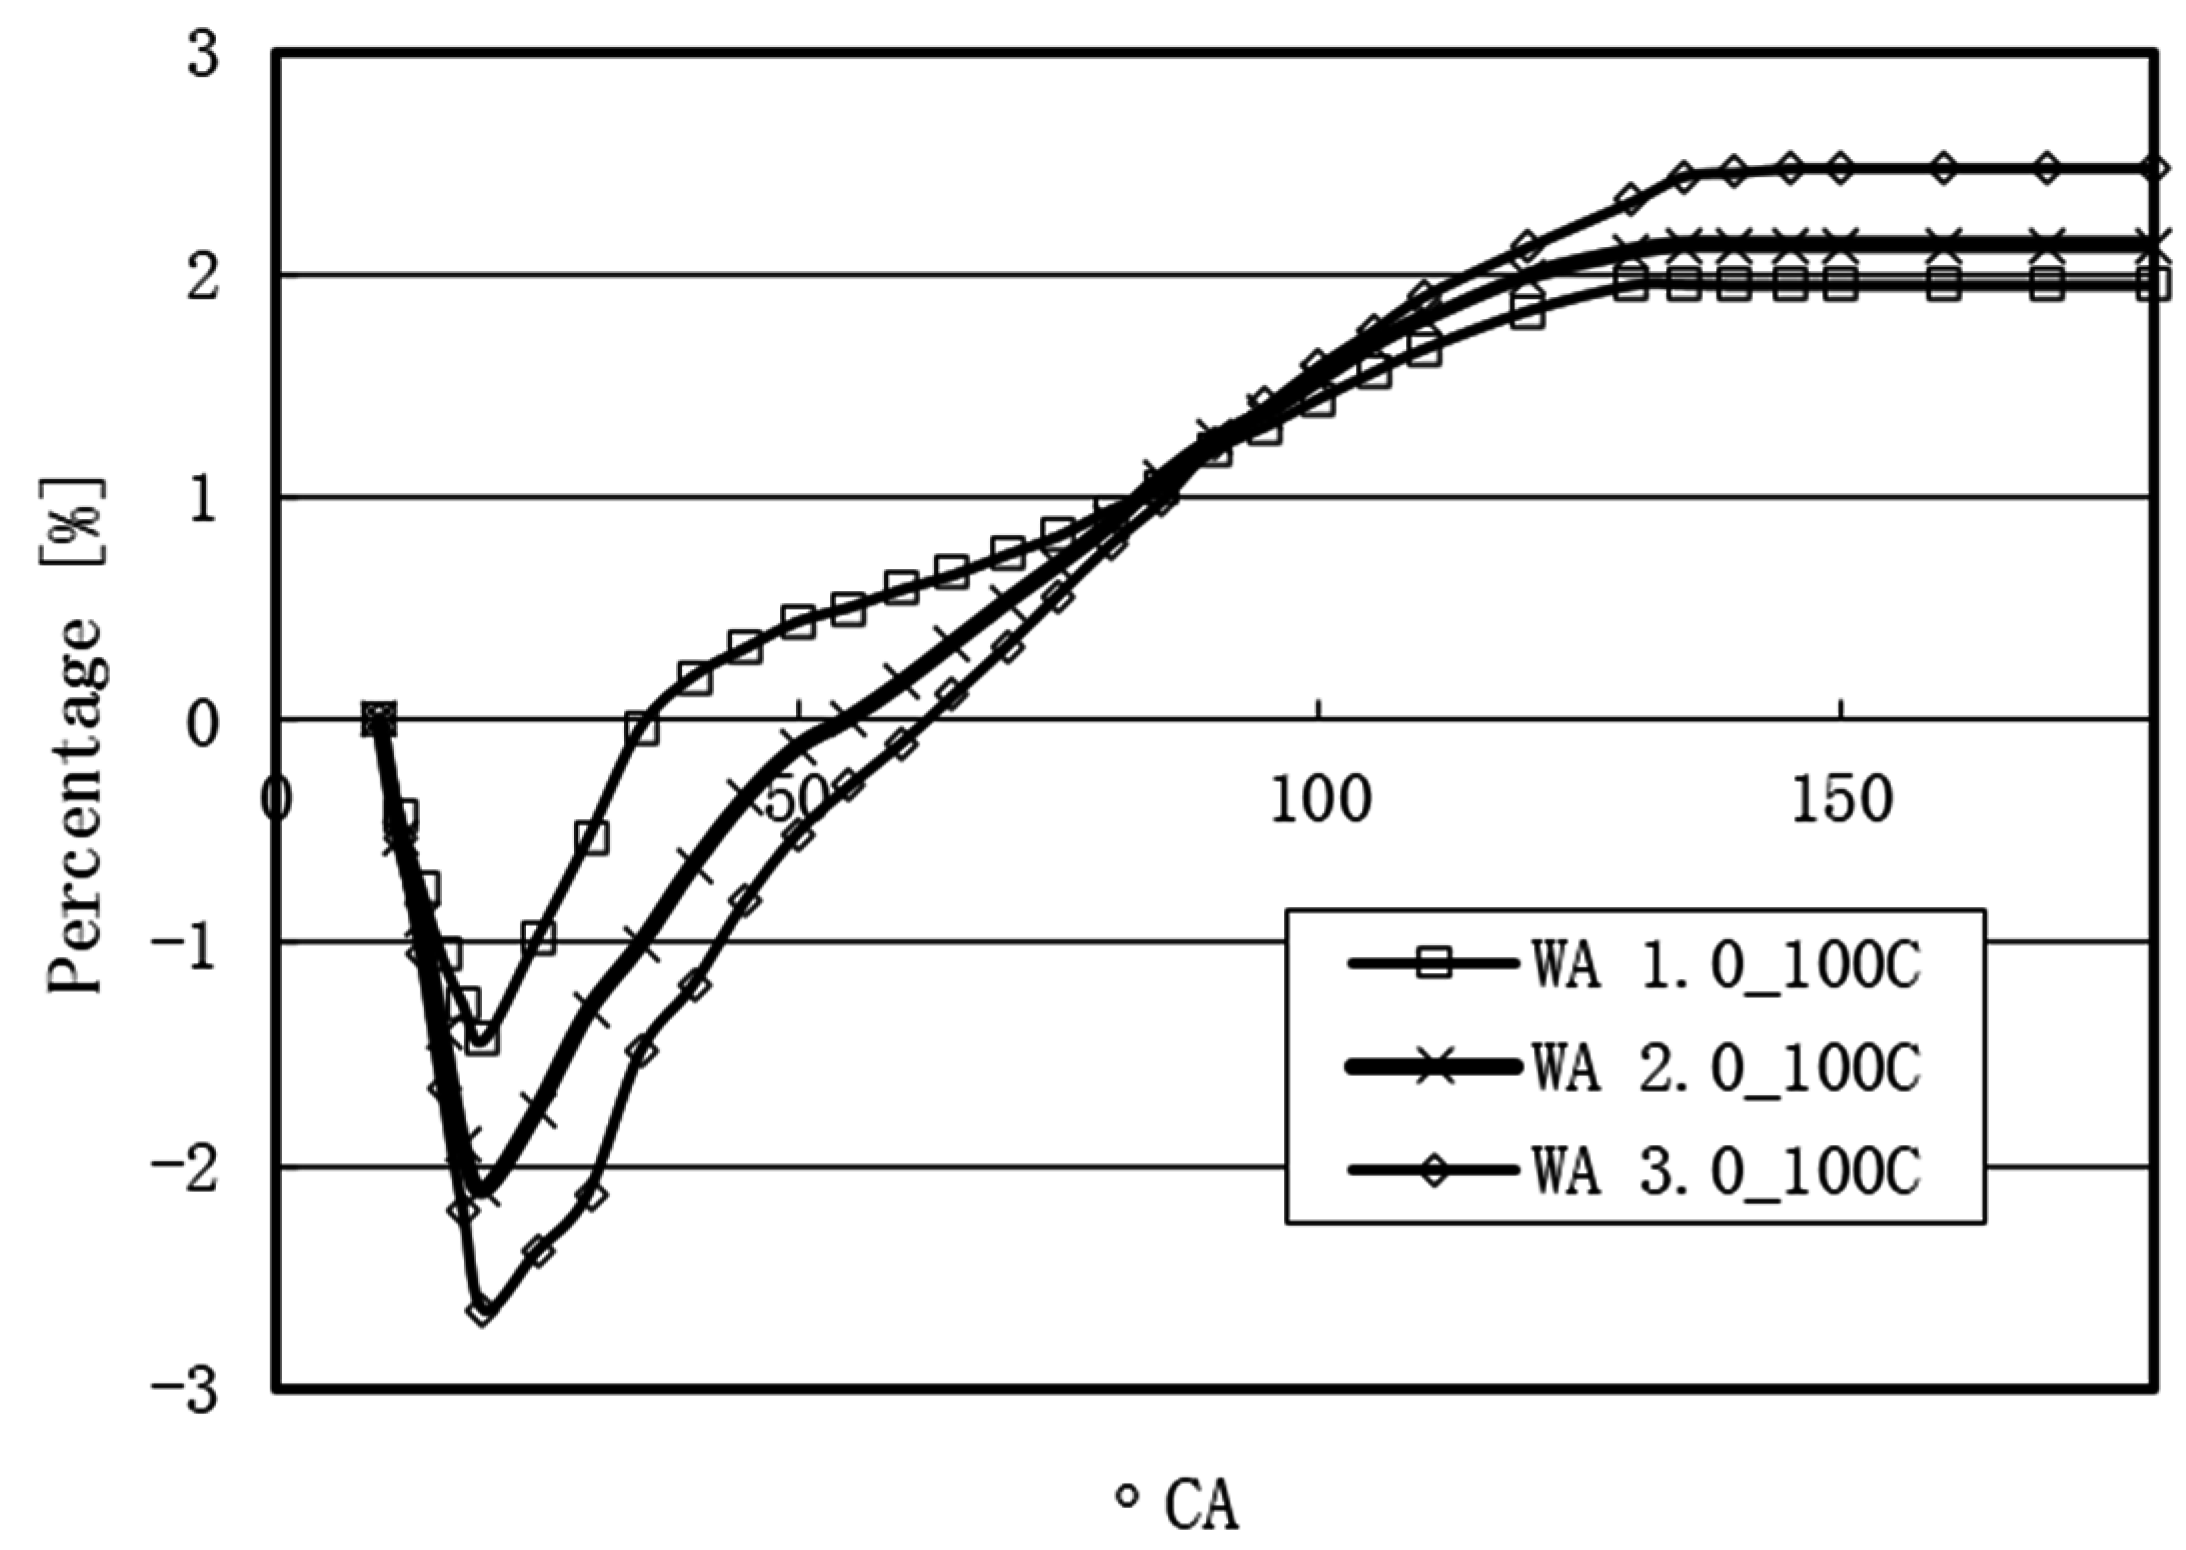
- Employing WI during the expansion stroke indicated two stages of in-cylinder pressure change. For WA 3.0 and a water temperature of 100 °C, the percentage decrease in the in-cylinder pressure was 2.7% during the first stage with a percentage increase of about 2.5% during the second stage. WI helped to reduce the energy losses via heat transfer to the cylinder walls and the exhaust gases. At 180° CA aTDC, the exhaust gas temperature decreased by 42 K, 89 K, and 136 K for WA 1.0, WA 2.0, and WA 3.0, respectively. Increasing the WI temperature to 200 °C, the percentage decrease in the in-cylinder pressure was 1.0% during the first stage and more than 4.0% in the second stage.
- (3)
- Two timed water injections could be used to decrease the compression work and increase the pressure of the expanding burnt gases during the expansion stroke. The maximum percentage increase of the in-cylinder pressure was about 7% which showed the potential for achieving higher engine power output.
Acknowledgments
Author Contributions
Conflicts of Interest
References
- Nande, A.M.; Wallner, T.; Naber, J. Influence of water injection on performance and emissions of a direct-injection hydrogen research engine. SAE Int. 2008. [Google Scholar] [CrossRef]
- Gadallah, A.H.; Elshenawy, E.A.; Elzahaby, A.M.; El-Salmawy, H.A.; Bawady, A.H. Effect of in cylinder water injection strategies on performance and emissions of a hydrogen fuelled direct injection engine. SAE Int. 2009. [Google Scholar] [CrossRef]
- Özcan, H.; Söylemez, M. Thermal balance of a lpg fuelled, four stroke si engine with water addition. Energy Convers. Manag. 2006, 47, 570–581. [Google Scholar] [CrossRef]
- Lanzafame, R. Water Injection Effects in a Single-cylinder CFR Engine. SAE Int. 1999. [Google Scholar] [CrossRef]
- Tauzia, X.; Maiboom, A.; Shah, S.R. Experimental study of inlet manifold water injection on combustion and emissions of an automotive direct injection diesel engine. Energy 2010, 35, 3628–3639. [Google Scholar] [CrossRef]
- Karagöz, Y.; Yüksek, L.; Sandalcı, T.; Dalkılıc, A. An experimental investigation on the performance characteristics of a hydroxygen enriched gasoline engine with water injection. Int. J. Hydrog. Energy 2015, 40, 692–702. [Google Scholar] [CrossRef]
- Feng, R.; Yang, J.; Zhang, D.; Deng, B.; Fu, J.; Liu, J.; Liu, X. Experimental study on si engine fuelled with butanol–gasoline blend and h 2 o addition. Energy Convers. Manag. 2013, 74, 192–200. [Google Scholar] [CrossRef]
- Munsin, R.; Laoonual, Y.; Jugjai, S.; Imai, Y. An experimental study on performance and emissions of a small si engine generator set fuelled by hydrous ethanol with high water contents up to 40%. Fuel 2013, 106, 586–592. [Google Scholar] [CrossRef]
- Sari, R.L.; Tatsch, G.A.; Dalla Nora, M.; dos Santos Martins, M.E.; Lanzanova, T.D.M. Combustion performance of high water content hydrous ethanol. In Proceedings of the Virtual Powertrain Conference, São Paulo, Brasil, 22–23 August 2013.
- Boretti, A.; Osman, A.; Aris, I. Direct injection of hydrogen, oxygen and water in a novel two stroke engine. Int. J. Hydrog. Energy 2011, 36, 10100–10106. [Google Scholar] [CrossRef]
- Liu, J.; Fu, J.; Feng, K.; Wang, S.; Zhao, Z. Characteristics of engine exhaust gas energy flow. J. Cent. South Univ. Sci. Technol. 2011, 42, 3370–3376. [Google Scholar]
- Stabler, F. Automotive Applications of High Efficiency Thermoelectrics. In Proceedings of the DARPA/ONR/DOE High Efficiency Thermoelectric Workshop, San Diego, CA, USA, 24–27 March 2002; pp. 1–26.
- Taylor, C. Automobile engine tribology—Design considerations for efficiency and durability. Wear 1998, 221, 1–8. [Google Scholar] [CrossRef]
- Anderson, B.S. Company perspectives in vehicle tribology-volvo. Tribol. Ser. 1991, 18, 503–506. [Google Scholar]
- Mahlia, T.; Saidur, R.; Memon, L.A.; Zulkifli, N.; Masjuki, H. A review on fuel economy standard for motor vehicles with the implementation possibilities in malaysia. Renew. Sustain. Energy Rev. 2010, 14, 3092–3099. [Google Scholar] [CrossRef]
- Priest, M.; Taylor, C. Automobile engine tribology—Approaching the surface. Wear 2000, 241, 193–203. [Google Scholar] [CrossRef]
- Wang, E.; Zhang, H.; Zhao, Y.; Fan, B.; Wu, Y.; Mu, Q. Performance analysis of a novel system combining a dual loop organic rankine cycle (orc) with a gasoline engine. Energy 2012, 43, 385–395. [Google Scholar] [CrossRef]
- Dolz, V.; Novella, R.; García, A.; Sánchez, J. Hd diesel engine equipped with a bottoming rankine cycle as a waste heat recovery system. Part 1: Study and analysis of the waste heat energy. Appl. Therm. Eng. 2012, 36, 269–278. [Google Scholar] [CrossRef]
- Wang, Y.; Dai, C.; Wang, S. Theoretical analysis of a thermoelectric generator using exhaust gas of vehicles as heat source. Appl. Energy 2013, 112, 1171–1180. [Google Scholar] [CrossRef]
- Gewald, D.; Karellas, S.; Schuster, A.; Spliethoff, H. Integrated system approach for increase of engine combined cycle efficiency. Energy Conver. Manag. 2012, 60, 36–44. [Google Scholar] [CrossRef]
- Hatazawa, M.; Sugita, H.; Ogawa, T.; Seo, Y. Performance of a thermoacoustic sound wave generator driven with waste heat of automobile gasoline engine. Nippon Kikai Gakkai Ronbunshu B Hen (Trans. Jpn. Soc. Mech. Eng. Part B) 2004, 16, 292–299. (In Japanese) [Google Scholar] [CrossRef]
- Yu, C.; Chau, K. Thermoelectric automotive waste heat energy recovery using maximum power point tracking. Energy Conver. Manag. 2009, 50, 1506–1512. [Google Scholar] [CrossRef]
- Yang, J. Potential Applications of Thermoelectric Waste Heat Recovery in the Automotive Industry. In Proceedings of the 24th International Conference on Thermoelectrics, Clemson, SC, USA, 19–23 June 2005; pp. 170–174.
- Vázquez, J.; Sanz-Bobi, M.A.; Palacios, R.; Arenas, A. State of the Art of Thermoelectric Generators Based on Heat Recovered from the Exhaust Gases of Automobiles. Available online: http://www.iit.comillas.edu/palacios/thermo/EWT02-Exhaust_gases.pdf (accessed on 19 September 2016).
- Zhu, S.; Deng, K.; Qu, S. Thermodynamic analysis of an in-cylinder waste heat recovery system for internal combustion engines. Energy 2014, 67, 548–556. [Google Scholar] [CrossRef]
- Fu, J.; Liu, J.; Ren, C.; Wang, L.; Deng, B.; Xu, Z. An open steam power cycle used for ic engine exhaust gas energy recovery. Energy 2012, 44, 544–554. [Google Scholar] [CrossRef]
- Endo, T.; Kawajiri, S.; Kojima, Y.; Takahashi, K.; Baba, T.; Ibaraki, S.; Takahashi, T.; Shinohara, M. Study on Maximizing Exergy in Automotive Engines. SAE Int. 2007. [Google Scholar] [CrossRef]
- Bari, S.; Hossain, S.N. Waste heat recovery from a diesel engine using shell and tube heat exchanger. Appl. Therm. Eng. 2013, 61, 355–363. [Google Scholar] [CrossRef]
- Sarabchi, N.; Saray, R.K.; Mahmoudi, S. Utilization of waste heat from a hcci (homogeneous charge compression ignition) engine in a tri-generation system. Energy 2013, 55, 965–976. [Google Scholar] [CrossRef]
- Yamada, N.; Mohamad, M.N.A. Efficiency of hydrogen internal combustion engine combined with open steam rankine cycle recovering water and waste heat. Int. J. Hydrog. Energy 2010, 35, 1430–1442. [Google Scholar] [CrossRef]
- Wu, Z.-J.; Yu, X.; Fu, L.-Z.; Deng, J.; Hu, Z.-J.; Li, L.-G. A high efficiency oxyfuel internal combustion engine cycle with water direct injection for waste heat recovery. Energy 2014, 70, 110–120. [Google Scholar] [CrossRef]
- Kurniawan, W.H.; Abdullah, S. Numerical analysis of the combustion process in a four-stroke compressed natural gas engine with direct injection system. J. Mech. Sci. Tech. 2008, 22, 1937–1944. [Google Scholar] [CrossRef]
- Abdullah, S.; Kurniawan, W.H.; Shamsudeen, A. Numerical analysis of a combustion process in a compressed natural gas direct injection engine. J. Appl. Fluids Mech. 2008, 1, 65–86. [Google Scholar]
- El Tahry, S.H. K-epsilon equation for compressible reciprocating engine flows. J. Energy 1983, 7, 345–353. [Google Scholar] [CrossRef]
- Heywood, J.B. Internal Combustion Engine Fundamentals; Mcgraw-hill: New York, NY, USA, 1988; Volume 930. [Google Scholar]
- Harrington, J. Water Addition to Gasoline-Effect on Combustion, Emissions, Performance, and Knock. SAE Int. 1982. [Google Scholar] [CrossRef]


| Description | Details |
|---|---|
| ICE type | Single-cylinder GDI |
| Compression ratio | 13 |
| Bore [mm] | 80 |
| Stroke [mm] | 81.4 |
| Displacement [cm3] | 441 |
| Engine speed [rpm] | 2000 |
| Ignition timing | 20° CA bTDC |
| Fuel injection timing | 60° CA bTDC |
| Fuel injection duration [° CA] | 20 |
| Boundary Condition | Value |
|---|---|
| Inlet mass flow rate [g/s] | 0.5 |
| Outlet pressure [bar] | 1.3 |
| Manifold wall [K] | 330 |
| Exhaust wall [K] | 550 |
| Piston [K] | 450 |
| Intake valve [K] | 330 |
| Exhaust valve [K] | 550 |
| Chamber [K] | 450 |
| Cylinder [K] | 450 |
| Parameter | Value |
|---|---|
| Injection Timing | 80° CA bTDC |
| Water duration [° CA] | 10 |
| Water temperature [K] | 310 |
| Water mass [Kg] | 5% (WA 5); 10% (WA 10); 15% (WA 15); 20% (WA 20); 25% (WA 25) in relation to fuel mass |
| Item | Value |
|---|---|
| Injection Timing (° CA) | 730 |
| Water duration (° CA) | 10 |
| Water temperature [K] | 373 |
| Water mass [Kg] | 100% (WA 1.0); 200% (WA 2.0); 300% (WA 3.0); 400% (WA 4.0) relative to fuel mass |
| Item | Value |
|---|---|
| 1st WI | |
| Injection Timing | 80° CA bTDC |
| Water duration [° CA] | 10 |
| Water temperature [K] | 310 |
| Water mass [Kg] | WA 15 |
| 2nd WI | |
| Injection Timing | 10° CA aTDC |
| Water duration [° CA] | 10 |
| Water temperature [K] | 200 |
| Water mass [Kg] | 3.0 WA |
© 2016 by the authors; licensee MDPI, Basel, Switzerland. This article is an open access article distributed under the terms and conditions of the Creative Commons Attribution (CC-BY) license (http://creativecommons.org/licenses/by/4.0/).
Share and Cite
Wei, M.; Nguyen, T.S.; Turkson, R.F.; Guo, G.; Liu, J. The Effect of Water Injection on the Control of In-Cylinder Pressure and Enhanced Power Output in a Four-Stroke Spark-Ignition Engine. Sustainability 2016, 8, 993. https://doi.org/10.3390/su8100993
Wei M, Nguyen TS, Turkson RF, Guo G, Liu J. The Effect of Water Injection on the Control of In-Cylinder Pressure and Enhanced Power Output in a Four-Stroke Spark-Ignition Engine. Sustainability. 2016; 8(10):993. https://doi.org/10.3390/su8100993
Chicago/Turabian StyleWei, Mingrui, Thanh Sa Nguyen, Richard Fiifi Turkson, Guanlun Guo, and Jinping Liu. 2016. "The Effect of Water Injection on the Control of In-Cylinder Pressure and Enhanced Power Output in a Four-Stroke Spark-Ignition Engine" Sustainability 8, no. 10: 993. https://doi.org/10.3390/su8100993