
Research on the Sustainable Development of Green-Space in Beijing Using the Dynamic Systems Model

 and
and
Abstract
:1. Introduction
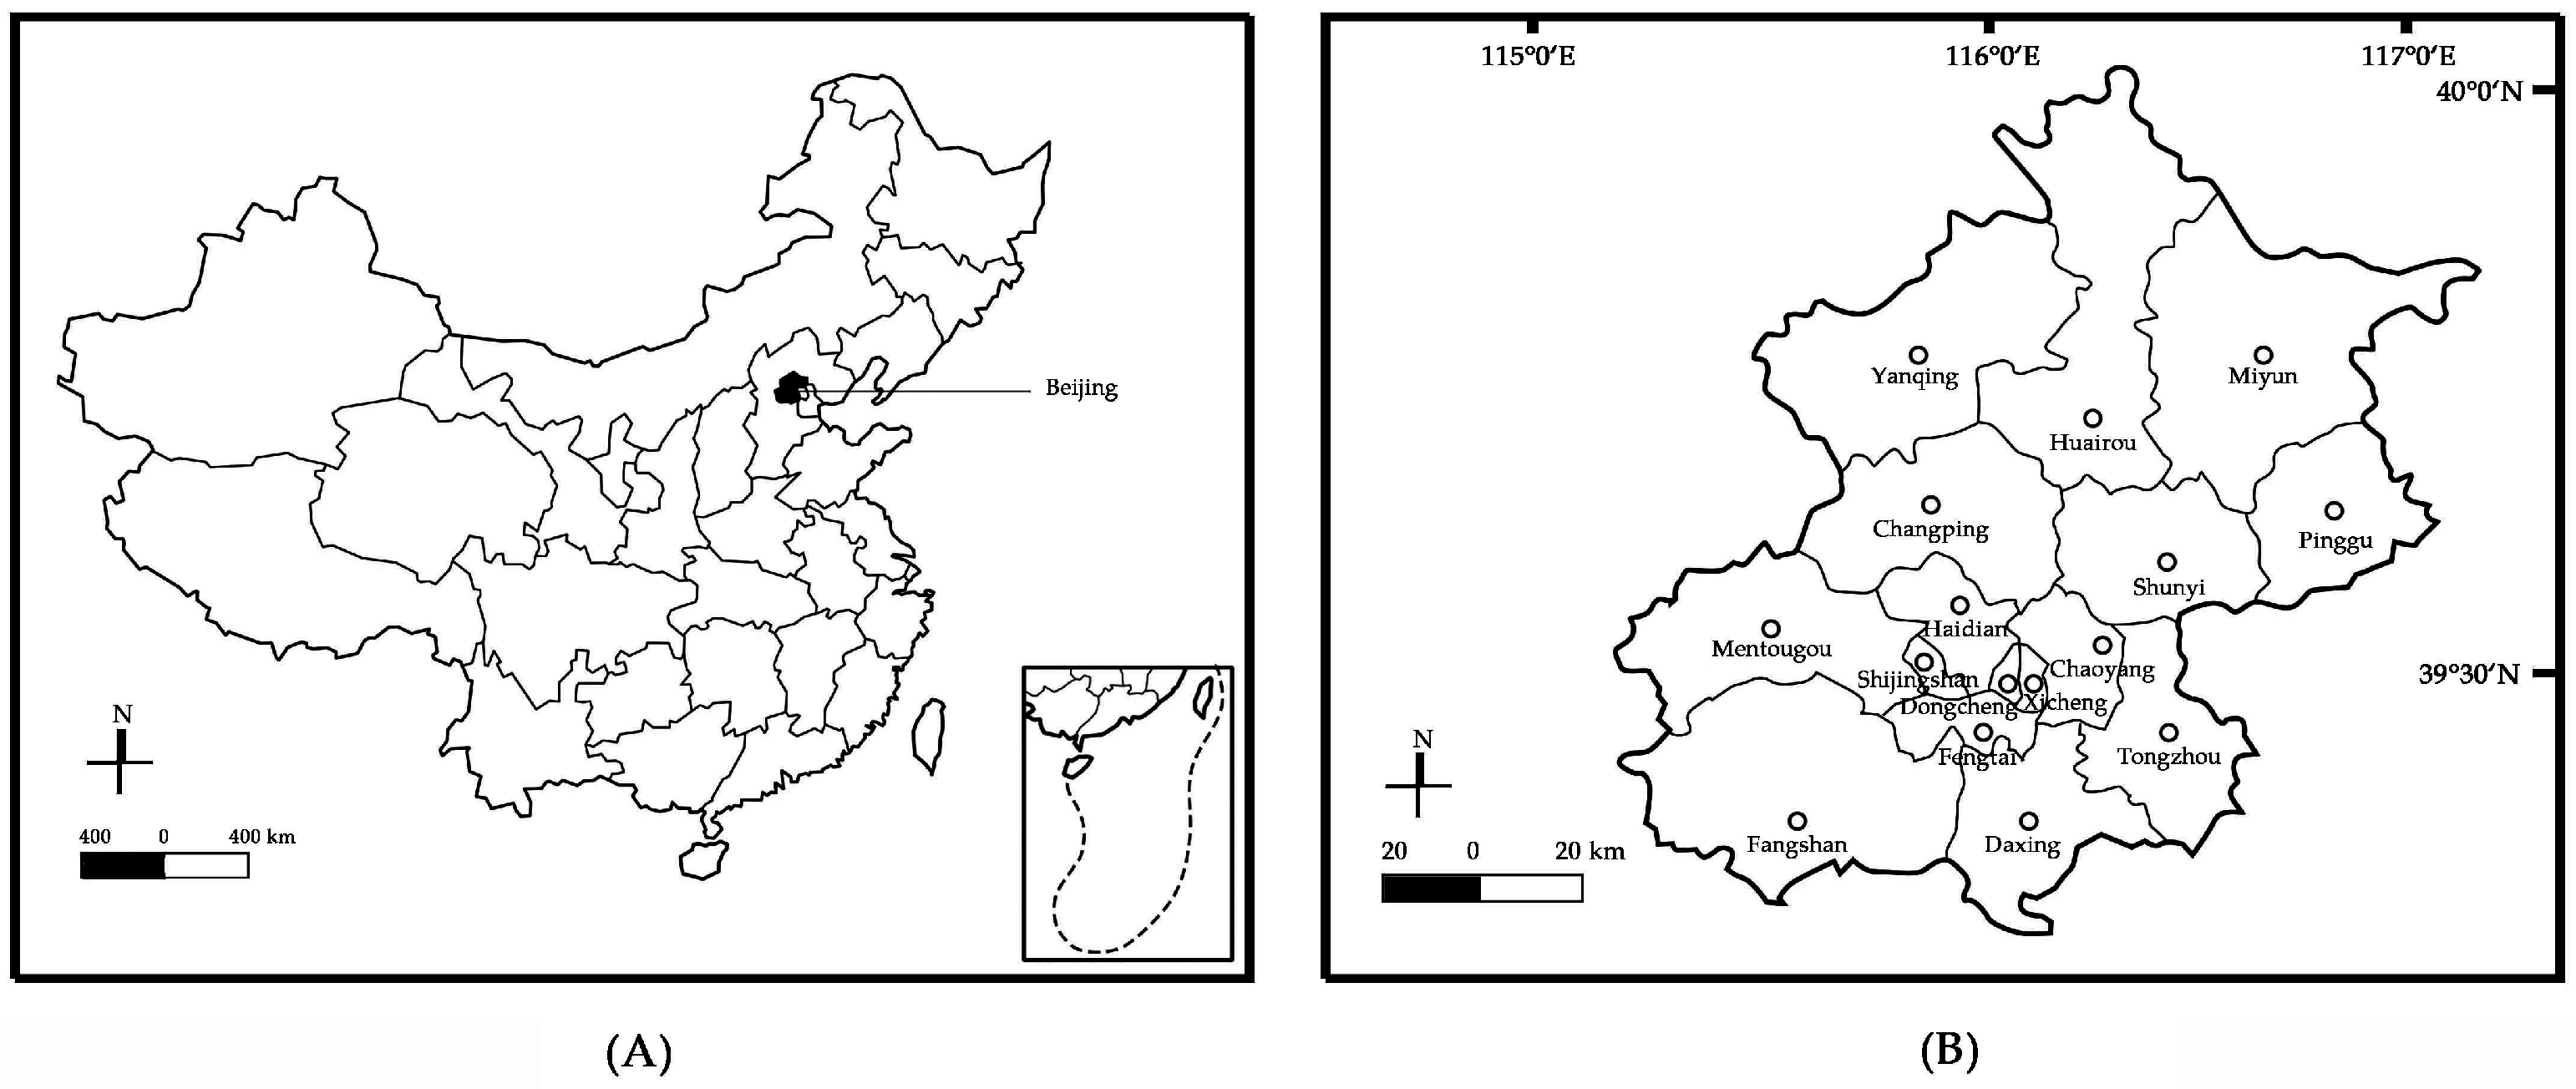
2. Study Area
3. Methods
3.1. SDGS Index System and Weight
3.2. Measurement
3.3. Establishment of the SDGS Model
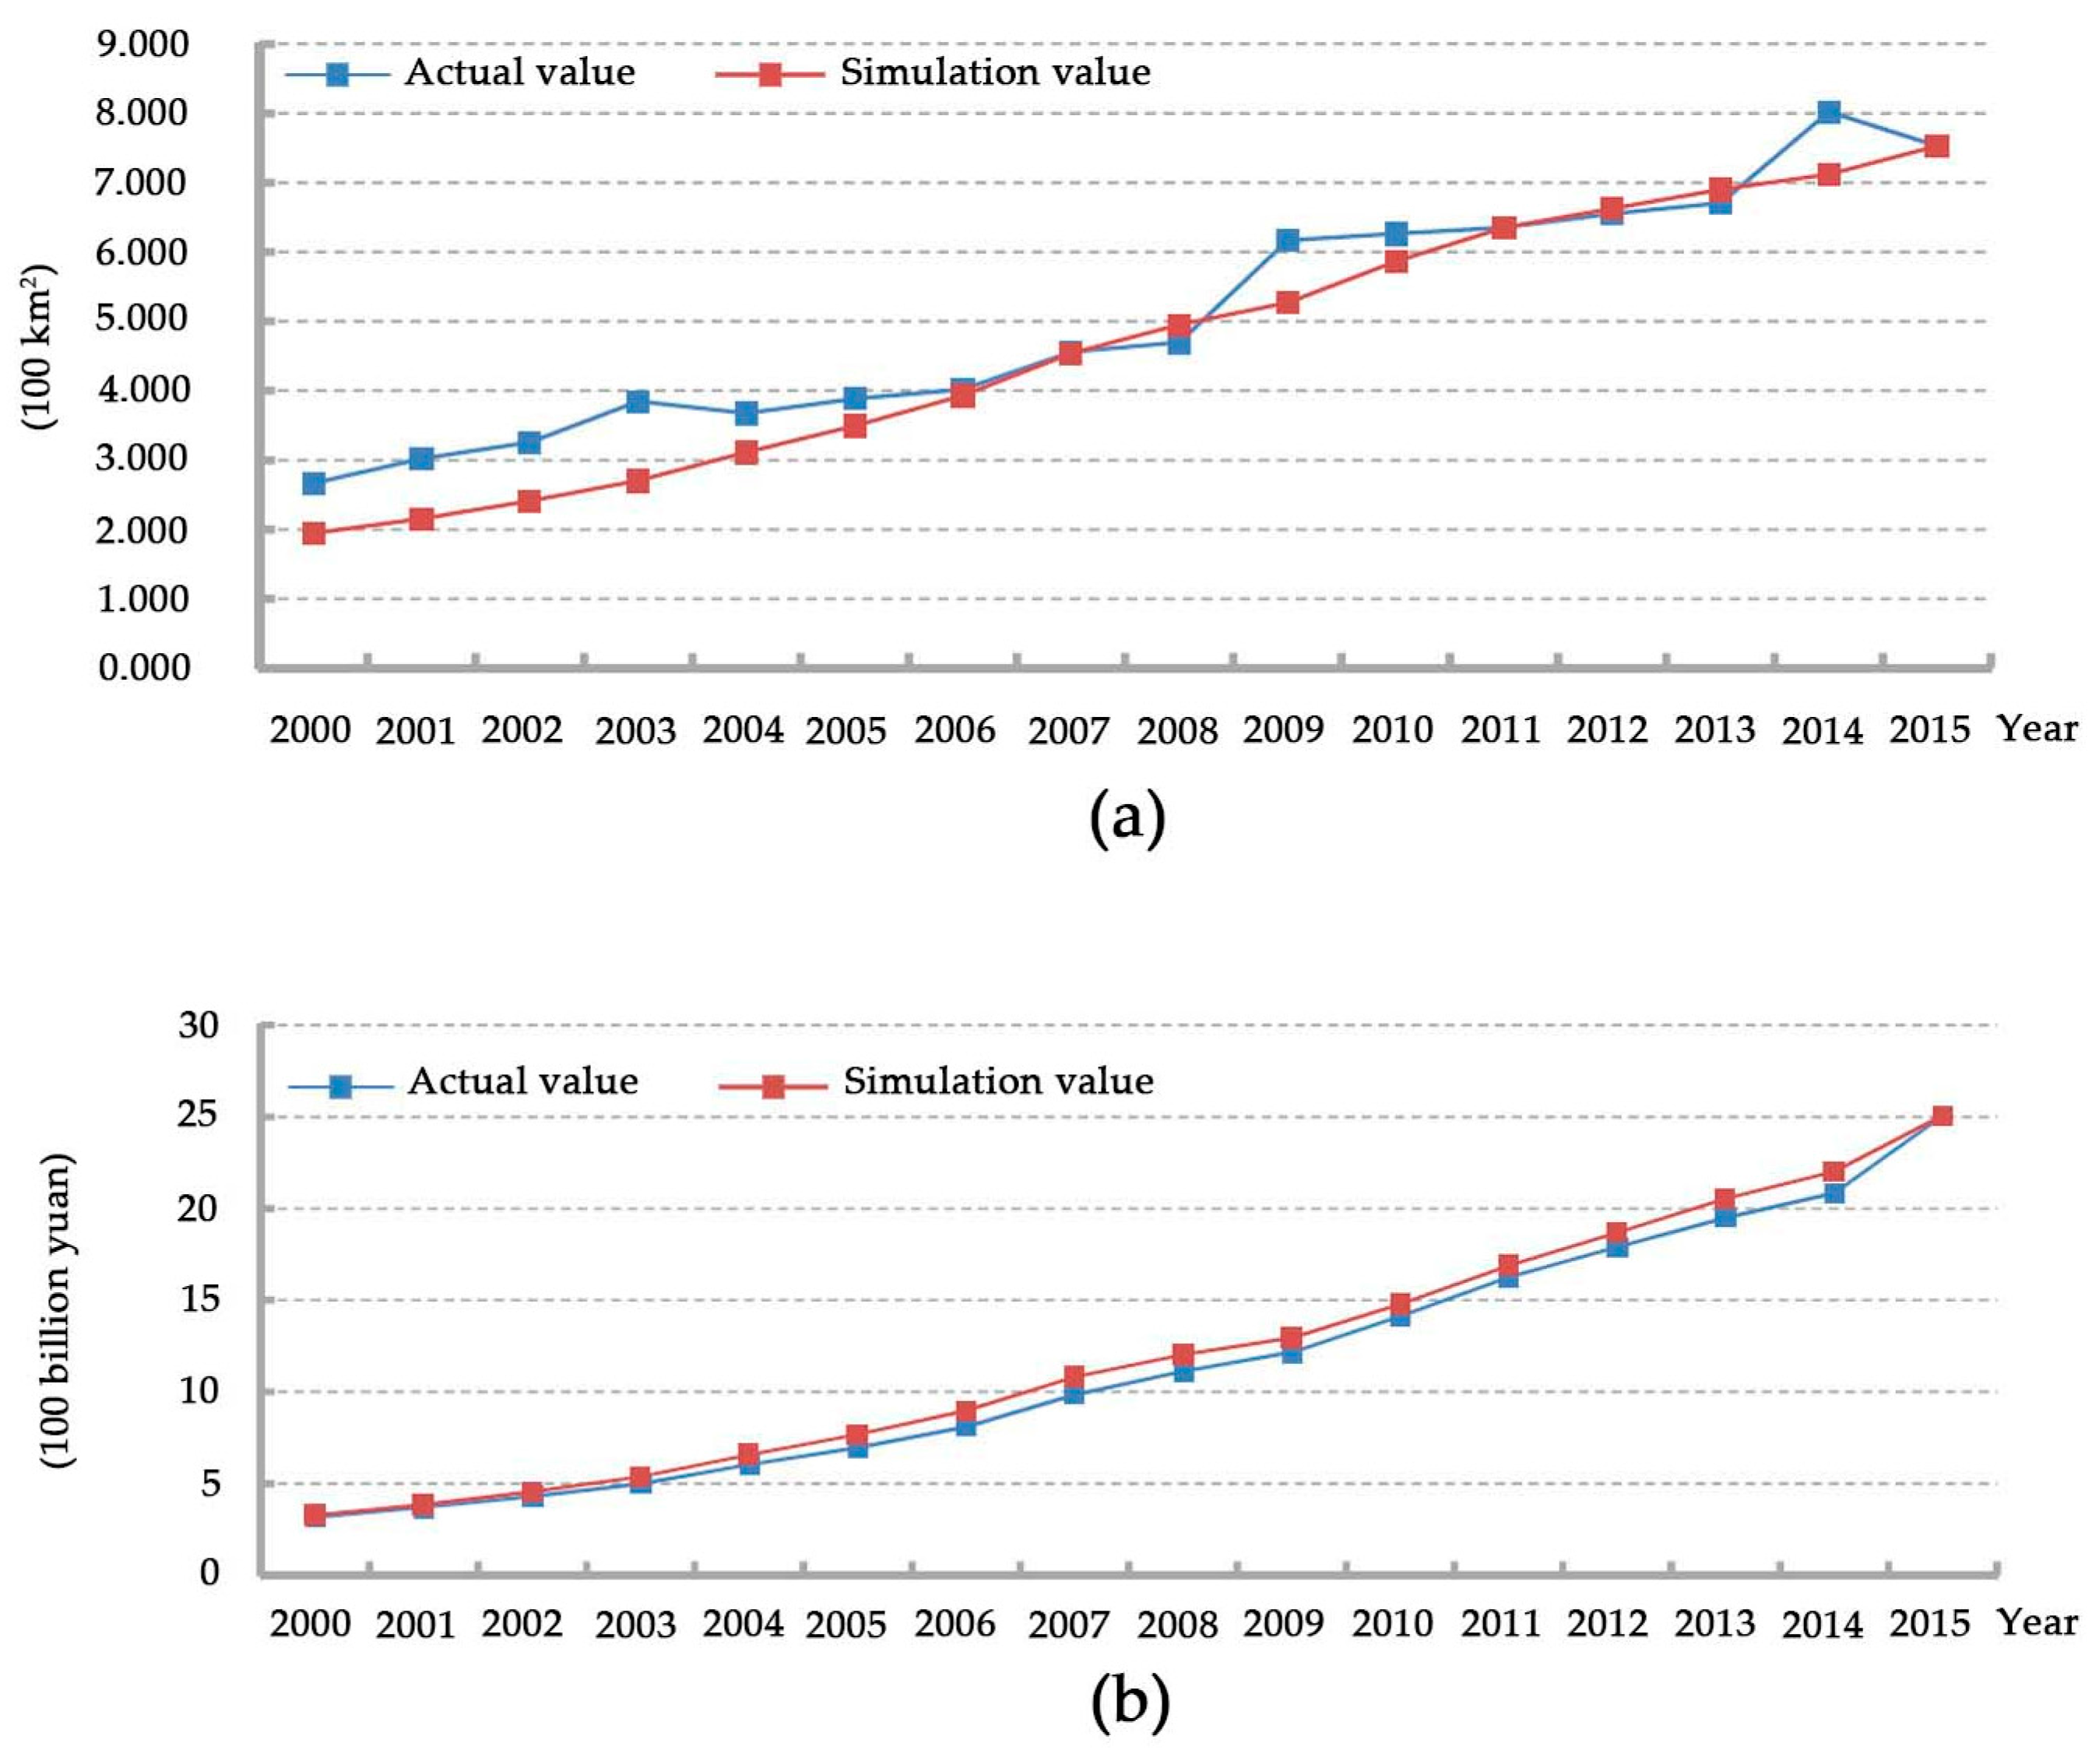
3.4. Verification Test
3.5. Scenario Design
4. Results
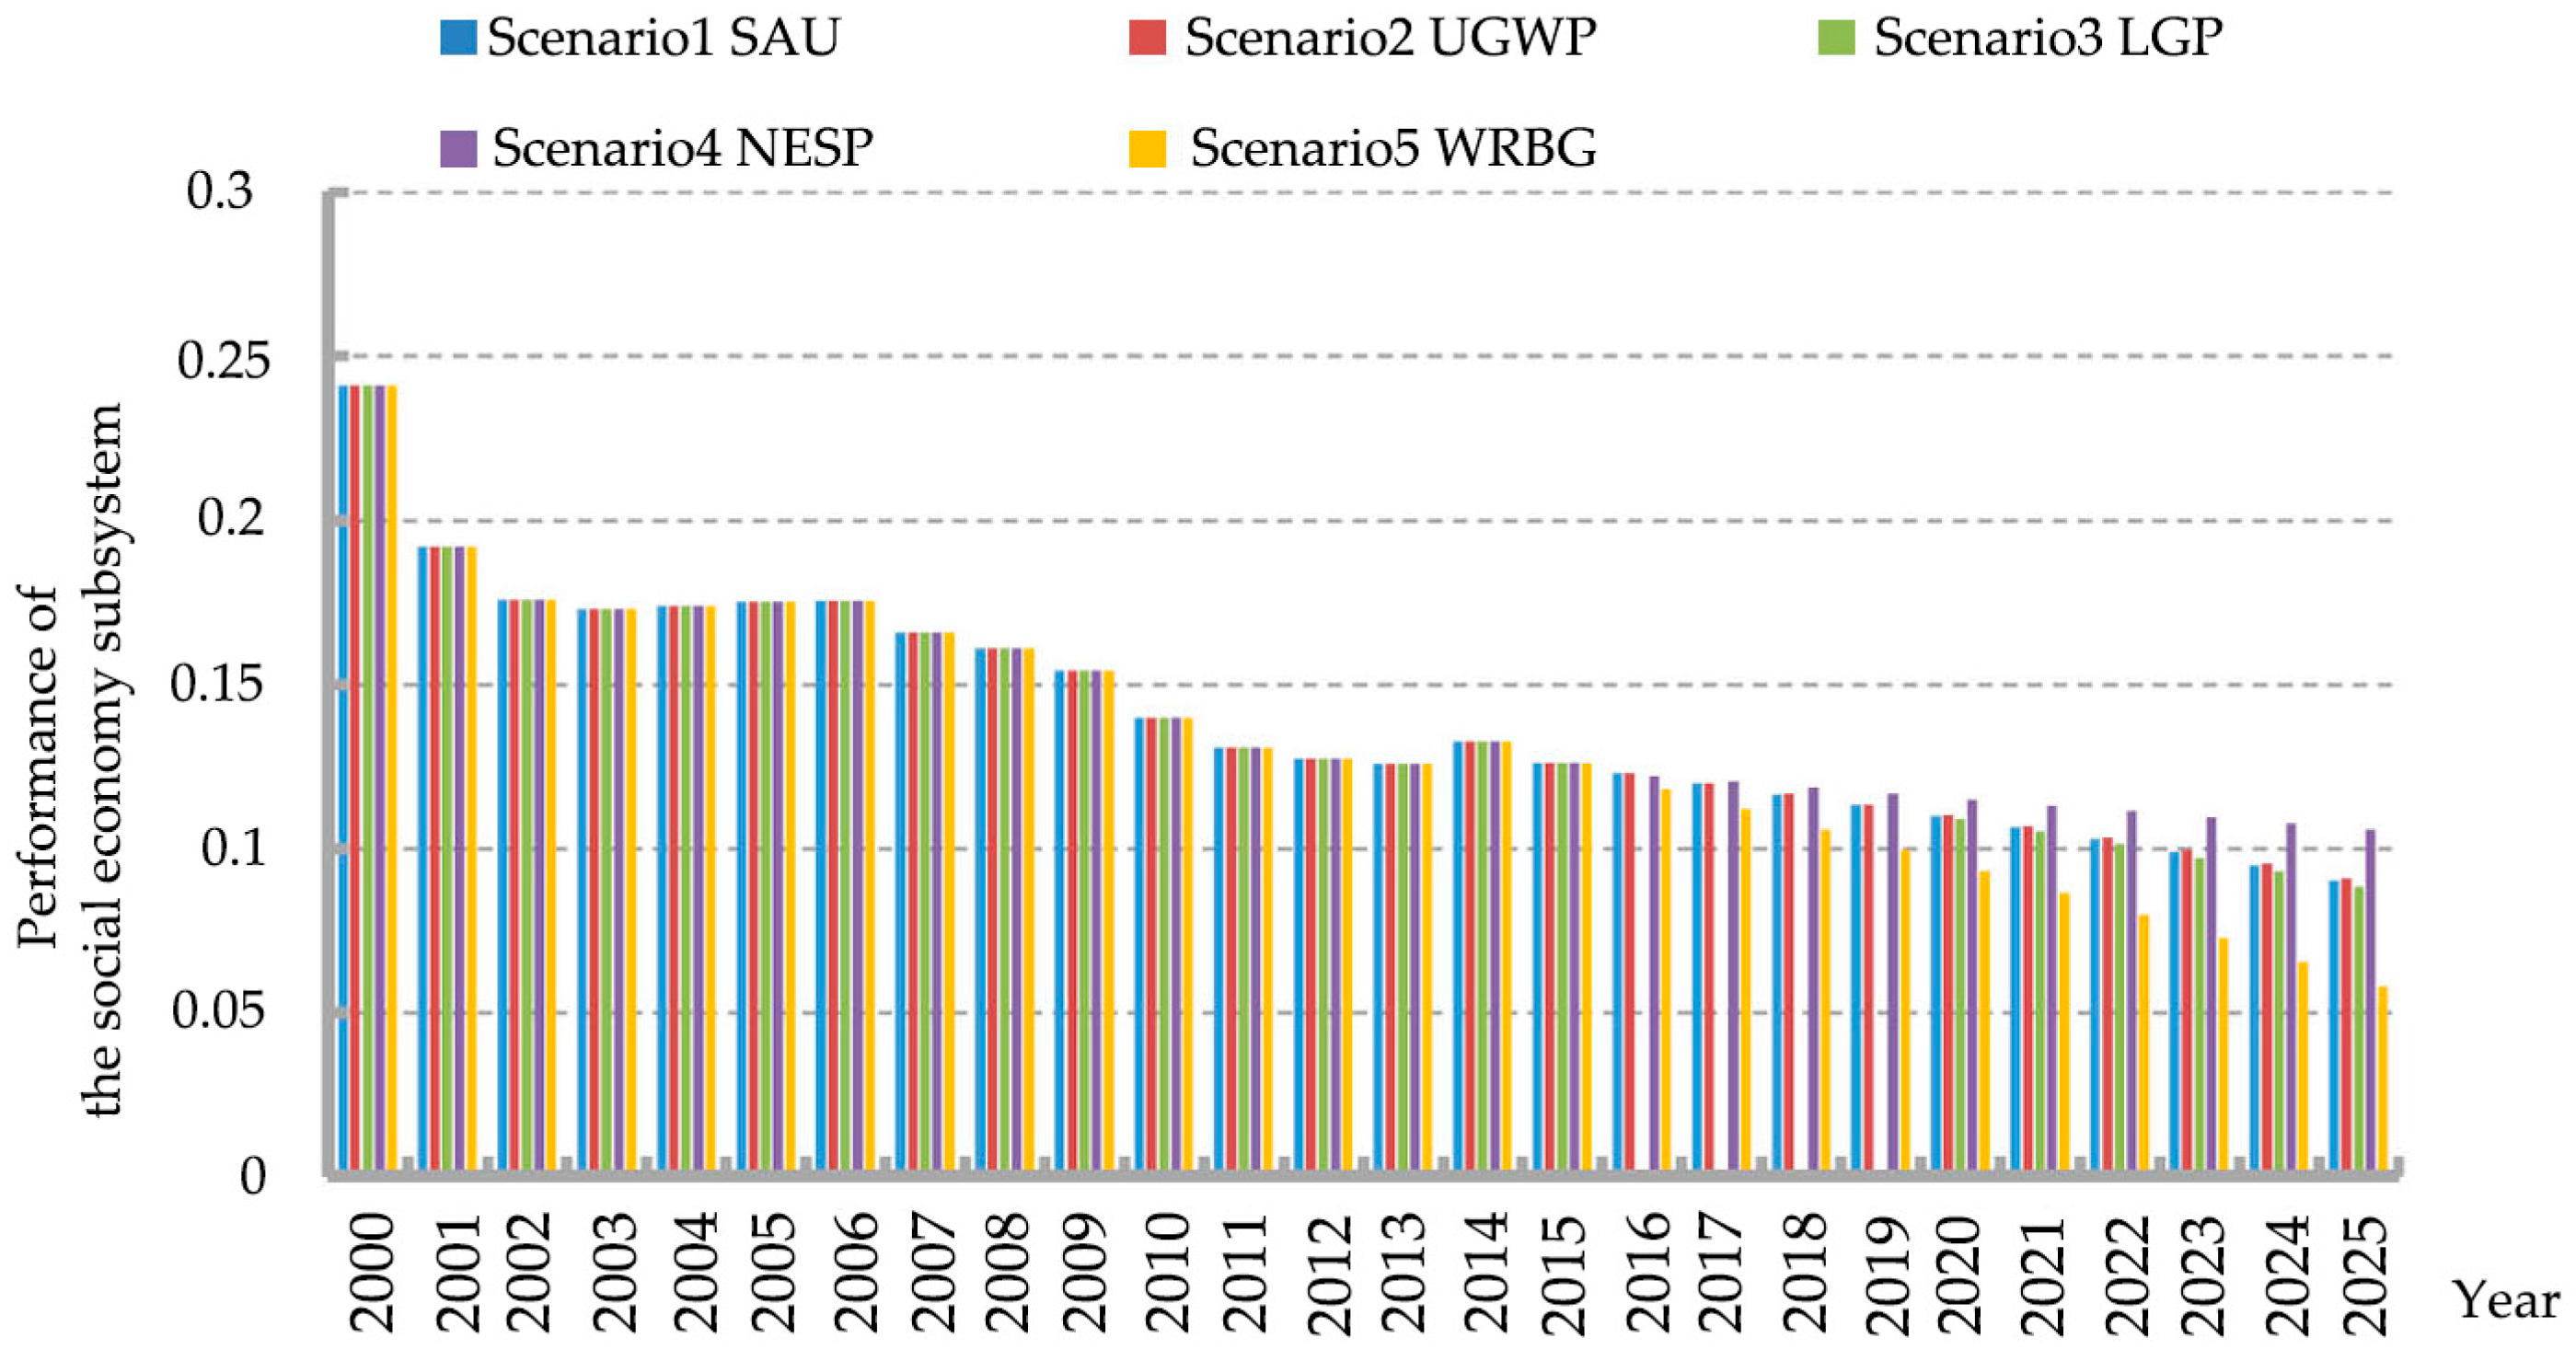
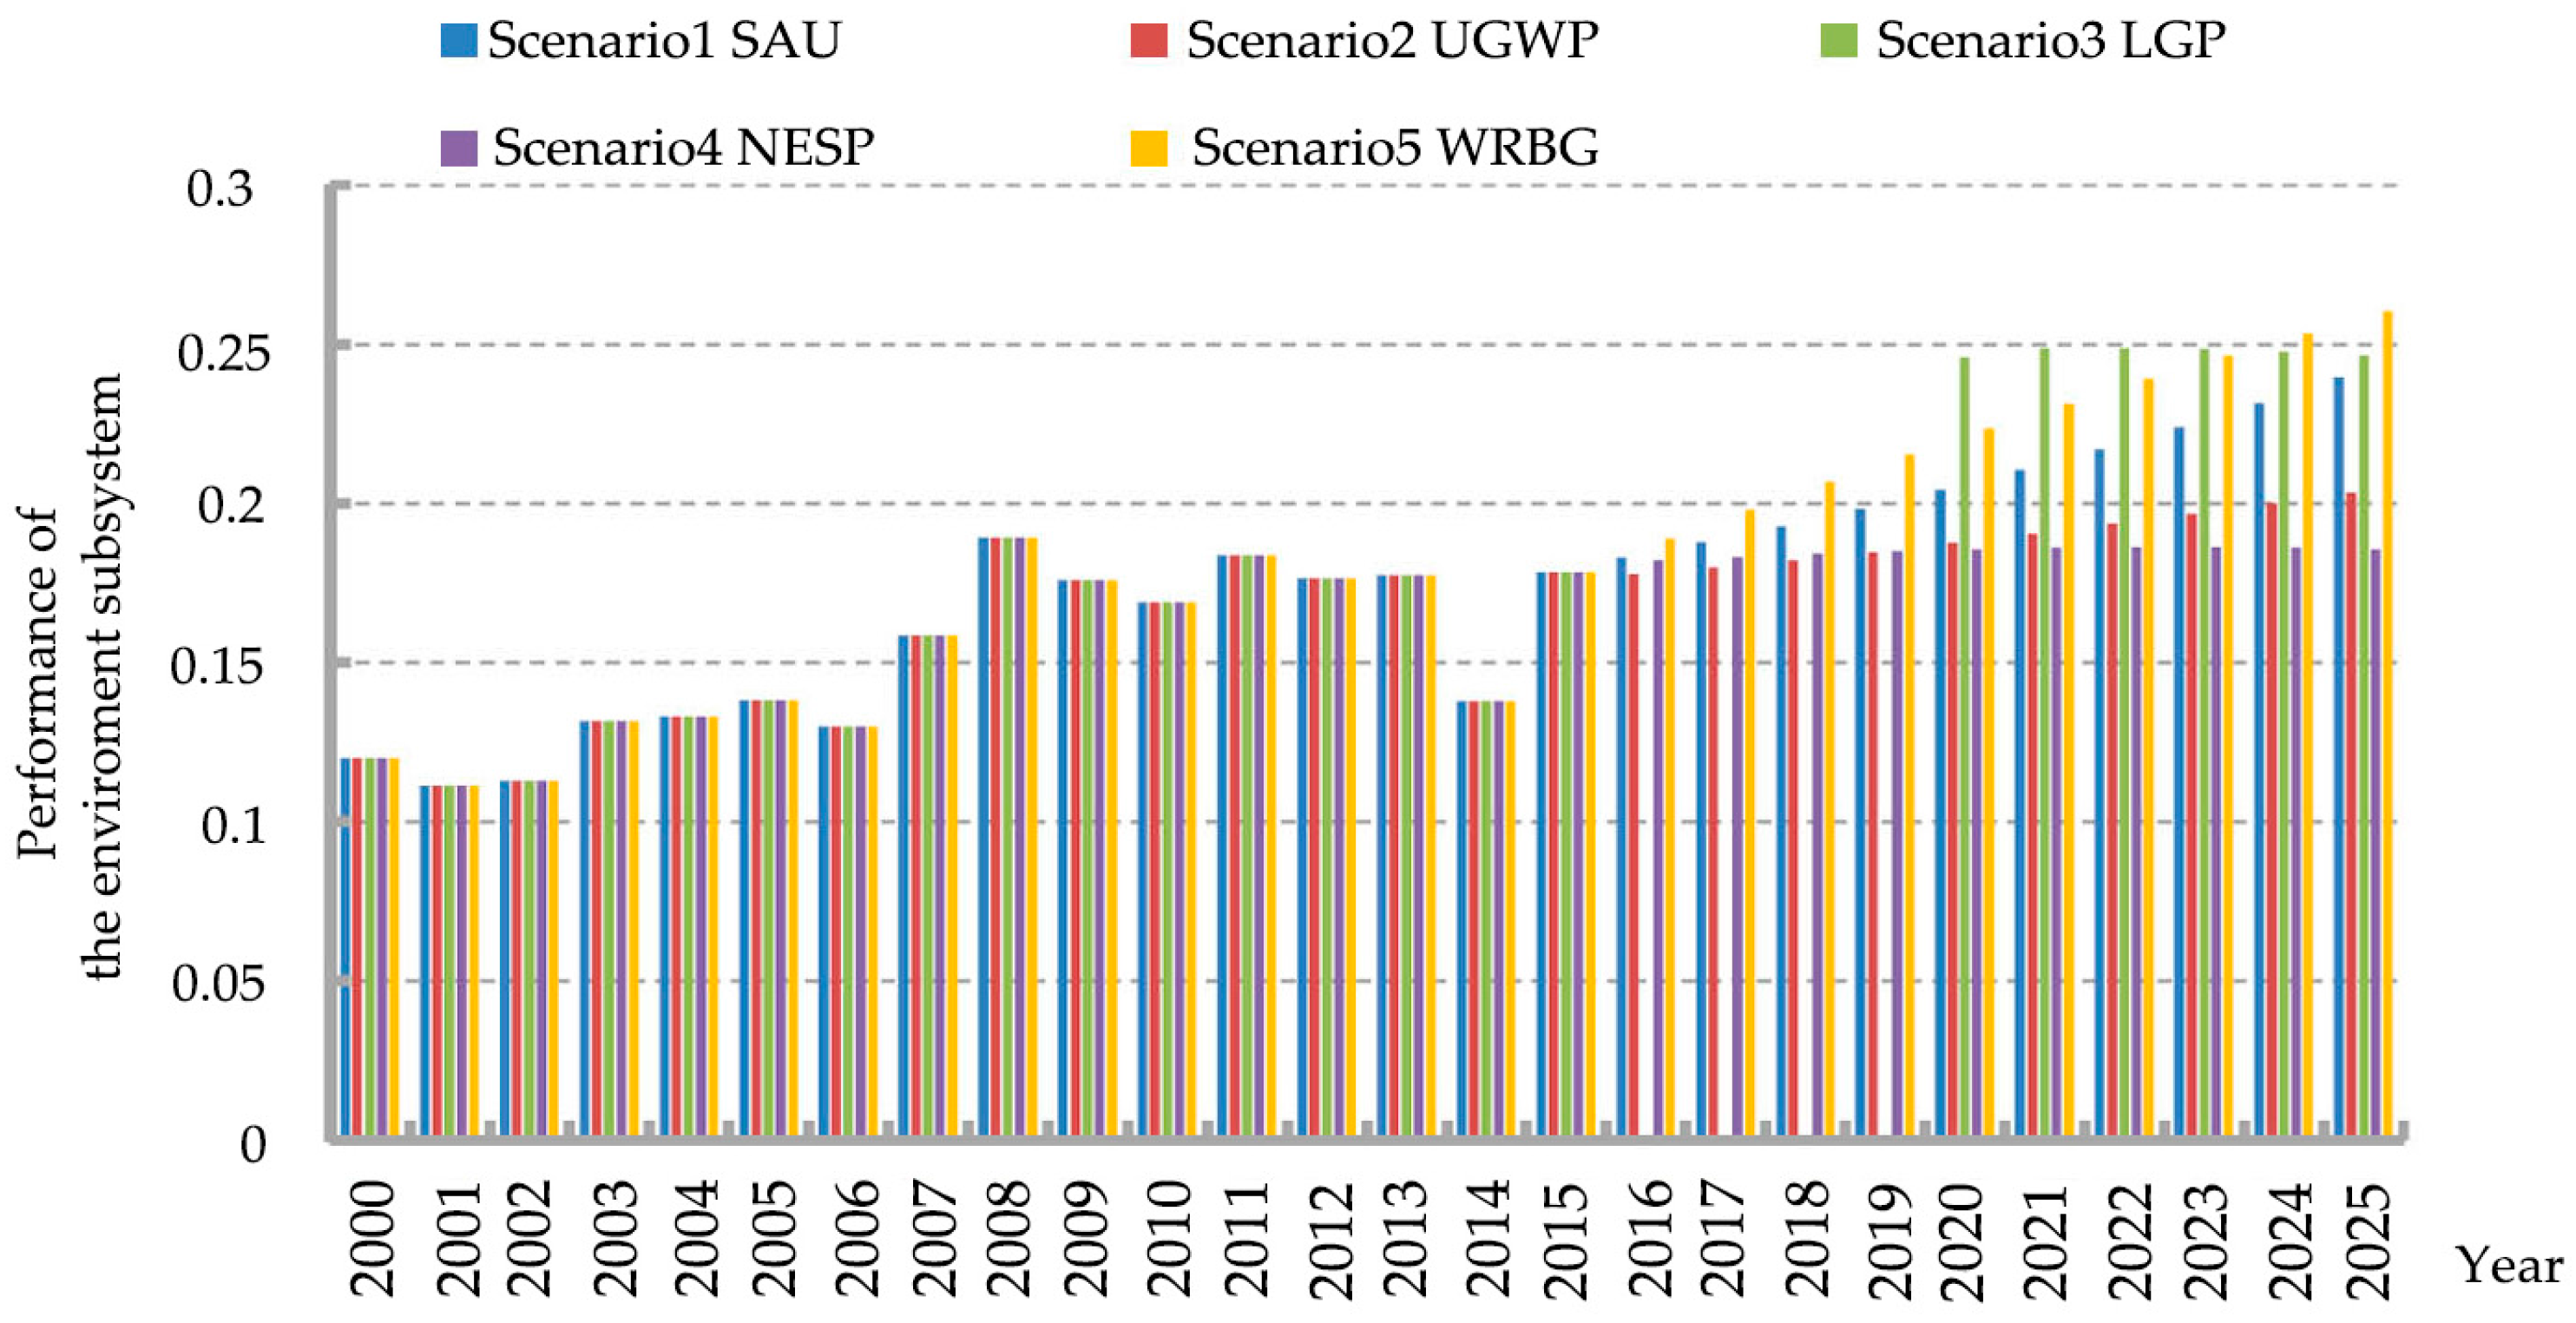
4.1. Performance for the Subsystems
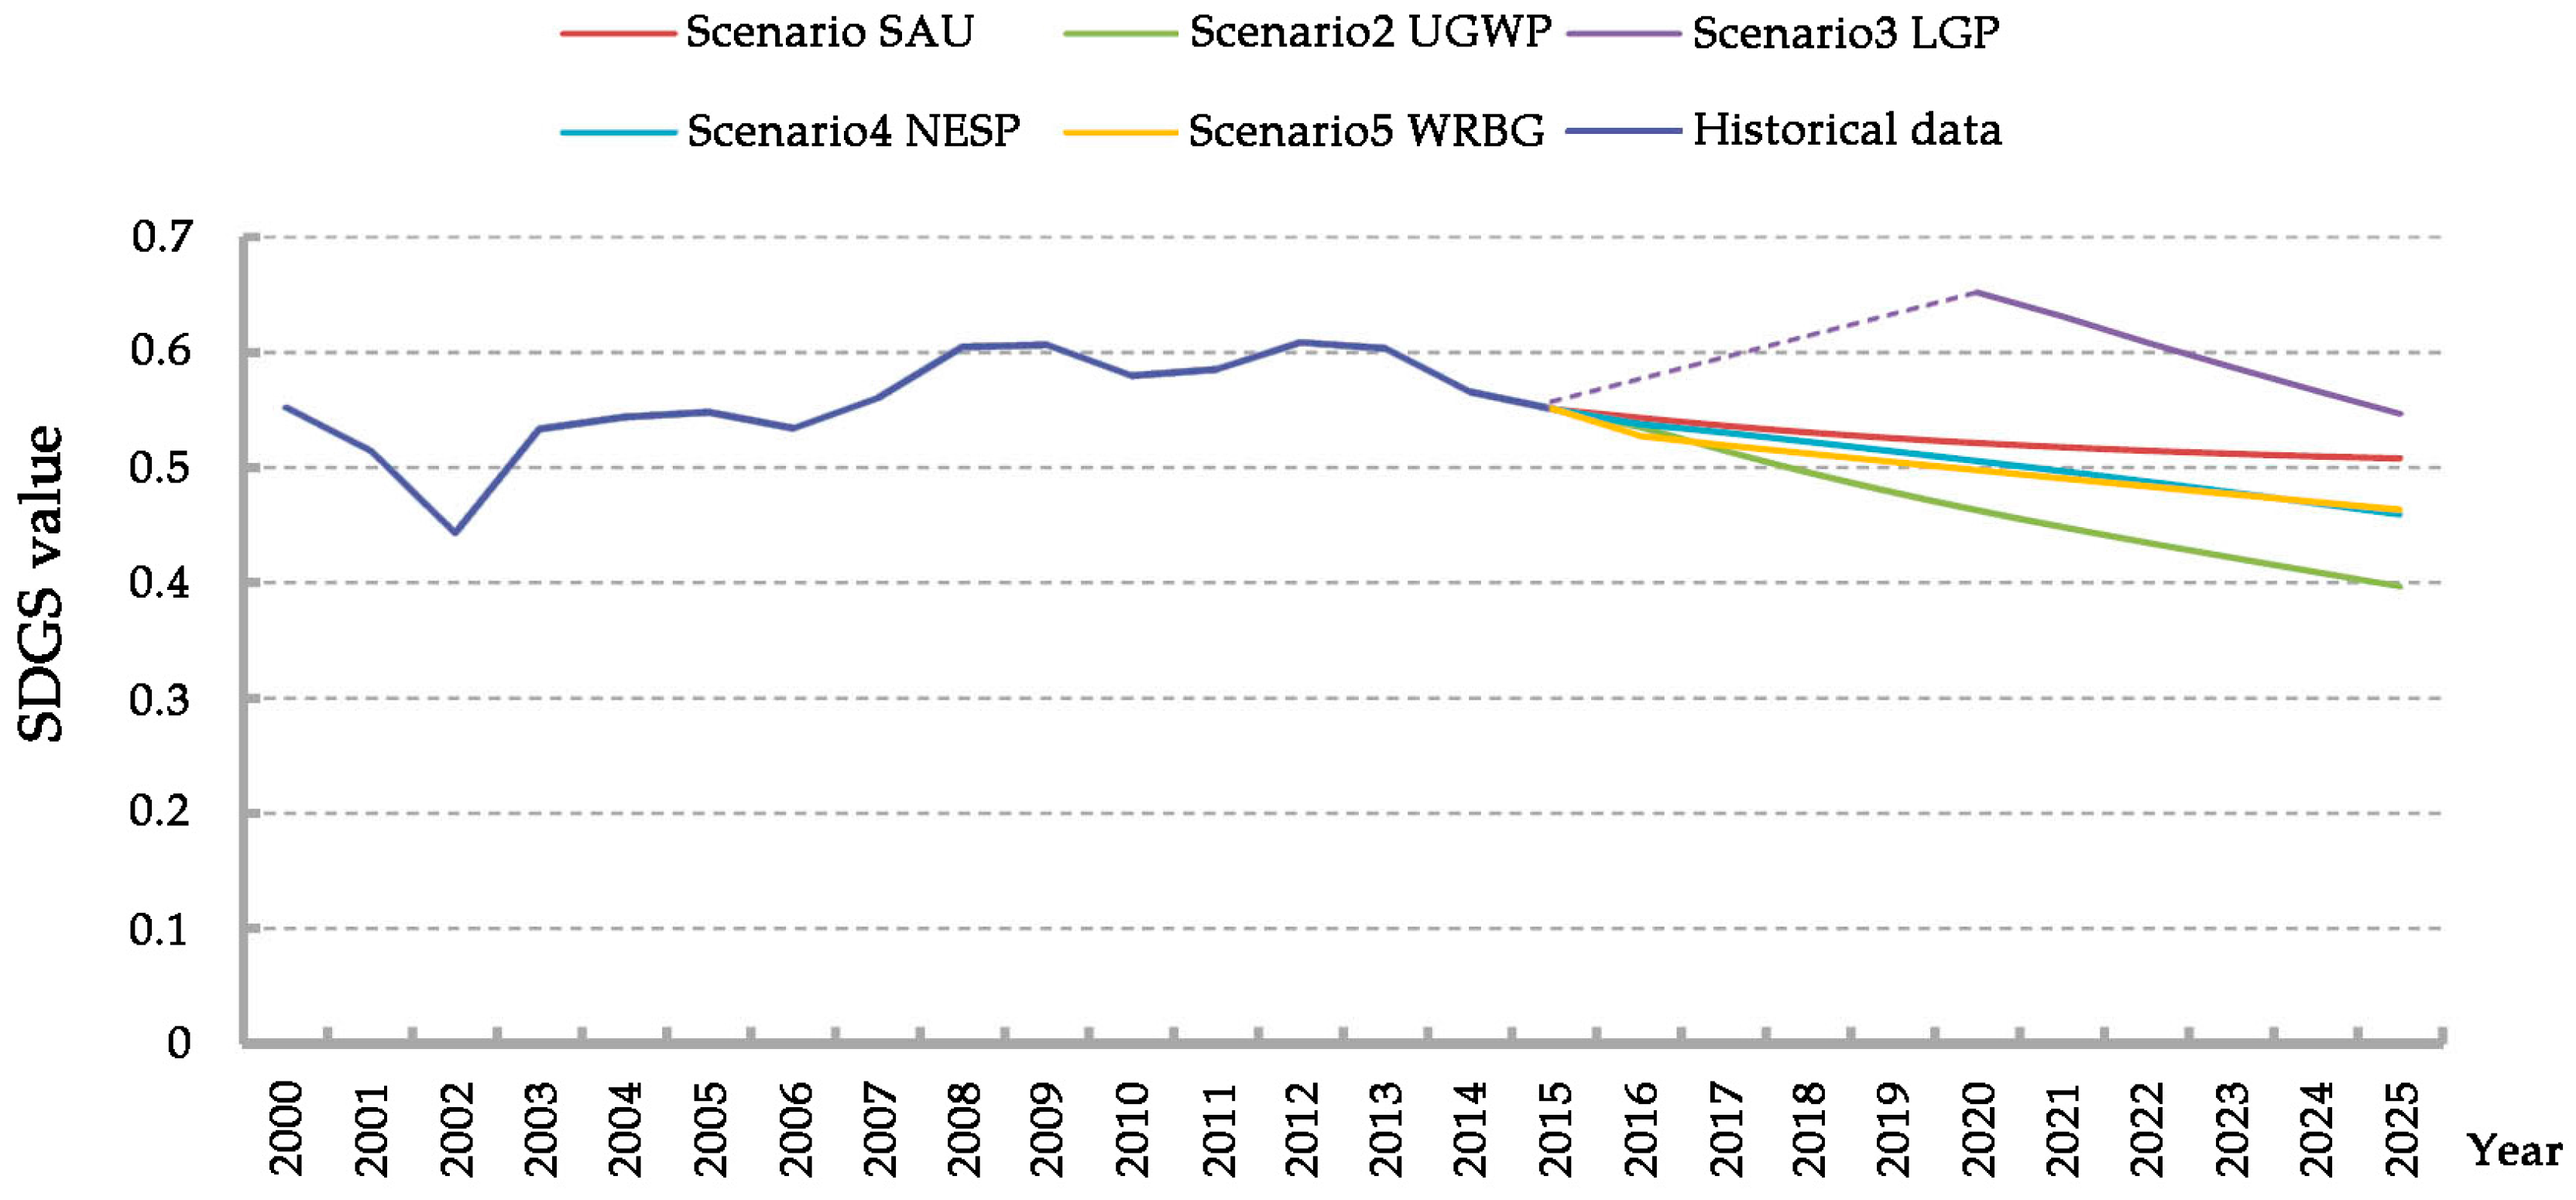
4.2. Performance for the SDGS Value
5. Discussion
5.1. Analysis of the Subsystem Performance
5.2. Analysis of the SDGS Performance
5.3. Implications for Urban Green Space Development Policy Formulation
6. Conclusions
Acknowledgments
Author Contributions
Conflicts of Interest
References
- Groenewegen, P.P.; van den Berg, A.E.; de Vries, S.; Verheij, R.A. Vitamin G: Effects of green space on health, well-being, and social safety. BMC Public Health 2006, 6, 149. [Google Scholar] [CrossRef] [PubMed]
- Wolch, J.R.; Byme, J.; Newell, J.P. Urban green space, public health, and environmental justice: The challenge of making cities ‘just green enough’. Landsc. Urban Plan. 2014, 125, 234–244. [Google Scholar] [CrossRef]
- Cho, S.H.; Bowker, J.M.; Park, W.M. Measuring the contribution of water and green space amenities to housing values: An application and comparison of spatially weighted hedonic models. J. Agric. Resour. Econ. 2006, 31, 485–507. [Google Scholar]
- Gómez, F.; Jabaloyes, J.; Montero, L.; De Vicente, V.; Valcuende, M. Green areas, the most significant indicator of the sustainability of cities: Research on their utility for urban planning. J. Urban Plan. Dev. 2010, 137, 311–328. [Google Scholar] [CrossRef]
- Bolund, P.; Hunhammar, S. Ecosystem services in urban areas. Ecol. Econ. 1999, 29, 293–301. [Google Scholar] [CrossRef]
- Seto, K.C.; Woodcock, C.E.; Song, C.; Huang, X.; Lu, J.; Kaufmann, R.K. Monitoring land-use change in the Pearl River Delta using Landsat TM. Int. J. Remote Sens. 2002, 23, 1985–2004. [Google Scholar] [CrossRef]
- Qian, Y.; Zhou, W.; Li, W.; Han, L. Understanding the dynamic of greenspace in the urbanized area of Beijing based on high resolution satellite images. Urban For. Urban Green. 2015, 14, 39–47. [Google Scholar] [CrossRef]
- Yu, X.Q.; Xu, S.J.; Li, X.M. The Beijing Area Statistical Yearbook (2000–2013); Beijing Municipal Bureau of Statistics: Beijing, China, 2013.
- 2015 Statistical Results of Urban Greening Resources in Beijing. Available online: http://www.bjyl.gov.cn/zwgk/tjxx/201604/t20160401_178532.html (accessed on 5 April 2016).
- Pijanowski, B.C.; Brown, D.G.; Shellitoc, B.A.; Manikd, G.A. Using neural nets and GIS to forecast land use changes: A land transformation model. Comput. Environ. Urban Syst. 2002, 26, 553–575. [Google Scholar] [CrossRef]
- Li, X.; Yeh, A.O. Neural-network-based cellular automata for simulating multiple land use changes using GIS. Int. J. Geogr. Inf. Sci. 2002, 16, 323–343. [Google Scholar] [CrossRef]
- Pontius, R.G.; Cornell, J.D.; Hall, C.A.S. Modeling the spatial pattern of land-use change with GEOMOD2: Application and validation for Costa Rica. Agric. Ecosyst. Environ. 2001, 85, 191–203. [Google Scholar] [CrossRef]
- Das, M.; Kumar, A.; Mohapatra, M.; Muduli, S.D. Evaluation of drinking quality of groundwater through multivariate techniques in urban area. Environ. Monit. Assess. 2010, 166, 149–157. [Google Scholar] [CrossRef] [PubMed]
- Lundquist, J.E. Use of fourier transforms to define landscape scales of analysis for disturbances: A case study of thinned and un thinned forest stands. Landsc. Ecol. 2002, 17, 445–454. [Google Scholar] [CrossRef]
- Onkal-Engin, G.; Demir, I.; Hiz, H. Assessment of urban air quality in Istanbul using fuzzy synthetic evaluation. Atmos. Environ. 2004, 38, 3809–3815. [Google Scholar] [CrossRef]
- Forrester, J.W. Industrial Dynamics; MIT Press: Cambridge, UK, 1961. [Google Scholar]
- Sweetser, A. A Comparison of System Dynamics (SD) and Discrete Event Simulation (DES). In Proceedings of the 17th International Conference of The System Dynamics Society and the 5th Australian & New Zealand Systems Conference, Wellington, New Zealand, 20–23 July 1999.
- Xu, J.L.; Ding, Y. Research on Early Warning of Food Security Using a System Dynamics Model: Evidence from Jiangsu Province in China. J. Food Sci. 2015, 80, R1–R9. [Google Scholar] [CrossRef] [PubMed]
- Feng, Y.Y.; Chen, S.Q.; Zhang, L.X. System dynamics modeling for urban energy consumption and CO2 emissions: A case study of Beijing, China. Ecol. Model. 2013, 252, 44–52. [Google Scholar] [CrossRef]
- Wu, Y.; Chen, K.; Yang, Y.; Feng, T. A system dynamics analysis of technology, cost and policy that affect the market competition of shale gas in China. Renew. Sustain. Energy Rev. 2015, 45, 235–243. [Google Scholar]
- Li, F.; Lu, S.; Sun, Y.; Li, X.; Xi, B.; Liu, W. Integrated Evaluation and Scenario Simulation for Forest Ecological Security of Beijing Based on System Dynamics Model. Sustainability 2015, 7, 13631–13659. [Google Scholar] [CrossRef]
- The Beijing National Economic and Social Development Statistical Bulletin in 2015. Available online: http://www.stats.gov.cn/tjsj/zxfb/201602/t20160229_1323991.html (accessed on 21 April 2016).
- Notice of Beijing Municipal Bureau of Landscape and Forestry on Printing and Distributing the Work Plan of Urban Greening in 2016. Available online: http://www.bjyl.gov.cn/zwgk/fgwj/qtwj/201602/t20160202_176411.shtml (accessed on 2 February 2015).
- Kamal, M.A. Application of the AHP in project management. Int. J. Proj. Manag. 2001, 19, 19–27. [Google Scholar]
- Yan, B.Y.; Xing, J.S.; Tan, H.R.; Deng, S.P.; Tan, Y.N. Analysis on water environment capacity of the Poyang Lake. Procedia Environ. Sci. 2011, 10, 2754–2759. [Google Scholar]
- Tian, Y.H.; Jim, C.Y.; Wang, H.Q. Assessing the landscape and ecological quality of urban greens paces in a compact city. Landsc. Urban Plan. 2014, 121, 97–108. [Google Scholar] [CrossRef]
- Ishikawa, N.; Fukushige, M. Effects of street landscape planting and urban public parks on dwelling environment evaluation in Japan. Urban. For. Urban. Green. 2012, 11, 390–395. [Google Scholar] [CrossRef]
- Tsurumi, T.; Managi, S. Environmental value of green spaces in Japan: An application of the life satisfaction approach. Ecol. Econ. 2015, 120, 1–12. [Google Scholar] [CrossRef]
- Mella, L.C.; Henneberry, J.; Hehl-Lange, S.; Keskin, B. Promoting urban greening: Valuing the development of green infrastructure investments in the urban core of Manchester, UK. Urban For. Urban. Green. 2013, 12, 296–306. [Google Scholar] [CrossRef]
- Zhou, X.L.; Rana, M.M.P. Social benefits of urban green space: A conceptual framework of valuation and accessibility measurements. Manag. Environ. Qual. Int. J. 2012, 23, 173–189. [Google Scholar] [CrossRef]
- Demuzere, M.; Orru, K.; Heidrich, O.; Olazabal, E.; Geneletti, D.; Orru, H.; Bhave, A.G.; Mittal, N.; Feliu, E.; Faehnle, M. Mitigating and adapting to climate change: Multi-functional and multi-scale assessment of green urban infrastructure. J. Environ. Manag. 2014, 146, 107–115. [Google Scholar] [CrossRef] [PubMed]
- Evaluation Standard for Urban Landscaping and Greening; Ministry of Housing and Urban-Rural Development: Beijing, China, 2010. (In Chinese)
- Xu, X.G.; Duan, X.F.; Sun, H.Q.; Sun, Q. Green Space Changes and Planning in the Capital Region of China. Environ. Manag. 2011, 47, 456–467. [Google Scholar] [CrossRef] [PubMed]
- Richard, G.D.; Olga, B.; Richard, A.F.; Jamie, T.; Nicholas, B.; Daniel, L.; Philip, H.W.; Kevin, J.G. City-wide relationships between green spaces, urban land use and topography. Urban Ecosyst. 2008, 11, 269–287. [Google Scholar]
- Zhao, J.J.; Chen, S.B.; Jiang, B.; Ren, Y.; Wang, H.; Jonathan, V.; Yu, H.D. Temporal trend of green space coverage in China and its relationship with urbanization over the last two decades. Sci. Total Environ. 2013, 442, 455–465. [Google Scholar] [CrossRef] [PubMed]
- Peng, J.; Wang, Y.L.; Jing, J.; Chang, Q.; Wu, J.S. Rural industrial structure and landscape diversity: Correlation research. Int. J. Sustain. Dev. World Ecol. 2007, 14, 268–277. [Google Scholar] [CrossRef]
- Francesc, B.; Lydia, C.; Erik, G.B.; Johannes, L.; David, J.N.; Jaume, T. Contribution of Ecosystem Services to Air Quality and Climate Change Mitigation Policies: The Case of Urban Forests in Barcelona, Spain. Ambio 2014, 43, 466–479. [Google Scholar]
- Hao, J.M.; Wang, L.T. Improving Urban Air Quality in China: Beijing Case Study. J. Air Waste. Manag. Assoc. 2005, 55, 1298–1305. [Google Scholar] [CrossRef] [PubMed]
- Smith, W.H. Air pollution—Effects on the structure and function of the temperate forest ecosystem. Environ. Pollut. 1970, 6, 111–129. [Google Scholar] [CrossRef]
- Kaoma, H.; Shackleton, C.M. Homestead greening is widespread amongst the urban poor in three medium-sized South African towns. Urban Ecosyst. 2014, 17, 1191–1207. [Google Scholar] [CrossRef]
- Grogan, J.; Schulze, M. The Impact of Annual and Seasonal Rainfall Patterns on Growth and Phenology of Emergent Tree Species in Southeastern Amazonia, Brazil. Biotropica 2012, 44, 331–340. [Google Scholar] [CrossRef]
- Liu, W.P.; Jirko, H.; Yu, Z.R. Thresholds of landscape change: a new tool to manage green infrastructure and social-economic development. Landsc. Ecol. 2014, 29, 729–743. [Google Scholar] [CrossRef]
- Tian, W.J.; Bai, J.; Sun, H.M.; Zhao, Y.G. Application of the analytic hierarchy process to a sustainability assessment of coastal beach exploitation: A case study of the wind power projects on the coastal beaches of Yancheng, China. J. Environ. Manag. 2013, 115, 251–256. [Google Scholar] [CrossRef] [PubMed]
- Stouffer, P.C.; Bierregaard, R.O., Jr. Business Dynamics: Use of Amazonian forest fragments by understory insectivorous birds. Ecology 1995, 76, 2429–2445. [Google Scholar] [CrossRef]
- Towards greening the U.S. residential building stock: A system dynamics approach. Build. Environ. 2014, 78, 68–80.
- Zhang, Z.; Lu, W.X.; Zhao, Y.; Song, W.B. Development tendency analysis and evaluation of the water ecological carrying capacity in the Siping area of Jilin Province in China based on system dynamics and analytic hierarchy process. Ecol. Model. 2014, 275, 9–21. [Google Scholar] [CrossRef]
- Xia, Q.F. The Beijing Statistical Yearbook (2014); Beijing Municipal Bureau of Statistics: Beijing, China, 2014.
- Beijing Municipal Bureau of Statistics. The Beijing Statistical Yearbook of 2015. Available online: http://www.bjstats.gov.cn/nj/main/2015-tjnj/indexch.htm (accessed on 1 June 2016).
- Perez, S.G.; Carpena, R.M.; Kiker, G.; Holt, R.D. Evaluating ecological resilience with global sensitivity and uncertainty analysis. Ecol. Model. 2013, 263, 174–186. [Google Scholar] [CrossRef]
- “13th Five-Year” Landscape and Greening Plan of Beijing. Available online: http://news.xinhuanet.com/local/2016-01/06/c_128600299.htm (accessed on 6 January 2016).
- Development Proposal of Beijing Municipal Party Committee on the “13th Five-Year” National Economy and Social Development Plan of Beijing. Available online: http://bj.people.com.cn/n/2015/1208/c82837-27272223.html (accessed on 8 December 2015).
- Beijing People’s Congress Government Work Report in 2016. Available online: http://www.chinanews.com/gn/2016/02-03/7746204.shtml (accessed on 3 February 2016).
- Prambudia, Y.; Nakano, M. Integrated simulation model for energy security evaluation. Energies 2012, 5, 5086–5110. [Google Scholar] [CrossRef]
- Bai, W.Q.; Zhao, S.D. A comprehensive description of the models of land use and land cover change study. J. Nat. Resour. 1997, 12, 169–175. [Google Scholar]
- Zhang, W.Z.; Yang, J.; Ma, L.Y.; Huang, C.H. Factors affecting the use of urban green spaces for physical activities: Views of young urban residents in Beijing. Urban For. Urban Green. 2015, 14, 851–857. [Google Scholar] [CrossRef]


| First Level Indicator | Second Level Indicators | Index Name (Unit) | Explanation | Formula | Direction | Weight |
|---|---|---|---|---|---|---|
| The SDGS assessment in Beijing (A1) | Urban green space (B1) | C1 Urban green coverage rate (%) | Urban green coverage rate is an important index in the evaluation of urban landscaping and ecological environment [32]. | Vertical projection area of planting/construction land area × 100% | + | 0.0851 |
| C2 Urban green space ratio (%) | Urban green space ratio is a crucial evaluation standard for urban landscape planning [32]. | Green space area/construction land area × 100% | + | 0.0657 | ||
| C3 Public green area per capita (/Ha) | Per capita public green area is a crucial index in the evaluation for the harmony of urban development and landscape construction [32]. | Total population/public green space area | + | 0.0896 | ||
| C4 Investment of green space construction (ten thousands yuan) | The investment in Green space has a positive effect on the development of green spaces. | Obtained directly | + | 0.1187 | ||
| C5 Occupied area of green space (/Ha) | The decreasing areas of green spaces lead to a negatively impact on the services of ecosystems [33]. | Interpret Thematic Mapper satellite images | − | 0.0816 | ||
| Social economy (B2) | C6 Population density (/Ha) | The growing proportion of human populations living in urban areas could affect the availability of urban green spaces [34], which may become a more important negative predictor of extent of green space and tree-cover. | Population at the end of each area/land survey area | − | 0.0667 | |
| C7 GDP per unit area (ten thousands yuan/Ha) | Per capita GDP has the significant relationships with green space coverage [35]. | GDP/land survey area | − | 0.0396 | ||
| C8 Industrial structure index (%) | Industrial structure is an important factor affecting landscape diversity and landscape patterns [36]. | (secondary industry GDP/GDP) × 100% | − | 0.0408 | ||
| C9 Carbon dioxide emissions index (t/Ha) | Carbon dioxide emissions, the main component of the greenhouse gas, attribute to green space maintenance directly [37]. | Fossil fuel consumption × carbon dioxide emission coefficient/land survey area | − | 0.1298 | ||
| Environment (B3) | C10 Annual average daily particulate matter (mg/m3) | Particulate matter was the major pollutant affecting the urban air quality [38], thus making many cities suffer from various environmental problems. | Obtained directly | − | 0.0732 | |
| C11 Days of air quality above grade II rate (%) | Days of air quality above grade II rate represent the quality of the air, which will lead the trees morbidity, reduce trees growth and make impact on ecosystem [39]. | Obtained directly | + | 0.0640 | ||
| C12 Annual rainfall (hundred mm) | The annual rainfall influenced trees density [40] and their growth speed directly [41], which is an important factor influencing the planting. | Obtained directly | + | 0.0597 | ||
| C13 Environmental protection investment index (%) | An increasing investment in environmental protection is one of the most important ways to enhance ecosystem services (e.g., the ecosystem services of green space) [42]. | Obtained directly | + | 0.0852 |
| Name of Variables | Expression | Unit |
|---|---|---|
| Annual average daily particulate matter | = (−0.001) × CLA − (−0.006) × YGCA − 0.125 × IEPC + (−0.011) × TES + 0.834 | mg/m³ |
| Annual rainfall | = (−65.098) × ADPM + (−0.377) × YGCA + 15.545 | 100 mm |
| Days of air quality above grade II | = (–83.988) × CDM − (−11.56) × ADPM + 3.316 | 100 days |
| Production green space area | = 0.018 × PIO + 0.023 × YGCA − 0.035 | 100 km2 |
| Construction land area | = (–6.77) × (TP × GDPC – TIO − SIO) + 0.177 × TIO + (–0.275) × SIO + 0.944 | 1000 km2 |
| Carbon dioxide emissions | = (−0.00008358) × YGCA + 0.001 × TES + (−0.001) × IEPC + 0.004 | million ton/km2 |
| Social attention | = 0.186 × DAQ + 0.042 × YGCA − 0.304 | - |
| Net population per year | = 0.025 × DAQ + (−0.002) × GDPC + 0.014 | Ten million people |
| Second industry output | = 0.2 × (TP × GDPC) + 0.488 | One hundred billion yuan |
| Total energy consumption | = 0.149 × TP + 1.017 × GDPC + (−0.301) × TIO + 0.047 × SIO + 1.985 | Ten million tons |
| Primary industry output | = GDP – TIO − SIO | One hundred billion yuan |
| Third industry output | = 0.8 × (TP × GDPC) − 0.588 | One hundred billion yuan |
| Investment of environmental protection | = 0.009 × SIO + 0.02 | One hundred billion yuan |
| Net green coverage area per year | = PG + (YGCA/TUGA) × PG | 100 km2 |
| Year-end green coverage area | = INTEG (NGSA − NGCA,2.679) | 100 km2 |
| Total urban green area | = PGSA + OAGS + PGS + AGSA | 100 km2 |
| Attached green space area | = 1.8192 × CLA | 100 km2 |
| Occupied area of green space | = (–0.9957) × CLA + 1.6684 | 100 km2 |
| Public green space area | = (–0.849) × SA + 0.1 × GCI + 0.782 | 100 km2 |
| Protected green space area | = 0.691 × GCI | 100 km2 |
| Greening completed investment | = 26.456 × SA + 0.157 × GDP + (–3.215) × IEPC + 0.953 | One hundred million yuan |
| Industrial pollution control investment | = (–0.055) × SIO + 1.102 | One hundred million yuan |
| Scenario | Design Basis | Detailed Procedure |
|---|---|---|
| Scenario 1 | The SDGS-as-usual (SAU) | Maintain the current situation as a base reference scenario |
| Scenario 2 | The Urban Green space Work Plan (UGWP) | Increase the urban green space area, public green space area and attached green space area by 432 ha, 208 ha and 261 ha annually from 2016. |
| Scenario 3 | Beijing “13th Five-Year” Landscape and Greening Plan (LGP) | Increase the urban green coverage rate and public green area per capita to 48.5% and 16.5 m2 per capita by 2020; Increase the urban green space area by 450 ha annually from 2016 to 2020. |
| Scenario 4 | Beijing “13th Five-Year” National Economy and Social Development Plan (NESP) | Limit the total population to 23 million by 2020; Set the net GDP growth rate and the net tertiary industry output growth rate to 6.5% and 5.5% annually from 2016. |
| Scenario 5 | The Work Report of the Beijing Municipal People’s Government (WRBG) | Set the net GDP growth rate to 6.5% annually from 2016; Decrease the total energy consumption, carbon dioxide emissions and annual average daily particulate matter by 3.5%, 4% and 5% annually from 2016; Increase the urban green space area by 400 ha annually from 2016. |
© 2016 by the authors; licensee MDPI, Basel, Switzerland. This article is an open access article distributed under the terms and conditions of the Creative Commons Attribution (CC-BY) license (http://creativecommons.org/licenses/by/4.0/).
Share and Cite
Li, F.; Sun, Y.; Li, X.; Hao, X.; Li, W.; Qian, Y.; Liu, H.; Sun, H. Research on the Sustainable Development of Green-Space in Beijing Using the Dynamic Systems Model. Sustainability 2016, 8, 965. https://doi.org/10.3390/su8100965
Li F, Sun Y, Li X, Hao X, Li W, Qian Y, Liu H, Sun H. Research on the Sustainable Development of Green-Space in Beijing Using the Dynamic Systems Model. Sustainability. 2016; 8(10):965. https://doi.org/10.3390/su8100965
Chicago/Turabian StyleLi, Fangzheng, Yinan Sun, Xiong Li, Xinhua Hao, Wanyi Li, Yun Qian, Haimeng Liu, and Haiyan Sun. 2016. "Research on the Sustainable Development of Green-Space in Beijing Using the Dynamic Systems Model" Sustainability 8, no. 10: 965. https://doi.org/10.3390/su8100965