Article

Thermoeconomic Analysis and Optimization of a New Combined Supercritical Carbon Dioxide Recompression Brayton/Kalina Cycle

by
S. Mohammad S. Mahmoudi
1,*,
Ata D. Akbari
1 and
Marc A. Rosen
2
1
Faculty of Mechanical Engineering, University of Tabriz, Tabriz 51666-16471, Iran
2
Faculty of Engineering and Applied Science, University of Ontario Institute of Technology, Oshawa, ON L1H 7K4, Canada
*
Author to whom correspondence should be addressed.
Sustainability 2016, 8(10), 1079; https://doi.org/10.3390/su8101079
Submission received: 4 September 2016 / Revised: 13 October 2016 / Accepted: 17 October 2016 / Published: 24 October 2016
(This article belongs to the Section Energy Sustainability)

Abstract

:
A new combined supercritical CO2 recompression Brayton/Kalina cycle (SCRB/KC) is proposed. In the proposed system, waste heat from a supercritical CO2 recompression Brayton cycle (SCRBC) is recovered by a Kalina cycle (KC) to generate additional electrical power. The performances of the two cycles are simulated and compared using mass, energy and exergy balances of the overall systems and their components. Using the SPECO (Specific Exergy Costing) approach and employing selected cost balance equations for the components of each system, the total product unit costs of the cycles are obtained. Parametric studies are performed to investigate the effects on the SCRB/KC and SCRBC thermodynamic and thermoeconomic performances of key decision parameters. In addition, considering the exergy efficiency and total product unit cost as criteria, optimization is performed for the SCRBC and SCRB/KC using Engineering Equation Solver software. The results indicate that the maximum exergy efficiency of the SCRB/KC is higher than that of the SCRBC by up to 10%, and that the minimum total product unit cost of the SCRB/KC is lower than that of the SCRBC by up to 4.9%.

1. Introduction

Global warming, environmental pollution and growing demand for energy have increased attention on the efficient use of energy resources. In this regard, waste heat recovery from industry can play an important role as it enhances thermodynamic efficiency of energy conversion systems [1]. However, the thermodynamic efficiency of an energy conversion system affects the product unit cost, which is a key parameter in assessing the system performance economically. The product unit cost can be determined by thermoeconomics, which combines the principles of thermodynamics and economics. This parameter is a major criterion in evaluating the economic effectiveness of waste heat utilization.
Among the configurations proposed for some plants, such as future nuclear power plants and concentrated solar power (CSP) plants and refrigeration systems, the supercritical CO2 (S-CO2) cycle is considered promising as it is simple, compact, secure and economic [2]. The cycle working fluid, carbon dioxide, is a non-toxic and non-combustible material [3]. Another advantage of CO2 is the sudden change of its thermophysical properties at its near critical point. This characteristic brings about a lower value of compression work so that the efficiency of the S-CO2 cycle is high [2]. The cycle was first proposed by Feher and Angelino in 1968 [4,5]. Dostal in 2004 compared the performances of a S-CO2 Brayton cycle and a Rankine cycle of similar generation capacity and reported a significantly reduced size of turbomachinery and higher efficiencies for the S-CO2 cycle [6]. Having used a low-grade heat source, Cayer et al. performed a detailed analysis for a carbon dioxide transcritical power cycle [7]. They reported the work in four steps: energy analysis, exergy analysis, finite size thermodynamics and heat exchanger surface calculation. They concluded that there exists an optimum high pressure for each of the mentioned steps. Angelino and Invernizzi used low-temperature liquefied natural gas (LNG) as a heat sink in proposing new configurations for the CO2 power cycle in order to improve the system performance [8]. Sarkar performed an exergy analysis for the SCRBC and optimized its performance [9]. He reported that the irreversibilities in heat exchangers are higher than those in turbo-machinery and that the high temperature regenerator (HTR) is more effective than the low temperature regenerator (LTR) at raising the cycle efficiency. In another paper, Sarkar and Bhattacharyya examined the effect of reheating on SCRBC performance and studied the optimized condition of the cycle when the operating parameters and component performance are changed [10]. Wang et al. assessed the effects on the optimized condition of the S-CO2 cycle of varying thermodynamic parameters. They used a genetic algorithm and an artificial neural network for the optimization [11]. Yari and Sirusazar combined the SCRBC with a transcritical CO2 cycle for performance enhancement [12]. Jeong et al. optimized the performance of a S-CO2-based binary gas mixture Brayton cycle with a sodium-cooled fast reactor. They selected a mixture of CO2 and some other gases as the working fluid so that the critical point of the working fluid is shifted [13]. Yoon et al. concluded that cycle simplicity, high efficiency and compact turbomachinery and heat exchangers are significant advantages for the S-CO2 cycle [14]. They stated that the S-CO2 cycle is appropriate for small and medium size water-cooled nuclear reactors. Thermodynamic analyses were performed by Kim et al. for a transcritical CO2 cycle utilizing both low and high temperature heat sources [15]. Floyd et al. described the off-design response of a SCRBC coupled with a sodium fast reactor as the heat sink temperature changes [16]. Singh et al. proposed an extremum-seeking controller to enhance the performance of a direct heated S-CO2 closed loop Brayton cycle for a fluctuating solar input energy and ambient temperature [17]. Moullec showed that an efficiency of 50% can be achieved for a coal power plant with a S-CO2 Brayton cycle when the maximum cycle temperature and pressure are 893 K and 300 bar, respectively [18]. Nithyanandam and Pitchumani investigated the thermodynamic and economic performances of a concentrating solar power (CSP) power-tower system utilizing Rankine and S-CO2 cycles integrated with encapsulated phase change material for thermal energy storage or thermal energy storage with embedded heat pipes [19].
Dai et al. compared the performance of a transcritical Rankine cycle for various working fluids, including zeotropic mixtures of CO2 and traditional working fluids, and pure CO2 [20]. They reported that, when zeotropic mixtures are used, the pressure level in the cycle is reduced and the thermal efficiency is improved. Akbari and Mahmoudi optimized the thermodynamic and thermoeconomic performance of a combined cycle consisting of a SCRBC and an Organic Rankine cycle (ORC) [2]. Using the turbine bleed gas for regenerative heating, Mondal and De showed that a transcritical CO2 power cycle results in higher 1st and 2nd law efficiencies [21]. Hu et al. compared the performance of a supercritical gas Brayton cycle for several types of working fluids such as CO2-based binary mixtures and pure carbon dioxide. They found higher efficiencies for both CO2-He and CO2-Kr mixtures [22]. Energy and exergy analyses were carried out for four different S-CO2 Brayton cycle configurations integrated with solar central receivers by Padilla et al. [23]. They reported that the recompression cycle with primary compression intercooling attained the highest thermal efficiency. Gholamian et al. proposed and analyzed a new cogeneration system combining a biomass fuelled gas turbine and a S-CO2 cycle coupled with a domestic water heater. They showed that the exergy efficiency and CO2 emissions are higher for the cogeneration system, compared to the stand alone gas turbine and power generation systems [24].
The above survey shows that recovering waste heat from a SCRBC system by a bottoming cycle, such as an ORC, improves the energy conversion efficiency of the system. In addition, Kalina cycles can compete with the ORC in utilizing low temperature heat sources to produce electricity. They perform better than the ORC in some respects, e.g., its boiling/condensing process occurs at a variable temperature so that the exergy destruction in the evaporator and condenser is reduced [25]. To our knowledge, the Kalina cycle (KC) has not been used to recover the waste heat from the SCRBC for producing additional electricity and no information in this regard has been reported. The present work fulfills this lack of information by proposing and analyzing a new combined supercritical CO2 recompression Brayton/Kalina cycle (SCRB/KC) in which waste heat from the pre-cooler of the SCRBC is utilized to drive a KC. The investigation is performed from the viewpoints of both thermodynamics and thermoeconomics. Through a parametric study, the influence of some important decision parameters on the second law efficiency and the product unit cost of the SCRBC and SCRB/KC are studied. Finally, the thermodynamic and thermoeconomic performances of the SCRBC and the SCRB/KC are optimized. The objective is to improve understanding of the new system and we expect that the obtained results will be useful in designing a more efficient heat recovery system for nuclear power plants.

2. System Description and Assumptions

Figure 1 shows a schematic diagram of the proposed cycle in which the SCRBC is combined with the KC so that heat discarded from pre-cooler1 and the superheater of the SCRBC is used to drive the KC. The reactor exit stream enters turbine1 where it expands, producing power. The expanded stream then rejects heat in the HTR and LTR before being split into two parts. One part flows to compressor2 and the other to the superheater and pre-cooler1, where it rejects heat to drive the KC. The CO2 exiting pre-cooler1 rejects additional heat in pre-cooler2 before being compressed in compressor1. The compressed CO2 leaving compressor1 is heated in the LTR before mixing with the CO2 stream exiting compressor2. The mixture (stream 10) flows to the HTR where it is heated before entering the reactor.
In the KC, the saturated ammonia–water liquid exits the condenser and is pumped to the Kalina cycle low temperature recuperator (KCLTR) and the Kalina cycle high temperature recuperator (KCHTR) where heat recovery takes place. The stream exiting the KCLTR flows to pre-cooler1, where it is heated by the CO2 before passing to the separator. In the separator the working fluid is separated into a rich ammonia–water mixture saturated vapor (stream 12) and a poor ammonia–water mixture saturated liquid (stream 13). The saturated vapor is then superheated in the superheater by the CO2 before entering turbine2. The saturated ammonia–water liquid mixture flows to the KCHTR where it is cooled before passing to the expansion valve. The stream exiting the expansion valve flows to the mixer and mixes with the stream exiting turbine2. The mixture then passes to the KCLTR, where it rejects heat, before flowing to the condenser, completing the Kalina cycle.
The following assumptions are used:
  • The system operation is at steady state.
  • Pressure drops in all components and connecting lines, except turbines, compressors and the pump, are negligible [2].
  • The turbines, the pump and the compressors are taken to have specific isentropic efficiencies.
  • No changes occur in kinetic and potential energies.
  • The cooling water entering the pre-cooler and the condenser is at environmental conditions.
  • The LTR and HTR have specific effectiveness values.
  • The state of the ammonia–water solution is saturated at both the condenser and separator exits.

3. Thermodynamic Analysis

Considering each system component as a control volume, the principles of conservation of mass and conservation of energy as well as exergy balances are applied. The solution to the obtained equations and the equations associated with thermodynamic properties simulate the cycle performance. Thermoeconomic analyses are carried out using the exergy values obtained from the simulation. Neglecting electrical, magnetic, nuclear and surface tension effects and the changes in kinetic and potential exergies, the total exergy rate of a stream is the sum of its physical and chemical exergy rates [26]:
E ˙ = E ˙ p h + E ˙ c h
The physical exergy rate is given by:
E ˙ p h = m ˙ [ ( h h 0 ) T 0 ( s s 0 ) ]
To calculate the chemical exergy rate of an ammonia–water mixture, the following expression in terms of standard chemical exergies of ammonia and water ( e c h , N H 3 0 and e c h , H 2 O 0 ) is used [27]:
E ˙ c h = m ˙ [ ( X M NH 3 ) e c h , NH 3 0 + ( X M H 2 O ) e c h , H 2 O 0 + R ¯ T 0 X i ln X i ]
The third term in Equation (3) is neglected in the analysis. For the CO2, however, the chemical exergy does not change from one point to another and, therefore, it is not taken into account.
The effectivenesses for heat exchangers in the SCRBC are as follows:
ϵ H T R = T 3 T 4 T 3 T 10
ϵ L T R = T 4 T 5 T 4 T 9
The 1st law efficiency for the SCRBC/KC is expressed as
η t h = W ˙ net , CO 2 + W ˙ net , KC Q ˙ R
In Equation (6), W ˙ net , CO 2 and W ˙ net , KC denote the net generated power in the SCRBC and KC, respectively, and Q ˙ R denotes the heat transferred to the reactor.
The exergy efficiency for the proposed cycle is expressed as:
η e x = W ˙ net , CO 2 + W ˙ net , KC E ˙ R
where the denominator E ˙ R is the exergy input to the reactor:
E ˙ R = Q ˙ R ( 1 T 0 T R )
Data from the literature are used to verify the models developed for the SCRBC [2] and the KC [28]. For the case of the SCRBC, a validation has been previously reported by the authors [2]. For the KC case, a validation is shown in Table 1, which compares the results obtained from the present work and those reported in the literature for the KC [28]. Good agreement between the two is observed in Table 1.

4. Thermoeconomic Analysis

The concepts of thermodynamics and economics are combined in thermoeconomics. It provides information about the cost effectiveness of energy conversion systems based on the results obtained from exergy analysis. One of the main objectives in thermoeconomics is the determination of the unit product cost, the value of which must be minimized. In order to calculate this parameter, the cost balance equation is applied to each system component. The cost rate balance equation for a system component receiving thermal energy and producing electricity is expressed as [26]:
C ˙ o u t , k + C ˙ w , k = C ˙ i n , k + C ˙ q , k + Z k ˙
where
C ˙ = c E ˙
and c is the specific exergy stream cost. Equation (9) balances the cost rates associated with the exergy streams entering and exiting the component and the investment cost rate related to the component. The investment cost rate, Z k ˙ , for the kth component is the sum of the total capital investment rate, Z ˙ k C I , and the operation and maintenance cost rate, Z ˙ k O M :
Z k ˙ = Z ˙ k C I + Z ˙ k O M
For the kth component, the annual levelized capital investment rate is obtained as follows [26]:
Z ˙ k C I = ( C R F τ ) Z k
where CRF and τ denote the capital recovery factor and the annual plant operation hours, respectively. The CRF is expressed as follows [26]:
C R F = i r ( 1 + i r ) n ( 1 + i r ) n 1
where i r is the interest rate and n is the economic life of the system in years. Appendix A provides the cost functions for each system component.
The annual levelized operating and maintenance cost rate for component k can be expressed as [26]:
Z ˙ k O M = γ k Z ˙ k + ω k E ˙ p , k + R ˙ k
where γ k and ω k are the coefficients for the fixed and variable operating and maintance cost rates related to the kth component, respectively, and R ˙ k accounts all the other operating and maintenance cost rates which do not depend on the investment cost and product exergy. The two last terms in Equation (14) are neglected in the present work because of their much lower values than the first term [29].
Interest rate, annual plant operation hours, coefficient for the operating and maintenance cost γ k and number of years of economic life time values are given in Table 2.
The Specific Exergy Costing (SPECO) method is used in this work [30]. There are three main steps in this method: (1) identifying exergy streams; (2) defining the fuel and product for each system component; and (3) applying cost-balance equations [30].
The fuel represents the input exergy to generate the product and is not necessarily an actual fuel. The fuel for a component can be the product of the previous component. In Table 3, the fuel and product exergy definitions are given for each system component in the SCRB/KC. In the KC, there is no product for the throttling valve. This component, however, serves the mixer. Therefore, the throttling valve and mixer are treated as a single unit [29] for which the product is defined as indicated in Table 3.
The cost balances along with the auxiliary costing equations for each system component are listed in Table 4. The solution to these equations gives the costs associated with each material and energy stream in the proposed system, i.e., { C ˙ 1 , C ˙ 2 , C ˙ 30 } . The unit costs of all exergy streams can be calculated using Equation (10).
The total product unit cost, which is the main criteria in optimizing the economic performance of the system, is calculated as follows [2]:
c p , tot = i = 1 n k Z ˙ k + C ˙ f u e l i = 1 n p E ˙ p i
For each component of the SCRBC and the SCRB/KC, important thermoeconomic variables are calculated, such as exergy destruction rate E ˙ D ; exergy destruction cost rate C ˙ D ; investment cost rate Z ˙ ; relative cost difference r; and exergoeconomic factor f. The exergy destruction cost rate for the kth component is defined as [26]:
C ˙ D , k = c F , k E ˙ D , k
where c F , k is the average unit cost of the fuel provided to the component. The definitions for f and r for the kth component are as follows [26]:
f k = Z ˙ K Z ˙ K + c F , k ( E ˙ D , K + E ˙ L , K )
r k = c P , k c F , k c F , k
where E ˙ L , K and c P , k are the exergy loss rate and product unit cost for the kth component, respectively. Taking the input exergy for the reactor core as the input exergy from nuclear fission ( E ˙ c o r e ), the exergy balance for the reactor core is expressed as follows [29]:
E ˙ 1 + E ˙ c o r e = E ˙ 2 + E ˙ D , R
According to the thermoeconomic evaluation guidelines presented by Bejan et al. [26], in designing a new system, the first design changes initially must be applied to the component for which the sum of C ˙ D + Z ˙ + C ˙ L is the highest.

5. Results and Discussion

The input data utilized for the simulation are shown in Table 5.
Appropriate values for selected decision variables, thermodynamic properties, and mass, exergy and cost flow rates for the SCRB/KC are shown in Table 6 for a typical operating condition (a workable design). The figures in this table can be helpful in comparing the optimum and base case operating parameters.

5.1. Parametric Study

Parametric studies are performed to reveal the effects on thermodynamic and thermoeconomic performances of the SCRB/KC of modifying various decision variables: compressor pressure ratio (PRC), pump pressure ratio (PRp), minimum temperature difference in the superheater ( Δ T s u p ), ammonia concentration in the ammonia–water mixture leaving the condenser (X20), pinch point temperature difference in pre-cooler1 ( Δ T Pinch ), and temperature of ammonia–water solution exiting pre-cooler1 (T11). For the SCRBC, the only decision parameter is taken to be the compressor pressure ratio (PRC).
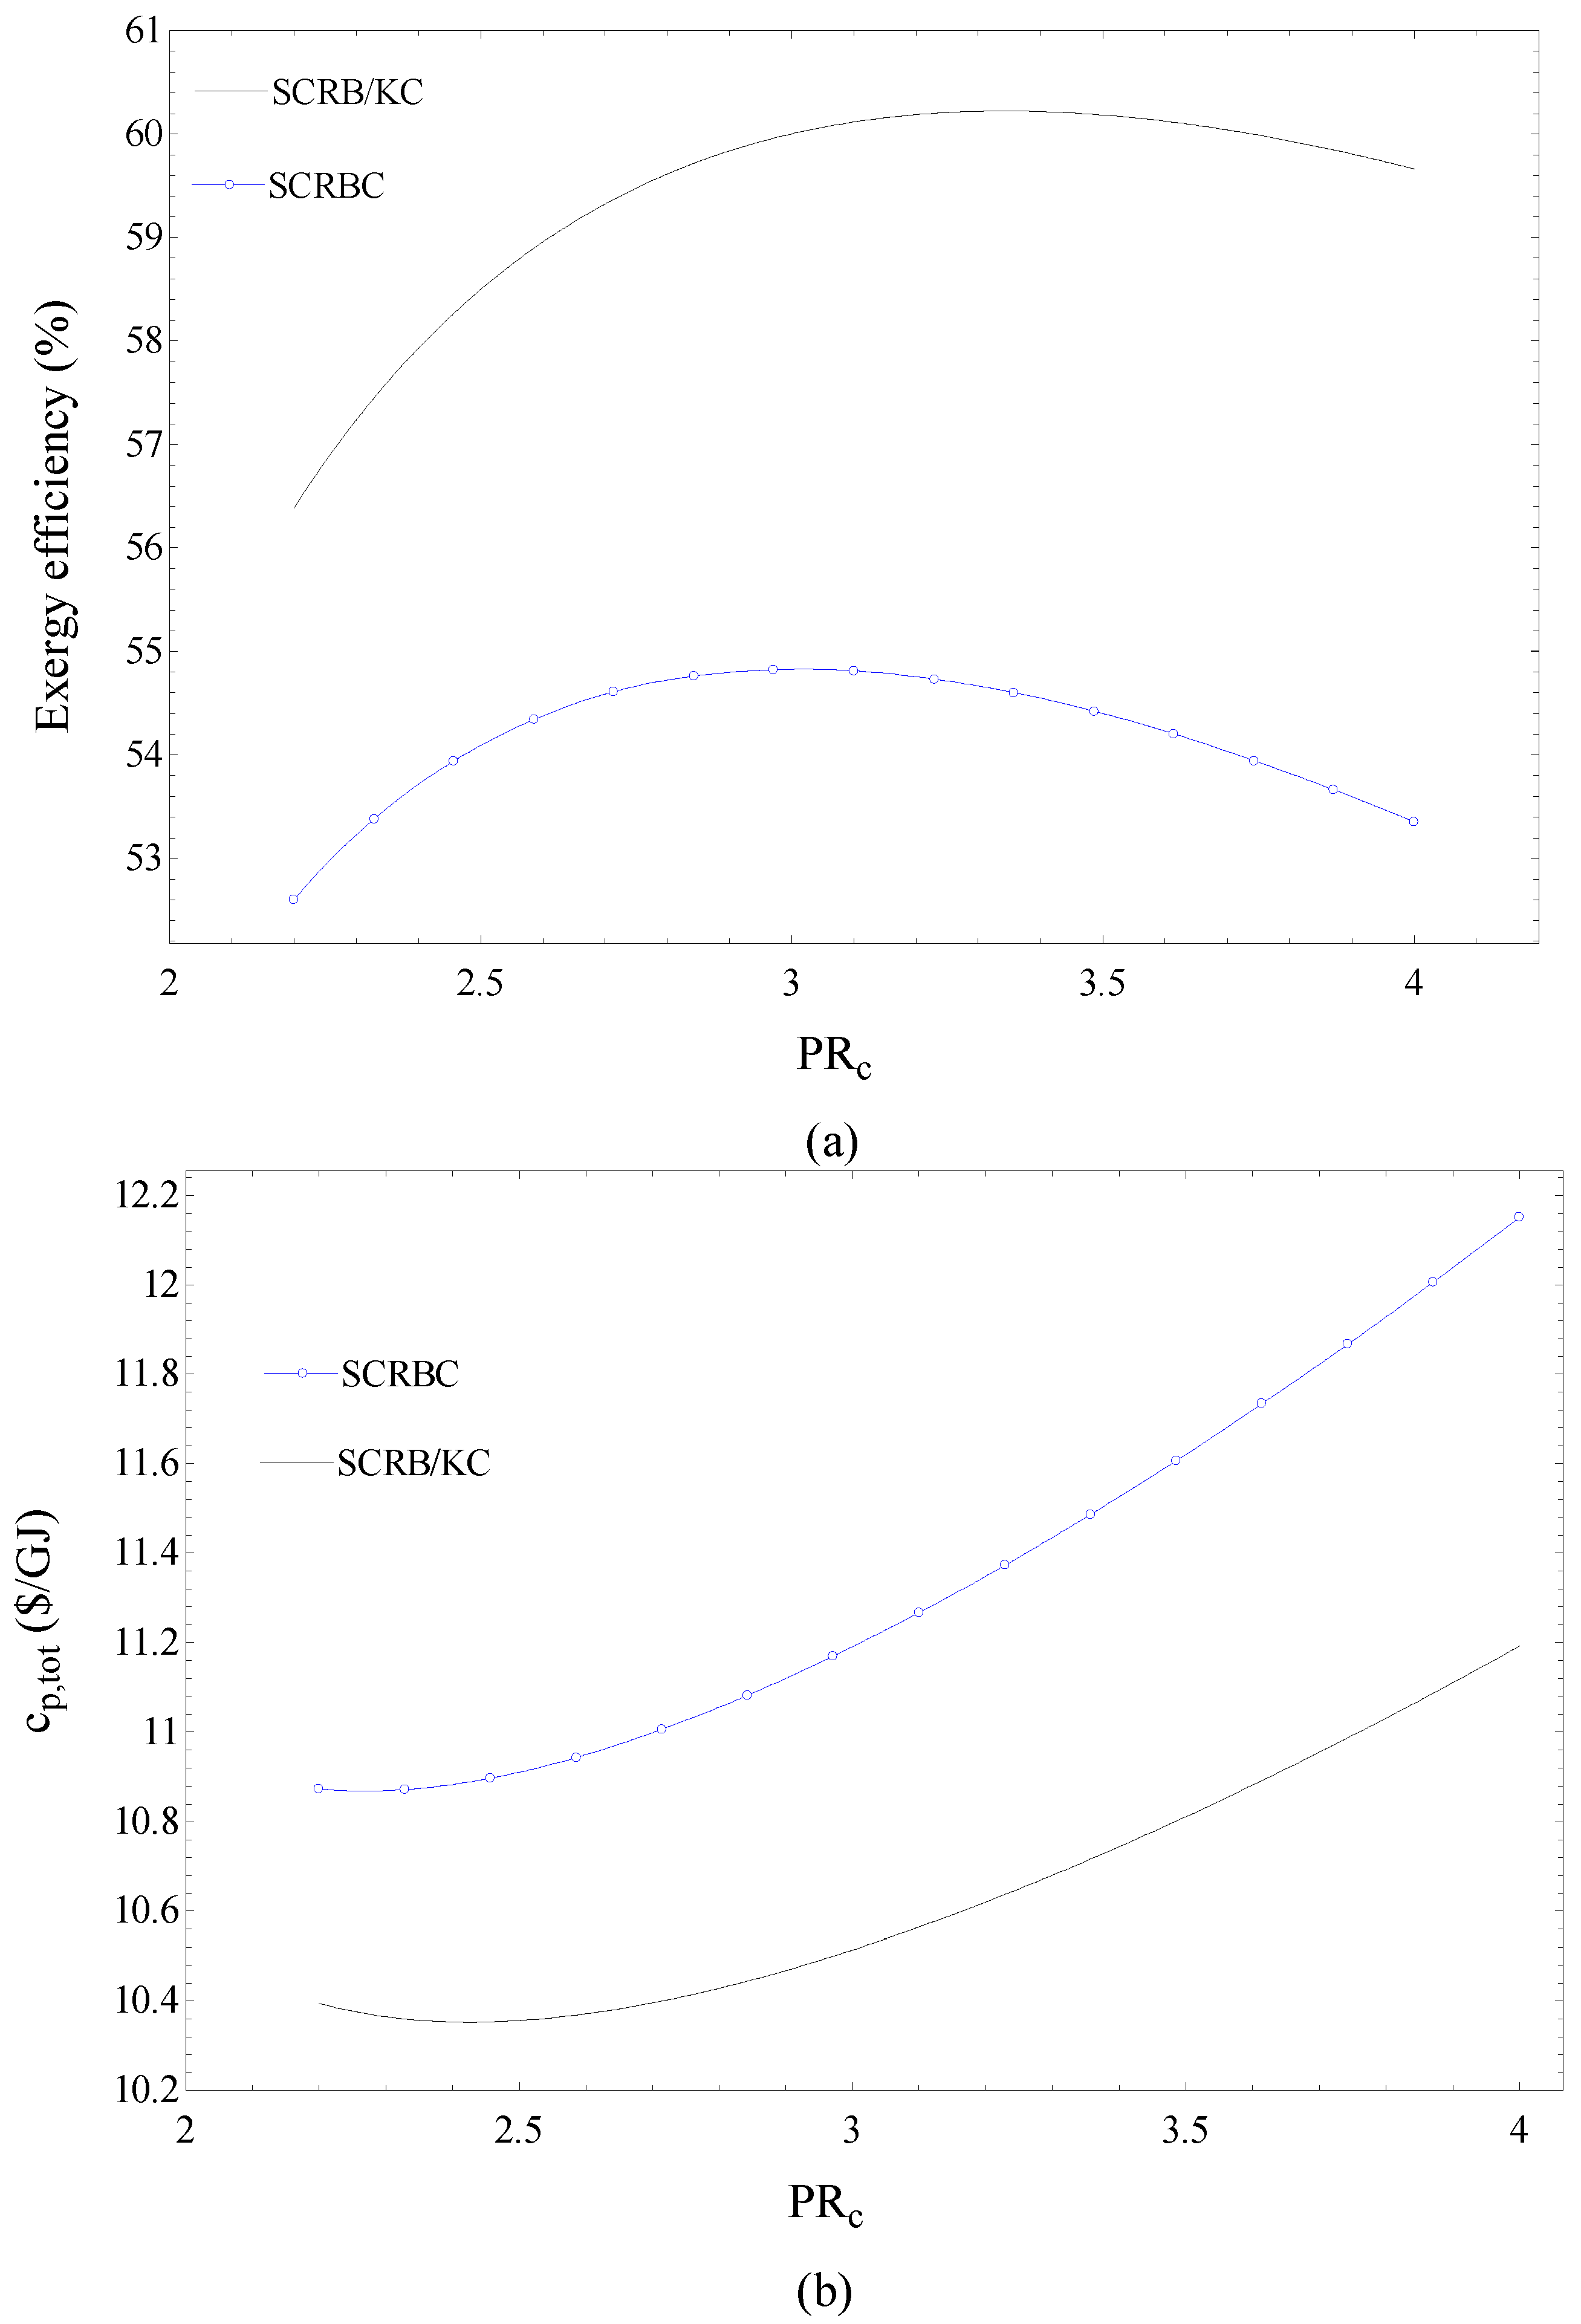
Figure 2a,b shows the effects of the compressor pressure ratio (PRC) on the exergy efficiency ( η e x , t o t ) and total product unit cost (cp,tot) of the SCRBC and the SCRB/KC.
Figure 2a indicates that optimum values exist for PRC at which the exergy efficiency of the SCRBC or SCRB/KC is maximized. This is justified if we consider that, as the PRC increases, the net specific work output for the SCRBC increases and the CO2 mass flow rate decreases, due to the increase in the specific enthalpy difference across the reactor [2]. The increase in net specific work and the decrease in CO2 mass flow rate lead to the maximization of the net produced power for the SCRBC as PRC increases. As the exergy input to the cycle is constant the variation of exergy efficiency with PRC is justified for the SCRBC. A similar discussion can be made for the SCRB/KC noting that the net specific work of the Kalina cycle increases steadily with increasing PRC. It is clear in Figure 2a that at higher PRC values the exergy efficiency of the SCRB/KC is flatter than that of the SCRBC. This can be explained if we consider that as the PRC increases the temperature at the inlets of the superheater and pre-cooler1 increase resulting in an increase in the KC exergy input and consequently a higher KC output power. In addition, the increase in the KC power output, because of an increase in PRC, leads to a higher optimum PRC for the SCRB/KC compared to the corresponding value for the SCRBC, as shown in Figure 2a.
It is observed in Figure 2b that the total product unit cost is minimized at specific values of PRC for both the SCRBC and the SCRB/KC. This is expected based on Equation (15). However, for both cycles, the optimum PRC value at which cp,tot is minimized is less than the corresponding value at which the exergy efficiency is maximized. This can be explained considering the decrease of associated costs with decreasing PRC. It is seen in Figure 2 that the differences in optimum values of PRC for the SCRBC and the SCRB/KC, for maximum exergy efficiency, are higher than the corresponding values for minimum cp,tot.
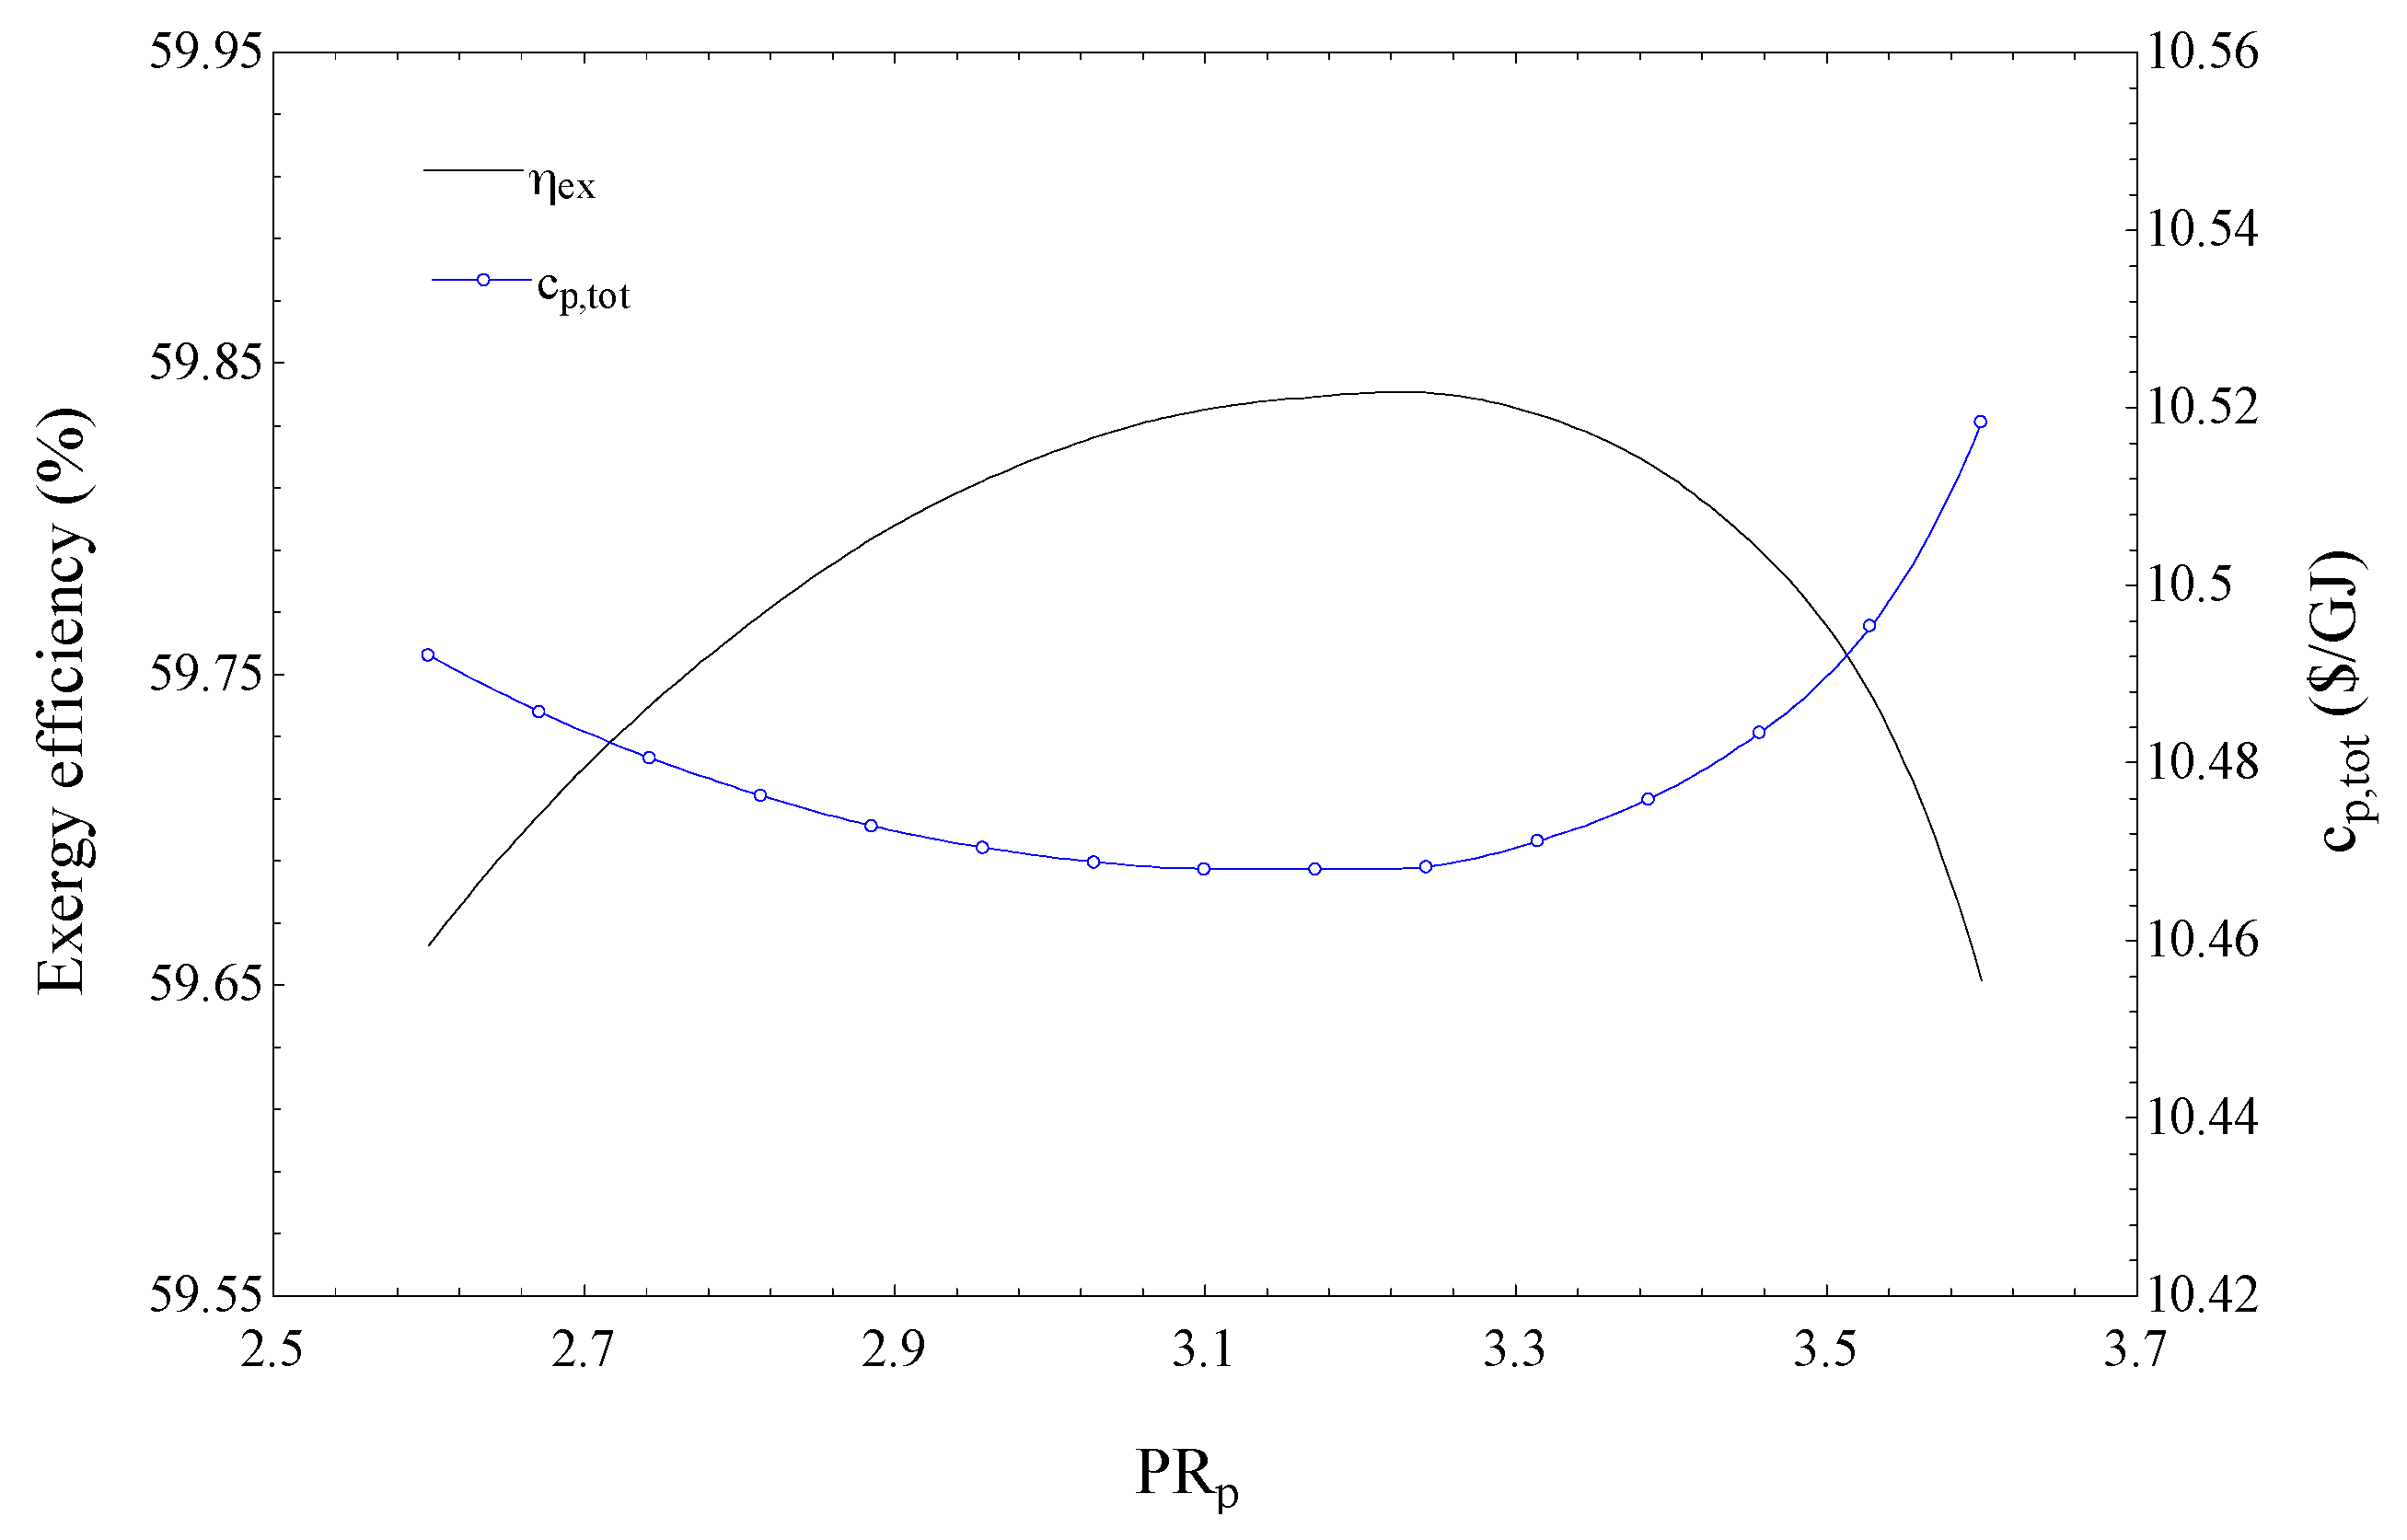
The variation of the exergy efficiency ( η e x , t o t ) and total product unit cost (cp,tot) with the pump pressure ratio (PRP) is shown in Figure 3, for the SCRB/KC. Although the range of variation for the two parameters is small, the trend is interesting. The value of PRP at which the exergy efficiency is maximized is seen in Figure 3 to be the same as that at which the total product unit cost is minimized. This point indicates that, at a given value of PRP, the changes in cp,tot are related only to the net produced power for the KC.
The maximization of the SCRB/KC exergy efficiency, as PRb changes, is actually related to the KC performance. This can be explained by noting that an increase in the PRP causes a decrease in the pre-cooler1 outlet vapor mass fraction (q11). This decrease reduces the turbine2 inlet mass flow rate. On the other hand, the increase in PRP brings about a higher specific work for the KC so that the product of the specific work and the mass flow rate is maximized at a specific value of PRP. This maximization leads to the maximization for exergy efficiency and the minimization for the total product unit cost for the SCRB/KC.
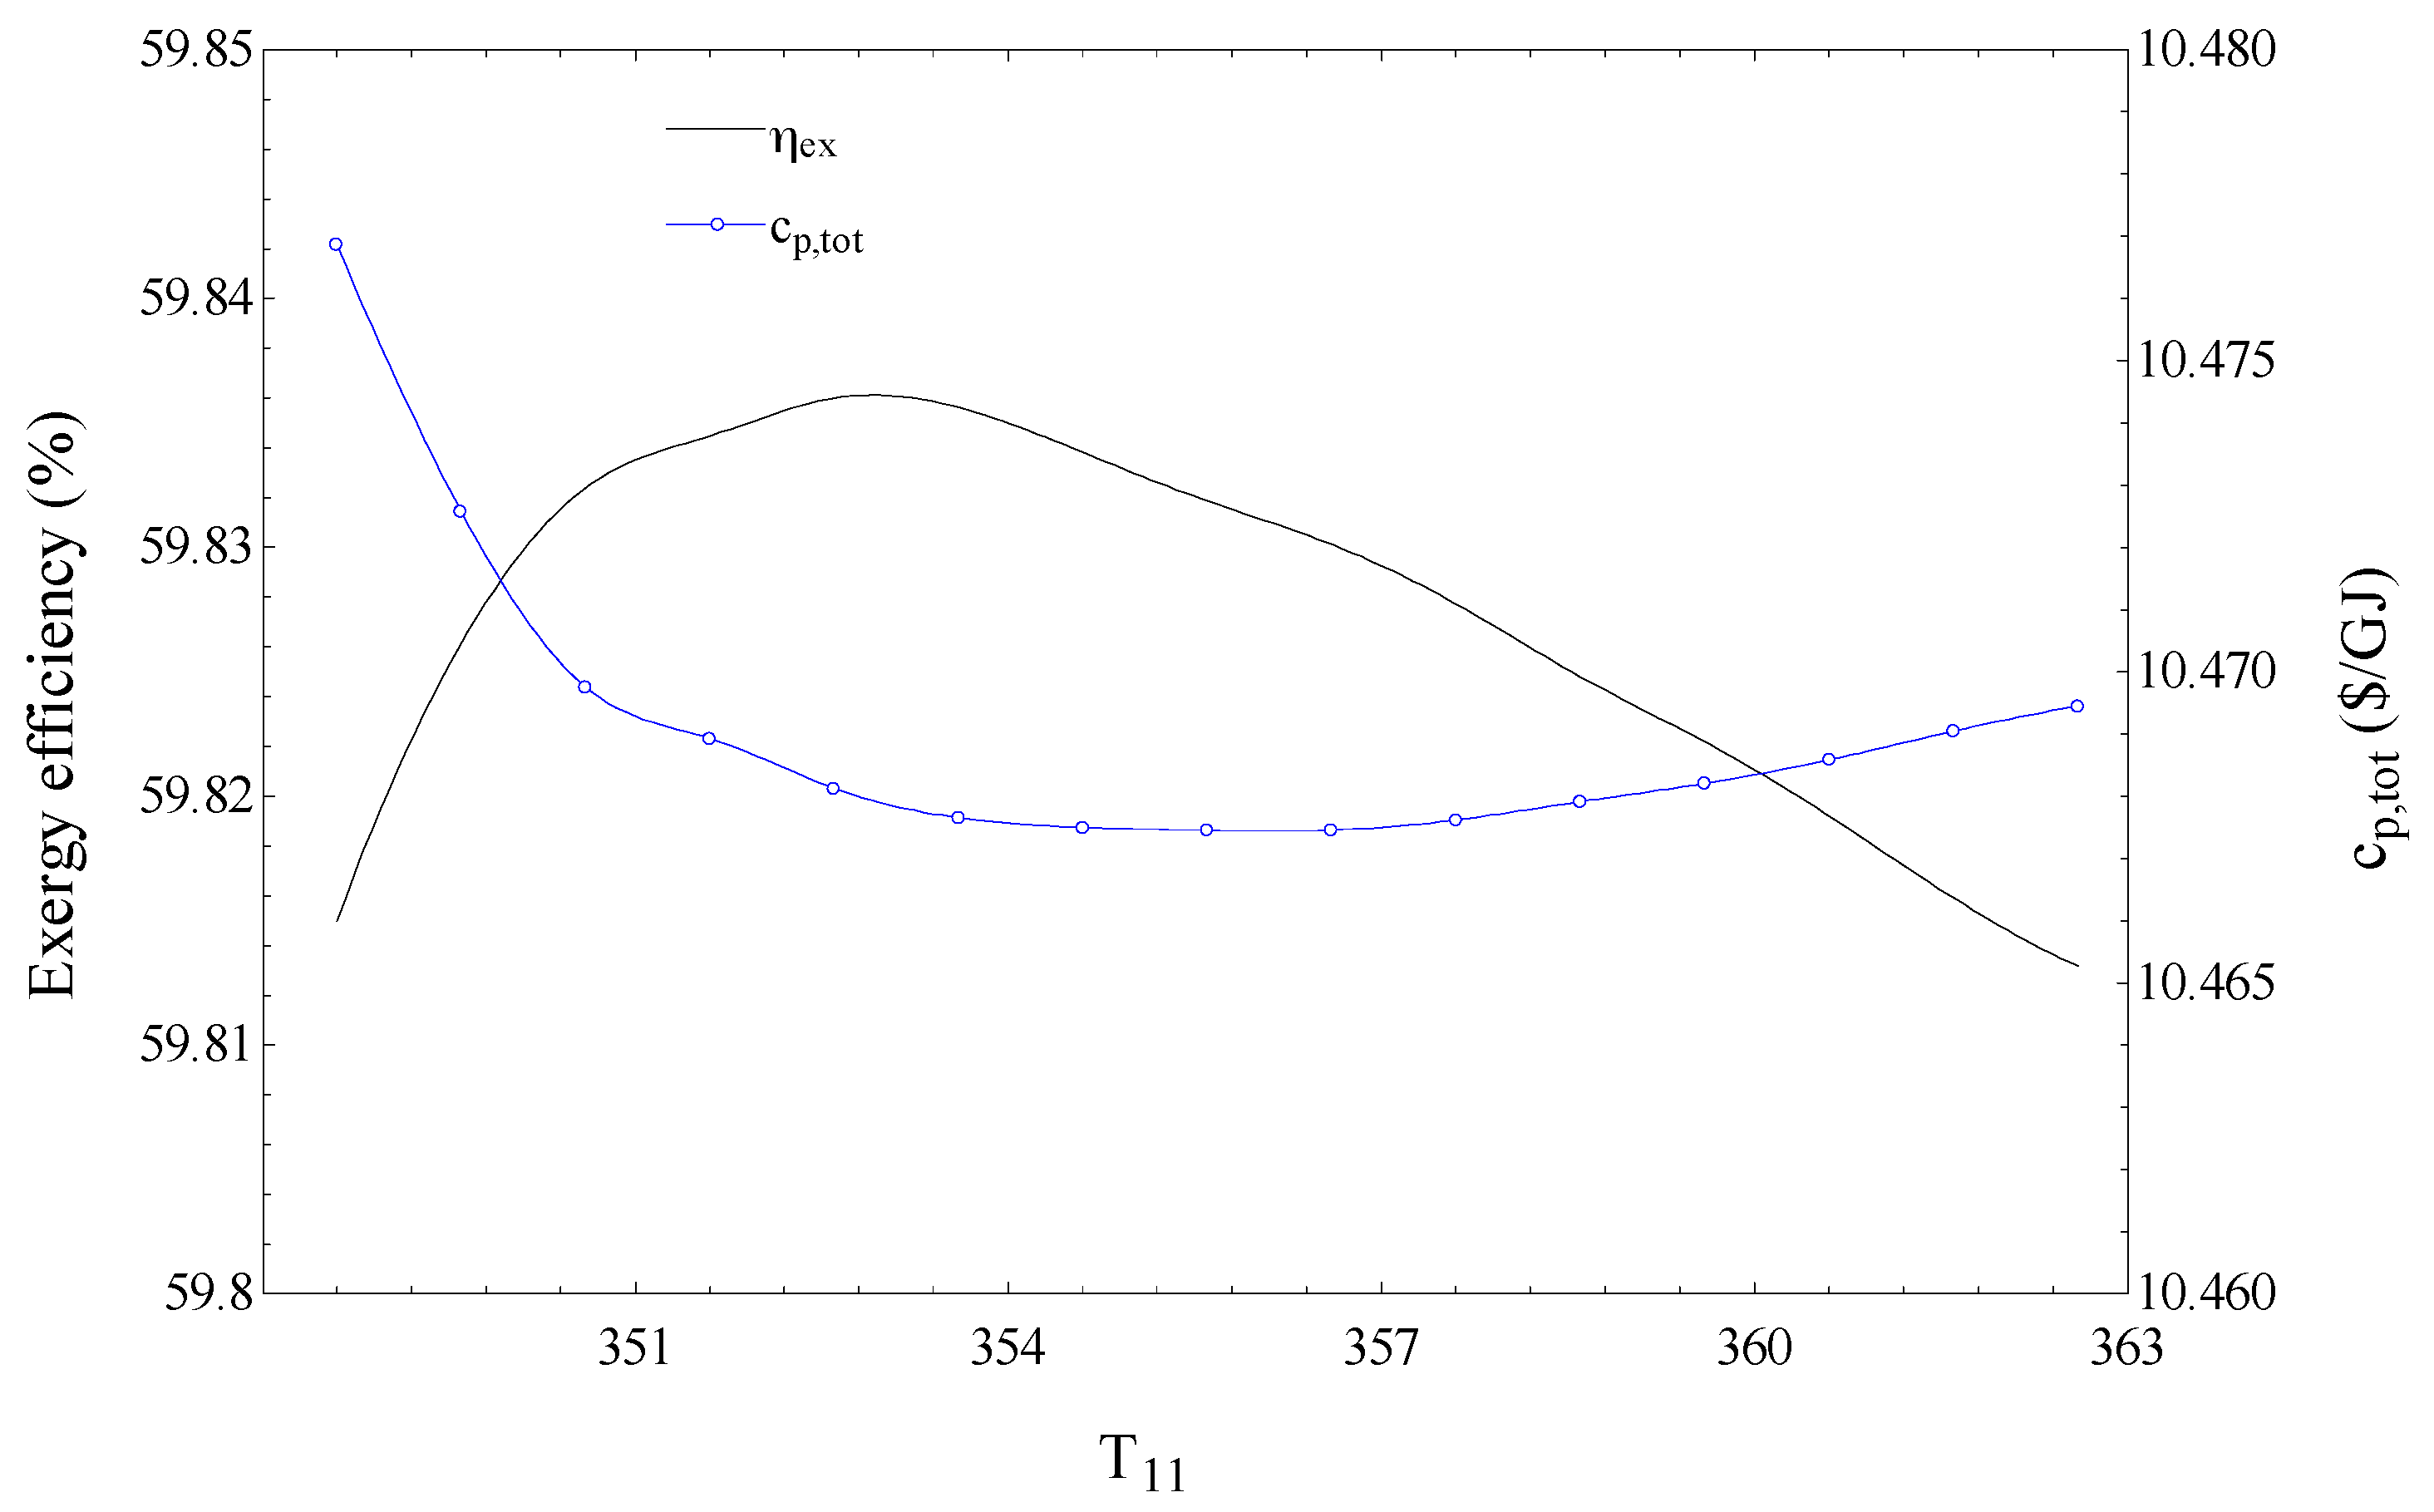
Figure 4 shows the effects on the exergy efficiency ( η e x , t o t ) and total product unit cost (cp,tot) of the temperature of the ammonia–water solution at the pre-cooler1 outlet (T11) for the SCRB/KC. Although Figure 4 shows that the exergy efficiency is maximized and the total product unit cost is minimized with changing T11, the variations in the objectives are small.
Note that a higher value of T11 results in a lower ammonia–water mass flow rate in the KC, but a higher vapor mass fraction ( q 11 = m ˙ v a p o r / m ˙ t o t a l ) in the pre-cooler1 outlet, so that the turbine2 mass flow rate remains almost constant, i.e., the produced power in the KC is almost constant. 
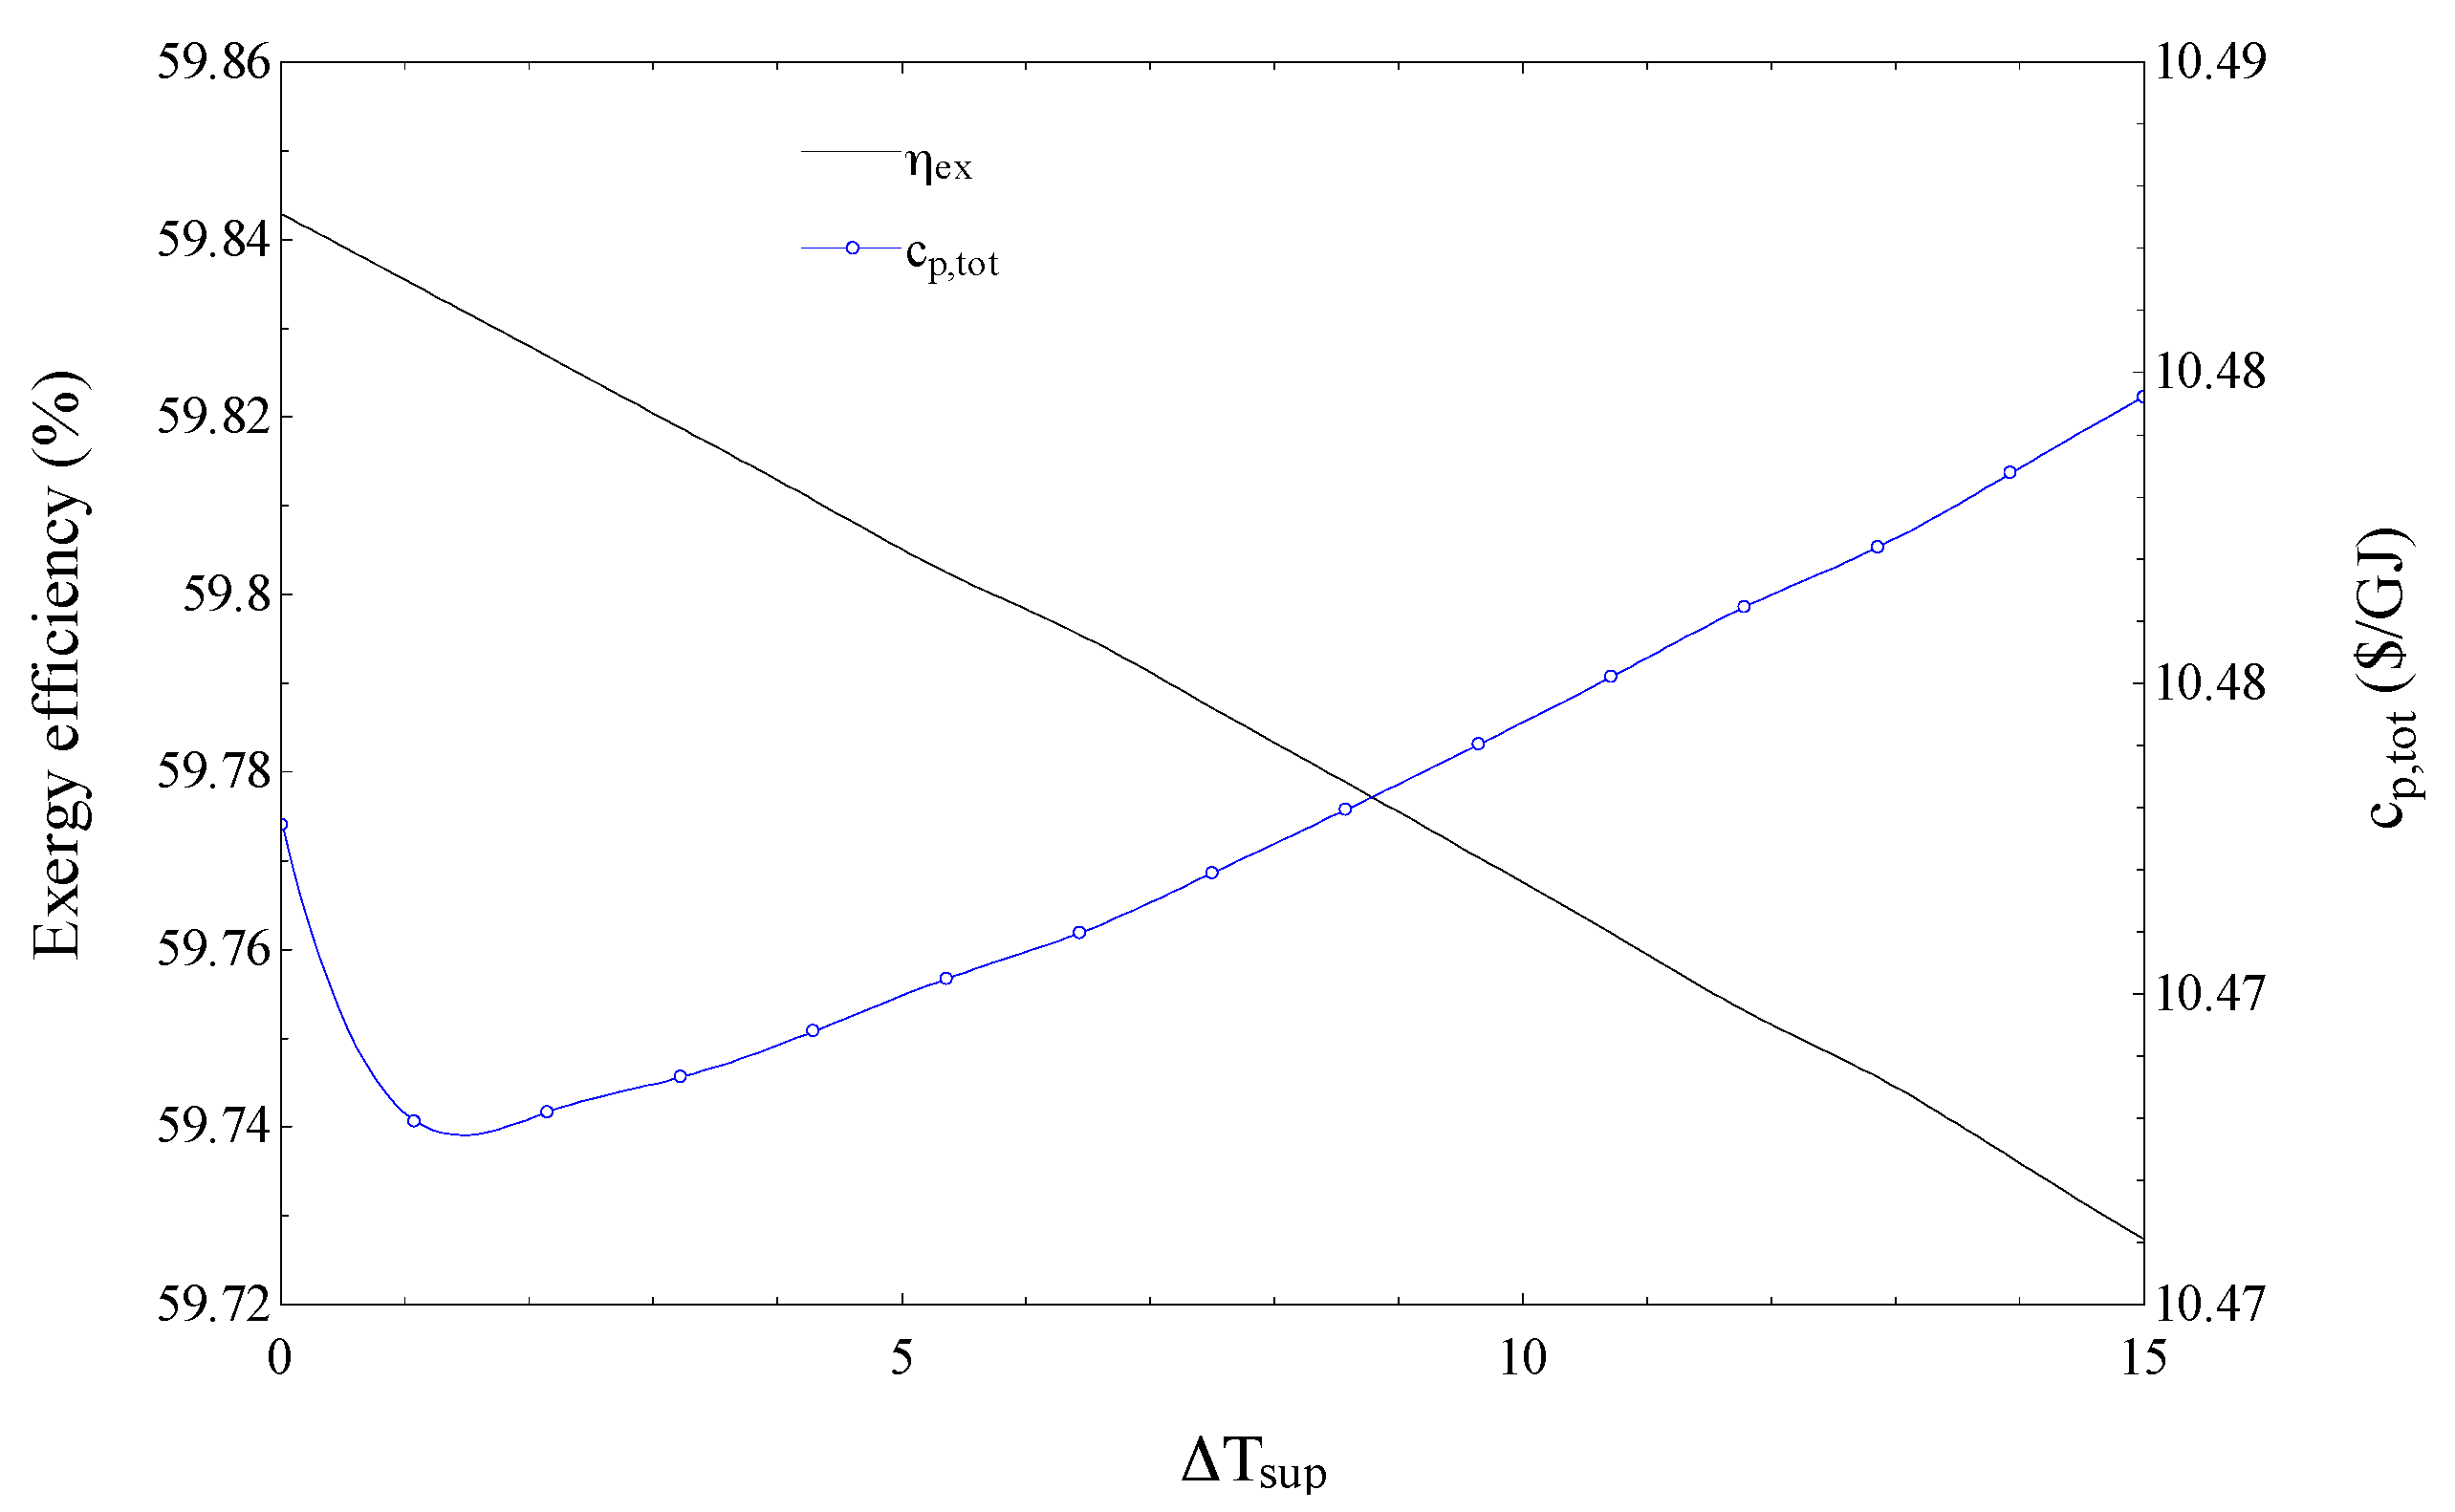
Figure 5 shows the variations in the exergy efficiency and total product unit cost of the SCRB/KC as Δ T sup changes.
It can be observed in Figure 5 that, as ΔTsup increases, the exergy efficiency increases and the total product unit cost is minimized. In fact an increase in the ΔTsup causes a decrease in the output power of the KC (because of lower heat recovery in the supeheater) and, consequently, the exergy efficiency of the SCRB/KC is reduced. However, the increase in ΔTsup, brings about a reduction in the superheater capital investment cost rate ( Z ˙ S H ) due to the reduction in the required heat transfer area. Accordingly, as indicated in Figure 5, there exists an optimum value for ΔTsup at which the total product unit cost is minimized.
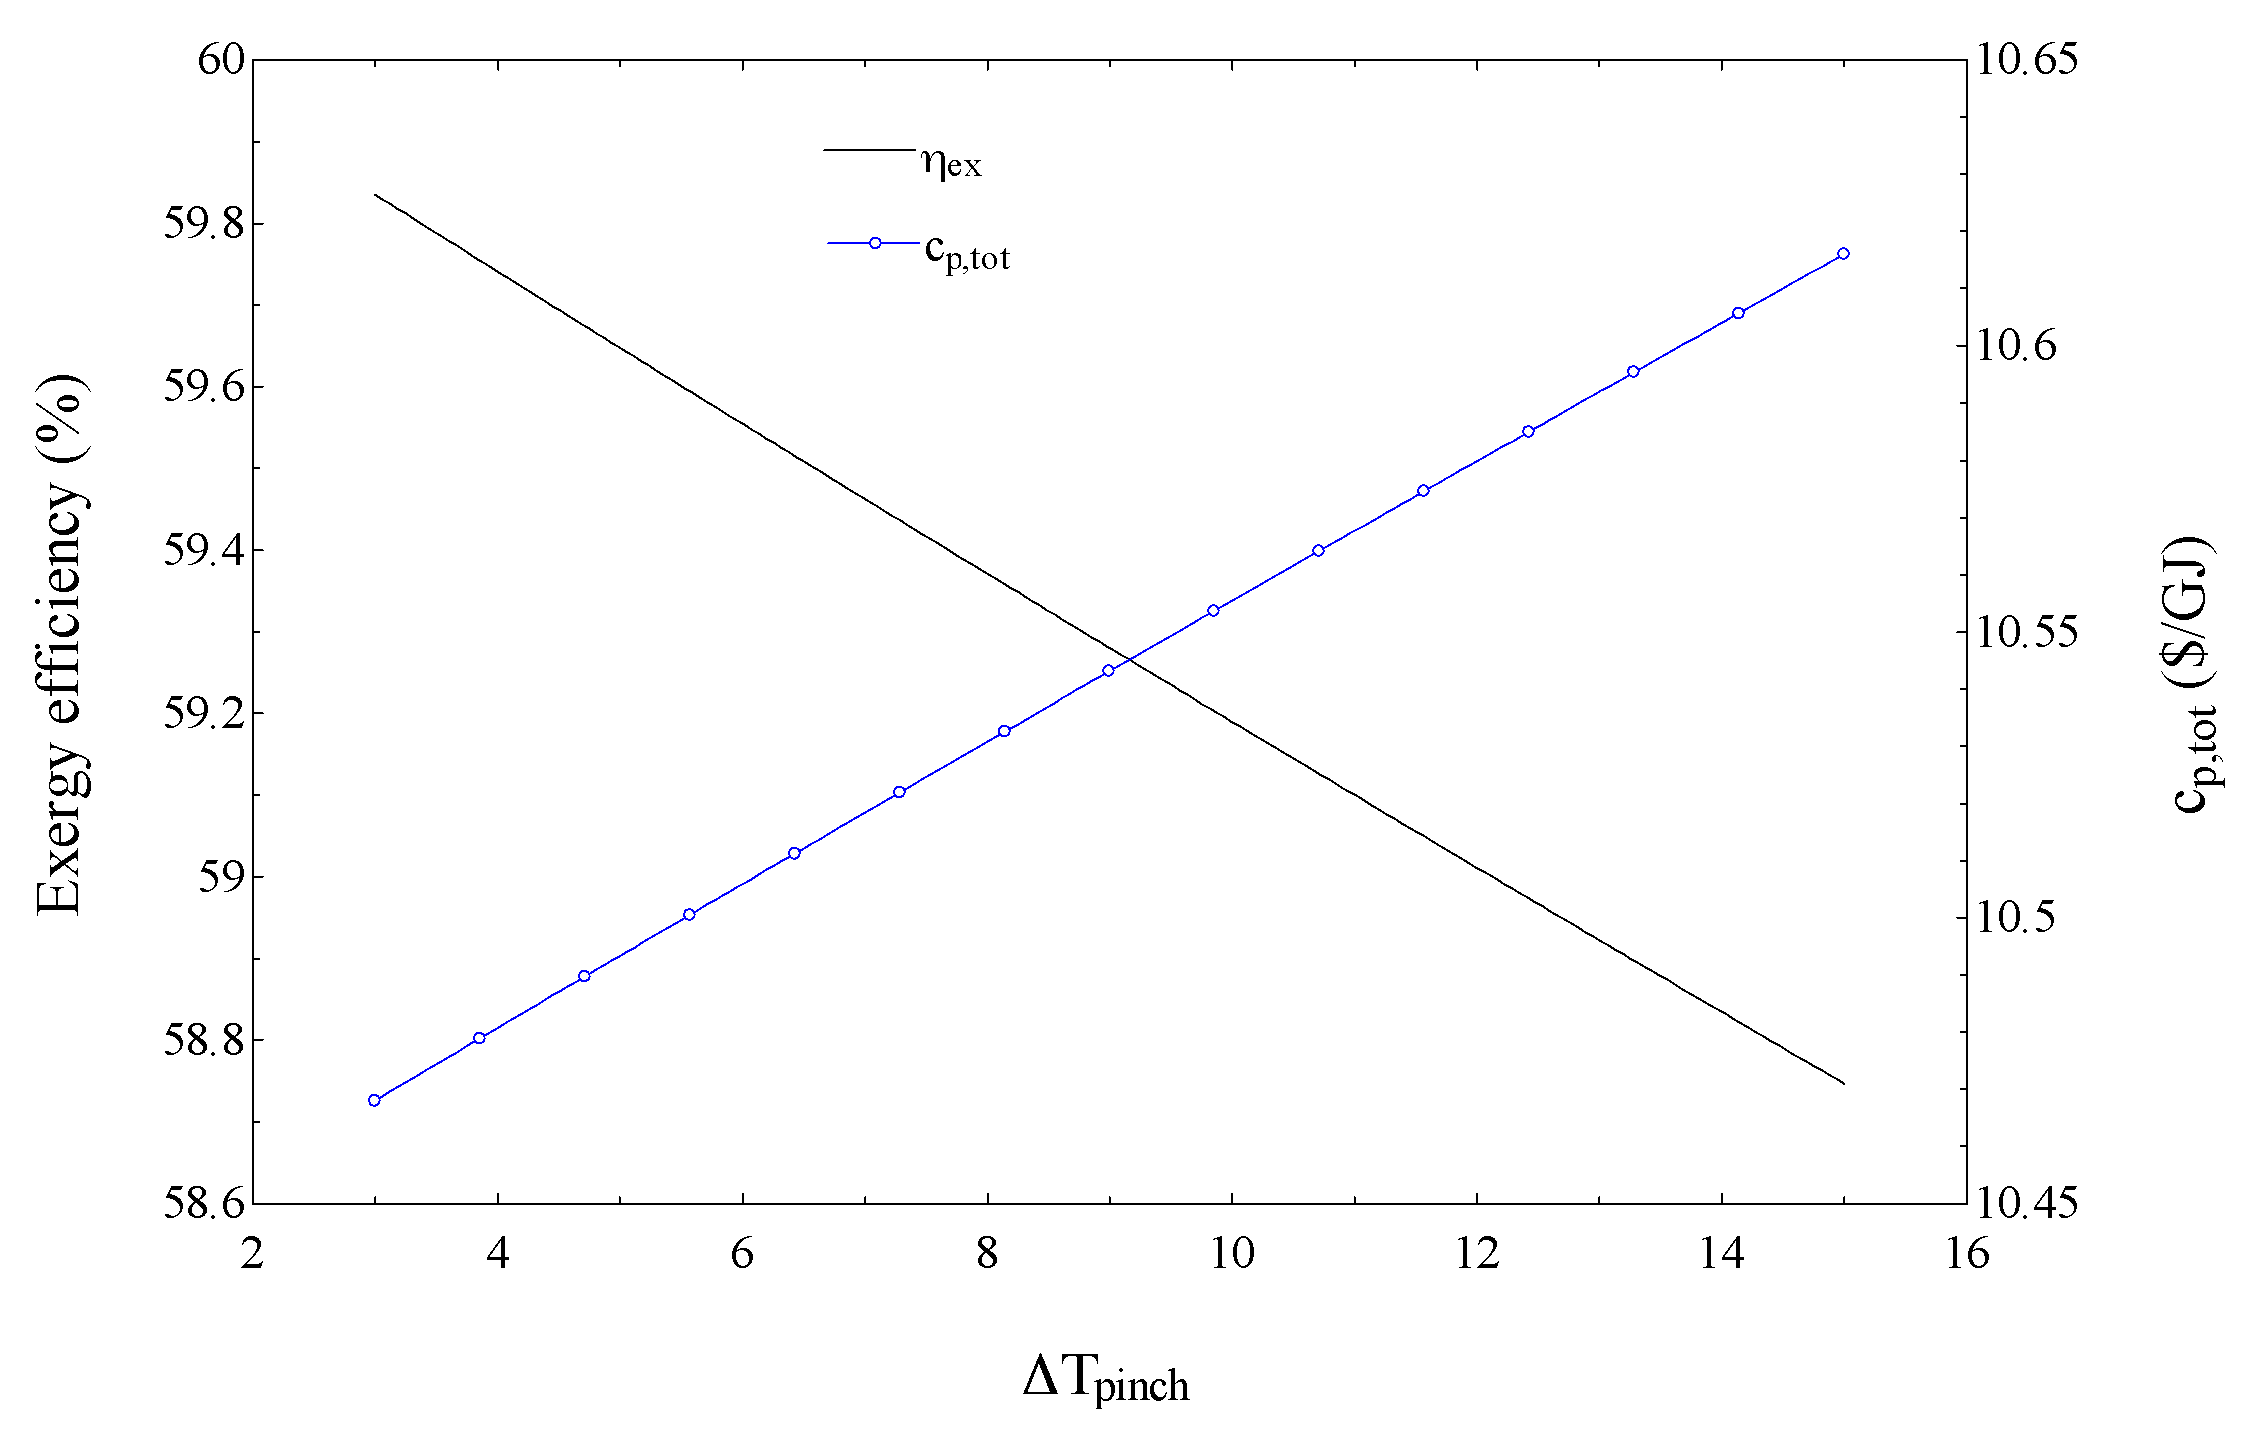
The effects on the exergy efficiency and total product unit cost of the SCRB/KC are shown in Figure 6 of Δ T Pinch in pre-cooler1. Higher exergy efficiency values are obtained for lower ΔTpinch due to higher values of power generated by the KC. The justification for results in Figure 6 is similar to that for those in Figure 5. However the increase in the cost rate associated with the exergy destruction in pre-cooler1 is dominant so that no minimum value is observed for cp,tot.
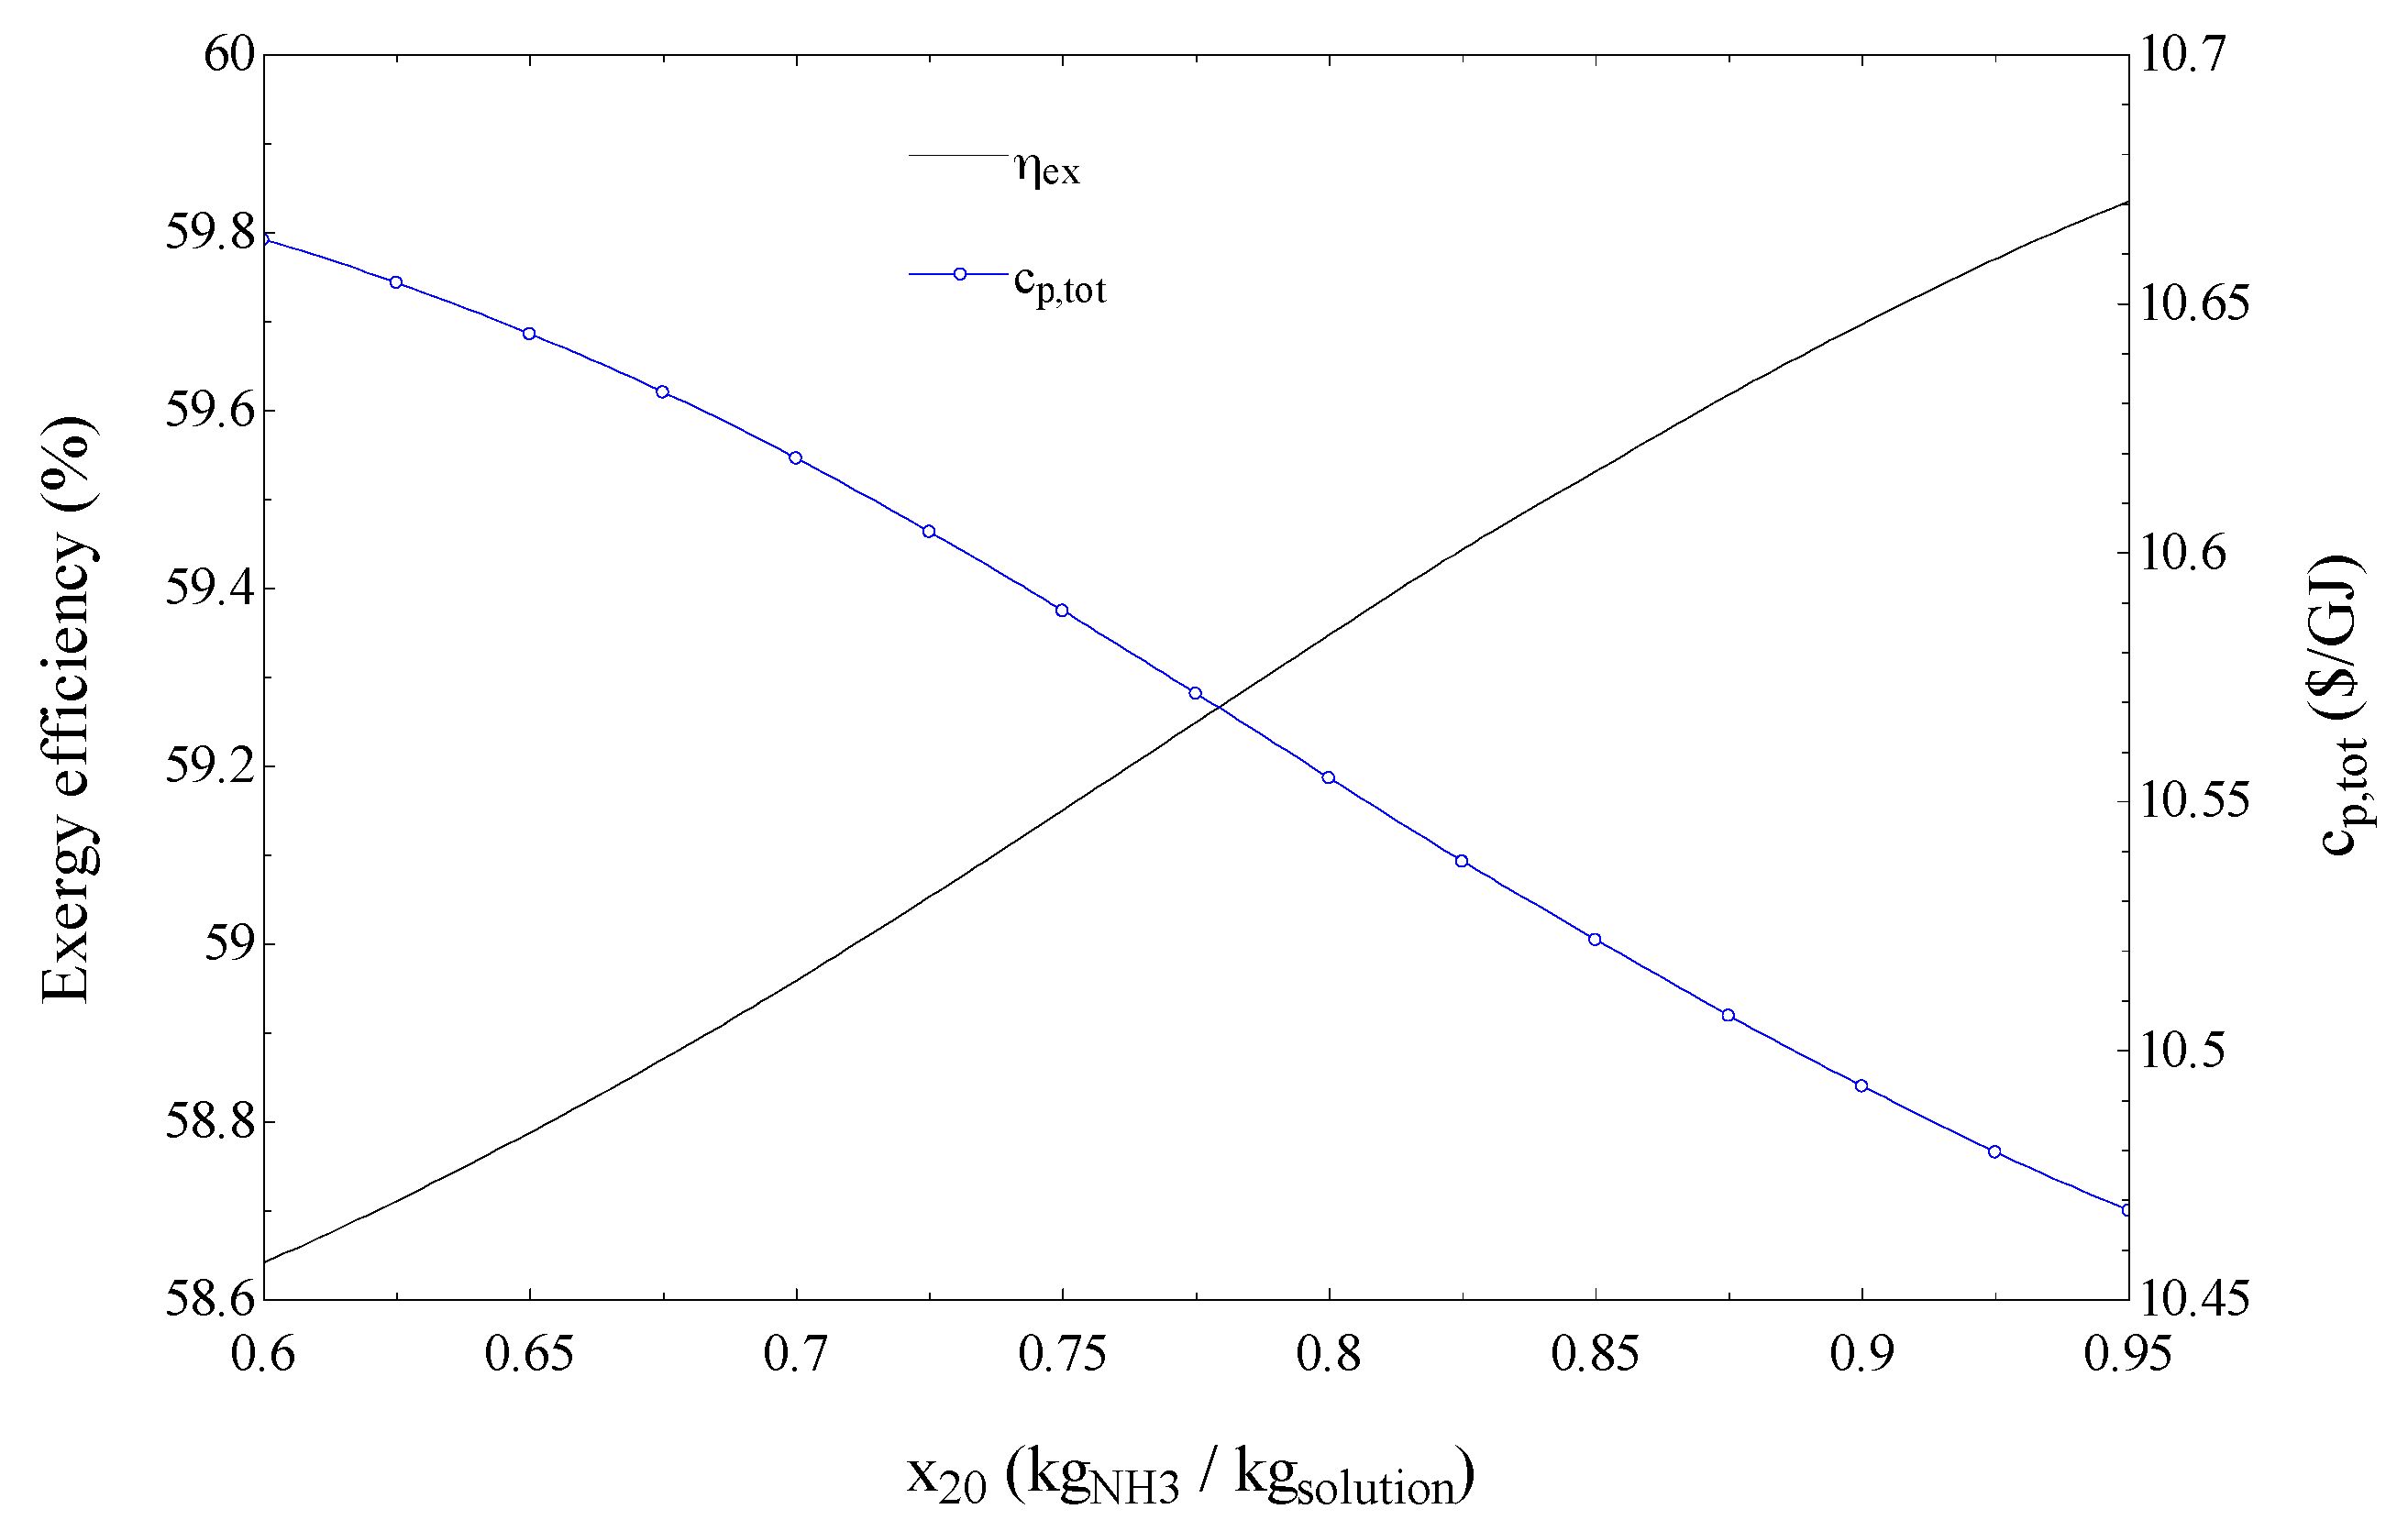
Figure 7 shows the effects of ammonia concentration in the mixture exiting the condenser (X20) on the exergy efficiency and total product unit cost of the SCRB/KC. Figure 7 indicates that as X20 increases the exergy efficiency increases and the total product unit cost decreases. This is justified if we consider that as X20 increases the exergy destruction in pre-cooler1 and the superheater decreases because of the reduced value of the temperature difference in these two components. Although the reduced value of temperature difference is expected to increase the capital investment cost rate associated with the above-mentioned two components, the increase in produced power is dominant.
Table 7 outlines the thermoeconomic parameters for components of the SCRBC and the SCRB/KC. The sum of C ˙ D + Z ˙ is observed in Table 7 to be highest and second highest for the reactor core and turbine1 in both the proposed systems, respectively. Therefore, the first design changes initially should be applied to these components. Table 7 also indicates that the exergoeconomic factor is high for these components. This indicates that selecting cheaper components should be suggested for enhancing the economic performance for the systems. However, the extent of improvement in the reactor core is limited. Referring to Table 7, the third highest C ˙ D + Z ˙ value is exhibited by pre-cooler2 in the SCRBC. The very low value of f for this component suggests that an increase in its capital cost is merited. It is interesting to note that the second highest exergy destruction rate occurs in pre-cooler2 of the SCRBC and the coupling of the KC reduces this exergy destruction. In the KC part of the combined cycle, the highest and second highest values of C ˙ D + Z ˙ are associated with turbine2 and the condenser, respectively. Referring to Table 7, the small value of f for the condenser suggests it may be appropriate to select a more expensive condenser.

5.2. Optimization

As mentioned in the parametric study section, the only decision parameter for the SCRBC is the compressor pressure ratio (PRC). Thus, the Quadratic Approximations method in the EES software is used to optimize the performance of the SCRBC. For the SCRB/KC, however, five decision parameters are identified, i.e., pump pressure ratio (PRp), output stream temperature (ammonia–water) of pre-cooler1 (T11), pinch point temperature difference in pre-cooler1 ( Δ T Pinch ), minimum temperature difference in the superheater ( Δ T s u p ), and ammonia concentration in the ammonia–water mixture leaving the condenser (X20). Therefore, the direct search method in the EES software is used to optimize the SCRB/KC performance. The optimization for both the SCRBC and SCRB/KC are performed from the viewpoints of either thermodynamics or thermoeconomics as follows:
For the SCRBC,
Maximize η e x , t o t or Minimize c p , tot ( PR C )
2.2 PR C 4
For the SCRB/KC,
Maximize η e x , t o t or Minimize c p , tot ( PR C ; PR p ; T 11 ; Δ T Pinch ; Δ T sup )
2.2 PR C 4 2.55 PR p 3.65 348 T 11 ( K ) 363 3 Δ T Pinch 15 0 Δ T sup 15

Optimization Results

The values of decision and performance parameters for the thermodynamic and economic optimal design (TOD and EOD) cases are shown in Table 8 for the SCRBC and the SCRB/KC.
Table 8 indicates that the product unit cost is minimized at a compressor pressure ratio (PRC) lower than the value at which the exergy efficiency is maximized. In fact, the lower value of PRC brings about a lower value of Z ˙ and the lower value of Z ˙ results in a lower value of f. Therefore, the suggestion of reducing f for turbine1, as made in the discussion about the results in Table 7, is confirmed here. In addition, Table 8 indicates that the CO2 mass flow rate is higher for the EOD case as expected because of the lower value of PRC for the EOD case [2]. Referring to Table 8 and comparing the EOD and TOD cases for the SCRBC, a reduction of about 3% in the total product unit cost is obtained at the expense of about a 3.3% reduction in the exergy efficiency. Table 8 also indicates that the total capital cost rate ( Z ˙ t o t ) for the SCRBC, when it is optimized for minimum total product unit cost, is reduced by 6.7% compared to the case when it is optimized for maximum exergy efficiency.
Comparing optimum decision parameter values for the SCRBC and the SCRB/KC in Table 8 shows an enhancement of both the exergy efficiency and cp,tot values as the KC is coupled with the SCRBC. The comparison shows that the exergy efficiency is improved by 10% and 9.2% for the TOD and the EOD cases, respectively. Similarly, a reduction of 4.2% and 4.9% in cp,tot is observed for the TOD and the EOD cases, respectively. In fact, when the KC is combined with the SCRBC, Z ˙ t o t is increased by 6.7% and 4.6% for the TOD and EOD cases, respectively. However, the increases of 10% and 9.2% in the net output power (see Table 8) for the TOD and EOD cases, respectively, results in a reduction of cp,tot.
A comparison between the results obtained for the EOD cases in Table 8 shows that the exergy destruction cost rate for the overall system is reduced by 8.75% as the KC is combined with the SCRBC.

6. Conclusions

Thermodynamic and thermoeconomic analyses are carried out for the SCRBC and the SCRB/KC. The performances of the cycles are optimized from the viewpoints of thermodynamics and thermoeconomics. Parametric studies are performed for the cycles to assess the effects on the exergy efficiency and total product unit cost of such decision parameters as compressor pressure ratio, ammonia–water temperature at pre-cooler1 outlet, pinch point temperature difference in pre-cooler1, pump pressure ratio, ammonia concentration at the condenser outlet and minimum temperature difference in the superheater. The results indicate that the SCRB/KC is superior to the SCRBC from the two viewpoints. It is observed that the optimum compressor and pump pressure ratios for minimum total product unit cost are lower than the corresponding values for maximum exergy efficiency. It is found that combining the KC with SCRBC reduces the exergy destruction in the pre-cooler (pre-cooler1 + pre-cooler2) by 64.4% for the TOD case and 61.2% for the EOD case.
It is concluded that the exergy efficiency of SCRB/KC is higher than that of the SCRBC by up to 10% and that the total product unit cost for the SCRB/KC is lower than that for the SCRBC by up to 4.9%.

Author Contributions

The modeling was made by Akbari; and analysis as well as discussion were performed by all the authors. All the authors contributed equally in writing the article.

Conflicts of Interest

The authors declare no conflict of interest.

Nomenclature

Aheat transfer area (m2)
C ˙ cost rate ($/h)
ccost per exergy unit ($/GJ)
cp,tottotal product unit cost ($/GJ)
E ˙ exergy rate (kW)
especific exergy (kJ/kg)
hspecific enthalpy (kJ/kg)
irinterest rate
m ˙ mass flow rate (kg/s)
Ppressure (bar)
PRpressure ratio
PRccompressor pressure ratio
PRppump pressure ratio
Q ˙ heat transfer rate (kW)
sspecific entropy (kJ/kg K)
Ttemperature (°C, K)
T11pre-cooler1 outlet temperature (°C, K)
W ˙ C compressor power (kW)
W ˙ P pump power (kW)
W ˙ T turbine power (kW)
xrecompressed mass fraction
Xammonia concentration
Zcapital cost of a component ($)
Z ˙ capital cost rate ($/h)

Subscripts and Abbreviations

0dead (environmental) state
1, 2, 3…state points
Ccompressor
chchemical
CIcapital investment
condcondenser
CRFcapital recovery factor
Ddestruction
EODeconomic optimal design
Ffuel
HTRhigh temperature recuperator
LTRlow temperature recuperator
OMoperation and maintenance
ppump, product
pcpre-cooler
phphysical
Rreactor
supsuperheater
Tturbine
TODthermodynamic optimal design

Greek Symbols

ϵ effectiveness
η t h thermal efficiency
η e x exergy efficiency
η i s isentropic efficiency
ΔTminimum temperature difference
ΔTpinchpinch point temperature difference

Appendix A

Appropriate cost functions are employed to assess the investment costs of system components in both cycles. Table A1 lists these cost functions for components of the analyzed systems [2,30].
Table A1. Cost functions for economic modeling.
ComponentCapital Investment Cost Function
Reactor Z R = C 1 × Q ˙ r   ,   C 1 = 283   $ K W t h [2]
Turbine1 Z T 1 = 479.34 × m ˙ i n [ 1 0.93 η t 1 ] × ln ( P R c ) × ( 1 + e ( 0.036 × T 2 54.4 ) ) [2]
Compressors Z C 1 & 2 = 71.1 × m ˙ i n [ 1 0.92 η c ] × P R c × ln ( P R c ) [2]
HTR, LTR, Pre-cooler1 Z k = 2681 × A k 0.59 [2]
Condenser, Pre_cooler2 Z k = 2143 × A k 0.514 [2]
KCHTR, KCLTR Z k = 2143 × A k 0.514 [29]
Superheater Z k = 2681 × A k 0.59 [29]
Turbine2 Z T 2 = 4405 × W ˙ T 2 0.7 [29]
Pump Z P = 1120 × W ˙ p 0.8 [29]
As the costs associated with the mixer, the throttling valve and the separator are much less than those for the other components, they are neglected in the analyses [29].
The cost functions for shell and tube heat exchangers are adopted for pre-cooler2 of the SCRBC and all the heat exchangers in the Kalina cycle. For the high and low temperature recuperators as well as pre-cooler1 and the superheater, the cost functions suggested for compact heat exchangers are selected [2,30].
To simulate the thermal behavior of heat exchangers the logarithmic mean temperature difference ( Δ T k l m ) method is used. In this method, the heat transfer rate is described as:
q k = U k A k Δ T k l m
where A k is the surface area of the heat exchanger and U k is the overall heat transfer coefficient [2].
The cost of system components in the reference year can be calculated using costs available in the original year and the Chemical Engineering Plant Cost Index (CEPEI):
Cost   at   reference   year = Original   Cost × Cost   index   for   the   reference   year Cost   index   for   the   original   year

References

  1. Yang, M.H.; Yeh, R.H. Analyzing the optimization of an organic Rankine cycle system for recovering waste heat from a large marine engine containing a cooling water system. Energy Convers. Manag. 2014, 88, 999–1010. [Google Scholar] [CrossRef]
  2. Akbari, A.D.; Mahmoudi, S.M.S. Thermoeconomic analysis and optimization of the combined supercritical CO2 (carbon dioxide) recompression Brayton/organic Rankine cycle. Energy 2014, 78, 501–512. [Google Scholar] [CrossRef]
  3. Chen, Y.; Lundqvist, P.; Johansson, A.; Platell, P. A comparative study of the carbon dioxide transcritical power cycle compared with an organic rankine cycle with R123 as working fluid in waste heat recovery. Appl. Therm. Eng. 2006, 26, 2142–2147. [Google Scholar] [CrossRef]
  4. Feher, E.G. The supercritical thermodynamic power cycle. Energy Convers. 1968, 8, 85–90. [Google Scholar] [CrossRef]
  5. Angelino, G. Carbon dioxide condensation cycles for power production. 1968, 90, 287–295. [Google Scholar] [CrossRef]
  6. Dostal, V. A supercritical Carbon Dioxide Cycle for Next Generation Nuclear Reactors. Ph.D. Thesis, Massachusetts Institute of Technology, Cambridge, MA, USA, 2004. [Google Scholar]
  7. Cayer, E.; Galanis, N.; Desilets, M.; Nesreddine, H.; Roy, P. Analysis of a carbon dioxide transcritical power cycle using a low temperature source. Appl. Energy 2009, 86, 1055–1063. [Google Scholar] [CrossRef]
  8. Angelino, G.; Invernizzi, C.M. Carbon dioxide power cycles using liquid natural gas as heat sink. Appl. Therm. Eng. 2009, 29, 2935–2941. [Google Scholar] [CrossRef]
  9. Sarkar, J. Second law analysis of supercritical CO2 recompression Brayton cycle. Energy 2009, 34, 1172–1178. [Google Scholar] [CrossRef]
  10. Sarkar, J.; Bhattacharyya, S. Optimization of recompression S-CO2 power cycle with reheating. Energy Convers. Manag. 2009, 50, 1939–1945. [Google Scholar] [CrossRef]
  11. Wang, J.; Sun, Z.; Dai, Y. Parametric optimization design for supercritical CO2 power cycle using genetic algorithm and artificial neural network. Appl. Energy 2010, 87, 1317–1324. [Google Scholar] [CrossRef]
  12. Yari, M.; Sirousazar, M. A novel recompression S-CO2 Brayton cycle with pre-cooler exergy utilization. J. Power Energy 2010, 224, 931–946. [Google Scholar] [CrossRef]
  13. Jeong, W.S.; Lee, J.I.; Jeong, Y.H. Potential improvements of supercritical recompression CO2 Brayton cycle by mixing other gases for power conversion system of a SFR. Nucl. Eng. Des. 2011, 241, 2128–2137. [Google Scholar] [CrossRef]
  14. Yoon, H.J.; Ahn, Y.; Lee, J.I.; Addad, Y. Potential advantages of coupling supercritical CO2 Brayton cycle to water cooled small and medium size reactor. Nucl. Eng. Des. 2012, 245, 223–232. [Google Scholar] [CrossRef]
  15. Kim, Y.M.; Kim, C.G.; Favrat, D. Transcritical or supercritical CO2 cycles using both low- and high-temperature heat sources. Energy 2012, 43, 402–415. [Google Scholar] [CrossRef]
  16. Floyd, J.; Alpy, N.; Moisseytsev, A.; Haubensack, D.; Rodriguez, G.; Sienicki, J.; Avakian, G. A numerical investigation of the S-CO2 recompression cycle off-design behaviour, coupled to a sodium cooled fast reactor, for seasonal variation in the heat sink temperature. Nucl. Eng. Des. 2013, 260, 78–92. [Google Scholar] [CrossRef]
  17. Singh, R.; Kearney, M.P.; Manzie, C. Extremum-seeking control of a supercritical carbon-dioxide closed Brayton cycle in a direct-heated solar thermal power plant. Energy 2013, 60, 380–387. [Google Scholar] [CrossRef]
  18. Moullec, Y.L. Conceptual study of a high efficiency coal-fired power plant with CO2 capture using a supercritical CO2 Brayton cycle. Energy 2013, 49, 32–46. [Google Scholar] [CrossRef]
  19. Nithyanandam, K.; Pitchumani, R. Cost and performance analysis of concentrating solar power systems with integrated latent thermal energy storage. Energy 2014, 64, 793–810. [Google Scholar] [CrossRef]
  20. Dai, B.; Li, M.; Ma, Y. Thermodynamic analysis of carbon dioxide blends with low GWP (global warming potential) working fluids-based transcritical Rankine cycles for low-grade heat energy recovery. Energy 2014, 64, 942–952. [Google Scholar] [CrossRef]
  21. Mondal, S.; De, S. Transcritical CO2 power cycle—Effects of regenerative heating using turbine bleed gas at intermediate pressure. Energy 2015, 78, 95–103. [Google Scholar] [CrossRef]
  22. Hu, L.; Chen, D.; Huang, Y.; Li, L.; Cao, Y.; Yuan, D.; Wang, J.; Pan, L. Investigation on the performance of the supercritical Brayton cycle with CO2-based binary mixture as working fluid for an energy transportation system of a nuclear reactor. Energy 2015, 89, 874–886. [Google Scholar] [CrossRef]
  23. Padilla, R.V.; Too, Y.C.S.; Benito, R.; Stein, W. Exergetic analysis of supercritical CO2 Brayton cycles integrated with solar central receivers. Appl. Energy 2015, 148, 348–365. [Google Scholar] [CrossRef]
  24. Gholamian, E.; Mahmoudi, S.M.S.; Zare, V. Proposal, exergy analysis and optimization of a new biomass-based cogeneration system. Appl. Therm. Eng. 2016, 93, 223–235. [Google Scholar] [CrossRef]
  25. Ganesh, N.S.; Srinivas, T. Thermodynamic assessment of heat source arrangements in Kalina power station. J. Energy Eng. 2013, 139, 99–108. [Google Scholar] [CrossRef]
  26. Bejan, A.; Tsatsaronis, G.; Moran, M. Thermal Design and Optimization; John Wiley and Sons: New York, NY, USA, 1996. [Google Scholar]
  27. Dincer, I.; Rosen, M.A. Exergy: Energy, Environment and Sustainable Development, 2nd ed.; Elsevier: New York, NY, USA, 2013. [Google Scholar]
  28. Ogriseck, S. Integration of Kalina cycle in a combined heat and power plant, a case study. Appl. Therm. Eng. 2009, 29, 2843–2848. [Google Scholar] [CrossRef]
  29. Zare, V.; Mahmoudi, S.M.S.; Yari, M. On the exergoeconomic assessment of employing Kalina cycle for GT-MHR waste heat utilization. Energy Convers. Manag. 2015, 90, 364–374. [Google Scholar] [CrossRef]
  30. Lazzaretto, A.; Tsatsaronis, G. SPECO: A systematic and general methodology for calculating efficiencies and costs in thermal systems. Energy 2006, 31, 1257–1289. [Google Scholar] [CrossRef]
Figure 1. Schematic diagram for the proposed supercritical CO2 recompression Brayton/Kalina cycle (SCRB/KC).
Sustainability 08 01079 g001
Figure 2. Effect of compressor pressure ratio (PRC) on: (a) exergy efficiency; and (b) total product unit cost for the SCRBC and the SCRB/KC with base case values.
Sustainability 08 01079 g002
Figure 3. Effect of pump pressure ratio (PRP) on exergy efficiency and total product unit cost for the SCRB/KC with base case values.
Sustainability 08 01079 g003
Figure 4. Effect of outlet stream temperature (ammonia–water) of pre-cooler1 (T11) on exergy efficiency and total product unit cost for the SCRB/KC with base case values.
Sustainability 08 01079 g004
Figure 5. Effect of minimum temperature difference in superheater (ΔTsup) on the exergy efficiency and total product unit cost for the SCRB/KC for the base case condition.
Sustainability 08 01079 g005
Figure 6. Effect of pinch point temperature difference in pre-cooler1 (ΔTPinch) on exergy efficiency and total product unit cost for the SCRB/KC with base case values.
Sustainability 08 01079 g006
Figure 7. Effect of ammonia concentration in the ammonia–water mixture leaving the condenser (X20) on exergy efficiency and total product unit cost for the SCRB/KC with base case values.
Sustainability 08 01079 g007
Table 1. Comparison between present results and those of Reference [28] for the Kalina cycle. a
StreamTemperature (K)Pressure (Bar)Ammonia ConcentrationMass Flow Rate
PresentRef. [28]PresentRef. [28]PresentRef. [28]PresentRef. [28]
11389.15389.1532.332.30.820.8216.816.8
12389.15389.1532.332.30.97180.9711.2711.4
13389.15389.1532.332.30.51040.55.5275.4
14389.15-32.3-0.5104-5.527-
15314.45316.156.66.60.97180.9711.2711.4
16318.44319.1531.331.30.51040.55.5275.4
17318.85-6.6-0.5104-5.527-
18318.44319.156.66.60.820.8216.816.8
19303.05303.155.65.60.820.8216.816.8
20281.15281.154.7694.60.820.8216.816.8
21281.59281.1535.335.30.820.8216.816.8
22313.44314.1534.334.30.820.8216.816.8
23336.02336.1533.333.30.820.8216.816.8
Present workRef. [28]
Net power (kW)22012194.8
a X11 = 0.82, m ˙ = 16.8 kg/s.
Table 2. Economic data used in the simulation [2].
ParameterValue
i r ( % ) 12
n ( year ) 20
τ ( h ) 8000
γ k 0.06
Table 3. Fuel–product definitions for the SCRB/KC components.
ComponentFuel ExergyProduct Exergy
Compressor1 E ˙ 29 ( W ˙ C 1 ) E ˙ 9 E ˙ 8
LTR E ˙ 4 E ˙ 5 E ˙ 10 a E ˙ 9
HTR E ˙ 3 E ˙ 4 E ˙ 1 E ˙ 10
Reactor E ˙ 1 E ˙ c o r e E ˙ 2
Turbine1 E ˙ 2 E ˙ 3 E ˙ 27 ( W ˙ T 1 )
Compressor2 E ˙ 28 ( W ˙ C 2 ) E ˙ 10 b E ˙ 5 b
Superheater E ˙ 5 a E ˙ 6 E ˙ 14 E ˙ 12
Pre-cooler1 E ˙ 6 E ˙ 7 E ˙ 11 E ˙ 23
Pre-cooler2 E ˙ 7 E ˙ 8 E ˙ 25 a E ˙ 24 a
Separator E ˙ 11 E ˙ 12 + E ˙ 13
Turbine2 E ˙ 14 E ˙ 15 E ˙ 30 ( W ˙ T 2 )
Mixer and throttling valve E ˙ 16 + E ˙ 18 E ˙ 20
KCLTR E ˙ 18 E ˙ 19 E ˙ 22 E ˙ 21
Condenser E ˙ 19 E ˙ 20 E ˙ 25 b E ˙ 24 b
Pump E ˙ 31 ( W ˙ p ) E ˙ 21 E ˙ 20
KCHTR E ˙ 13 E ˙ 16 E ˙ 23 E ˙ 22
The terms in parenthesis indicate power corresponding to the exergy rate shown by the previous term.
Table 4. Cost balance and auxiliary equations for the SCRB/KC components.
ComponentCost BalanceAuxiliary Equations
Compressor1 C ˙ 9 = C ˙ 29 + C ˙ 8 + Z ˙ C 1
LTR C ˙ 5 + C ˙ 10 a = C ˙ 9 + C ˙ 4 + Z ˙ L T R C ˙ 4 E ˙ 4 = C ˙ 5 E ˙ 5 or c4 = c5
HTR C ˙ 1 + C ˙ 4 = C ˙ 10 + C ˙ 3 + Z ˙ H T R C ˙ 3 E ˙ 3 = C ˙ 4 E ˙ 4 or c3 = c4
Reactor C ˙ 2 = C ˙ f u e l + C ˙ 1 + Z ˙ R
Turbine1 C ˙ 3 + C ˙ 27 = C ˙ 2 + Z ˙ T 1 C ˙ 3 E ˙ 3 = C ˙ 2 E ˙ 2 or c2 = c3
Compressor2 C ˙ 9 b = C ˙ 28 + C ˙ 5 b + Z ˙ C 2 C ˙ 28 E ˙ 28 = C ˙ 29 E ˙ 29 or c28 = c29
C ˙ 28 E ˙ 28 = C ˙ 27 E ˙ 27 or c28 = c27
Superheater C ˙ 6 + C ˙ 14 = C ˙ 12 + C ˙ 5 a + Z ˙ s h C ˙ 6 E ˙ 6 = C ˙ 5 a E ˙ 5 a or c6 = c5a
Pre-cooler1 C ˙ 7 + C ˙ 11 = C ˙ 23 + C ˙ 6 + Z ˙ p c 1 C ˙ 6 E ˙ 6 = C ˙ 7 E ˙ 7 or c6 = c7
Pre-cooler2 C ˙ 25 a + C ˙ 8 = C ˙ 24 a + C ˙ 7 + Z ˙ p c 2 C ˙ 24 a = 0
Separator C ˙ 12 + C ˙ 13 = C ˙ 11 + Z ˙ s p C ˙ 12 E ˙ 12 = C ˙ 13 E ˙ 13 or c12 = c13
Turbine2 C ˙ 30 + C ˙ 15 = C ˙ 14 + Z ˙ T 2 C ˙ 14 E ˙ 14 = C ˙ 15 E ˙ 15 or c14 = c15
Mixer and throttling valve C ˙ 18 = C ˙ 15 + C ˙ 16 + Z ˙ v a l v e + Z ˙ m i x
KCLTR C ˙ 22 + C ˙ 19 = C ˙ 18 + C ˙ 21 + Z ˙ L T R K C C ˙ 18 E ˙ 18 = C ˙ 19 E ˙ 19 or c18 = c19
Condenser C ˙ 25 a + C ˙ 20 = C ˙ 24 a + C ˙ 19 + Z ˙ c o n d C ˙ 24 b = 0
Pump C ˙ 21 = C ˙ 20 + C ˙ 31 + Z ˙ p C ˙ 30 E ˙ 30 = C ˙ 32 E ˙ 32 or c30 = c32
KCHTR C ˙ 23 + C ˙ 16 = C ˙ 13 + C ˙ 22 + Z ˙ H T R K C C ˙ 13 E ˙ 13 = C ˙ 16 E ˙ 16 or c13 = c16
Table 5. Input data for the simulation.
ParameterValue
T o   ( K ) 298.15
P o   ( bar ) 1.01
P 1   ( bar ) 74 a
PRC2.2–4.2
T max   ( K ) 823.15 a
T 7   ( K ) 308.15 a
T r   ( K ) 1073.15 a
η t 1   ( % ) 0.9 a
η c   ( % ) 0.85 a
ϵ L T R   and   ϵ H T R 0.86 a
T 11   ( K ) 348–363
X20 (%)0.95
PRp2.55–3.65
Δ T pinch   ( K ) 3–15
Δ T pinch _ sup   ( K ) 0–15
η t 2   ( % ) 0.87
η p   ( % ) 0.87
Fuel cost ($/MWh)7.4 a
Q ˙ R   ( MW ) 600 a
a Source [2].
Table 6. Thermodynamic properties and exergy stream costs for the SCRB/KC *.
StreamTemperature (K)Pressure (Bar) m ˙ ( k g / s ) X (%)ech (kJ/kg)eph (kJ/kg)Costs
C ˙   ( $ h ) c   ( $ G J )
1660.19214.62980--411.436,6468.304
2823.15214.62980--531.543,4567.622
3697.15742980--386.931,6327.622
4550.37742980--299.724,5037.622
5408.91742980--239.919,6147.622
5a408.91742187--239.914,3957.622
5b408.9174793--239.952197.622
6398.3742187--236.614,1977.622
7338.91742187--221.813,3077.622
8308.15742187--216.612,9987.622
9385.88214.62187--255.816,6048.245
10526.48214.62980--328.429,4808.368
10a526.48214.62187--328.421,5348.328
10b526.48214.6793--328.479478.477
1135332.47191.40.9518,800392.6130,2859.85
1235332.47146.30.997619,724447.1104,7419.859
1335332.4745.130.795715,73121625,5449.859
14407.9132.47146.30.997619,724493.2104,9489.856
15323.8110.47146.30.997619,724317.5104,0369.856
16309.1432.4745.130.795715,731194.725,5099.859
17307.1510.4745.130.795715,732191.625,5099.86
18309.1410.47191.40.9518,801286.6129,5459.848
19308.610.47191.40.9518,800286.1129,5419.848
20301.1510.47191.40.9518,782267.7129,2899.848
21301.8332.47191.40.9518,782271.2129,3389.85
22304.1432.47191.40.9518,782271.4129,3439.85
23314.632.47191.40.9518,782273.2129,3809.852
24298.151.01343,018--000
25299.151.01343,018--0.006999266.9246.2
* Δ T pinch = 3   K , PRC = 2.9, T 11 = 353   ( K ) , Δ T sup = 1   K , PRp = 3.1.
Table 7. Exergoeconomic variables for components of the SCRBC and SCRB/KC.
ComponentSCRBCSCRB/KC
E ˙ D ( M W ) C ˙ D ( $ / h ) Z ˙ k ( $ / h ) C ˙ D + Z ˙ k + C ˙ L ( $ / h ) f k ( % ) r k ( % ) E ˙ D ( M W ) C ˙ D ( $ / h ) Z ˙ k ( $ / h ) C ˙ D + Z ˙ k + C ˙ L ( $ / h ) f k ( % ) r k ( % )
Reactor75.4317465053679974.3218.5575.4317465053679974.3218.55
Turbine119.73541.32202274380.2724.3119.73541.32202274380.2724.31
Compressor111.28384.9297.9682.843.6323.3611.28384.9297.9682.843.6323.36
Compressor26.593224.9108332.932.4513.96.593224.9108332.932.4513.9
Pre_cooler247.9113158.5411323.60.645432.1410.99301.57.786309.32.5174190
HTR12.61346.137.2383.39.7065.65112.61346.137.2383.39.7065.651
LTR19.29529.241.84571.17.32613.119.29529.241.84571.17.32613.1
Pre_cooler1------6.097167.314.661828.05825.17
KCHTR------0.614421.811.90523.718.034189.7
KCLTR------0.088393.1341.4814.61532.09384.2
Superheater------0.466812.819.28522.142.0211.92
Turbine2------3.113110.4213.6324.165.9240.43
Mixer------0.24-----
Valve------0.051-----
Separator------3.321-----
Pump------0.10125.04310.0115.0566.4945.57
Condenser------6.817241.714.52256.25.6682400
Overall system192.855087774912,83686.2147.37176.84636801312,65087.5853.08
Table 8. Optimum values of decision and performance parameters for the SCRBC and the SCRB/KC.
ParameterSCRBCSCRB/KC
Optimal CasesOptimal Cases
TODEODTODEOD
PRc3.012.273.392.39
PRp--3.452.718
T 11 ( K ) --357.66349.5
ΔTsup (K)--01.5
ΔTpinch (K)--33
η e x   ( % ) 54.853.0460.3157.93
cp,tot ($/GJ)11.210.8710.7310.34
W ˙ net   ( MW ) 237.6229.8261.3251
W ˙ net , SCRBC   ( MW ) 237.6229.8236.4232.5
W ˙ net , KC   ( MW ) --24.918.5
m ˙ CO 2   ( kg / s ) 294033072.8243227
m ˙ NH 3 / H 2 O   ( kg / s ) --196181
Z ˙ t o t   ( $ / h ) 7819729183447627
C ˙ D , t o t   ( $ / h ) 4569.54949.44331.54516.5
x0.2730.1980.2940.216

