Article

Automatic Type Recognition and Mapping of Global Tropical Cyclone Disaster Chains (TDC)

1
School of Geography, Beijing Normal University, Beijing 100875, China
2
Laboratory of Regional Geography, Beijing Normal University, Beijing 100875, China
3
Department of Geography, Western Michigan University, 1903 W Michigan Ave, Kalamazoo, MI 49008-5424, USA
4
School of Agriculture & Forestry Economics and Management, Lanzhou University of Finance and Economics, Lanzhou 730101, China
*
Author to whom correspondence should be addressed.
Sustainability 2016, 8(10), 1066; https://doi.org/10.3390/su8101066
Submission received: 26 July 2016 / Revised: 27 September 2016 / Accepted: 18 October 2016 / Published: 21 October 2016
(This article belongs to the Special Issue Resilience to Natural and Man-Made Disasters)

Abstract

:
The catastrophic events caused by meteorological disasters are becoming more severe in the context of global warming. The disaster chains triggered by Tropical Cyclones induce the serious losses of population and economy. It is necessary to make the regional type recognition of Tropical Cyclone Disaster Chain (TDC) effective in order to make targeted preventions. This study mainly explores the method of automatic recognition and the mapping of TDC and designs a software system. We constructed an automatic recognition system in terms of the characteristics of a hazard-formative environment based on the theory of a natural disaster system. The ArcEngine components enable an intelligent software system to present results by the automatic mapping approach. The study data comes from global metadata such as Digital Elevation Model (DEM), terrain slope, population density and Gross Domestic Product (GDP). The result shows that: (1) according to the characteristic of geomorphology type, we establish a type of recognition system for global TDC; (2) based on the recognition principle, we design a software system with the functions of automatic recognition and mapping; and (3) we validate the type of distribution in terms of real cases of TDC. The result shows that the automatic recognition function has good reliability. The study can provide the basis for targeted regional disaster prevention strategy, as well as regional sustainable development.

1. Introduction

Disaster chains can be defined as the phenomenon that one disaster triggers a series of disasters, and they can be in both serial mode and concurrent mode [1]. The Tropical Cyclone Disaster Chain (TDC) is the multi-disaster process including floods, landslides and storm surges that are triggered by Tropical Cyclones. Global warming [2] has been hypothesized to increase the intensity and frequency of the extreme meteorological events and their catastrophic outcomes [3]. The intensity and destructive power of Tropical Cyclones (TC) are increasing recently, especially the percentage of super Tropical Cyclones [4,5,6]. More intensified TC increased the possibility of catastrophic events. In 2005, Hurricane Katrina induced storm surges and devastated New Orleans’ infrastructure and lifeline systems [7,8,9]. Typhoon Fanapi in 2010 brought continuous heavy rainfall and induced debris flow and landslides that resulted in 66 people dead or missing in Magui town [10]. Serious damage can be caused by the accumulative and amplified effect [11,12] of the TDC. TDC related catastrophic problems have attracted a lot of attention from governments and institutions [13].
At present, the research on the TDC is still in its early stages. There are two ways to diagnose disaster chains [14]: the first one is based on expertise, a method that recognizes the types of disaster chains by expert experience and experiments or historical cases. Shi [15] uses previous research work and practical experience to summarize four typical types of disaster chains: typhoon-storms disaster chains, cold wave disaster chains, drought disaster chains and earthquake disaster chains. In addition, some scholars recognize the typical types of TDC based on the geographical characteristics of Southeast China, Yangtze River Delta and Fujian [16,17,18,19] from regional literature information of typical Tropical Cyclone cases and disasters. International scholars prefer to discuss the complicated relationships between various disasters. Gill et al. [20] establish 90 kinds of relationships among 21 natural disasters including Tropical Cyclones drawn from six groups (geophysical, hydrological, shallow Earth, atmospheric, biophysical, and space). In addition, some other international scholars also recognize the interaction between Tropical Cyclones and other disasters from information of Tropical Cyclone cases [21,22]. The second one is the complex network method [23], a way to treat disasters and events as nodes and build a chain network model based on the connectivity between each node. Each pathway is called a disaster chain to achieve the purpose of disaster chain recognition [24,25,26]. Both methods summarize types of TDCs in their own study area based on historical events and cases. We can make an in-depth analysis on the formation characteristics of hazard-formative environments for each type of disaster chain by the classification system in the methods above, so as to establish the corresponding relationship between the hazard types and formation environment. Therefore, it makes the recognition of regional disaster chain types possible.
Regarding the aspect of mapping TDC, most studies focus on multi-hazard mapping of Tropical Cyclone related disasters. For example, the Munich Reinsurance Company (MRC) published the global distribution and intensity maps on five groups of significant disasters in 2001, which included earthquakes and volcanoes, storms (Tropical Cyclones), floods (storm surges and rainstorms), ocean and climate changes [27]. The Center for Hazards and Risk Research at Columbia University (CHRR) made the evaluation and mapping on the global frequency, population mortality and economic losses of six disasters in 2005, which included Tropical Cyclones, floods and landslides [28]. The United Nations International Strategy for Disaster Reduction, Europe (UNISDR, EUR) published the population mortality risk maps, which included Tropical Cyclones, floods and landslides [29]. Shi and Kasperson punished the World Atlas of Natural Disaster Risk, which evaluated the hazard and losses risk of populations and economies, and made the distribution mapping of Tropical Cyclones, landslides, floods, storm surges, and so on [30]. However, mapping studies specifically focused on TDC are still very rare.
The previous studies are mainly focused on recognizing and summarizing the types of TDC. They build the classification systems in their own study areas and analyze the interactions between hazards. They are based on the principle of disaster system theory that hazard-formative environments determine hazards, while regional characteristics affect the types of hazards. In this study, we plan to make in-depth analysis of characteristics of the hazard-formative environments in regions affected by Tropical Cyclones. We will also construct the global classification system of TDC in terms of the formation mechanism of this specific type of disaster. We will finally establish the relationships between environmental factors and types of disaster chains and finally achieve the goal of type recognition of TDC based on hazard-formative environments.
Tropical Cyclone itself has more complex features than the general disasters. It can generate both strong wind and heavy rain. They can cause more disaster risk when they meet with the special hazard-formative environment. Different types of secondary disasters are also formed to constitute disaster chains. Due to the wide spatial influence area of Tropical Cyclone, there are significant spatial and temporal differences in the hazard forming areas. Therefore, we built a discrimination standard for the relationship between hazard-formative environments and types of disaster chains, in order to form an auto-recognition system to diagnose the types of disaster chains by artificial intelligence. It can save time and remain accurate compared with the previous methods. There is little research on the mapping of TDC. The development of GIS technology provides ArcEngine software (Version 10.1, Environmental Systems Research Institute, Inc., RedLands, CA, USA) with convenient application interfaces to implement the geographic analysis and cartography functions by programming. By summarizing results of regional characteristics, we are able to map the global TDC.
In this paper, we finished the regionalization of hazard-formative environment, the classification of global TDC, and the construction of the auto-recognition system of disaster chain type based on the disaster system theory [30]. Then, we designed and compiled a software with the auto-recognition and auto-mapping functions based on ArcEngine components and realized type recognition and the mapping of disaster chains. Nowadays, disasters seriously affect regional sustainable development from their adverse effects on the sustainability of resources and environments and damage to the natural resources of land, water, oceans, animals and plants. Disasters can also damage the sustainability of economies through significant reduction in agricultural yield and major destruction in industrial infrastructure. In addition, they cause large casualties and undermine the social stability. Extreme weather events including Tropical Cyclones will possibly lead to higher risks to sustainability under the anthropogenic climate change. The study provides a technical approach to understand regional disaster characteristics of Tropical Cyclones (possible TDC types). Local governments or decision makers can use this method for better decision making when facing Tropical Cyclone disaster. It can provide better theoretical basis of targeted disaster prevention and mitigation as well as disaster policy development for the TDC, which serve as the basis of future sustainable development.

2. Materials and Methods

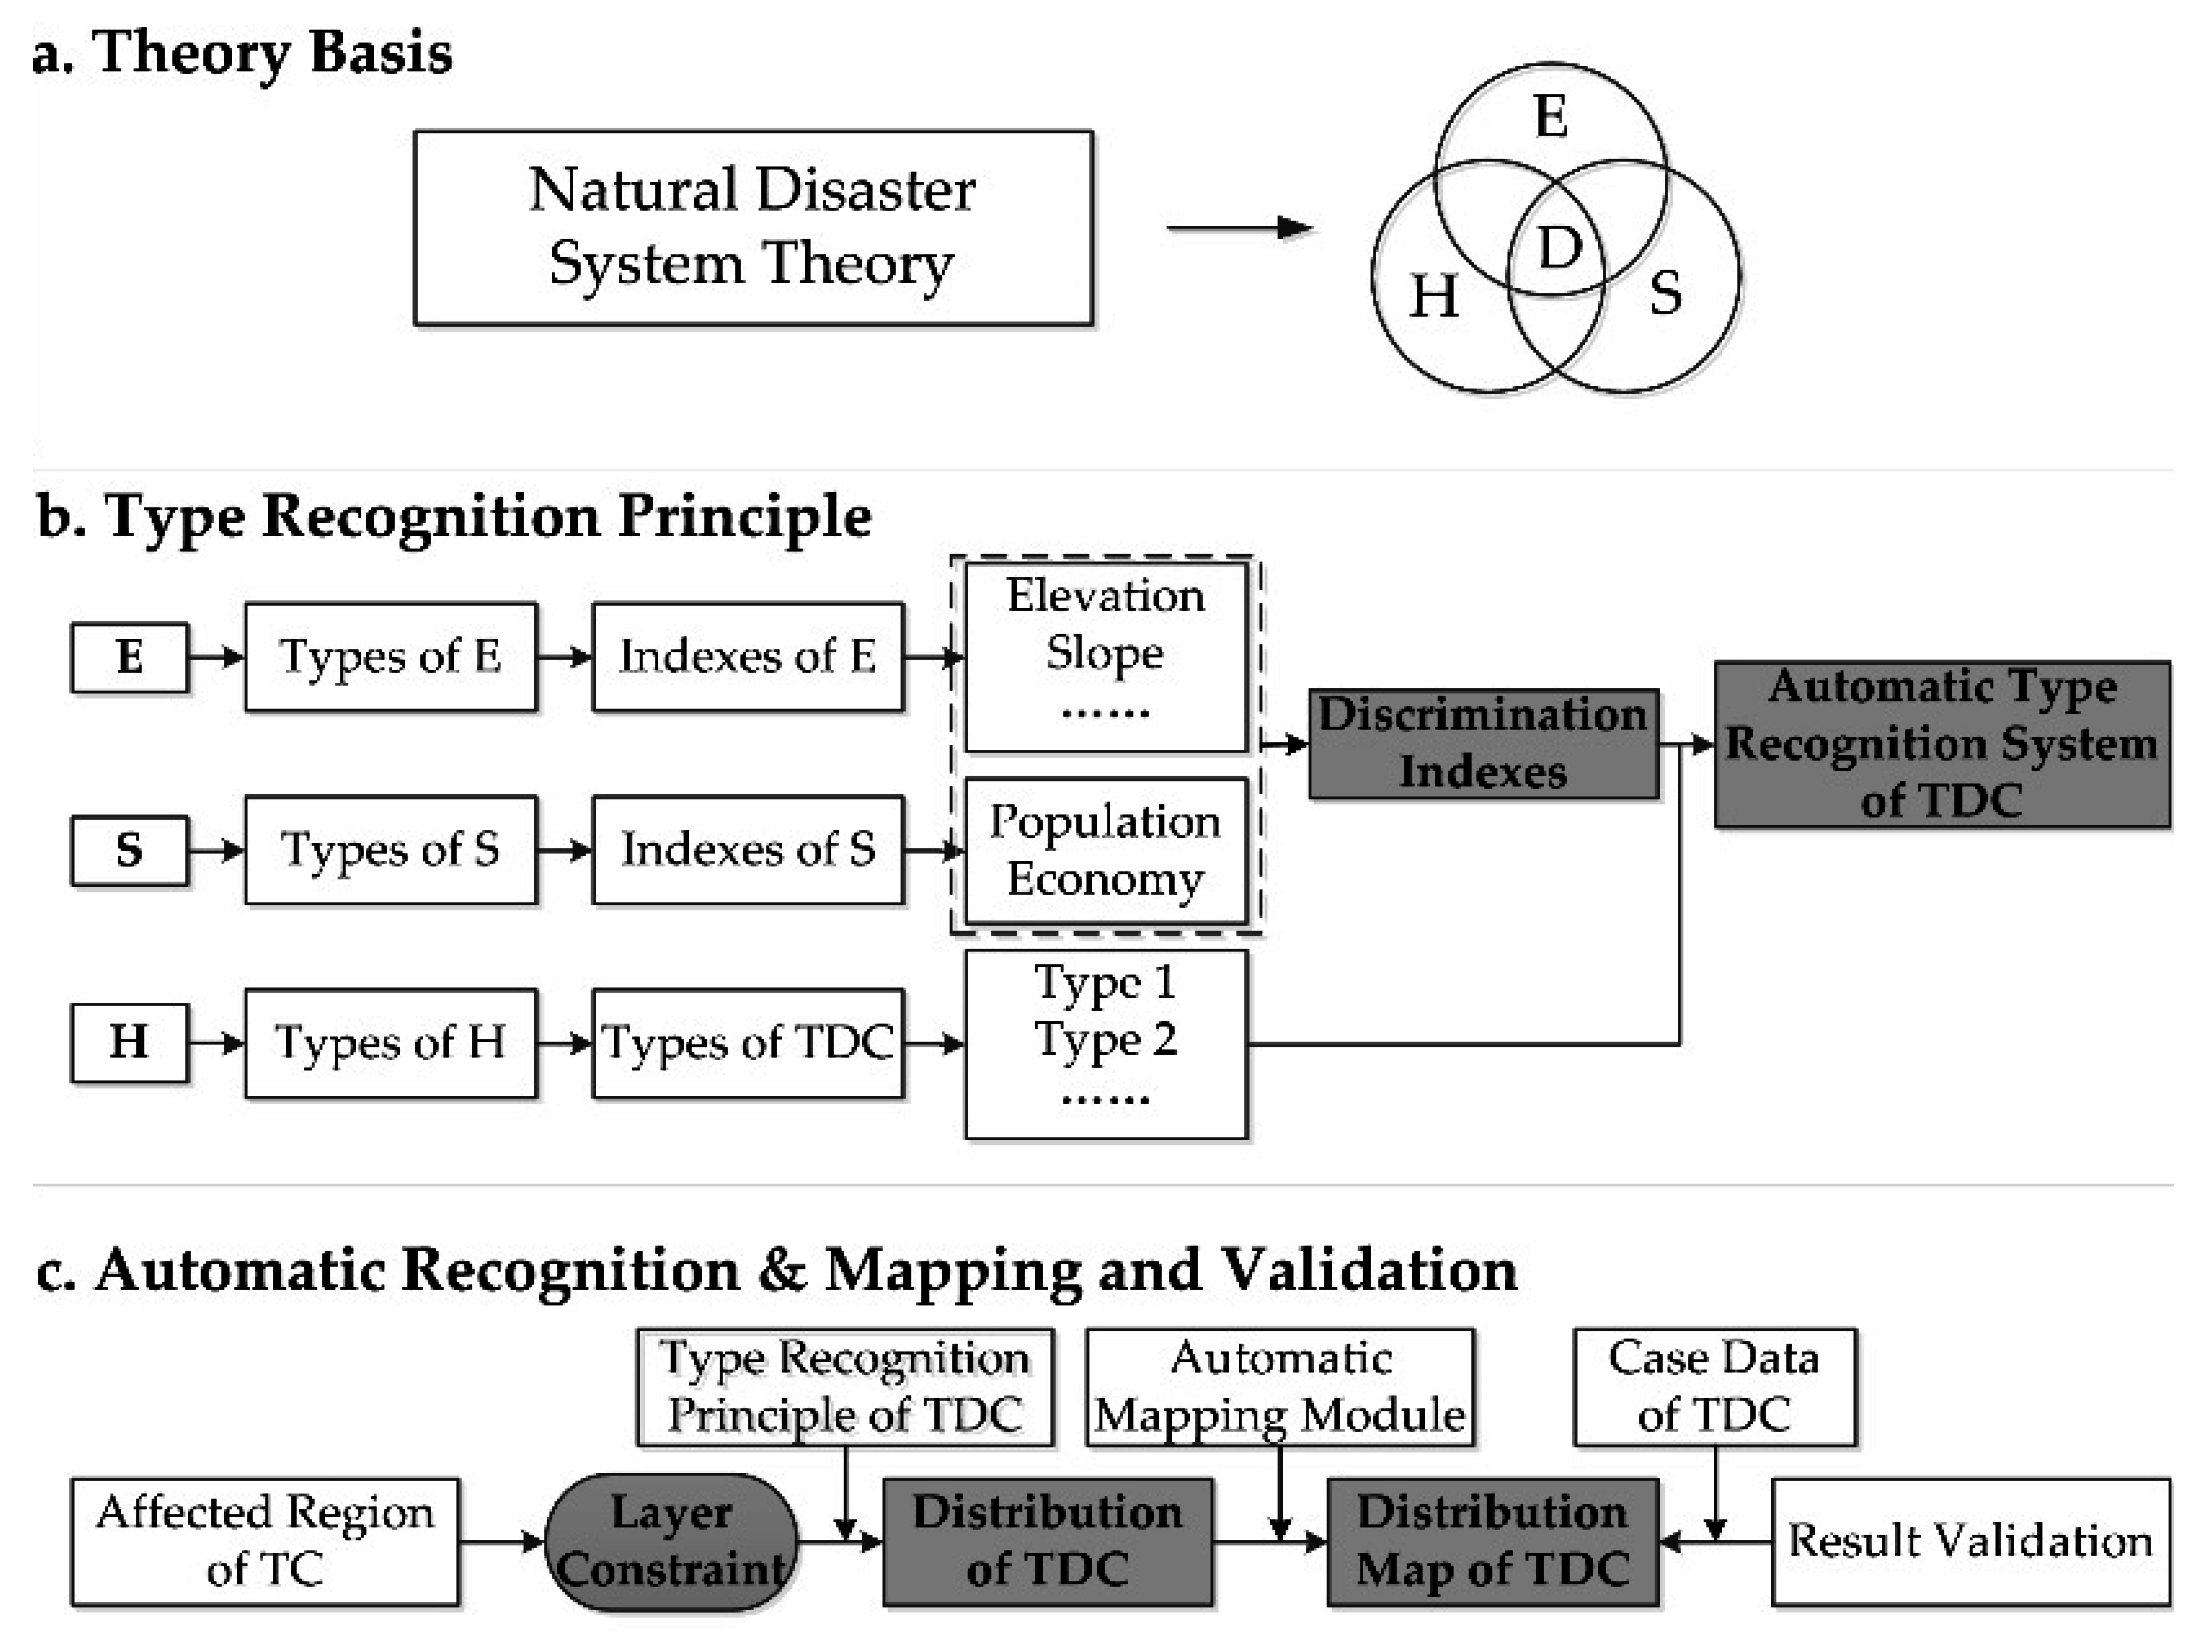
2.1. Basic Ideas and Overall Design

The disaster itself is a complex system, which can be thought of as interactions of hazard-formative environments, hazards and hazard-affected bodies (exposure and vulnerability). These three components and their mutual relationships determine the possibilities and losses of disasters [31]. The characteristics of hazard-formative environments determine the formation of hazard types, while the characteristics of hazards provide sources of secondary disasters. For example, storms bring heavy rainfall, which can induce landslides in mountainous area and floods in the plain. Rainfall provides the necessary sources of extra water for these disasters. In addition, characteristics of hazard-affected bodies affect the amount of disaster losses. Disasters happening in the regions with low populations and weak economies can cause few losses and be referred to as no-harm disasters. We need to consider the three factors of disaster systems comprehensively for the regional type recognition of disaster chains, and the hazard-formative environment is the first decisive one. Therefore, we developed several indexes of hazard-formative environments as the criteria to achieve the goal of disaster chain type recognition. Here, we chose the three-second gust wind field as the affected region by Tropical Cyclone. We assumed the possibility of both heavy rain and strong wind in this region.
The design of this research contains four steps (Figure 1):
(1)
Classify hazard-formative environments (E) and hazard-affected body (S) of Tropical Cyclones and extract the discrimination indexes of E and S, and then classify TDC types based on the trigger relationships between hazards related to Tropical Cyclones.
(2)
Construct recognition systems of TDC from the corresponding relationships between environment types, TDC types and discrimination indexes.
(3)
According to recognition principle of TDC, do the automatic recognition with the method of factor layer constraints and spatial overlay to obtain the type distribution. In particular, we need to eliminate the area unaffected by disaster, with the consideration of hazard-affected bodies.
(4)
Based on the recognition results, we do the automatic mapping with ArcGIS technology and validate the results with case data of TDCs.

2.2. Data

The data we use here mainly includes geographic based maps, hazard-formative environment data, hazard data and hazard-affected body data (Table 1). Using the Tropical Cyclone best track, three-second Tropical Cyclone gust wind fields were obtained globally by the planetary boundary layer model with global Tropical Cyclone track data [32,33,34,35].

2.3. Classification and Type of Recognition Principle

2.3.1. Classification of TDC

According to the characteristics of hazard-formative environment (E), the regions affected by Tropical Cyclones were divided into eight types. Then, we summarized hazard types involved in Tropical Cyclones based on past literature. They include Tropical Cyclone (TC), wind (WI), rainstorm (RS), sea wave (SW), storm surge (SS), flood (FL), mountain torrent (MT), landslide (LA), rock collapse (RC), debris flow (DF), seawater encroachment (SE) [36,37]. Finally, we matched those 11 types of hazard with eight types of E from their trigger relationships [20,38,39,40,41]. In addition, we determined the types of TDCs based on those relationships (Table 2).

2.3.2. Type Recognition Principle of TDCs

Based on the classification of TDCs, we constructed the relationships between digital map layers and types of disaster chains, and set the discrimination standard as an index system according to the characteristics of hazard-formative environments, in order to form the type recognition principle, the recognition principle where we used an index system to diagnose the type regions of TDC with the method of layer constraint. Based on the three factors of disaster systems (hazard-formative environments, hazards, hazard-affected bodies), we used the global three-second gust wind field as the affected region of TDC. We eliminated the region with <1 population density (D) or <$50,000 GDP because these regions have few casualties and economic losses. The obtained map layers were used as the type recognition range of TDC.
Here, we set the discrimination standard of map layers, to build an index system used in the layer constraint. First, the recognition range was divided into the ocean and the land, and the ocean was subdivided into the island and the sea area. The discrimination standard of island is that the area is less than 5000 km2. In the island region, we treated the area within a distance of 1 km from the coastline as the AI type region. We divided the rest region into a mountain (hill) area (elevation ≥ 200 m and slope ≥ 8 degrees) and a plain area [42] (elevation < 200 m or 200 m ≤ elevation < 500 m and slope < 8 degrees), which were treated as AII and AIII/AIV type regions, respectively. In our study, disaster chains of sea areas were not considered. Then, we treated the land region within 10 km of the coastal line as the coastal zone and subdivided it into plain coastal zone, mountainous coastal zone and estuarine coastal zone according to global bathymetry. In addition, there are CI, DI and EI type regions within 1 km of coastal line and CII, DIII/DIV and EII type regions between 1 and 10 km to the coastal line. We defined the region that is more than 10 km from the coastal line as the inland zone [43]. The inland zone was divided into a mountain (hill) area and a plain area (FIII/FIV and GII type regions). We then obtained the plateau (tableland) range by global geomorphology data from United States Geological Survey (USGS) [44] and subdivided it into a flat area (HII, slope < 8 degrees) and a rugged area (HII/HIV, slope > 8 degrees). Here, we built the 3D corresponding relationship of “disaster chain type-constraint layer–layer discrimination standard”, and formed an auto-recognition principle of TDC in Table 2.

3. Results

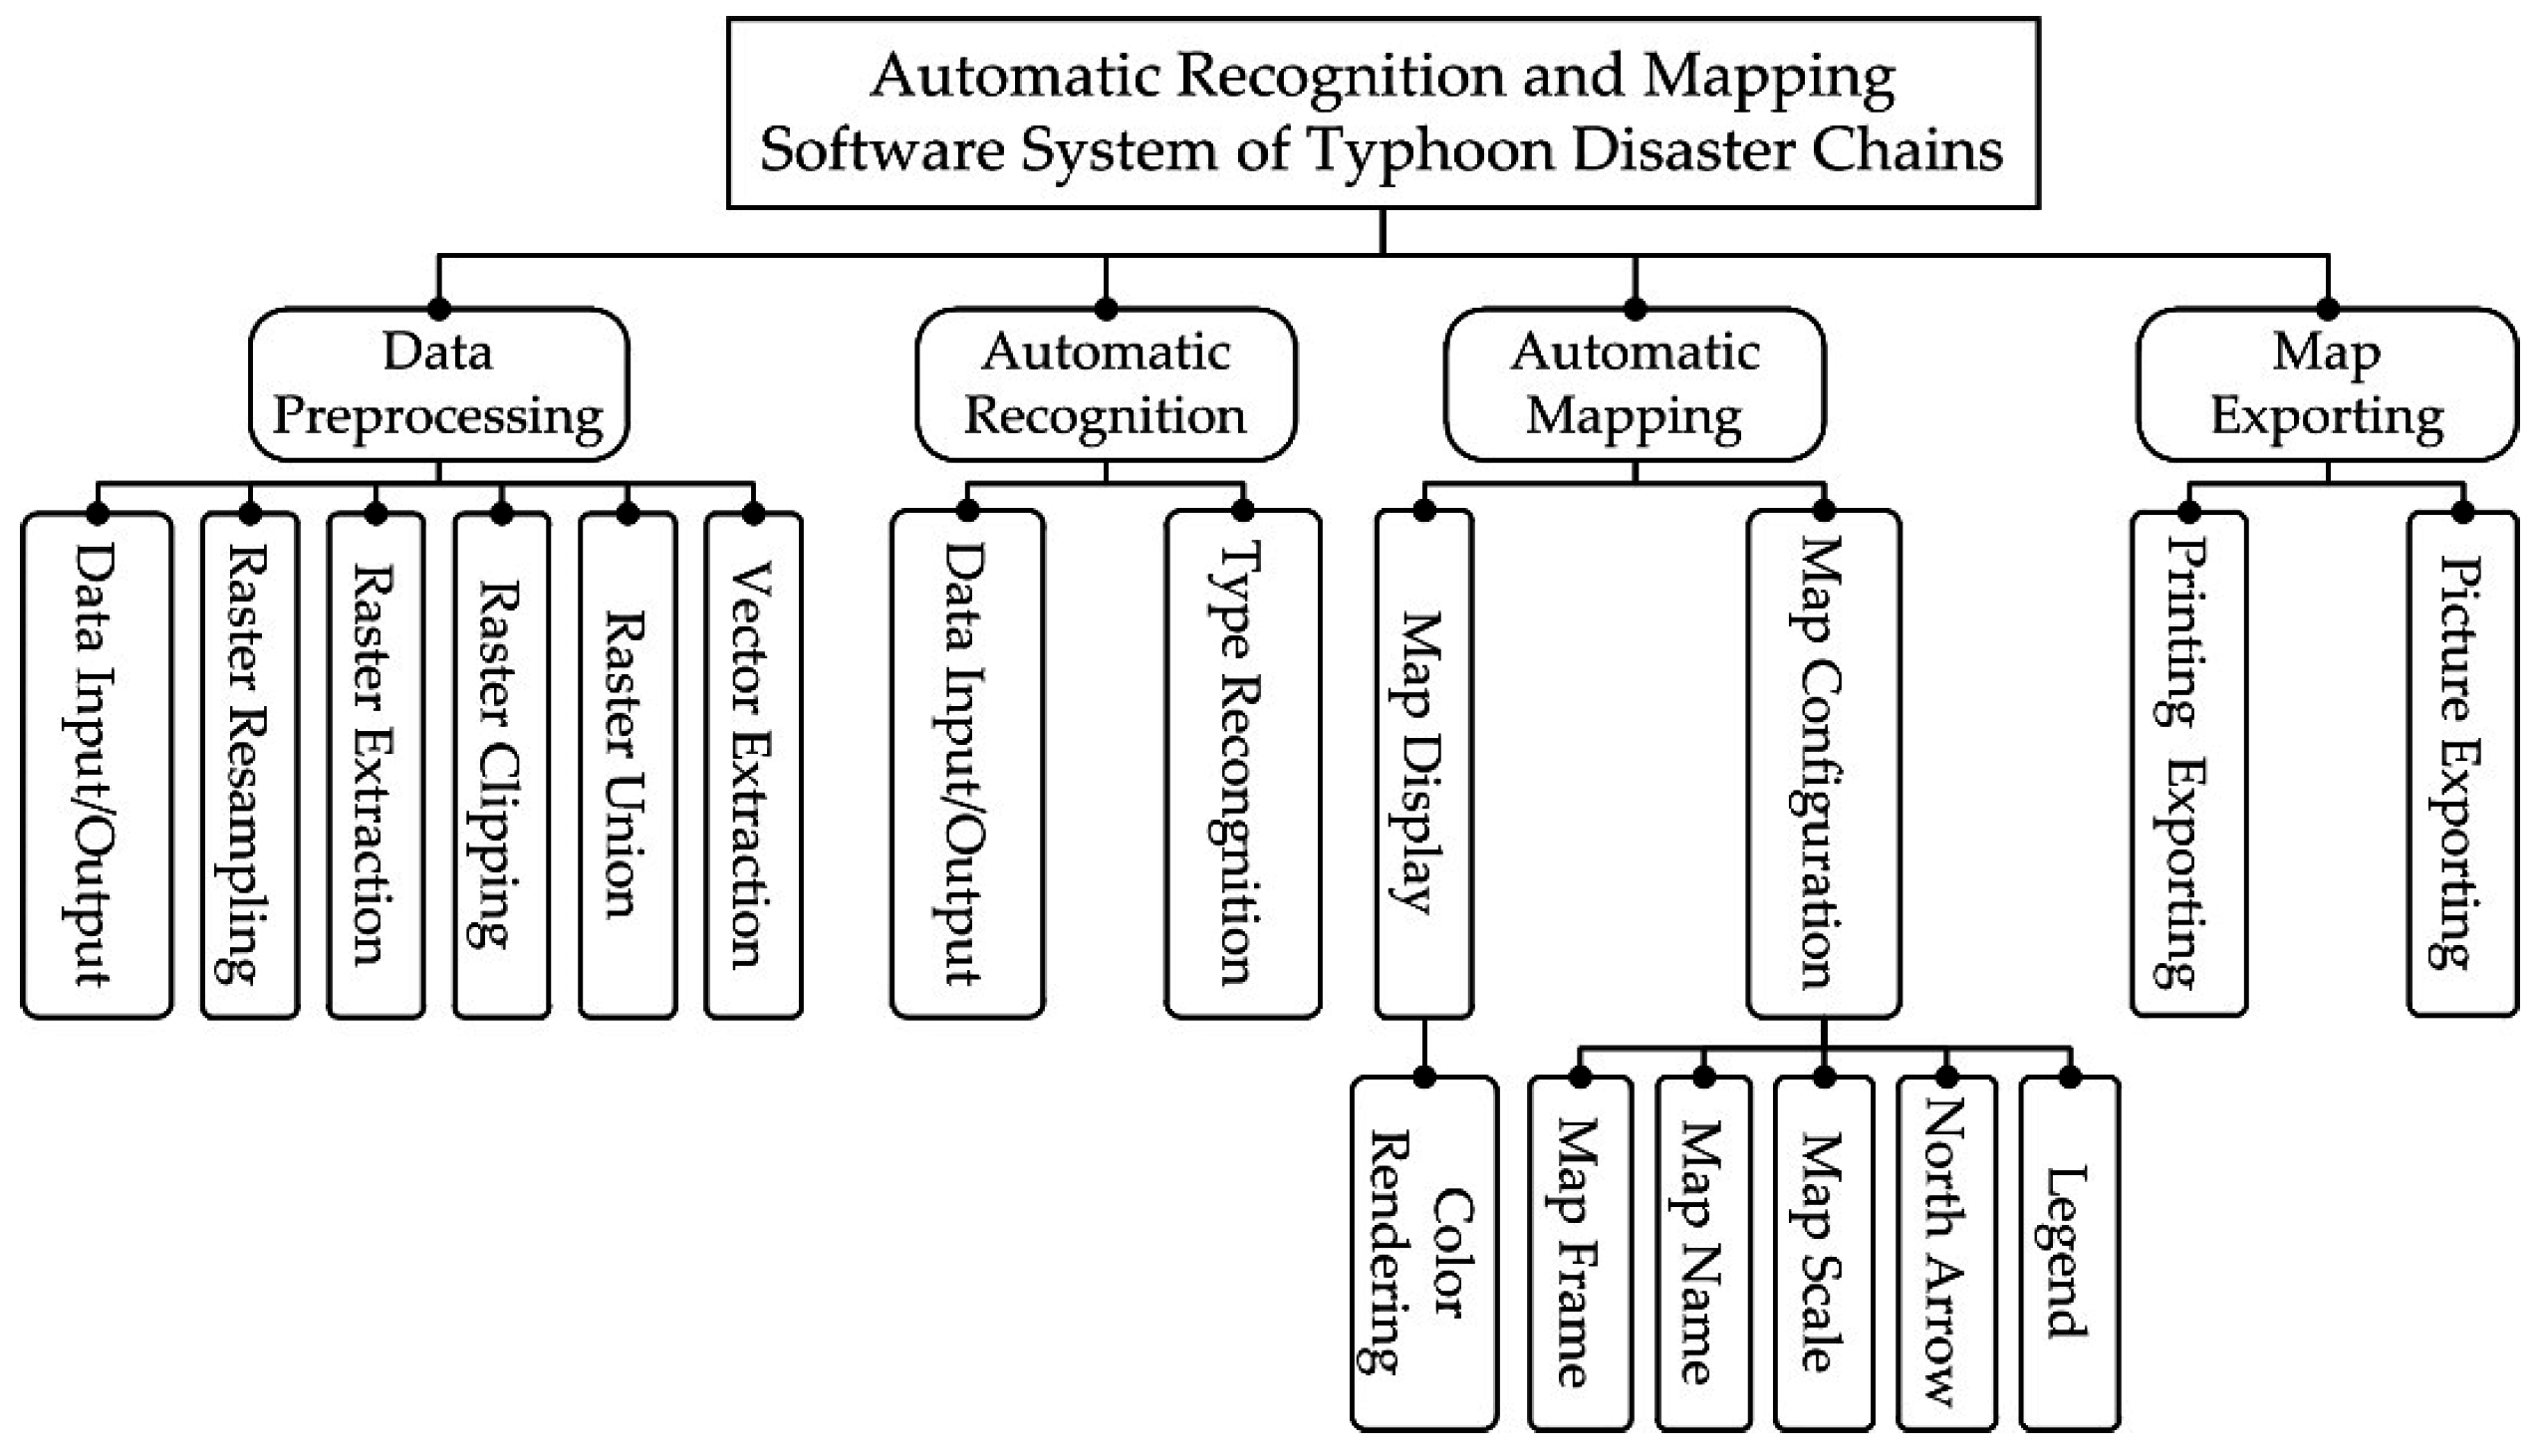
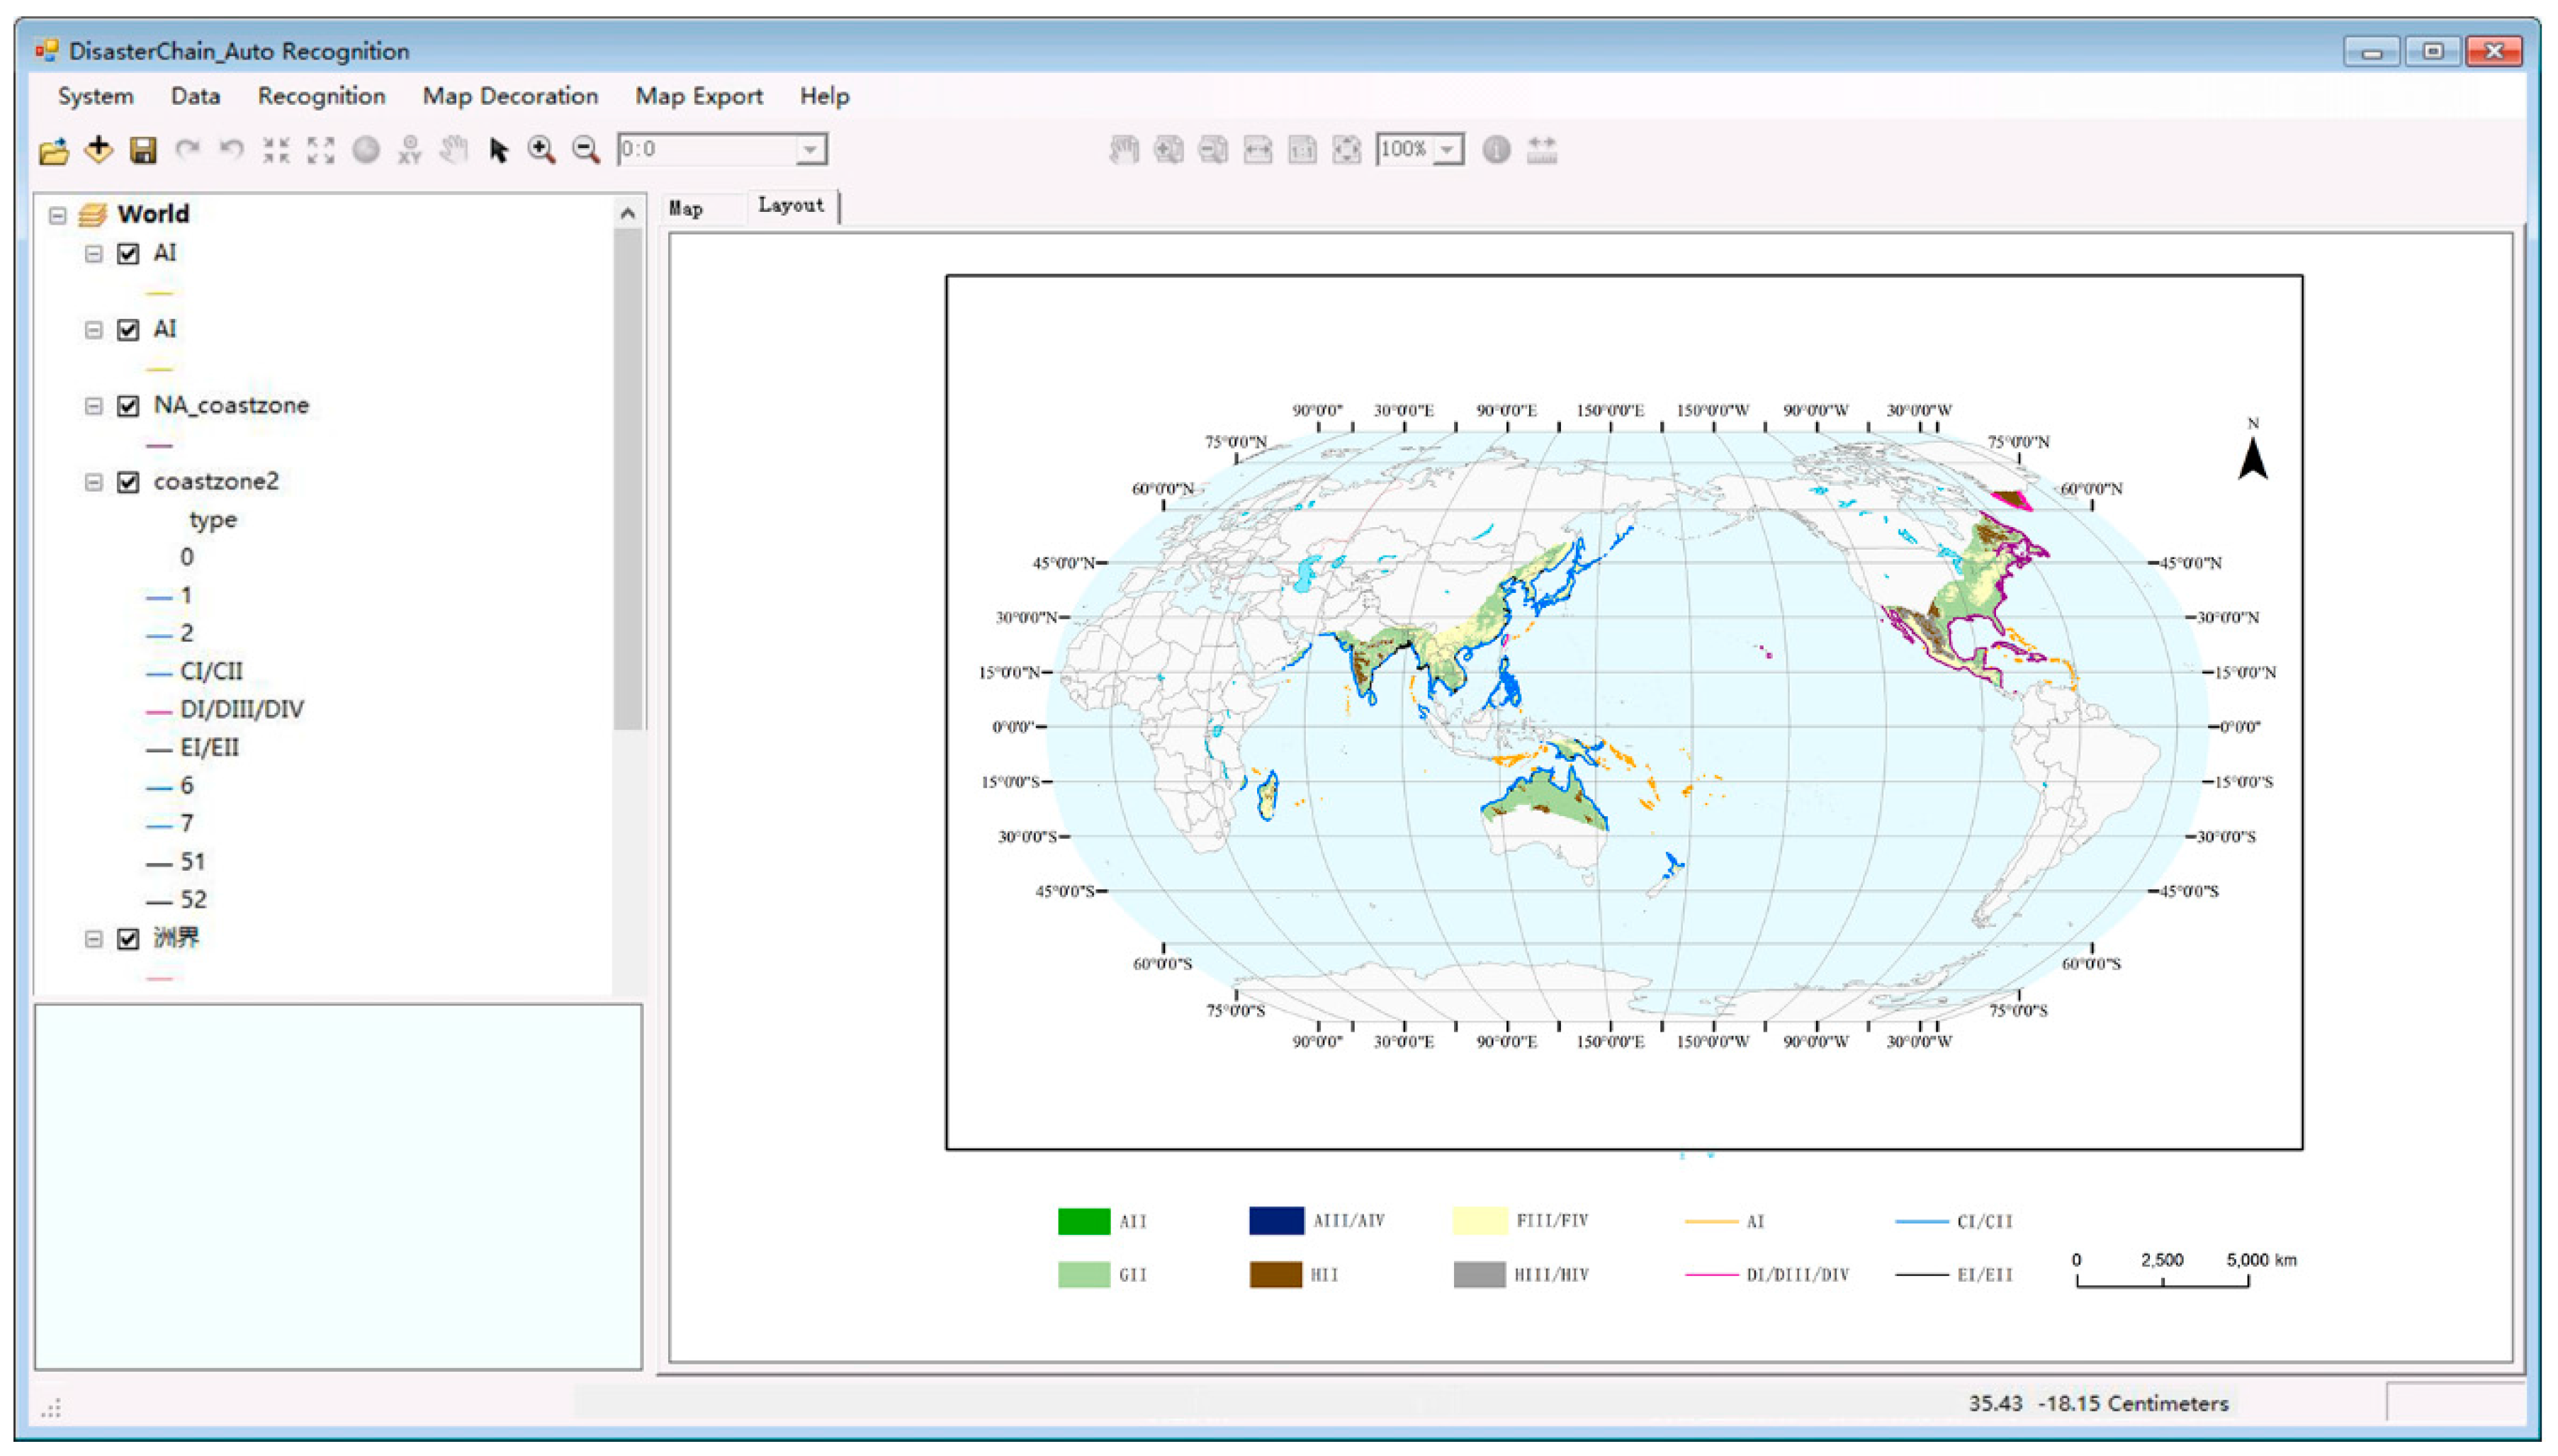
3.1. Software System Design

3.1.1. Software Frame and Function

The software system was compiled by the ArcEngine GIS development components and Visual Studio 2012 (Ultimate(x64), Microsoft Corporation, Redmond, WA, USA) C# language within a Windows 7 operating system (Ultimate with Service Pack1(x64), Microsoft Corporation, Redmond, WA, USA). The software system framework (Figure 2) has four parts: data preprocessing, automatic recognition, automatic mapping and map exporting. The main functions include data input/output, raster data resampling, raster data extraction, raster data clipping, vector data extraction, regional disaster chain recognition, map display, map configuration, printing exporting and picture exporting.
The software system is a combined framework of automatic and artificial mode. Recognition module and mapping module use an automatic processing mode and the other two modules use an artificial processing mode. Firstly, users can input raw data (hazard-formative environment data, hazard data and hazard-affected body data) by the data preprocessing module, in order to process the data to meet the criteria of the recognition module. Then, they can, in turn, run the recognition module and mapping modules, where users just set the initial parameters, processing methods and styles of map elements, to execute regional type recognition of TDC and mapping (map display and map configuration) with the recognition result automatically. Finally, they can choose the output methods they want in order to export maps by the map exporting module.

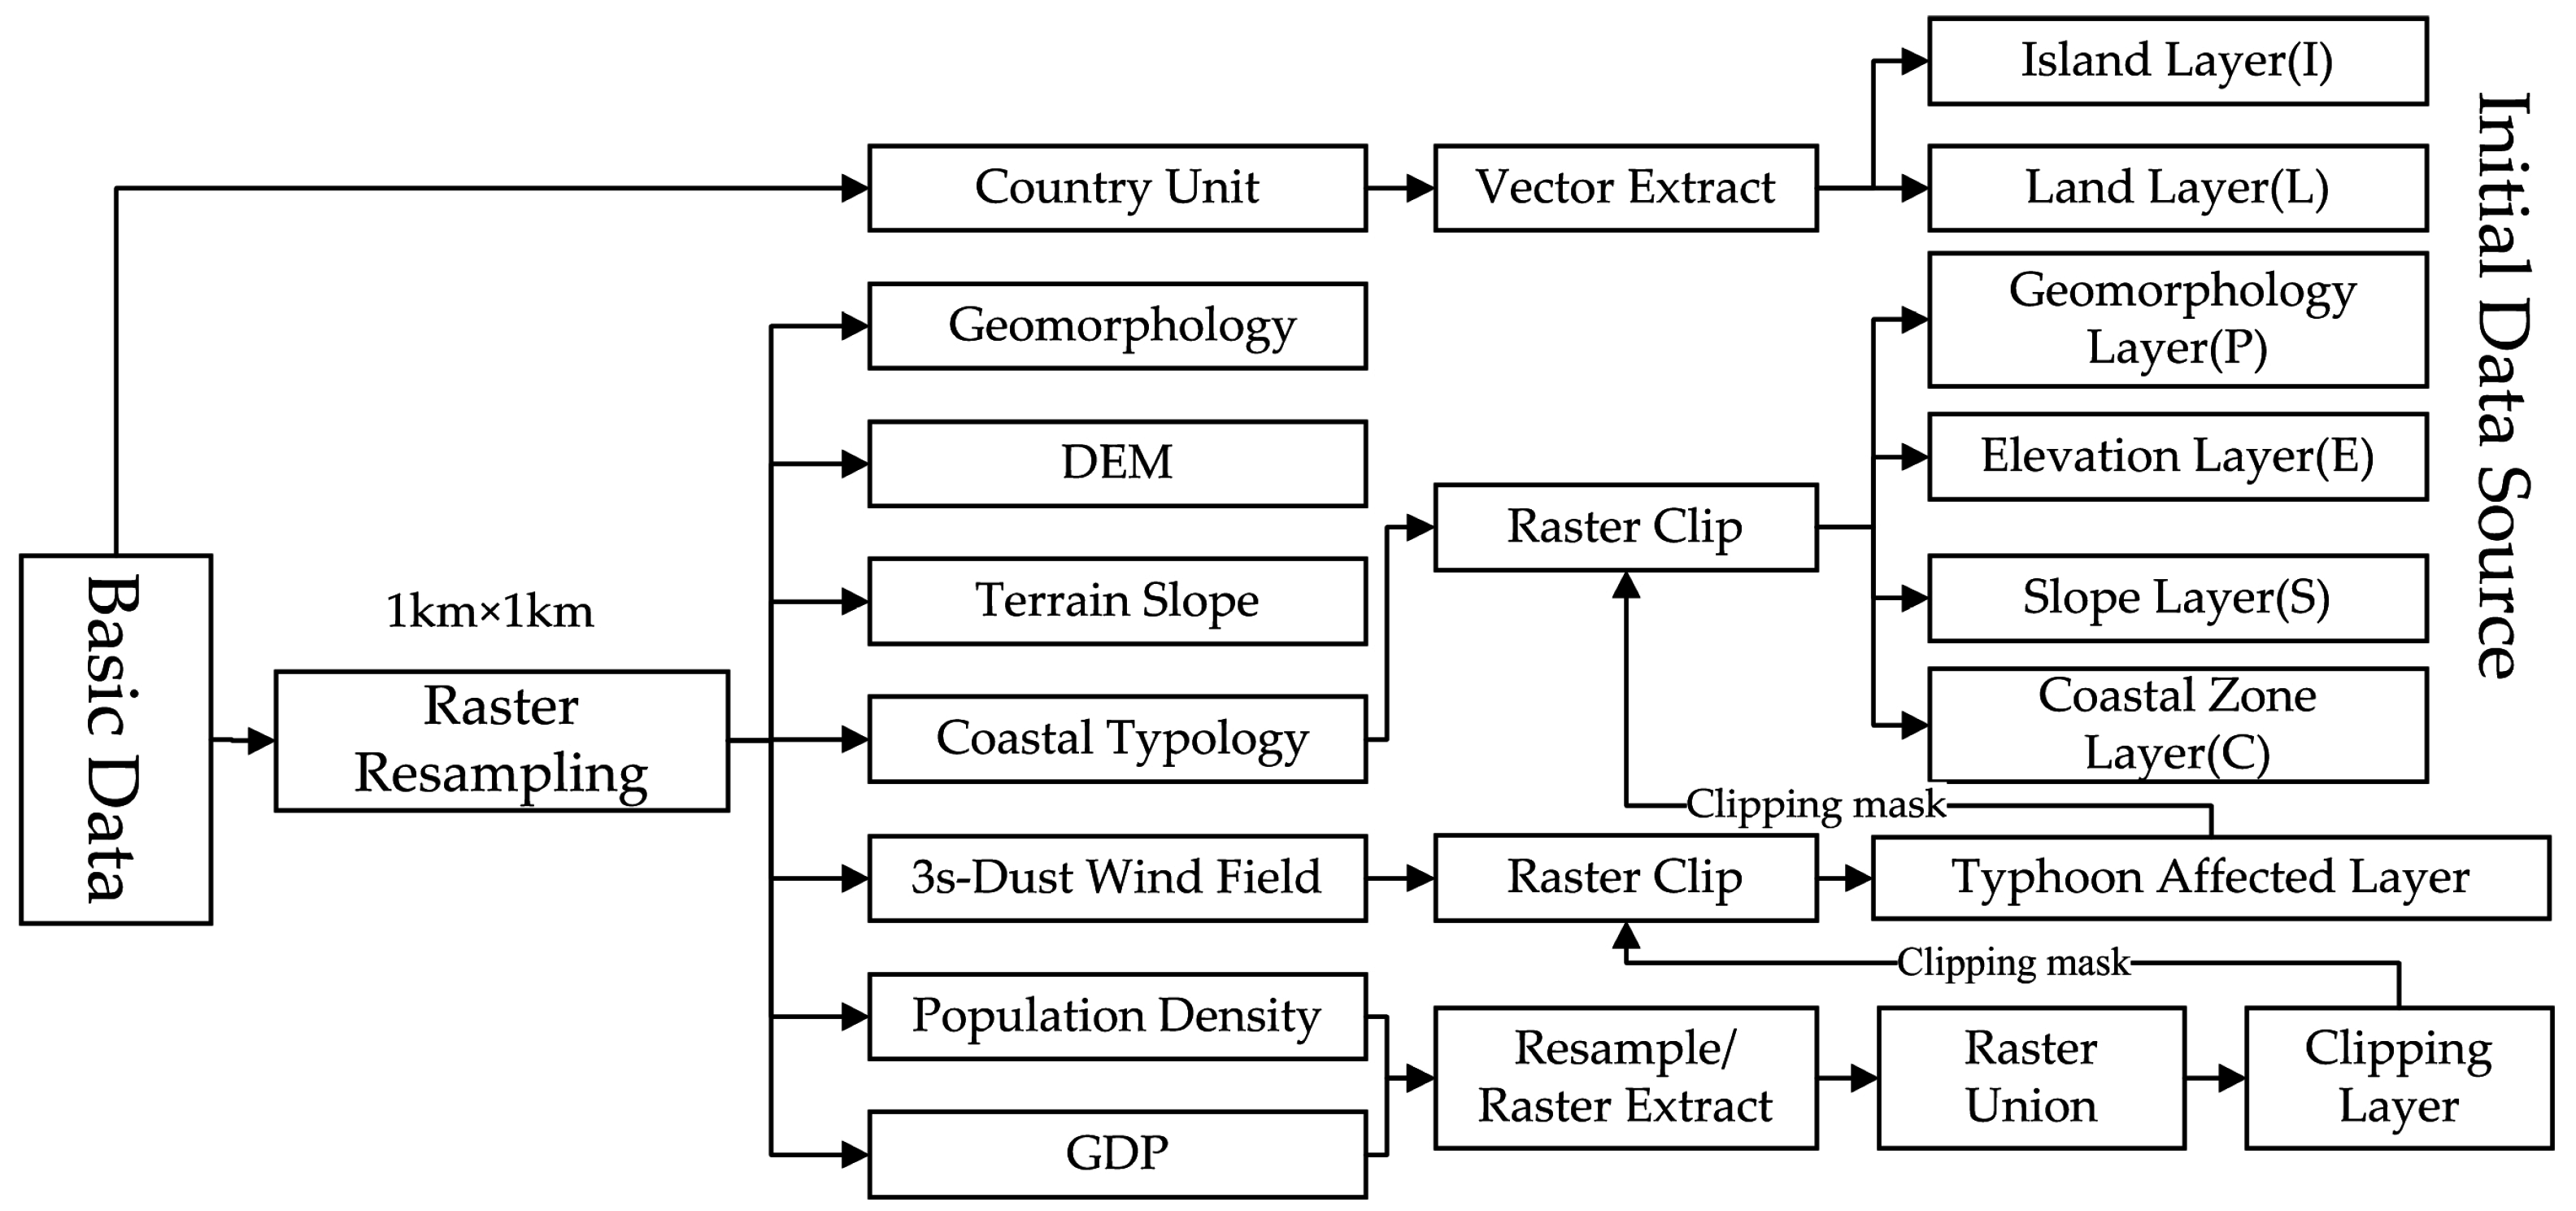
3.1.2. Data Preprocessing Module

This module is mainly for data input/output and the preprocessing of raw data (Figure 3). The formats of basic data used by software are not consistent, thus they need to be unified. In addition, the data of hazard-formative environments, hazards and hazard-affected bodies need to be clipped, extracted and merged to provide the initial data source for the automatic recognition module. Thus, this module needs to read basic data in Table 1 by user input, and call the Resample and ExtractByMask classes, IMapAlgebraOp, IReclassOp, ILogicalOp and IQueryFilter Interfaces in the ArcEngine development components. The main implementation process is shown as below:
(1)
Unify the format of raster data. We call the Resample class of the ESRI.ArcGIS.DataManagementTools library to unify the grid size of hazard-formative environment data, hazard data and hazard-affected body data to 1 km × 1 km by using the GIS resampling method of Bilinear.
(2)
Extract hazard-affected body layers. To extract two layers with population density of more than 1 person per km2 and GDP of more than $50,000 by using raster calculate interface (IMapAlgebraOp) and resample interface (IReclassOp).
(3)
Merge hazard-affected body layers (population and economy). We call the raster overlay interface (ILogicalOp) of ESRI.ArcGIS.SpatialAnalyst library and use the BooleanOr method to do this.
(4)
Clear hazard-affected body layers. Obtain the recognition region of TDC by clipping the three-second gust wind fields with the mask extraction class of ESRI.ArcGIS.SpatialAnalystTools library (ExtractByMask).
(5)
Extract hazard-formative environment layers. Extract elevation layer (E), slope layer (S), coastal zone layer (C) and geomorphology layer (P) using ExtractByMask class with the recognition regions obtained by the fourth step as masks.
(6)
Extract island layers. Extract island layer (I) and land layer (L) through properties sorting by the vector attributes interface (IQueryFilter).

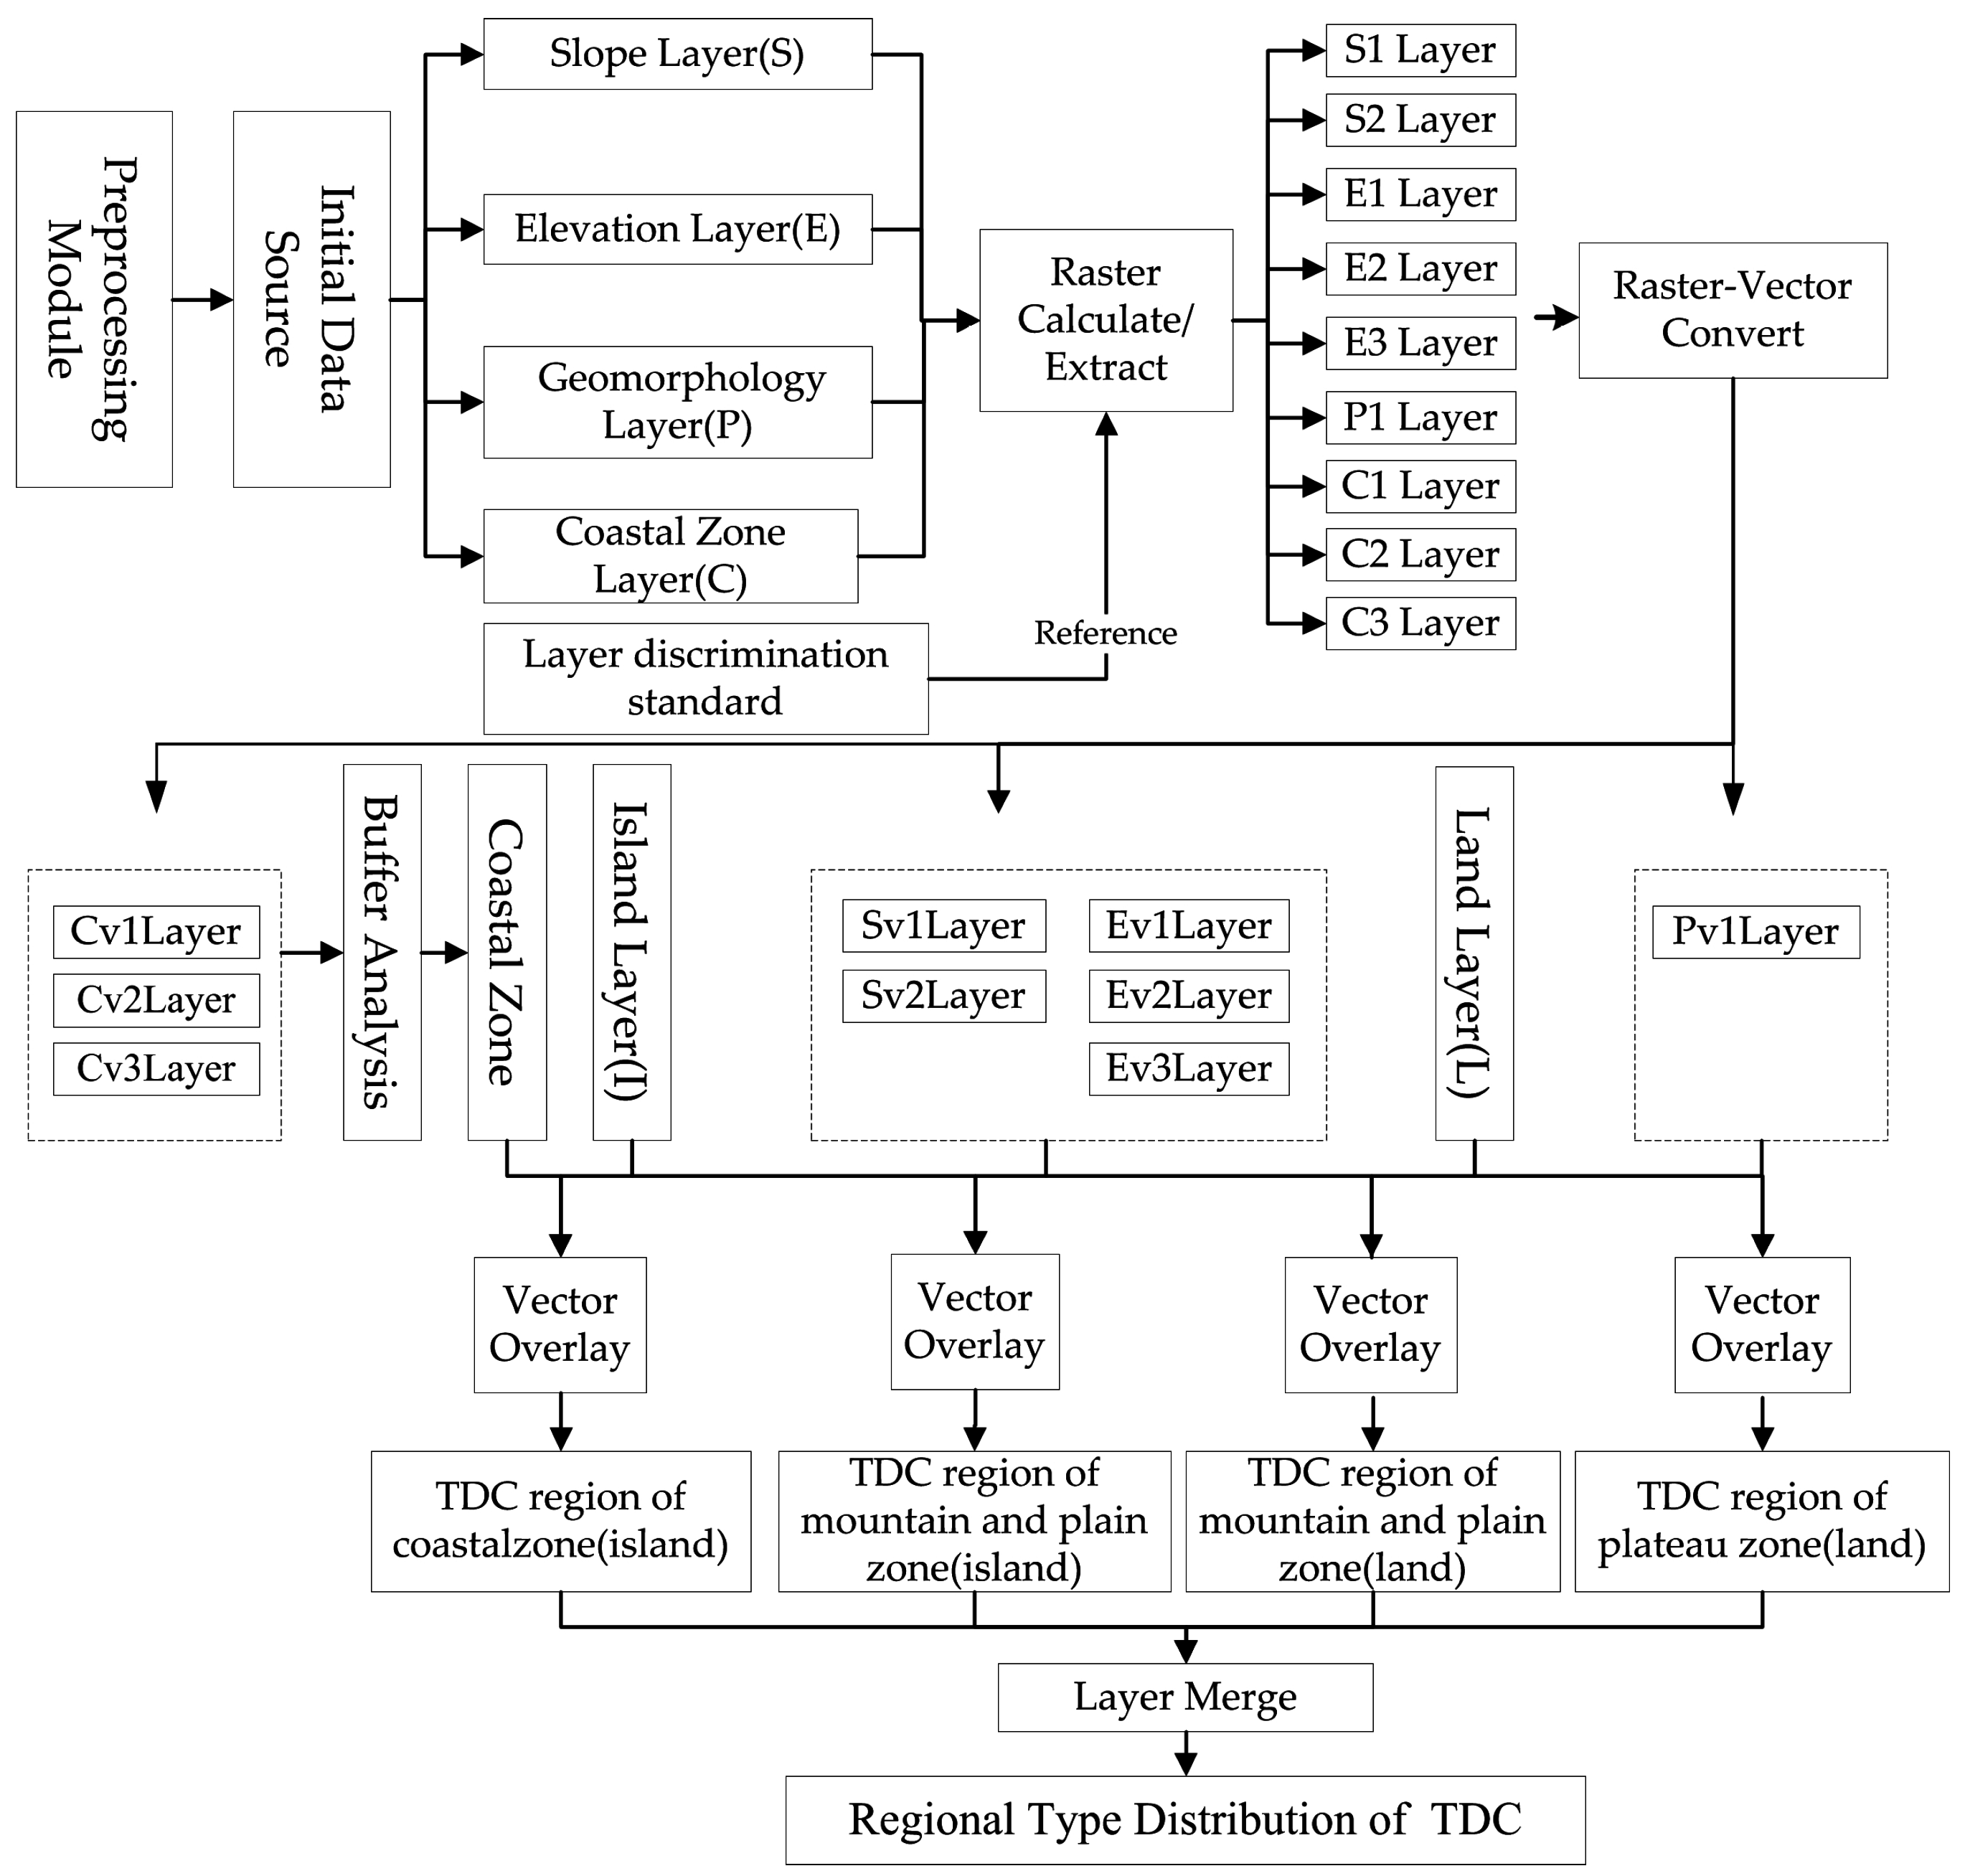
3.1.3. Automatic Recognition Module

This module implements automatic type recognition of disaster chains through the spatial overlay analysis interface function provided by ArcEngine component. According to the relationships among disaster chains type, constraint map layers, and layer discrimination standards, we established an automatic recognition system as the basis of this module. The key point of this module is to extract the constraint map layers with layer discrimination standards above, and merge them to form the regions of TDC based on the recognition principle. While this module is processing, it reads the code of the disaster chain to get the corresponding constraint map layers and their codes, and then it can get the corresponding discrimination standard of map layers from the code, and it will finally determine the disaster chain of the region from those constraint relationships among map layers. This module needs to read the initial data (layers of I, L, P, E, S, C) obtained by the data preprocessing module automatically, and the class of Intersect, Buffer and Union and the interface of IMapAlgebraOp, IReclassOp and IConversionOp will be used. The main implementation process is shown as the following (Figure 4):
  • Extract the corresponding raster layer according to the layer discrimination standard. Then, apply two interfaces called grid computing and classification (IMapAlgebraOp and IReclassOp) to extract the layers of slope < 8 degrees (S1), slope ≥ 8 degrees (S2), elevation < 200 m (E1), 200 m < elevation ≤ 500 m (E2) and elevation ≥ 200 m (E3). Taking the layer of elevation < 200 m as an example, we call IMapAlgebraOp interface to run the code (“con([raster] < 200, 1, 0”) to set the value of grids less than 200 as 1, otherwise 0. Then, we call the MapValueToNoData method of the IReclassOp interface to set the grid value of zero as null. In addition, coastal typology layer is divided into the plains coastal zone layer (C1), the mountainous coastal layer (C2), the estuarine coastal zone layer (C3), and the geomorphology layer is divided into the plateau layer (P1).
  • Convert raster layer to vector layer. The hazard-formative environment layers (E1, E2, E3, S1, S2, C1, C2, C3, P1) are converted to the corresponding vector layers (Ev1, Ev2, Ev3, Sv1, Sv2, Cv1, Cv2, Cv3, Pv1) by calling the IConversionOp interface of ESRI.ArcGIS.GeoAnalyst with two methods (RasterDataToPolylineFeatureData and RasterDataToPolygonFeatureData).
  • Overlay vector layers to obtain various types of disaster chains in island and inland. Then, this module calls the Intersect class in the class library (ESRI. ArcGIS.AnalysisTools). It will set input/output parameters of map layer intersection, do the map overlay by the Execute class method in Geoprocessor, set the type code field in the property table (code_area), and finally relate them to type codes of disaster chains.
  • Analysis of buffer area for the vector layer to obtain various types of disaster chains in the coastal zone. Then, this module calls up the Buffer class in the ESRI.ArcGIS.AnalysisTools library. It sets input/output data, buffer distance and the type code field in the property table that are corresponding to type code of disaster chains.
  • Merge all types of map layers of disaster chains. We merge map layers consecutively by calling the Union class in the ESRI. ArcGIS. AnalysisTools library. It generates map layers of regional distribution of TDC types globally and helps to diagnose disaster chains types in different regions.

3.1.4. Automatic Mapping Module

This module may read the recognition results for mapping automatically. It needs to call the main interfaces of IUniqueValueRenderer, IFeatureLayer, IScarbar, INorthArrow, ILegendFormat and IMapSurround to program.

Map Display Sub-Module

This software uses the color variables to differentiate the regional TDC. The ESRI.ArcGIS.Carto library provides the FeatureRenderer class, which can be used for map rendering. Here, we choose the UniqueValue method and call the IUniqueValueRenderer interface to attribute one color for each element. The sub-module runs automatically with the color rendering style selected by users.

Map Configuration Sub-Module

The configuration of map frame. This sub-module function uses two processing modes. The first one is the manual mode: users choose the common sheet sizes according to their own needs or custom settings. The second is the auto mode that sets inner/outer frame size according to the user needs automatically. In auto mode, the module automatically detects the size of the mapping object by calling the IFeatureLayer interface and reading the coordinates of the four corners of the map by calling the Extent property of IGeoDataset. Then, it takes the upper left corner as the benchmark and draws the inner frame and outer frame according to the length and width values of the map sheet by the IBorder and the IMapFrame interface. It also considers the spacing standard between the inner and outer frame.
The configuration of map name, scale, north arrow and legend. The map name configuration function needs to use TextElement class t to set the font and color style of the map name. For the map name location, one way is that users click the mouse in the preview layer to set the position they need; another is that users manually enter the coordinates of map name and complete the map name configuration.
The scale, north arrow, and legend configuration need users to preview and select the styles from the ERSI.ServerStyle file of them. Then, the IScarbar interface is called up to set format property of the scale (e.g., number of divisions, number of subdivisions, label units, label position and number position), and the INorthArrow interface is called up to set the north arrow property of size and color, and the ILegendFormat interface is called up to set format property of the legend (e.g., legend title, title position, text, color and size). Finally, it uses the IMapSurround interface implementation to set the symbol position and complete automatic mapping.

3.1.5. Map Exporting Sub-Module

After the processing of the automatic mapping module, users can choose some final presentation formats to export the map. This software system can provide two types of output: one is printing export by window controls and ArcEngine objects (e.g., Printer, Paper and PageLayoutControl), and the other is picture export by raster and vector output classes of ArcEngine (e.g., ExportJPEG, ExporBMP and ExportTIFF).
After finishing automatic recognition and mapping, we draw the regional type distribution map of disaster chains globally as the exported results (Figure 5).

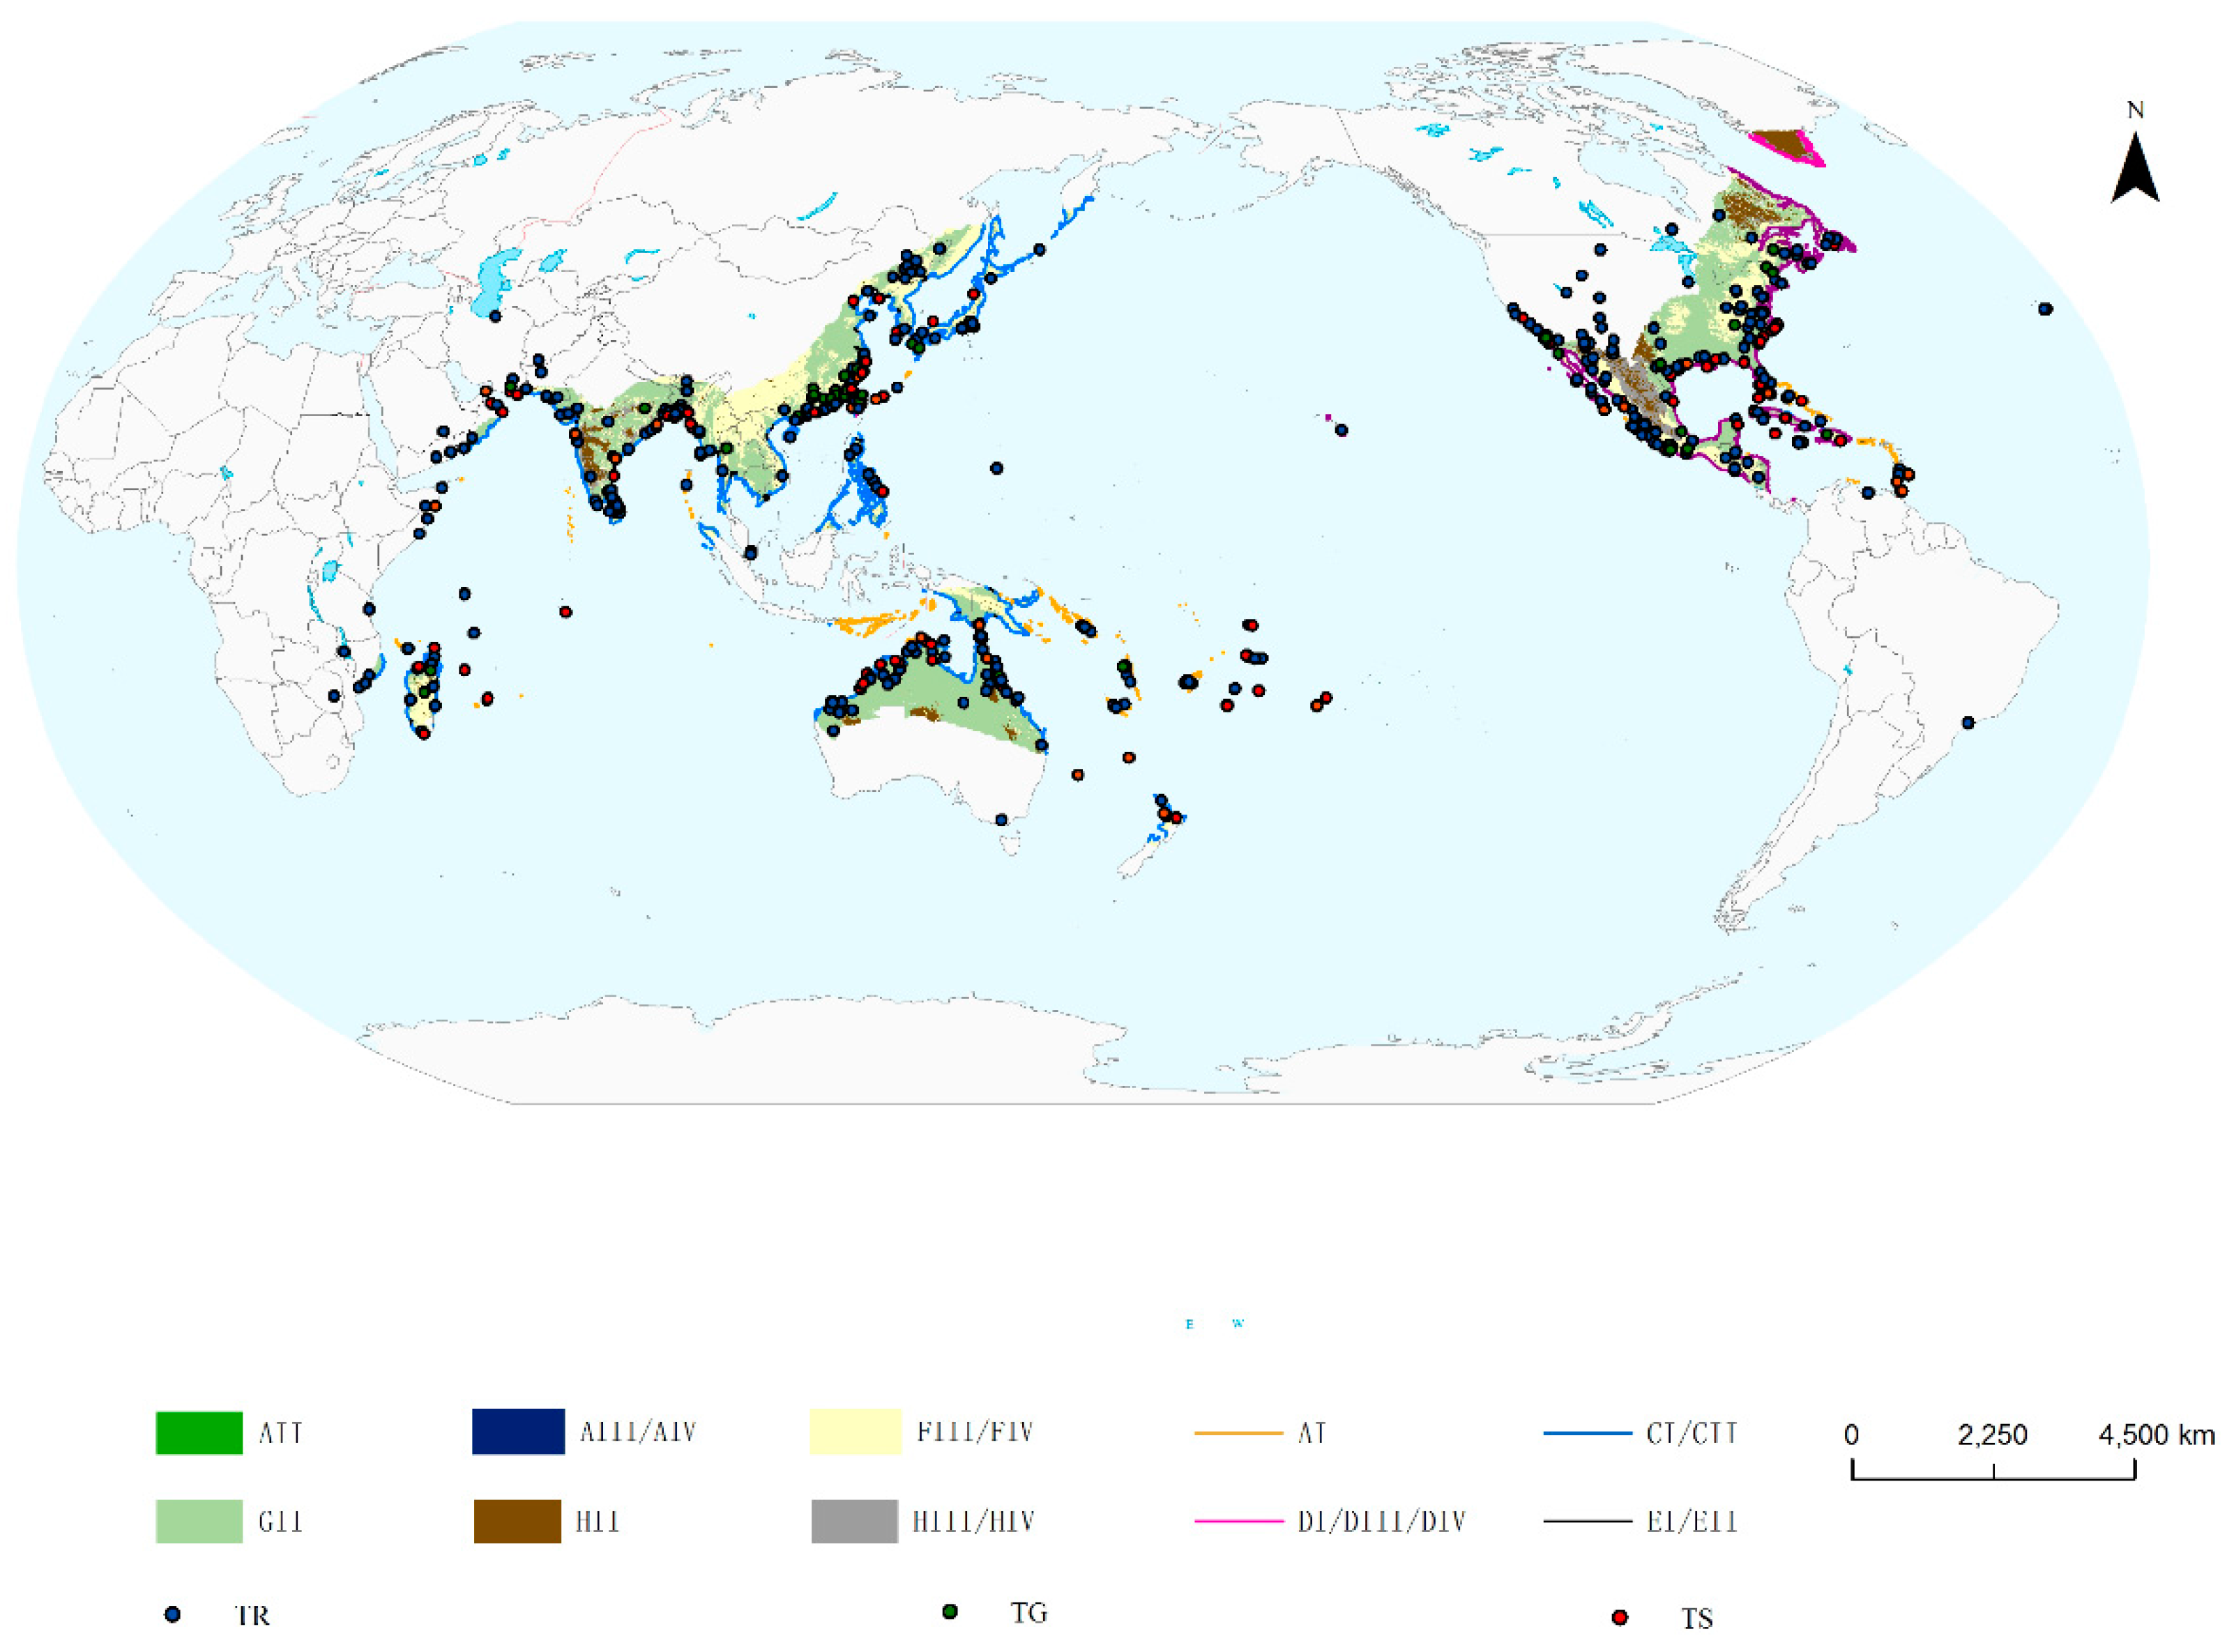
3.2. Result Validation

The validation data comes from the global Tropical Cyclone optimal path, which is provided by the Joint Tropical Warning Center (JTWC) and the Tropical Prediction Center (TPC). We chose all landfall Tropical Cyclones or the ones with indirect effects in six oceans (North Pacific, North Atlantic, Northeast Pacific, South Pacific, North India Ocean and South India Ocean) from 2000 to 2010 (Table 3).
According to the name code and time of Tropical Cyclone, we searched the disaster information (the exact disasters and damage) of the corresponding Tropical Cyclone from the internet and literature. We extracted the cases of TDC from them and built the database of validation cases. Finally, we obtained 1310 cases of TDC. The TDC cases were divided into eight subtypes: Tropical Cyclone-wind-storm surge (seawave) (TC-WI-SS(SW)), Tropical Cyclone-wind-storm surge (seawave)-flood (TC-WI-SS(SW)-FL), Tropical Cyclone-wind-storm surge (seawave)-seawater encroachment (TC-WI-SS(SW)-SE), Tropical Cyclone-rainstorm-flood (TC-RS-FL), Tropical Cyclone-rainstorm-mountain torrent (TC-RS-MT), Tropical Cyclone-rainstorm-landslide (TC-RS-LA), Tropical Cyclone-rainstorm-rock collapse (TC-RS-RC), and Tropical Cyclone-rainstorm-debris flow (TC-RS-DF).
In general, Tropical Cyclones affect the coastal zone when they make landfall and, for the plain coastal zone, generate storm surges, which can run further inland by surpassing the sea embankment to generate floods. Storm surges can also happen in the mountainous coastal zone. For the estuarine coastal zone, tide water invades inner land along the river channel to form seawater encroachment due to the geomorphology of estuary. Here, according to the hazard-formative environment characteristics of TDC, we sorted TC-WI-SS(SW), TC-WI-SS(SW)-FL and TC-WI-SS(SW)-SE into Tropical Cyclone-Sea disaster chains (TS). After Tropical Cyclones make landfall, the associated heavy rains can cause widespread floods, urban and farmland waterlog in the plain regions. Thus, we sorted TC-RS-FL into Tropical Cyclone-Rainstorm/Flood disaster chains (TR). In the mountainous (hilly) regions, the rugged topography conditions meet the forming requirements to trigger all kinds of geological disasters including landslides and rock collapses. In addition, under the special environment (gullies and valleys), Tropical Cyclones may cause mountain torrents and debris flow. Here, we sorted TC-RS-MT, TC-RS-LA, TC-RS-RC, TC-RS-DF into Tropical Cyclone-Geological hazard disaster chains (TG). For the islands, it is the same as coastal zone (plain coastal zone) and land, and plateau regions, the same as the plain and mountain (hills) regions. Therefore, the eight subtypes above were sorted into three types. The type region recognitions of TDC are based on the hazard-formative environment characteristics, and thus we can calculate the correspondence in different type regions of TDC from these case data in order to validate the reliability of our recognition approach.
Here, the matching ratio is taken to describe the correspondence. We put case points on the regional distribution map of TDC (Figure 6), and count the number M of obtained case points through our methods in the corresponding type regions of TDC and total recorded case points from historical information N in these regions. Then, we calculated the case matching ratio Q to validate the results of automatic recognition (Table 4). The formula is as follows:
Q = M N × 100 % .

4. Discussion

4.1. Further Applicaion of Layer Constraint Method

The method of layer constraint based on the index system, which is used in the process of recognition, plays an important role in different fields of research and application. Particularly for disaster risk research [46,47], the characterization of hazard-affected body (S) is often on the basis of existing data, and scholars do not always take the change of S into account in the scenario estimation, and the description of its change will be one of the key points of risk research. Using the method above, we can get the original state (value) of S with existing data or specific constraint indexes. Then, through analyzing the influencing process of the change of S, we can build the influencing index system and calculate the change state (value) of S under the future scenario. Finally, the estimation of S can be achieved by the overlay of original state (value) and change state (value). In addition, the method of layer constraint can help to solve the problem of scenario estimation and determine the actual range of various research objects, such as cultivated area, crop planting area, etc.

4.2. TDC Type Recognition Based on Hazard-Formative Environment and “Static to Dynamic Theory to Practice” Trend

We designed a new approach of TDC type recognition that can diagnose the TDC types in the study area quickly according to the environmental indexes, and our work is based on existing information, which is different from other previous studies. The current research of disaster chain recognition is mainly focused on the classification system construction and mechanism analysis. The first is to summarize TDC types and build the classification system based on the analysis of historical cases or experiences and consider logic principles of the disaster chain and disaster triggering mechanisms. The other is to build a complex network to describe the stimulating and passing process in disaster chains based on the causal relationship of disaster events. This work extracts unknown types of disaster chains from historical records and cases from scratch. Our study considered the hazard-formative environment and the formative mechanism of disaster chains and constructed their corresponding relationships based on the disaster chain classification. Finally, we built a classification and type recognition system on the basis of hazard-formative environments.
This research is theoretical work aimed at recognizing all the possible types of disaster chains. They are the types of disaster chains caused by the rainstorms and strong wind accompanied with Tropical Cyclones. It is a static and theoretical way of TDC recognition. However, there are a lot of uncertainties particularly associated with tracks of Tropical Cyclones, as well as with wind and rain fields. Thus, it needs in-depth research to make a dynamic and real method of TDC recognition. There are many existing methods that can simulate Tropical Cyclone tracks [48,49] and the wind or rain fields [50,51,52], which are sophisticated and sometimes expansive to apply in the current study. We plan to add those simulation models of Tropical Cyclone tracks and fields in our future study so that we will be able to update the affected region, recognize the disaster chains of TC-WI (wind) and TC-RS (rain) in real-time and obtain practical results.

4.3. Refinement Trend of TDC Type Recognition and Grade Risk Assessment of TDC

We have made some progress in diagnosing regional disaster chain types. The study scale has also reached the global level from the original local level. We discovered some regional characteristics of disaster chain types by using original geographical information of hazard-bearing environments:
(1)
In future studies, we plan to analyze the sub-classes of TDC in more detail by describing multi-elements of hazard-formative environments. This will result in better diagnosing power and increases in the diversity of disaster chains in the software.
(2)
In addition, we may make assessments on the grade risk of different types of TDC, in terms of the relationships between the occurrence possibility of disasters and environment indexes by analyzing hazard-formative environment indexes and disaster situations of each disaster type. Some scholars have already described the occurrence conditions of the secondary hazard factors based on the characteristics of the primary hazard factors. For example, they calculated the relationships between intensity and duration of rainfall [53,54], which can possibly cause the landslide from the historical disaster information, and analyzed the earthquake magnitudes that may induce landslides [55]. Thus, we can add hazard factors indexes into the calculation of possibility of disaster chains. It can make the evaluation on the hazard grade of disaster chains from both sides of hazard-formative environments and hazards themselves. On the other hand, we can use the population density and economic data to describe the vulnerability and evaluate the intensity grade of possible disaster losses. Combining the two evaluation results above, we will be able to estimate the risk grade of different types of TDC if we synchronize results from the two aspects above. It will be very helpful for local governments or decision makers to make accurate predictions of disaster situations, and will facilitate targeted decision-making by policy makers on the prevention and mitigation of TDC risks to ensure regional sustainable development.

5. Conclusions

We figured out eight types of hazard-formative environments including island, ocean, plain coastal zone, mountainous coastal zone, estuarine coastal zone, mountain (hill) area, plain area, and plateau (tableland) based on the disaster system theory. Eighteen types of disaster chains have been classified referring to the disaster mechanisms. Then, we constructed an automatic type recognition system of global Tropical Cyclone disaster chains based on the connections of “Disaster Chain Type-Constraint Map Layer-Discrimination Standards”.
We implemented the automatic recognition function of disaster chains according to the type recognition system and the map layer constraint principles by spatial overlay tools provided by ArcEngine components. On this basis, we used the map decoration interface to achieve the automatic mapping. We finally completed a software system combining automatic and artificial modes where users can achieve the two functions above by setting input data, output conditions and processing parameters, and drew a regional type distribution map of Tropical Cyclone disaster chains globally.
In terms of the Tropical Cyclone cases from 2000 to 2010, we validated the results of automatic recognition. The result shows that the type region has good matching with case data and the automatic recognition principle has high reliability. The software framework performs a fine applicability for TDC recogniton.

Acknowledgments

This study was supported by the National Key Research and Development Program (No. 2016YFA0602402) and also supported by the Fund for Creative Research Groups of the National Natural Science Foundation of China (No. 41321001). The valuable comments and suggestions from the editor and anonymous reviewers are also greatly appreciated.

Author Contributions

Ran Wang conceived of the entire paper and designed the software. Laiyin Zhu and Han Yu polished the text of the paper and designed the software. Shujuan Cui provided case data support. Jing’ai Wang polished the text and provided project support.

Conflicts of Interest

The authors declare no conflict of interest.

References

  1. Shi, P.J. On the theory of disaster research and its practice. J. Nanjing Univ. 1991, 11, 37–42. [Google Scholar]
  2. IPCC (Intergovernmental Panel on Climate Change). Climate Change 2014: Synthesis Report; Cambridge University Press: New York, NY, USA, 2014; pp. 2–16. [Google Scholar]
  3. IPCC (Intergovernmental Panel on Climate Change). Climate Change 2012: A Special Report of Working Groups I and II of the Intergovernmental Panel on Climate Change (SREX); Cambridge University Press: New York, NY, USA, 2012; pp. 8–9. [Google Scholar]
  4. Webster, P.J.; Holland, G.J.; Curry, J.A.; Chang, H.-R. Changes in tropical cyclone number, duration, and intensity in a warming environment. Science 2005, 309, 1844–1846. [Google Scholar] [CrossRef] [PubMed]
  5. Emanuel, K.A. Increasing destructiveness of tropical cyclones over the past 30 years. Nature 2005, 436, 686–688. [Google Scholar] [CrossRef] [PubMed]
  6. IPCC (Intergovernmental Panel on Climate Change). Climate Change 2013: The Physical Science Basis; Cambridge University Press: New York, NY, USA, 2013; pp. 72–88. [Google Scholar]
  7. Lü, L.L.; Shi, P.J. The Comparison of Function Systems in Large-scale Disaster Response between China and USA-Cases of 2008 Southern China Freezing Rain and Snow Storm Disaster and 2005 Hurricane Katrina. J. Catastrophol. 2014, 29, 206–213. [Google Scholar]
  8. Travis, J. Hurricane Katrina-scientists’ fears come true as hurricane floods New Orleans. Science 2005, 309, 1656–1659. [Google Scholar] [CrossRef] [PubMed]
  9. Xue, J.J.; Li, J.Y.; Zhang, L.S.; Wang, X.R.; Xu, Y.L. Characteristics of typhoon disasters in China and risk prevention strategies. Meteorl. Disaster Reduct. Res. 2012, 35, 59–64. [Google Scholar]
  10. Shi, P.J.; Shuai, J.B.; Chen, W.F.; Lu, L.L. Study on large-scale disaster risk assessment and risk transfer models. Int. J. Disaster Risk Sci. 2010, 1, 1–8. [Google Scholar]
  11. Yu, H.; Wang, J.A.; Chai, M.; Shi, P.J. Review on research methods of disaster loss accumulation and amplification of disaster chains. Prog. Geogr. 2014, 33, 1498–1511. [Google Scholar]
  12. Shi, P.J.; Lü, L.L.; Wang, M.; Wang, J.A.; Chen, W.F. Disaster system: Disaster cluster, disaster chain and disaster compound. J. Nat. Disaster 2014, 23, 1–12. [Google Scholar]
  13. Carabine, E. Revitalizing Evidence-based Policy for the Sendai Framework for Disaster Risk Reduction 2015–2030: Lessons from Existing International Science Partnerships. PLoS Curr. Disasters 2015. [Google Scholar] [CrossRef] [PubMed]
  14. Xu, L.F.; Meng, X.W.; Xu, X.G. Natural hazard chain research in China: A review. Nat. Hazards 2014, 70, 1631–1659. [Google Scholar] [CrossRef]
  15. Shi, P.J. Theory on disaster science and disaster dynamics. J. Nat. Disasters 2002, 11, 1–9. [Google Scholar]
  16. Shuai, J.B.; Xu, W.; Shi, P.J. Characteristic analysis of typhoon disaster chains in the Yangtze River Delta region of China. J. Nat. Disasters 2012, 21, 36–42. [Google Scholar]
  17. Wang, J.A.; Lei, Y.D.; Zhou, H.J.; Yin, Y.Y.; Chang, S.; Li, Q.F. Regional features and adaptation countermeasures of typhoon disaster chains in southeast coastal region of China. J. Beijing Norm. Univ. 2012, 2, 130–138. [Google Scholar]
  18. Ye, J.Y.; Lin, G.F.; Zhang, M.F. Spatial characteristics of typhoon disaster chains in Fujian Province. J. Fujian Norm. Univ. Nat. Sci. Ed. 2014, 30, 99–106. [Google Scholar]
  19. Chen, X.; Chen, J.; Wang, J.A. Analysis of typhoon disaster chain in Fujian: A case study of typhoon Longwang in 2005. J. Beijing Norm. Univ. 2007, 43, 203–208. [Google Scholar]
  20. Gill, J.C.; Malamud, B.D. Reviewing and visualizing the interactions of natural hazards. Rev. Geophys. 2014, 52, 680–722. [Google Scholar] [CrossRef]
  21. Kappes, M.S. Multi- Hazard Risk Analyses: A Concept and Its Implementation. Ph.D. Thesis, University of Vienna, Vienna, Austria, 2011. [Google Scholar]
  22. Kappes, M.S.; Keiler, M.; von Elverfeldt, K.; Glade, T. Challenges of analyzing multi-hazard risk: A review. Nat. Hazards 2012, 64, 1925–1958. [Google Scholar] [CrossRef]
  23. Karnopp, D.; Rosenberg, R.; Perelson, A.S. System dynamics: A unified approach. IEEE Trans. Syst. Man Cybern. 1976. [Google Scholar] [CrossRef]
  24. Dong, L.L. Modeling Emergency Events Chain Based on Bayesian Networks. Ph.D. Thesis, Dalian University of Technology, Dalian, China, 2009. [Google Scholar]
  25. Wang, D. Network Model of Emergency Events Based on Correlation. Ph.D. Thesis, Dalian University of Technology, Dalian, China, 2010. [Google Scholar]
  26. Saban, L.I. Entrepreneurial Brokers in Disaster Response Network in Typhoon Haiyan in the Philippines. Public Manag. Rev. 2015, 17, 1496–1517. [Google Scholar] [CrossRef]
  27. Berz, G.; Kron, W.; Loster, T.; Schimetschek, J.; Schmieder, J.; Siebert, A.; Smolka, A.; Wirtz, A. World map of natural hazards—A global view of the distribution and intensity of significant exposures. Nat. Hazards 2001, 23, 443–465. [Google Scholar] [CrossRef]
  28. Dilley, M. Natural Disaster Hotspots: A Global Risk Analysis; World Bank Publications: Washington, DC, USA, 2005; pp. 35–118. [Google Scholar]
  29. United Nations Office for Disaster Risk Reduction. Global Assessment Report on Disaster Risk Reduction: Risk and Poverty in a Changing Climate; United Nations Publications: Geneva, Switzerland, 2009; pp. 158–196. [Google Scholar]
  30. Shi, P.J.; Kasperson, R. World Atlas of Natural Disaster Risk; Springer: Berlin, Germany, 2015; pp. 141–152. [Google Scholar]
  31. Shi, P.J. Theory and Practice on disaster system research in a fourth time. J. Nat. Disasters 2005, 14, 1–7. [Google Scholar]
  32. Meng, Y.; Matsui, M.; Hibi, K. A numerical study of the wind field in a typhoon boundary layer. J. Wind Eng. Ind. Aerodyn. 1997, 67–68, 437–448. [Google Scholar] [CrossRef]
  33. Harper, B.A.; Harby, T.A.; Mason, L.B.; Bode, L.; Young, L.; Nielsen, P. Queensland Climate Change and Community Vulnerability to Tropical Cyclones: Ocean Hazards Assessment—Stage 1 Report; Department of Natural Resources and Mine: Brisbane, Australia, 2001; pp. 41–58. [Google Scholar]
  34. Fang, W.H.; Shi, X.W. A review of stochastic modeling of tropical cyclone track and intensity for disaster risk assessment. Adv. Earth Sci. 2012, 27, 866–875. [Google Scholar]
  35. Fang, W.H.; Lin, W. A review on typhoon wind field modeling for disaster risk assessment. Progress Geogr. 2013, 32, 852–867. [Google Scholar]
  36. Chen, P.Y.; Yang, Y.H.; Lei, X.T.; Qian, Y.Z. Cause analysis and preliminary hazard estimate of typhoon disaster in China. J. Nat. Disasters 2009, 18, 64–73. [Google Scholar]
  37. Lin, N. Multi-Hazard Risk Analysis Related to Hurricanes. Ph.D. Thesis, Princeton University, Princeton, NJ, USA, 2010. [Google Scholar]
  38. Gorum, T.; Fan, X.M.; van Westen, C.J.; Huang, R.Q.; Xu, Q.; Tang, C.; Wang, G.H. Distribution pattern of earthquake-induced landslides triggered by the 12 May 2008 Wenchuan earthquake. Geomorphology 2011, 133, 152–167. [Google Scholar] [CrossRef]
  39. Zhang, B.J.; Ma, Y.L.; Li, Y. Standardization of natural disaster classification in China. J. Nat. Disasters 2013, 22, 8–12. [Google Scholar]
  40. Han, J.L.; Wu, S.R.; Wang, H.B. Preliminary study on geological hazard chains. Earth Sci. Front. 2007, 14, 11–23. [Google Scholar] [CrossRef]
  41. Xu, M.Z.; Wang, Z.Y.; Qi, L.J.; Liu, L.; Zhang, K. Disaster chains initiated by the Wenchuan earthquake. Environ. Earth Sci. 2012, 65, 975–985. [Google Scholar] [CrossRef]
  42. Sayre, R.; Dangermond, J.; Frye, C. A New Map of Global Ecological Land Units—An Ecophysiographic Stratification Approach; Association of American Geographers: Washington, DC, USA, 2014; pp. 7–44. [Google Scholar]
  43. Yang, G.S. The Coastal Environments Change and Regional Responses to It in China. Ph.D. Thesis, Nanjing Institute of Geography and Limnology, Chinese Academy of Sciences (CAS), Nanjing, China, 1997. [Google Scholar]
  44. USGS (U.S. Geological Survey). Geosciences and Environmental Change Science Center (GECSC) Outgoing Dataset. Available online: http://rmgsc.cr.usgs.gov/ outgoing /ecosystems/Global/ (accessed on 15 June 2010).
  45. Unisys Weather. Hurricane/Tropical Data. Available online: http://weather.unisys.com/hurricane/ (accessed on 15 July 2015).
  46. Yin, Y.Y.; Zhang, X.M.; Lin, D.G.; Yu, H.; Shi, P.J. GEPIC-VR model: A GIS-based tool for regional crop drought risk assessment. Agric. Water Manag. 2014, 144, 107–119. [Google Scholar] [CrossRef]
  47. Potopová, V.; Štěpánek, P.; Možný, M.; Türkott, L.; Soukup, J. Performance of the standardized precipitation evapotranspiration index at various lags for agricultural drought risk assessment in the Czech Republic. Agric. For Meteorol. 2015, 202, 26–38. [Google Scholar] [CrossRef]
  48. Roy, C.; Kovordányi, R. Tropical cyclone track forecasting techniques-A review. Atmos. Res. 2012, 104, 40–69. [Google Scholar] [CrossRef]
  49. Sun, Y.; Zhong, Z.; Dong, H.; Shi, J.; Hu, Y. Sensitivity of tropical cyclone track simulation over the western North Pacific to different heating/drying rates in the Betts–Miller–Janjić scheme. Mon. Weather Rev. 2015, 143, 3478–3494. [Google Scholar] [CrossRef]
  50. He, Y.C.; Chan, P.W.; Li, Q.S. Observations of vertical wind profiles of tropical cyclones at coastal areas. J. Wind Eng. Ind. Aerodyn. 2016, 152, 1–14. [Google Scholar] [CrossRef]
  51. Melton, G.; Gall, M.; Mitchell, J.T.; Cutter, S.L. Hurricane Katrina storm surge delineation: Implications for future storm surge forecasts and warnings. Nat. Hazards 2010, 54, 519–536. [Google Scholar] [CrossRef]
  52. Bindu, H.H.; Ratnam, M.V.; Yesubabu, V.; Rao, T.N.; Kesarkar, A.; Naidu, C.V. Characteristics of cyclone generated gravity waves observed using assimilated WRF model simulations over Bay of Bengal. Atmos. Res. 2016, 180, 178–188. [Google Scholar] [CrossRef]
  53. Gabet, E.J.; Burbank, D.W.; Putkonen, J.K.; Pratt-Sitaula, B.A.; Ojha, T. Rainfall thresholds for landsliding in the Himalayas of Nepal. Geomorphology 2004, 63, 131–143. [Google Scholar] [CrossRef]
  54. Dahal, R.K.; Hasegawa, S. Representative rainfall thresholds for landslides in the Nepal Himalaya. Geomorphology 2008, 100, 429–443. [Google Scholar] [CrossRef]
  55. Keefer, D.K. Investigating landslides caused by earthquakes-a historical review. Surv. Geophys. 2002, 23, 473–510. [Google Scholar] [CrossRef]
Figure 1. The overall design of research. (a) E represents for hazard-formative environment, H represents hazard, S represents hazard-affected body, D represents disaster, disaster is determined by the interaction of E, H and S; (b) the indexes of E consist of elevation, slope, etc., the indexes of S consist of population and economy (GDP); and (c) TC represents Tropical Cyclone.
Sustainability 08 01066 g001
Figure 2. Framework of automatic recognition and mapping software system.
Sustainability 08 01066 g002
Figure 3. Flow chart of data preprocessing module. DEM represents Digital Elevation Model and GDP represents Gross Domestic Product. The clipping layer represents for the region of population density more than one person per km2 and GDP is more than $50,000.
Sustainability 08 01066 g003
Figure 4. Flow chart of the automatic recognition module. TDC represents Tropical Cyclone disaster chains. The initial data used in the automatic recognition is provided by the preprocessing module.
Sustainability 08 01066 g004
Figure 5. Regionalization of global Tropical Cyclone disaster chain type.
Sustainability 08 01066 g005
Figure 6. Distribution of case points. Blue points represent TDC of Tropical Cyclone-Rainstorm-Flood, green points represent TDC of Tropical Cyclone-Rainstorm-Mountain torrent/Landslide/Rock collapse/Debris flow, red points represent Tropical Cyclone-Wind-Storm surge (sea wave) or Tropical Cyclone-Wind-Storm surge (sea wave)-Flood/Seawater encroachment. We can see the matching ratios in the ten types are 95% or above (Table 5). The result shows that our type regions of TDC divided by hazard-formative environments have good correspondence with case data.
Sustainability 08 01066 g006
Table 1. Basic data used in the study of TDC.
TypeNameYearFormatSource
Base map DataGlobal country unit map2014Vector, Scale: 1:200,000,000From World Atlas of Natural Disaster Risk
Hazard-formative environment DataGlobal digital elevation1997Raster, Grid size: 1 km × 1 kmUnited States Geological Survey (USGS) ftp://edcftp.cr.usgs.gov
Global terrain slopes2002, 2006Raster, Grid size: 10 km × 10 kmInternational Institute for Applied Systems Analysis Global Agro-ecological Zones (GAEZ) http://www.gaez.iiasa.ac.at
Global coastal typology2011Raster, Grid size: 0.5° × 0.5°http://geotypes.net
Global geomorphology2010Raster, Grid size: 1 km × 1 kmhttp://rmgsc.cr.usgs.gov/outgoing/ecos-ystems/Global/
Hazard DataGlobal 3s-dust wind field-Raster, Grid size: 1 km × 1 kmBy Planetary boundary layer model (PBL) [32,33,34,35]
Hazard-affected body DataWorld population density data2010Raster, Grid size: 1 km × 1 kmOak Ridge National Labora-tory (ORNL) http://web.ornl.gov/sci/landscan/
GDP (at market exchange rate)2010Raster, Grid size: 0.5° × 0.5°Greenhouse Gas Initiative (GGI) Program of the International Institute for Applied Systems Analysis (IIASA) http:// www. Iiasa.ac.at
Table 2. Types of TDC and criteria of layer discrimination (TDC type recognition principle).
TypeSubtypeDisaster Chain TypeCodeConstraint LayerCodeStandard
OceanIsland ATC-WI-SS(SW)AIIslandIArea < 5000 km2
Coastal ZoneCDistance from coastline 1 km
TC-RS-FLAIIIslandIArea < 5000 km2
ElevationE1. Elevation < 200 m
2. 200 m ≤ Elevation < 500 m
SlopeS1. None
2. Slope < 8°
TC-RS-MTAIIIIslandIArea < 5000 km2
ElevationEElevation ≥ 200 m
SlopeSSlope ≥ 8°
TC-RS-LA/RCAIVIslandIArea < 5000 km2
ElevationEElevation ≥ 200 m
SlopeSSlope ≥ 8°
Sea area BTC-WI-SS(SW)BI---
Coastal ZonePlain coastal zone CTC-WI-SS(SW)CICoastal ZoneCDistance from coastline 1 km
TC-RS-FLCIICoastal ZoneCDistance from coastline 1–10 km
Mountainous coastal zone DTC-WI-SS(SW)DICoastal ZoneCDistance from coastline 1 km
TC-RS-FLDIIICoastal ZoneCDistance from coastline 1–10 km
TC-RS-LA/RC/DFDIVCoastal ZoneCDistance from coastline 1–10 km
Estuarine coastal zone ETC-WI-SS(SW)EICoastal ZoneCDistance from coastline 1 km
TC-RS-FLEIICoastal ZoneCDistance from coastline 1–10 km
LandMountain (Hills) FTC-RS-MTFIIICoastal ZoneEElevation ≥ 200 m
Coastal ZoneSSlope ≥ 8°
TC-RS-LA/RC/DFFIVElevationEElevation ≥ 200 m
SlopeSSlope ≥ 8°
Plain GTC-RS-FLGIIElevationE1. Elevation < 200 m
2. 200 m ≤ Elevation < 500 m
SlopeS1. None; 2. Slope < 8°
Plateau (Tableland) HTC-RS-FLHIITopographyPPlateau Area
SlopeSSlope < 8°
TC-RS-MTHIIITopographyPPlateau Area
SlopeSSlope < 8°
TC-RS-LA/RC/DFHIVTopographyPPlateau Area
SlopeSSlope < 8°
TC-WI-SS(SW) represents Tropical Cyclone-wind-storm surge (sea wave), TC-WI-SS(SW)-FL represents Tropical Cyclone-wind-storm surge (sea wave)-flood, TC-WI-SS(SW)-SE represents Tropical Cyclone-wind-storm surge (sea wave)-seawater encroachment, TC-RS-FL represents Tropical Cyclone-rainstorm-flood, TC-RS-MT represents Tropical Cyclone-rainstorm-mountain torrent, TC-RS-LA represents Tropical Cyclone-rainstorm-landslide, TC-RS-RC represents Tropical Cyclone-rainstorm-rock collapse, and TC-RS-DF represents Tropical Cyclone-rainstorm-debris flow.
Table 3. Best track data of Tropical Cyclones (2000 to 2010).
Table 4. Case number of Tropical Cyclone disaster chain types.
TypeCodeCase NumberTypeCodeCase Number
TC-WI-SS(SW)TS216TC-RS-MTTG108
TC-WI-SS(SW)-FLTS125TC-RS-LATG131
TC-WI-SS(SW)-SETS15TC-RS-RCTG4
TC-RS-FLTR624TC-RS-DFTG85
Table 5. Case matching ratio of type point.
TypeMNQTypeMNQ
AI9090100%EI/EII22923597.4%
AII11912099.2%FIII/FIV16517295.9%
AIII/AIV5252100%GII25927295.2%
CI/CII29931495.2%HII1818100%
DI/DIII/DIV55100%HIII/HIV3232100%

