
Sustainability and EMAS: Impact of Motivations and Barriers on the Perceived Benefits from the Adoption of Standards


Abstract
:1. Introduction
2. Theoretical Model and Hypotheses
2.1. Motivations
- -
- -
- -
- -
- -
- -
2.2. Barriers
2.3. Benefits
- -
- -
- -
- -
- Improvement in product/service quality [58].
- -
- -
- -
- -
- -
- -
2.4. Motivations-Barriers-Benefits
3. Methodology
3.1. Sample and Survey Process
3.2. Data Analysis
3.2.1. Validation of the Measurement Model
3.3.2. Estimation of Structural Equation Modeling
4. Results
4.1. Measurement Model
4.2. Hypothesis Testing
5. Discussion
6. Conclusions and Implications
Author Contributions
Conflicts of Interest
Appendix A

| Motivation: It Is Not One-Dimensional, But Is Formed by Two Factors, External and Internal Motivations |
|---|
| External Motivation |
| By customers’ requirements By providers/suppliers’ requirements The has an Environmental Management System competition |
| Internal Motivation |
| Integrating Environment into corporate strategy Maintain socially-responsible behavior It was a strategic decision of the organization |
| Barriers |
| Lack of human and material resources Lack of staff involvement, difficulties to involve and motivate internal staff Lack of top management commitment Little concern of the company for issues related to environmental management |
| Benefits |
| Improvement in relationships with consumers and increase in consumer confidence and satisfaction Cost savings in the medium and long term Improved productivity Improved business profitability Improved relationships with public administrations It helps to improve internal management of the organization Improves providers’/suppliers’ relationships |
References
- Nunes, B.; Bennett, D. The contribution of modularity to green operations practices. Braz. J. Oper. Prod. Manag. 2010, 5, 93–108. [Google Scholar]
- Kollman, K.; Prakash, A. Green by choice? Cross-national variations in firms’ responses to EMS-based environmental regimes. World Politics 2001, 53, 399–430. [Google Scholar] [CrossRef]
- EMAS III. Regulation (EC) No 1221/2009 of The European Parliament and of The Council. Available online: http://eur-lex.europa.eu/legal-content/en/ALL/?uri=CELEX:32009R1221 (assessed on 30 September 2016).
- Steger, U. Environmental management systems: Empirical evidence and further perspectives. Eur. Manag. J. 2000, 18, 23–37. [Google Scholar] [CrossRef]
- Watson, M.; Emery, A.R. Law, economics and the environment: A comparative study of environmental management systems. Manag. Audit. J. 2004, 19, 760–773. [Google Scholar] [CrossRef]
- European Commission. Reports and Statistics 2015. Available online: http://ec.europa.eu (accessed on 10 April 2016).
- Potoski, M.; Prakash, A. Covenants with weak swords: ISO 14001 and facilities’ environmental performance. J. Policy Anal. Manag. 2005, 24, 745–769. [Google Scholar] [CrossRef]
- Link, S.; Naveh, E. Standardization and discretion: Does the environmental standard ISO 14001 lead to performance benefits? IEEE Trans. Eng. Manag. 2006, 53, 508–519. [Google Scholar] [CrossRef]
- Pan, J.N. A comparative study on motivation for and experience with ISO 9000 and ISO 14000 certification among Far Eastern countries. Ind. Manag. Data Syst. 2003, 103, 564–578. [Google Scholar] [CrossRef]
- Hillary, R. Environmental management systems and the smaller enterprise. J. Clean. Prod. 2004, 12, 561–569. [Google Scholar] [CrossRef]
- Zutshi, A.; Sohal, A. Environmental management system adoption by Austalasian organisations: Part 1: Reasons, benefits and impediments. Technovation 2004, 24, 335–357. [Google Scholar] [CrossRef]
- Kumar, S. Resource use and waste management in Vietnam hotel industry. J. Clean. Prod. 2005, 13, 109–116. [Google Scholar]
- Heras, I.; Arana, G. Impacto de la certificación ISO 14001 en el rendimiento financiero empresarial: Conclusiones de un estudio empírico. Cuad. Econ. Dir. Empresa 2011, 14, 112–122. [Google Scholar]
- Quazi, H.A.; Khoo, Y.K.; Tan, C.M.; Wong, P.S. Motivation for ISO 14000 certification: Development of a predictive model. Int. J. Manag. Sci. 2001, 29, 525–542. [Google Scholar] [CrossRef]
- Yiridoe, E.K.; Clark, J.S.; Marett, G.E.; Gordon, R.; Duinker, P. ISO 14001 EMS standard registration decisions among Canadian organizations. Agribusiness 2003, 19, 439–457. [Google Scholar] [CrossRef]
- González-Benito, J.; González-Benito, O. An analysis of the relationship between environmental motivations and ISO14001 certification. Br. J. Manag. 2005, 16, 133–148. [Google Scholar] [CrossRef]
- Schylander, E.; Martinuzzi, A. ISO 14001—Experiences, effects and future challenges: A national study in Austria. Bus. Strategy Environ. 2007, 16, 133–147. [Google Scholar] [CrossRef]
- Gavronski, I.; Ferrer, G.; Paiva, E.L. ISO 14001 certification in Brazil: Motivations and benefits. J. Clean. Prod. 2008, 16, 87–94. [Google Scholar] [CrossRef] [Green Version]
- Mariotti, F.; Kadasah, N.; Abdulghaffar, N. Motivations and barriers affecting the implementation of ISO 14001 in Saudi Arabia: An empirical investigation. Total Q. Manag. Bus. Excell. 2014, 25, 1352–1364. [Google Scholar] [CrossRef]
- Jiang, R.J.; Bansal, P. Seeing the need for ISO 14001. J. Manag. Stud. 2003, 40, 1047–1067. [Google Scholar] [CrossRef]
- Christmann, P.; Taylor, G. Firm self-regulation through international certifiable standards: Determinants of symbolic versus substantive implementation. J. Int. Bus. Stud. 2006, 37, 863–878. [Google Scholar] [CrossRef]
- Boiral, O. Corporate greening through ISO 14001: A rational myth? Org. Sci. 2007, 18, 127–146. [Google Scholar] [CrossRef]
- Boiral, O. Managing with ISO systems: Lessons from practice. Long Range Plan. 2011, 44, 197–220. [Google Scholar] [CrossRef]
- Montabon, F.; Melnyk, S.A.; Sroufe, R.; Calantone, R.J. ISO 14000: Assessing its perceived impact on corporate performance. J. Supply Chain Manag. 2000, 36, 4–16. [Google Scholar] [CrossRef]
- Poksinska, B.; Jörn Dahlgaard, J.; Eklund, J.A. Implementing ISO 14000 in Sweden: Motives, benefits and comparisons with ISO 9000. Int. J. Q. Reliab. Manag. 2003, 20, 585–606. [Google Scholar] [CrossRef]
- Martín-Peña, M.L.; Díaz-Garrido, E.; Sánchez-López, J.M. Analysis of benefits and difficulties associated with firms’ Environmental Management Systems: The case of the Spanish automotive industry. J. Clean. Prod. 2014, 70, 220–230. [Google Scholar] [CrossRef]
- Boiral, O. Du Developpement Durable Aux Normes ISO: Peaut-on Certifier La-Bonne Conduite-Des Entreprises. McGill Int’l J. Sust. Dev. L. Pol’y 2006, 2, 91. [Google Scholar]
- Johnstone, N.; Scapecchi, P.; Ytterhus, B.; Wolff, R. The firm, environmental management and environmental measures: Lessons from a survey of European manufacturing firms. J. Environ. Plan. Manag. 2004, 47, 685–707. [Google Scholar] [CrossRef]
- Kolln, K.; Prakash, A. EMS-based environmental regimes as club goods: Examining variations in firm-level adoption of ISO 14001 and EMAS in UK, US and Germany. Policy Sci. 2002, 35, 43–67. [Google Scholar] [CrossRef]
- Melnyk, S.A.; Sroufe, R.P.; Calantone, R.L. Assessing the effectiveness of US voluntary environmental programmes: an empirical study. Int. J. Prod. Res. 2002, 40, 1853–1878. [Google Scholar] [CrossRef]
- Wernerfelt, B. A resource-based view of the firm. Strateg. Manag. J. 1984, 5, 171–180. [Google Scholar] [CrossRef]
- Prajogo, D.I. The roles of firms’ motives in affecting the outcomes of ISO 9000 adoption. Int. J. Oper. Prod. Manag. 2011, 31, 78–100. [Google Scholar] [CrossRef]
- Takahashi, T.; Nakamura, M. The impact of operational characteristics on firms’ EMS decisions: Strategic adoption of ISO 14001 certifications. Corp. Soc. Responsib. Environ. Manag. 2012, 17, 215–229. [Google Scholar] [CrossRef]
- Heras-Saizarbitoria, I.; Arana, G.; Molina-Azorín, J.F. Do drivers matter for the benefits of ISO 14001? Int. J. Oper. Manag. 2011, 31, 192–215. [Google Scholar] [CrossRef]
- Fryxell, G.E.; Szeto, A. The influence of motivations for seeking ISO 14001 certification: An empirical study of ISO 14001 certified facilities in Hong Kong. J. Environ. Manag. 2002, 65, 223–238. [Google Scholar] [CrossRef]
- Zeng, S.X.; Tam, C.M.; Tam, V.W.; Deng, Z.M. Towards implementation of ISO 14001 environmental management systems in selected industries in China. J. Clean. Prod. 2005, 13, 645–656. [Google Scholar] [CrossRef]
- Salomone, R. Integrated management systems: Experiences in Italian organizations. J. Clean. Prod. 2008, 16, 1786–1806. [Google Scholar] [CrossRef]
- Umweltbendesamt. EMAS in Germany, Systematic Environmental Management: Report on Experience 1995 to 1998; Federal Environmental Agency: Berlin, Germany, 2000.
- Morrow, D.; Rondinelli, D. Adopting Corporate Environmental Management Systems: Motivations and Results of ISO 14001 and EMAS Certification. Eur. Manag. J. 2002, 20, 159–171. [Google Scholar] [CrossRef]
- Bansal, P.; Roth, K. Why companies go green: A model of ecological responsiveness. Acad. Manag. J. 2000, 43, 717–736. [Google Scholar] [CrossRef]
- Neumayer, E.; Perkins, R. Uneven geographies of organizational practice: Explaining the cross-national transfer and adoption of ISO 9000. Econ. Geogr. 2005, 81, 237–259. [Google Scholar] [CrossRef] [Green Version]
- Post, J.E.; Altma, B.W. Managing the environmental change process: Barriers and opportunities. J. Org. Chang. Manag. 1994, 7, 64–81. [Google Scholar] [CrossRef]
- Zilahy, G. Organisational factors determining the implementation of cleaner production measures in the corporate sector. J. Clean. Prod. 2004, 12, 311–319. [Google Scholar] [CrossRef]
- Chavan, M. An appraisal of environment management systems: A competitive advantage for small businesses. Manag. Environ. Q. Int. J. 2005, 16, 444–463. [Google Scholar] [CrossRef]
- Quazi, H.A. Implementation of an environmental management system: The experience of companies operating in Singapore. Ind. Manag. Data Syst. 1999, 99, 302–311. [Google Scholar] [CrossRef]
- Del Brío, J.; Fernández, E.; Junquera, B.; José Vázquez, C. Environmental managers and departments as driving forces of TQEM in Spanish industrial companies. Int. J. Q. Reliab. Manag. 2001, 18, 495–511. [Google Scholar] [CrossRef]
- Johannson, L. The challenge of implementing ISO 14001 for small and medium-sized enterprises—Surviving in the new global jungle. Environ. Q. Manag. 1997, 7, 9–19. [Google Scholar] [CrossRef]
- Masters, R.J. Overcoming the barriers to TQM’s success. Q. Prog. 1996, 29, 53–55. [Google Scholar]
- Walley, N.; Whitehead, B. It’s not easy being green. Harv. Bus. Rev. 1994, 36, 46–52. [Google Scholar]
- Van der Veldt, D. Case studies of ISO 14001: A new business guide for global environmental protection. Environ. Q. Manag. 1997, 7, 1–19. [Google Scholar] [CrossRef]
- Cascio, J. International Environmental Management Standards. In Proceedings of the 1994 IEEE International Symposium on Electronics and the Environment, San Francisco, CA, USA, 2–4 May 1994; pp. 44–49.
- Turk, A.M. The benefits associated with ISO 14001 certification for construction firms: Turkish case. J. Clean. Prod. 2009, 17, 559–569. [Google Scholar] [CrossRef]
- Tarí, J.J.; Molina-Azorín, J.F.; Heras, I. Benefits of the ISO 9001 and ISO 14001 standards: A literature review. J. Ind. Eng. Manag. 2012, 5, 297–322. [Google Scholar] [CrossRef] [Green Version]
- Heras, I.; Arana, G.; Díaz de Junguitu, A.; Espí, M.T.; Molina, J.F. Los Sistemas de Gestión Medioambiental y la Competitividad de las Empresas de la CAPV; Instituto Vasco de Competitividad: Bilbao, Spain, 2008. [Google Scholar]
- Claver-Cortés, E.; Molina-Azorín, J.F.; Tarí, J.J.; López-Gamero, M.D. Enviromental management, quality management and firm performance: A review of empirical studies. In Corporate Enviromental Strategy and Competitive Advantage; Sharma, S., Aragón-Correa, J.A., Eds.; Edward Elgar: Cheltenham, UK, 2005; pp. 157–182. [Google Scholar]
- Molina-Azorín, J.F.; Tarí, J.J.; Claver-Cortés, E.; López-Gamero, M.D. Quality management, environmental management and firm performance: A review of empirical studies and issues of integration. Int. J. Manag. Rev. 2009, 11, 197–222. [Google Scholar] [CrossRef]
- Fisher, R.M. Applying ISO 14001 as a business tool for campus sustainability: A case study from New Zealand. Int. J. Sustain. High. Educ. 2003, 4, 138–150. [Google Scholar] [CrossRef]
- Melnyk, S.A.; Sroufe, R.P.; Calantone, R. Assessing the impact of environmental management systems on corporate and environmental performance. J. Oper. Manag. 2003, 21, 329–351. [Google Scholar] [CrossRef]
- Bansal, P.; Bogner, W. Deciding on ISO 14001: Economics, institutions, and context. Long Range Plan. 2002, 35, 269–290. [Google Scholar] [CrossRef]
- Arena, M.; Azzone, G.; Platti, M. ISO14001: Motivations and benefits in the Italian metal industry. Int. J. Eng. Bus. Manag. 2012, 4. [Google Scholar] [CrossRef]
- Chin, K.S. Factors influencing ISO 14000 implementation in printed circuit board manufacturing industry in Hong Kong. J. Environ. Plan. Manag. 1999, 42, 123–134. [Google Scholar] [CrossRef]
- Psomas, E.L.; Fotopoulos, C.V.; Kafetzopoulos, D.P. Motives, difficulties and benefits in implementing the ISO 14001 Environmental Management System. Manag. Environ. Q. Int. J. 2011, 22, 502–521. [Google Scholar] [CrossRef]
- Rondinelli, D.; Vastag, G. Panacea, common sense, or just a label?: The value of ISO 14001 environmental management systems. Eur. Manag. J. 2000, 18, 499–510. [Google Scholar] [CrossRef]
- Russo, M.; Harrison, A. An empirical study of the impact of ISO 14001 registration on emissions performance. In Proceedings of the Ninth Greening of Industry Network Annual Conference, Bangkok, Thailand, 21–25 January 2000.
- King, A.A.; Lenox, M.J. Who Adopts Management Standards Early? An Examination of ISO 14001 Certifications. Available online: http://proceedings.aom.org/content/2001/1/A1.19 (assessed on 30 September 2016).
- Tan, L.P. Implementing ISO 14001: Is it beneficial for firms in newly industrialized Malaysia? J. Clean. Prod. 2005, 13, 397–404. [Google Scholar] [CrossRef]
- Wagner, M.; Van Phu, N.; Azomahou, T.; Wehrmeyer, W. The relationship between the environmental and economic performance of firms: An empirical analysis of the European paper industry. Corp. Soc. Responsib. Environ. Manag. 2002, 9, 133–146. [Google Scholar] [CrossRef]
- Wahba, H. Does the market value corporate environmental responsibility? An empirical examination. Corp. Soc. Responsib. Environ. Manag. 2008, 15, 89–99. [Google Scholar] [CrossRef]
- Prajogo, D.I.; McDermott, C.M. The relationship between total quality management practices and organizational culture. Int. J. Oper. Prod. Manag. 2005, 25, 1101–1122. [Google Scholar] [CrossRef]
- Naor, M.; Goldstein, S.M.; Linderman, K.W.; Schroeder, R.G. The role of culture as driver of quality management and performance: Infrastructure versus core quality practices. Decis. Sci. 2008, 39, 671–702. [Google Scholar] [CrossRef]
- Zu, X.; Robbins, T.L.; Fredendall, L.D. Mapping the critical links between organizational culture and TQM/Six Sigma practices. Int. J. Prod. Econ. 2010, 123, 86–106. [Google Scholar] [CrossRef]
- Al-Jalahma, R. Impact of Organization Culture on TQM Implementation Barriers. Ph.D. Thesis, Brunel University, Uxbridge, UK, 2012. [Google Scholar]
- Al-Khalifa, K.N.; Aspinwall, E.M. Using the competing values framework to investigate the culture of Qatar industries. Total Q. Manag. 2001, 12, 417–428. [Google Scholar] [CrossRef]
- Hillary, R. (Ed.) Small and Medium-Sized Enterprises and the Environment: Business Imperatives; Greenleaf Publishing: Saltaire, UK, 2000.
- Darnall, N.; Gallagher, D.R.; Andrews, R.; Amaral, D. Environmental management systems: Opportunities for improved environmental and business strategy. Environ. Q. Manag. 2000, 9, 1–9. [Google Scholar]
- Kitazawa, S.; Sarkis, J. The relationship between ISO 14001 and continuous source reduction programs. Int. J. Oper. Prod. Manag. 2000, 20, 225–248. [Google Scholar] [CrossRef]
- Nawrocka, D.; Parker, T. Finding the connection: Environmental management systems and environmental performance. J. Clean. Prod. 2009, 17, 601–607. [Google Scholar] [CrossRef]
- Chan, E.S.; Wong, S.C. Motivations for ISO 14001 in the hotel industry. Tour. Manag. 2006, 27, 481–492. [Google Scholar] [CrossRef]
- Yin, H.; Schmeidler, P.J. Why do standardized ISO 14001 environmental management systems lead to heterogeneous environmental outcomes? Bus. Strategy Environ. 2009, 18, 469–486. [Google Scholar] [CrossRef]
- Podsakoff, P.M.; Organ, D.W. Self-reports in organizational research: Problems and prospects. J. Manag. 1986, 12, 531–544. [Google Scholar] [CrossRef]
- Psomas, E.L.; Kafetzopoulos, D.P.; Fotopoulos, C.V. Developing and validating a measurement instrument of ISO 9001 effectiveness in food manufacturing SMEs. J. Manuf. Technol. Manag. 2012, 24, 52–77. [Google Scholar] [CrossRef]
- Kafetzopoulos, D.P.; Gotzamani, K.D. Critical factors, food quality management and organizational performance. Food Control 2014, 40, 1–11. [Google Scholar] [CrossRef]
- Prajogo, D.; Tang, A.; Lai, K.H. The diffusion of environmental management system and its effect on environmental management practices. Int. J. Oper. Prod. Manag. 2014, 34, 565–585. [Google Scholar] [CrossRef]
- Anderson, J.C.; Gerbing, D.W. Structural Equation Modeling in Practice: A Review and Recommended Two-Step Approach. Psychol. Bull. 1988, 103, 411–423. [Google Scholar] [CrossRef]
- Nunnally, J.C. Psychometric Theory; McGraw-Hill: New York, NY, USA, 1978. [Google Scholar]
- Bagozzi, R.Y.B.; Baumgartner, P.J.H. The Evaluation of Structural Equation Models and Hypothesis Testing; Bagozzi, R., Ed.; Principles of Marketing Research; Backwell Publisher: Cambridge, UK, 1994; pp. 386–419. [Google Scholar]
- Hair, J.F.; Anderson, R.E.; Tatham, R.L.; Black, W.C. Multivariate Data Analysis, 5th ed.; Prentice Hall: Upper Saddle River, NJ, USA, 1999. [Google Scholar]
- Hildebrandt, L. Consumer retail satisfaction in rural areas: A reanalysis of survey data. J. Econ. Psychol. 1987, 8, 19–42. [Google Scholar] [CrossRef]
- Jöreskog, K.G.; Sörbom, D. LISREL 8: Structural Equation Modeling with the SIMPLIS Command Language; Scientific Software International: Skokie, IL, USA, 1993. [Google Scholar]
- Bagozzi, R.P.; Yi, Y. On the evaluation of structural equation models. J. Acad. Mark. Sci. 1998, 16, 74–94. [Google Scholar] [CrossRef]
- Steiger, J.H. Structural model evaluation and modification: An interval estimation approach. Multivar. Behav. Res. 1990, 25, 173–180. [Google Scholar] [CrossRef] [PubMed]
- Fornell, C.; Larcker, D.F. Structural equation models with unobservable variables and measurement error: Algebra and statistics. J. Mark. Res. 1981, 18, 382–388. [Google Scholar] [CrossRef]
- Corbett, C.J. Global diffusion of ISO 9000 certification through supply chains. Manuf. Serv. Oper. Manag. 2006, 8, 330–350. [Google Scholar] [CrossRef]
- Marimon, F.; Casadesús, M.; Heras, I. ISO 9000 and ISO 14000 standards: An international diffusion model. Int. J. Oper. Prod. Manag. 2006, 26, 141–165. [Google Scholar] [CrossRef]
- Boiral, O.; Roy, M.J. ISO 9000: Integration rationales and organizational impacts. Int. J. Oper. Prod. Manag. 2007, 27, 226–247. [Google Scholar] [CrossRef]
- Jang, W.Y.; Lin, C.I. An integrated framework for ISO 9000 motivation, depth of ISO implementation and firm performance: The case of Taiwan. J. Manuf. Technol. Manag. 2008, 19, 194–216. [Google Scholar] [CrossRef]
- Nair, A.; Prajogo, D. Internalisation of ISO 9000 standards: The antecedent role of functionalist and institutionalist drivers and performance implications. Int. J. Prod. Res. 2009, 47, 4545–4568. [Google Scholar] [CrossRef]
- Perez, O.; Amichai-Hamburger, Y.; Shterental, T. The Dynamic of Corporate Self-Regulation: ISO 14001, Environmental Commitment, and Organizational Citizenship Behavior. Law Soc. Rev. 2009, 43, 593–630. [Google Scholar] [CrossRef]
- Fryxell, G.E.; Lo, C.W.H.; Chung, S.S. Influence of motivations for seeking ISO 14001 certification on perceptions of EMS effectiveness in China. Environ. Manag. 2004, 33, 239–251. [Google Scholar] [CrossRef] [PubMed]
- Lee, T.Y. The development of ISO 9000 certification and the future of quality management: A survey of certified firms in Hong Kong. Int. J. Q. Reliab. Manag. 1998, 15, 162–177. [Google Scholar] [CrossRef] [Green Version]
- Jones, R.; Arndt, G.; Kustin, R. ISO 9000 among Australian companies: Impact of time and reasons for seeking certification on perceptions of benefits received. Int. J. Q. Reliab. Manag. 1997, 14, 650–660. [Google Scholar] [CrossRef]
- Martínez-Costa, M.; Martínez-Lorente, A.R.; Choi, T.Y. Simultaneous consideration of TQM and ISO 9000 on performance and motivation: An empirical study of Spanish companies. Int. J. Prod. Econ. 2008, 113, 23–39. [Google Scholar] [CrossRef]
- Boiral, O.; Sala, J.M. Environmental management: Should industry adopt ISO 14001? Bus. Horiz. 1998, 41, 57–64. [Google Scholar] [CrossRef]
- Subrahmanya Bhat, K.; Rajashekhar, J. An empirical study of barriers to TQM implementation in Indian industries. TQM J. 2009, 21, 261–272. [Google Scholar] [CrossRef]
- Pereira-Moliner, J.; Claver-Cortés, E.; Molina-Azorín, J.F.; Tarí, J.J. Quality management, environmental management and firm performance: Direct and mediating effects in the hotel industry. J. Clean. Prod. 2012, 37, 82–92. [Google Scholar] [CrossRef]
- Llach, J.; Perramon, J.; del Mar Alonso-Almeida, M.; Bagur-Femenias, L. Joint impact of quality and environmental practices on firm performance in small service businesses: An empirical study of restaurants. J. Clean. Prod. 2013, 44, 96–104. [Google Scholar] [CrossRef]
- Heras-Saizarbitoria, I.; Boiral, O. ISO 9001 and ISO 14001: Towards a research agenda on management system standards. Int. J. Manag. Rev. 2013, 15, 47–65. [Google Scholar] [CrossRef]
- Ahire, S.L.; Golhar, D.Y.; Waller, M.A. Development and validation of TQM implementation constructs. Decis. Sci. 1996, 27, 23–56. [Google Scholar] [CrossRef]
- Rahman, S.U. A comparative study of TQM practice and organisational performance of SMEs with and without ISO 9000 certification. Int. J. Q. Reliab. Manag. 2001, 18, 35–49. [Google Scholar] [CrossRef]
- Rao, S.S.; Solis, L.E.; Raghunathan, T.S. A framework for international quality management research: Development and validation of a measurement instrument. Total Q. Manag. 1999, 10, 1047–1075. [Google Scholar] [CrossRef]
- Woodside, G.; Yturri, J.; Aurricho, P. ISO 14001 Implementation Manual; Butterworth-Heinemann: Boston, MA, USA, 2004. [Google Scholar]

| Constructs Included SEM | Scale Items A | Mean | (s.d.) B | Exploratory Factor Analysis | |
|---|---|---|---|---|---|
| Loadings | Bartlett’s Test of Sphericity Kaiser–Meyer–Olkin Index (KMO) | ||||
| Motivation: It is not one-dimensional, but is formed by two factors, external and internal motivations | |||||
| External Motivation | |||||
| By customers‘ requirements By providers/suppliers‘ requirements The competition has an Environmental Management System | MO1 MO2 MO3 | 2.43 2.00 2.48 | 1.23 0.98 1.35 | 0.826 0.857 0.723 | χ2(sig. C): 198.992 (0.000) df: 15 KMO: 0.606 Measure of simple adequacy: (0.599–0.722) α Cronbach (External motivation): 0.709 α Cronbach (Internal motivation): 0.752 % Variance (External motivation): 33.85 % Variance (Internal motivation): 32.61 Cumulative % variance: 66.46 |
| Internal Motivation | |||||
| Integrating Environment into corporate strategy Maintain socially-responsible behavior It was a strategic decision of the organization | MO4 MO5 MO6 | 4.03 4.33 4.28 | 1.07 0.87 0.90 | 0.880 0.891 0.670 | |
| Barriers | |||||
| Lack of human and material resources Lack of staff involvement, difficulties involving and motivating internal staff Lack of top management commitment Little concern of the company for issues related to environmental management | BA1 BA2 BA3 BA4 | 2.78 2.94 2.09 2.19 | 1.10 1.26 1.19 1.26 | 0.684 0.865 0.805 0.901 | χ2(sig.): 193.197 (0.000) df: 6 KMO: 0.763 Measure of simple adequacy: (0.831–0.713) α Cronbach: 0.834 % Variance: 66.89 |
| Benefits | |||||
| Improvement in relationships with consumers and increase in consumer confidence and satisfaction Cost savings in the medium and long term Improved productivity Improved business profitability Improved relationships with public administrations It helps to improve internal management of the organization Improves providers‘/suppliers‘ relationships | B1 B2 B3 B4 B5 B6 B7 | 3.49 3.43 3.11 3.09 3.55 3.64 3.04 | 1.21 1.11 1.18 1.18 1.16 1.15 1.09 | 0.666 0.659 0.859 0.853 0.766 0.781 0.665 | χ2(sig.): 362.032 (0.000) df: 21 KMO: 0.874 Measure of simple adequacy: (0.929–0.881) α Cronbach: 0.871 % Variance: 56.91 |
| Scales a | β | CR | AVE | Confirmatory Factor Analysis |
|---|---|---|---|---|
| Composite Reliability Test | ||||
| External Motivations (α = 0.709) | ||||
| By customers’ requirements | 0.610 | 0.71 | 0.57 | χ2(df) = 5.579 (
p
= 0.233),
GFI = 0.981, AGFI = 0.929, CFI = 0.990, RMSEA = 0.059, χ2 normalized (χ2/df) = 1.595 |
| By providers/suppliers’ requirement | 0.977 | |||
| Internal Motivations (α = 0.752) | ||||
| Integrating Environment into corporate strategy | 0.848 | 0.80 | 0.59 | |
| Maintain socially-responsible behavior | 0.872 | |||
| It was a strategic decision of the organization | 0.647 * | |||
| Barriers (α = 0.834) | ||||
| Lack of human and material resources | 0.541 | 0.79 | 0.49 | χ2(df) = 5.720 (
p
= 0.57),
GFI = 0.975, AGFI = 0.875, CFI = 0.981, RMSEA =0.128, χ2 normalized (χ2/df) = 2.860 |
| Lack of staff involvement, difficulties involving and motivating internal staff | 0.782 | |||
| Lack of top management commitment | 0.746 | |||
| Little concern of the company for issues related to environmental management | 0.918 | |||
| Benefits (α = 0.871) | ||||
| Improvement in relationships with consumers and increase in consumer confidence and satisfaction | 0.537 | 0.77 | 0.52 | χ2(df) = 7.534 (
p
= 0.184),
GFI = 0.975, AGFI = 0.926, CFI = 0.989, RMSEA = 0.067 χ2 normalized (χ2/df) = 1.507 |
| Cost savings in medium and long-term | 0.587 | |||
| Improved productivity | 0.901 | |||
| Improved business profitability | 0.895 | |||
| Improved relationships with public administrations | 0.697 |
| AVE | (1) | (2) | (3) | (4) | ||
|---|---|---|---|---|---|---|
| External motivations | 0.57 | c 0.019, (0.087–0.369) | 0.709 a | |||
| Internal motivations | 0.71 | 0.210 *,b | 0.871 | |||
| Barriers | 0.49 | 0.535 | 0.440 | 0.834 | ||
| Benefits | 0.52 | −0.146 * | 0.237 * | −0.185 * | 0.871 | |
| Constructs | Effects | Internal Motivations | External Motivations | Barriers | |
|---|---|---|---|---|---|
| 1 | Barriers | Direct | −0.170 | 0.296 | - |
| Indirect | - | - | - | ||
| Total | −0.170 | 0.296 | - | ||
| 2 | Benefits | Direct | 0.565 | 0.377 | −0.200 |
| Indirect | 0.059 | −0.034 | - | ||
| Total | 0.624 | 0.343 | −0.200 | ||
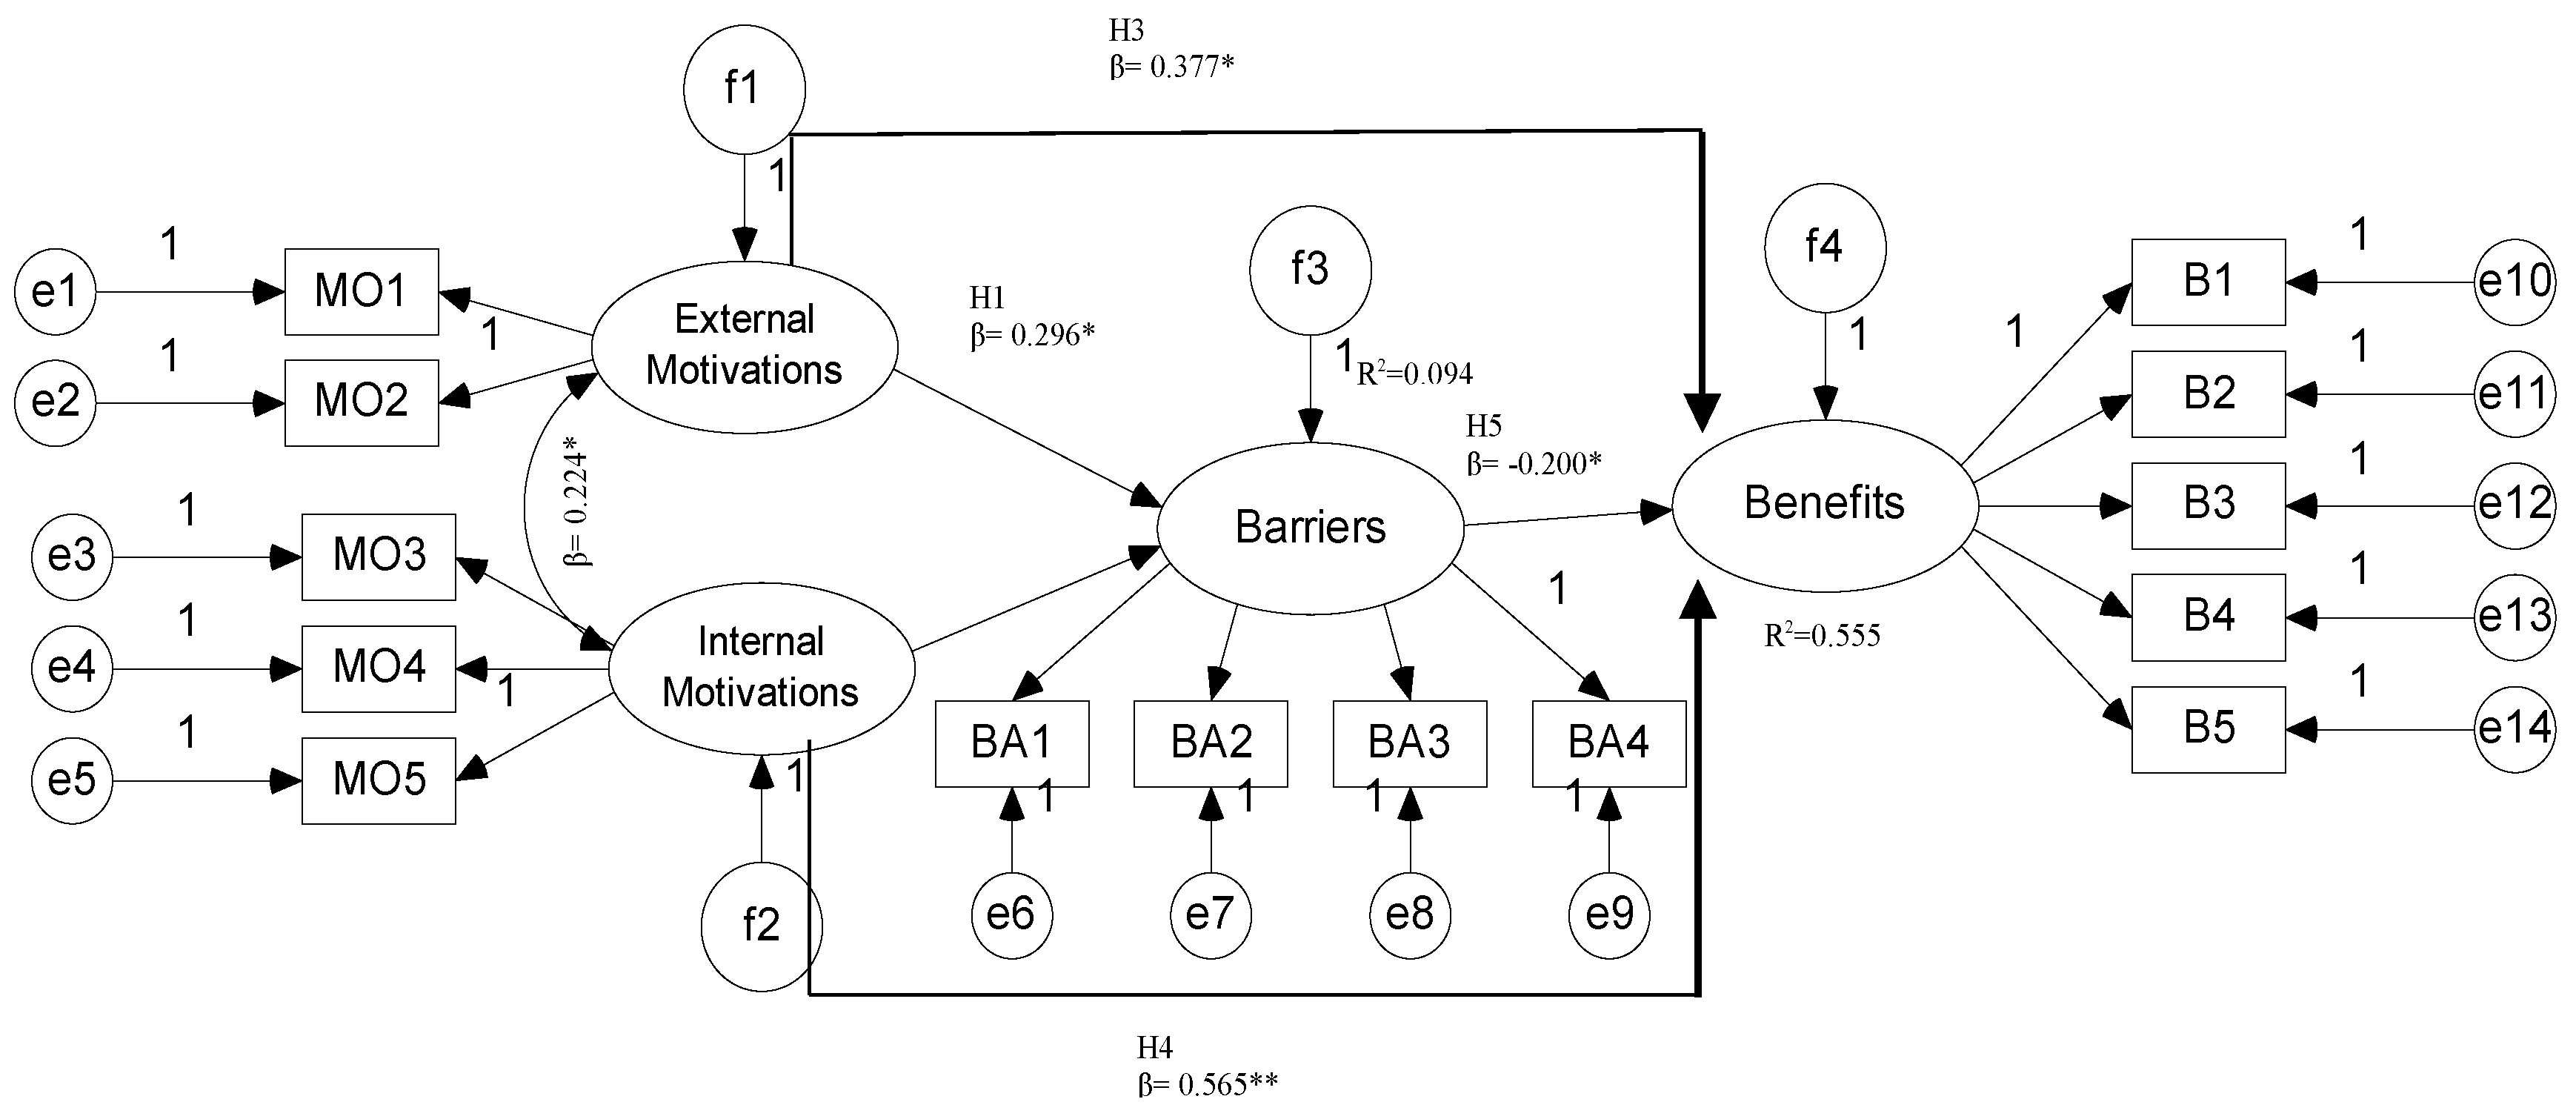
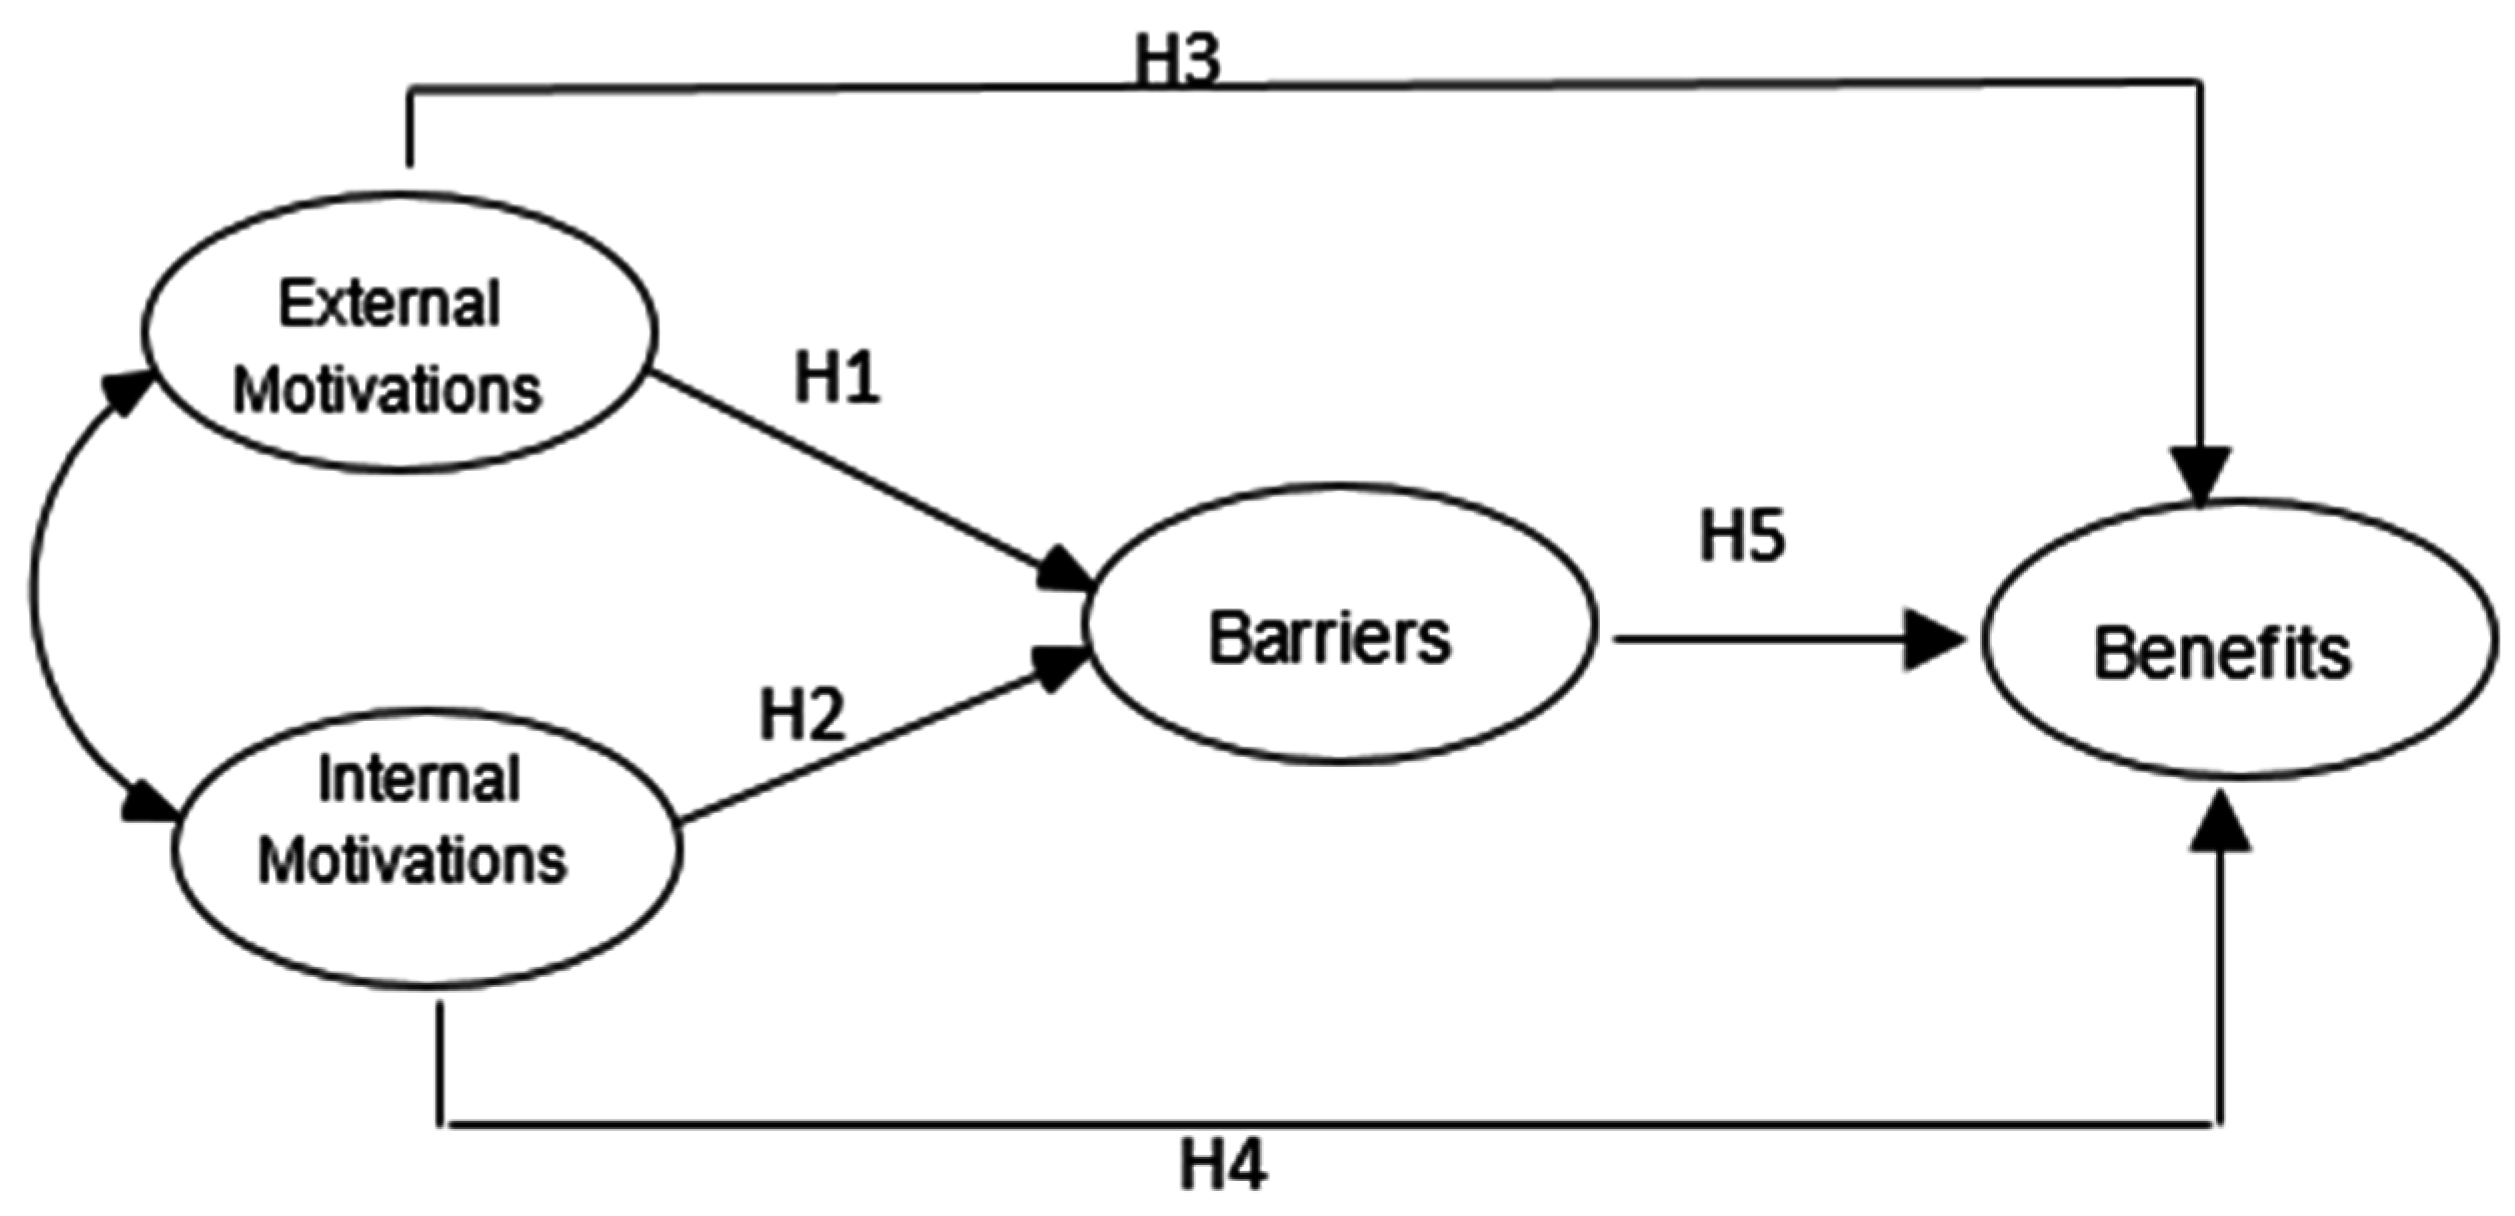
| Constructs | β (Standard Regression Weight) | Hypotheses |
|---|---|---|
| External Motivations -- → Barriers | 0.296 * | H1 not corroborated |
| Internal Motivations -- → Barriers | −0.170 * | H2 corroborated |
| External Motivations -- → Benefits | 0.377 * | H3 corroborated |
| Internal Motivations -- → Benefits | 0.565 ** | H4 corroborated |
| Barriers -- → Benefits | −0.200 * | H5 corroborated |
© 2016 by the authors; licensee MDPI, Basel, Switzerland. This article is an open access article distributed under the terms and conditions of the Creative Commons Attribution (CC-BY) license (http://creativecommons.org/licenses/by/4.0/).
Share and Cite
Álvarez-García, J.; Del RíoRama, M.D.l.C. Sustainability and EMAS: Impact of Motivations and Barriers on the Perceived Benefits from the Adoption of Standards. Sustainability 2016, 8, 1057. https://doi.org/10.3390/su8101057
Álvarez-García J, Del RíoRama MDlC. Sustainability and EMAS: Impact of Motivations and Barriers on the Perceived Benefits from the Adoption of Standards. Sustainability. 2016; 8(10):1057. https://doi.org/10.3390/su8101057
Chicago/Turabian StyleÁlvarez-García, José, and María De la Cruz Del RíoRama. 2016. "Sustainability and EMAS: Impact of Motivations and Barriers on the Perceived Benefits from the Adoption of Standards" Sustainability 8, no. 10: 1057. https://doi.org/10.3390/su8101057