
Analysis of Applications to Improve the Energy Savings in Residential Buildings Based on Systemic Quality Model


Abstract
:1. Introduction
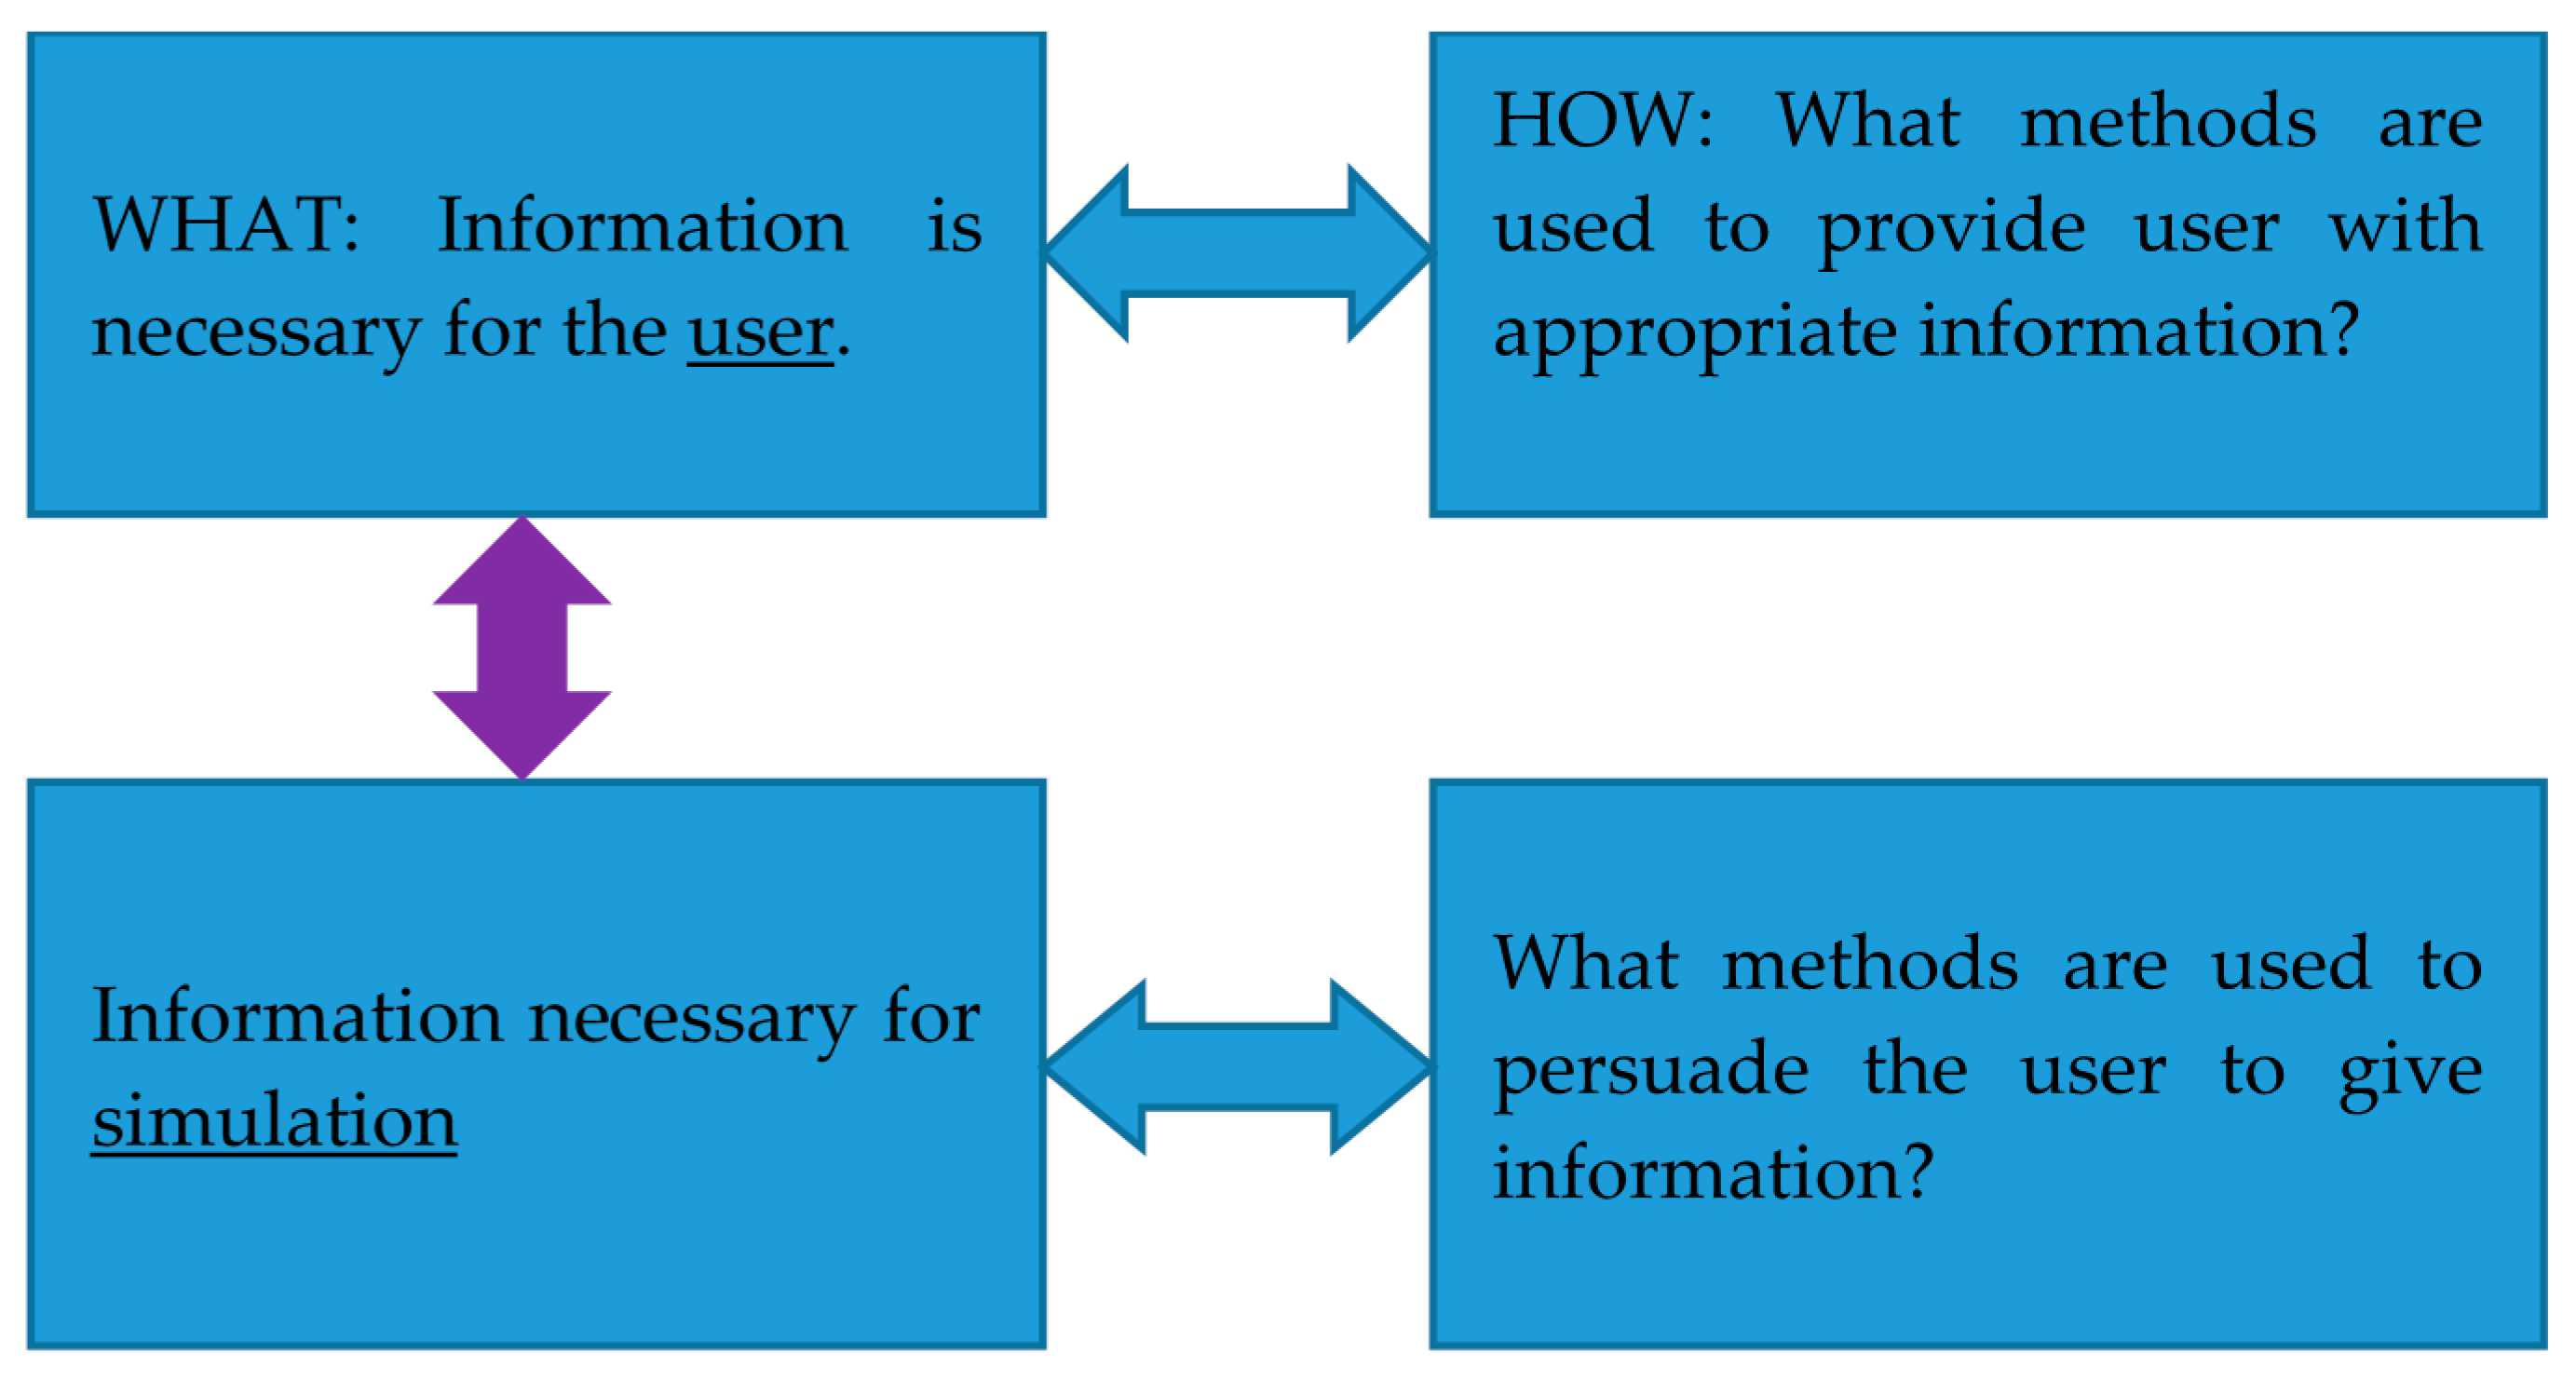
2. Information Quality
3. Tendencies of the EMS Market
3.1. Behavioral Science
- (1)
- Demonstrate to the user that they care about energy conservation. This is referred to as a foot-in-the-door technique. Once an individual states that he/she cares about sustainability and wants to help save energy, it will be easier to involve him/her in future participation because of a commitment to energy conservation. People want to show consistency because it is highly valued in our culture [26].
- (2)
- Involve users in competition. Demonstrate that others use the application and save energy. Demonstrate that someone in a nearby neighborhood saves more energy (and money) and explain how this success was achieved. The competition will last for a finite time to keep the users interests, and propose new challenges to engage new and existing users.
- (3)
- Teach appreciation. Provide feedback on successes and failures; provide simple tips to improve results.
- (4)
- Separate information into easy-to-understand and complete segments; do not ask users to provide too much data at one time, but gradually prompt users for information [24].
3.2. Gamification
- (1)
- Challenge: There are two obvious reasons to manage energy, to spend less money on energy bills and, if the user is concerned about the environment, to waste less energy. However, based on the first rule of persuasion, other people’s behavior is the most powerful source of social influence [24]. For instance, competition could be used to make EMS challenging.
- (2)
- Curiosity: If the information provided is based on reality, is well-explained and allows relationships and connections that are not obvious to an average customer, this information motivates him/her to ask “what else do they have for me?”
- (3)
- Control: If an individual can make changes, see the difference and understand how decisions changed the situation in the application, he/she may attempt to apply these changes in real life to determine if it results in any actual change in energy bills. Finally, the individual is not only engaged throughout the learning process but also contributes to the acquisition of new knowledge and applies the experience to real-life situations [30].
- (4)
- Imagination: Some goals can be more difficult; the customer can use his/her imagination to achieve some specific goals. This prevents the users from becoming bored with the application too quickly.
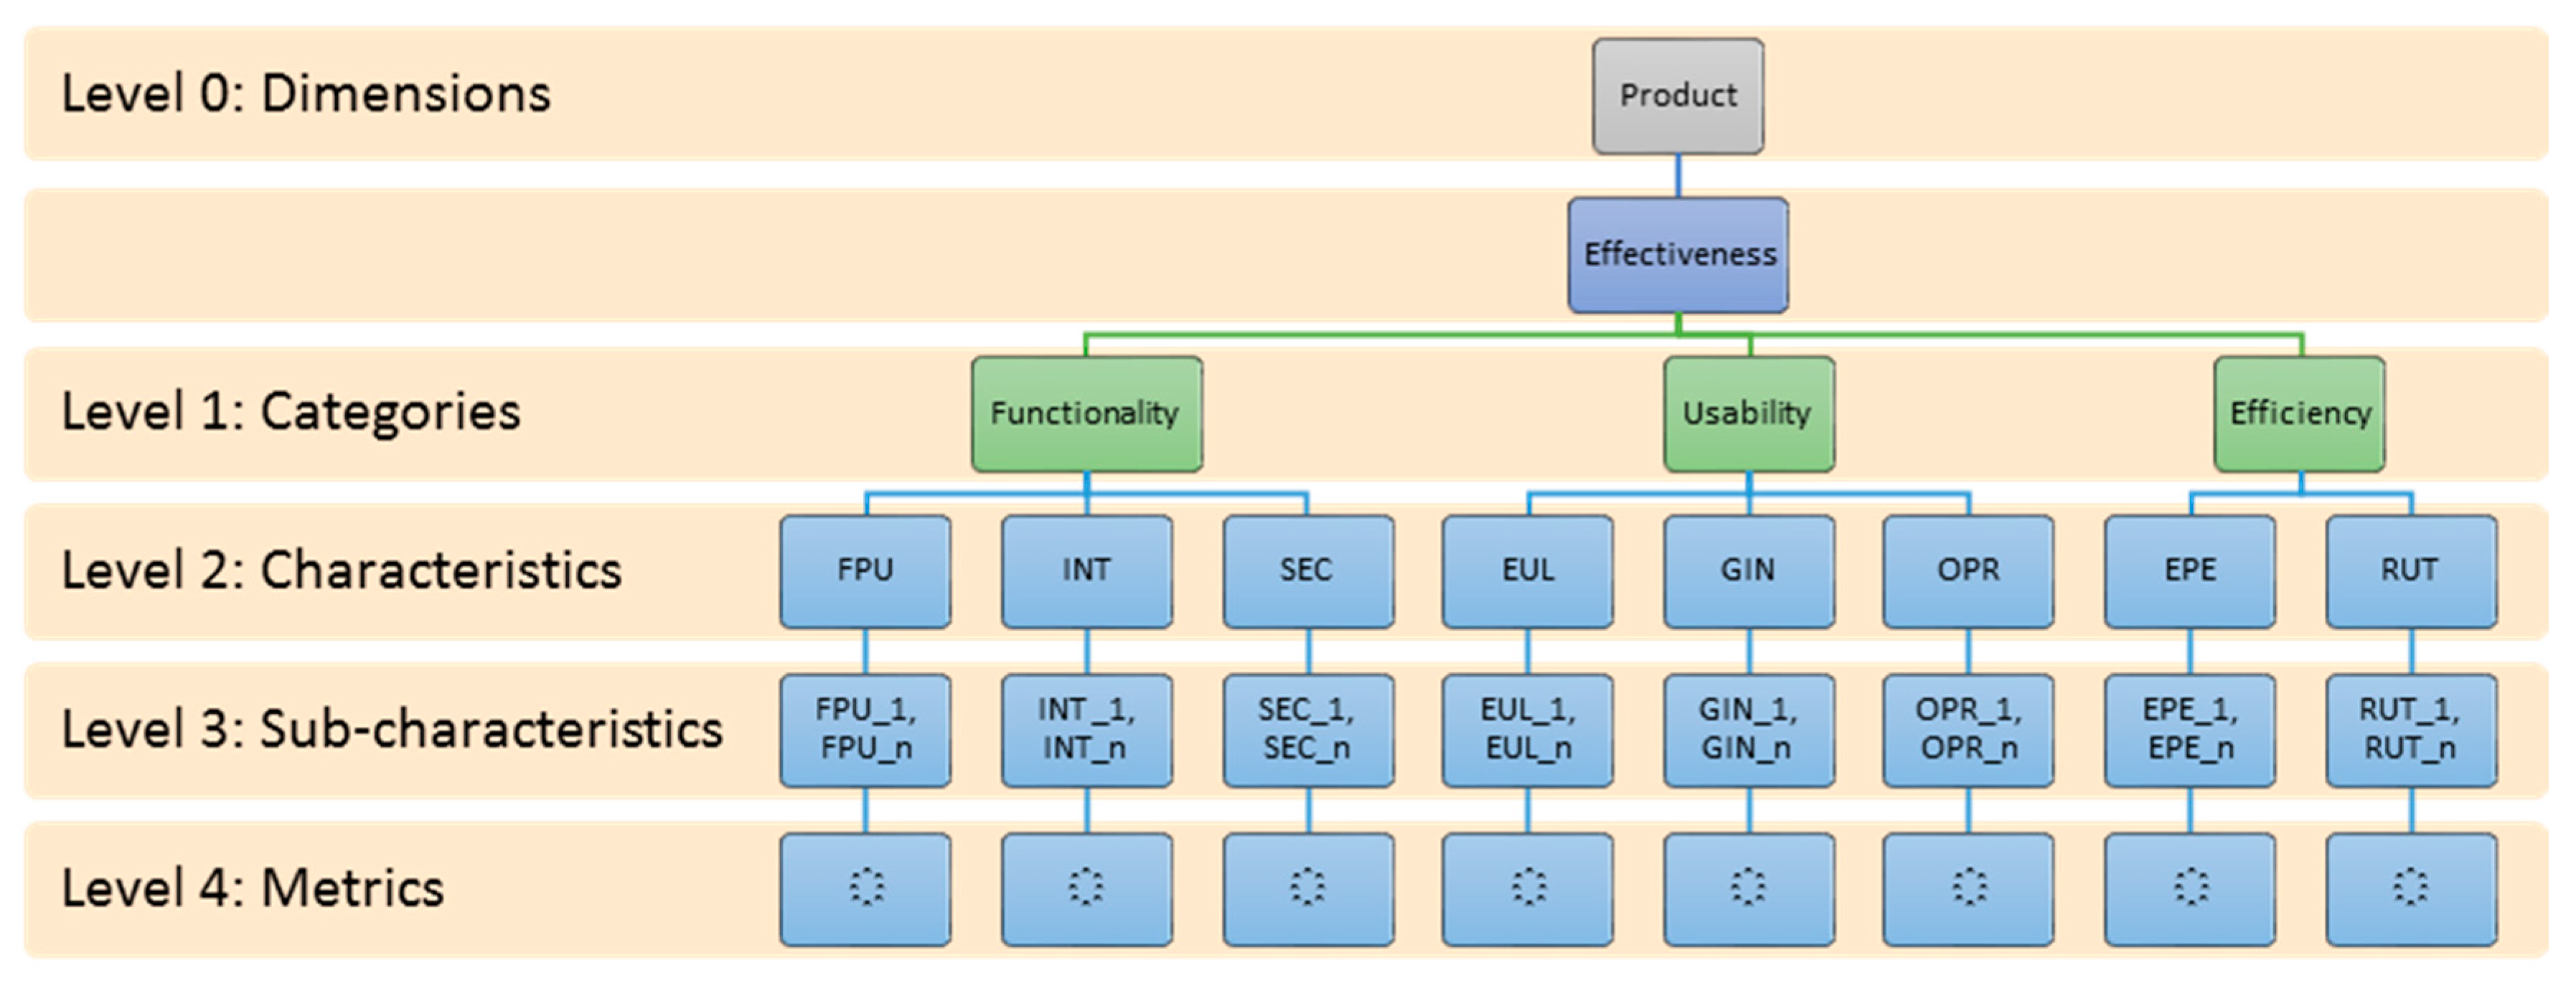
4. SQMO
4.1. Level 0: Dimensions
4.2. Level 1: Categories
- (1)
- Client-Supplier includes processes that have an impact on the client, support the development and transition of the software to the client and provide information regarding the correct operation and use of the software product or service.
- (2)
- Engineering consists of processes that directly specify, implement or maintain the software product, explain its relationship to the system and provide related documentation.
- (3)
- Support consists of processes that can be used by any of the processes (including support ones) at several levels of the acquisition life cycle.
- (4)
- Management consists of processes that contain practices of a generic nature that may be used by managers of the project or process, within a primary life cycle.
- (5)
- Organizational contains processes that establish the organization’s commercial goals and develops a process, a product and good resources (values) that will help the organization attain the goals of the project.
- (1)
- Functionality analyzes if features implemented in the EMS are sufficient for the desired purpose.
- (2)
- Usability analyzes if features are sufficiently usable and considers that the target public of an EMS is not generally comprised of experts regarding energy management systems.
- (3)
- Efficiency analyzes if the time needed to perform the actions are sufficient to maintain the interest of users.
- (1)
- Reliability: The capacity of a software product to maintain a specified level of performance when used under specific conditions.
- (2)
- Maintainability: The capacity of the software to be modified. Modifications may include corrections, improvements or adaptations to the software and adjust to changes in the environment in terms of functional requirements and specifications.
- (3)
- Portability: The capacity of the software product to be transferred from one environment to another.
4.3. Level 2: Characteristics
4.4. Level 3: Metrics
4.5. Lists
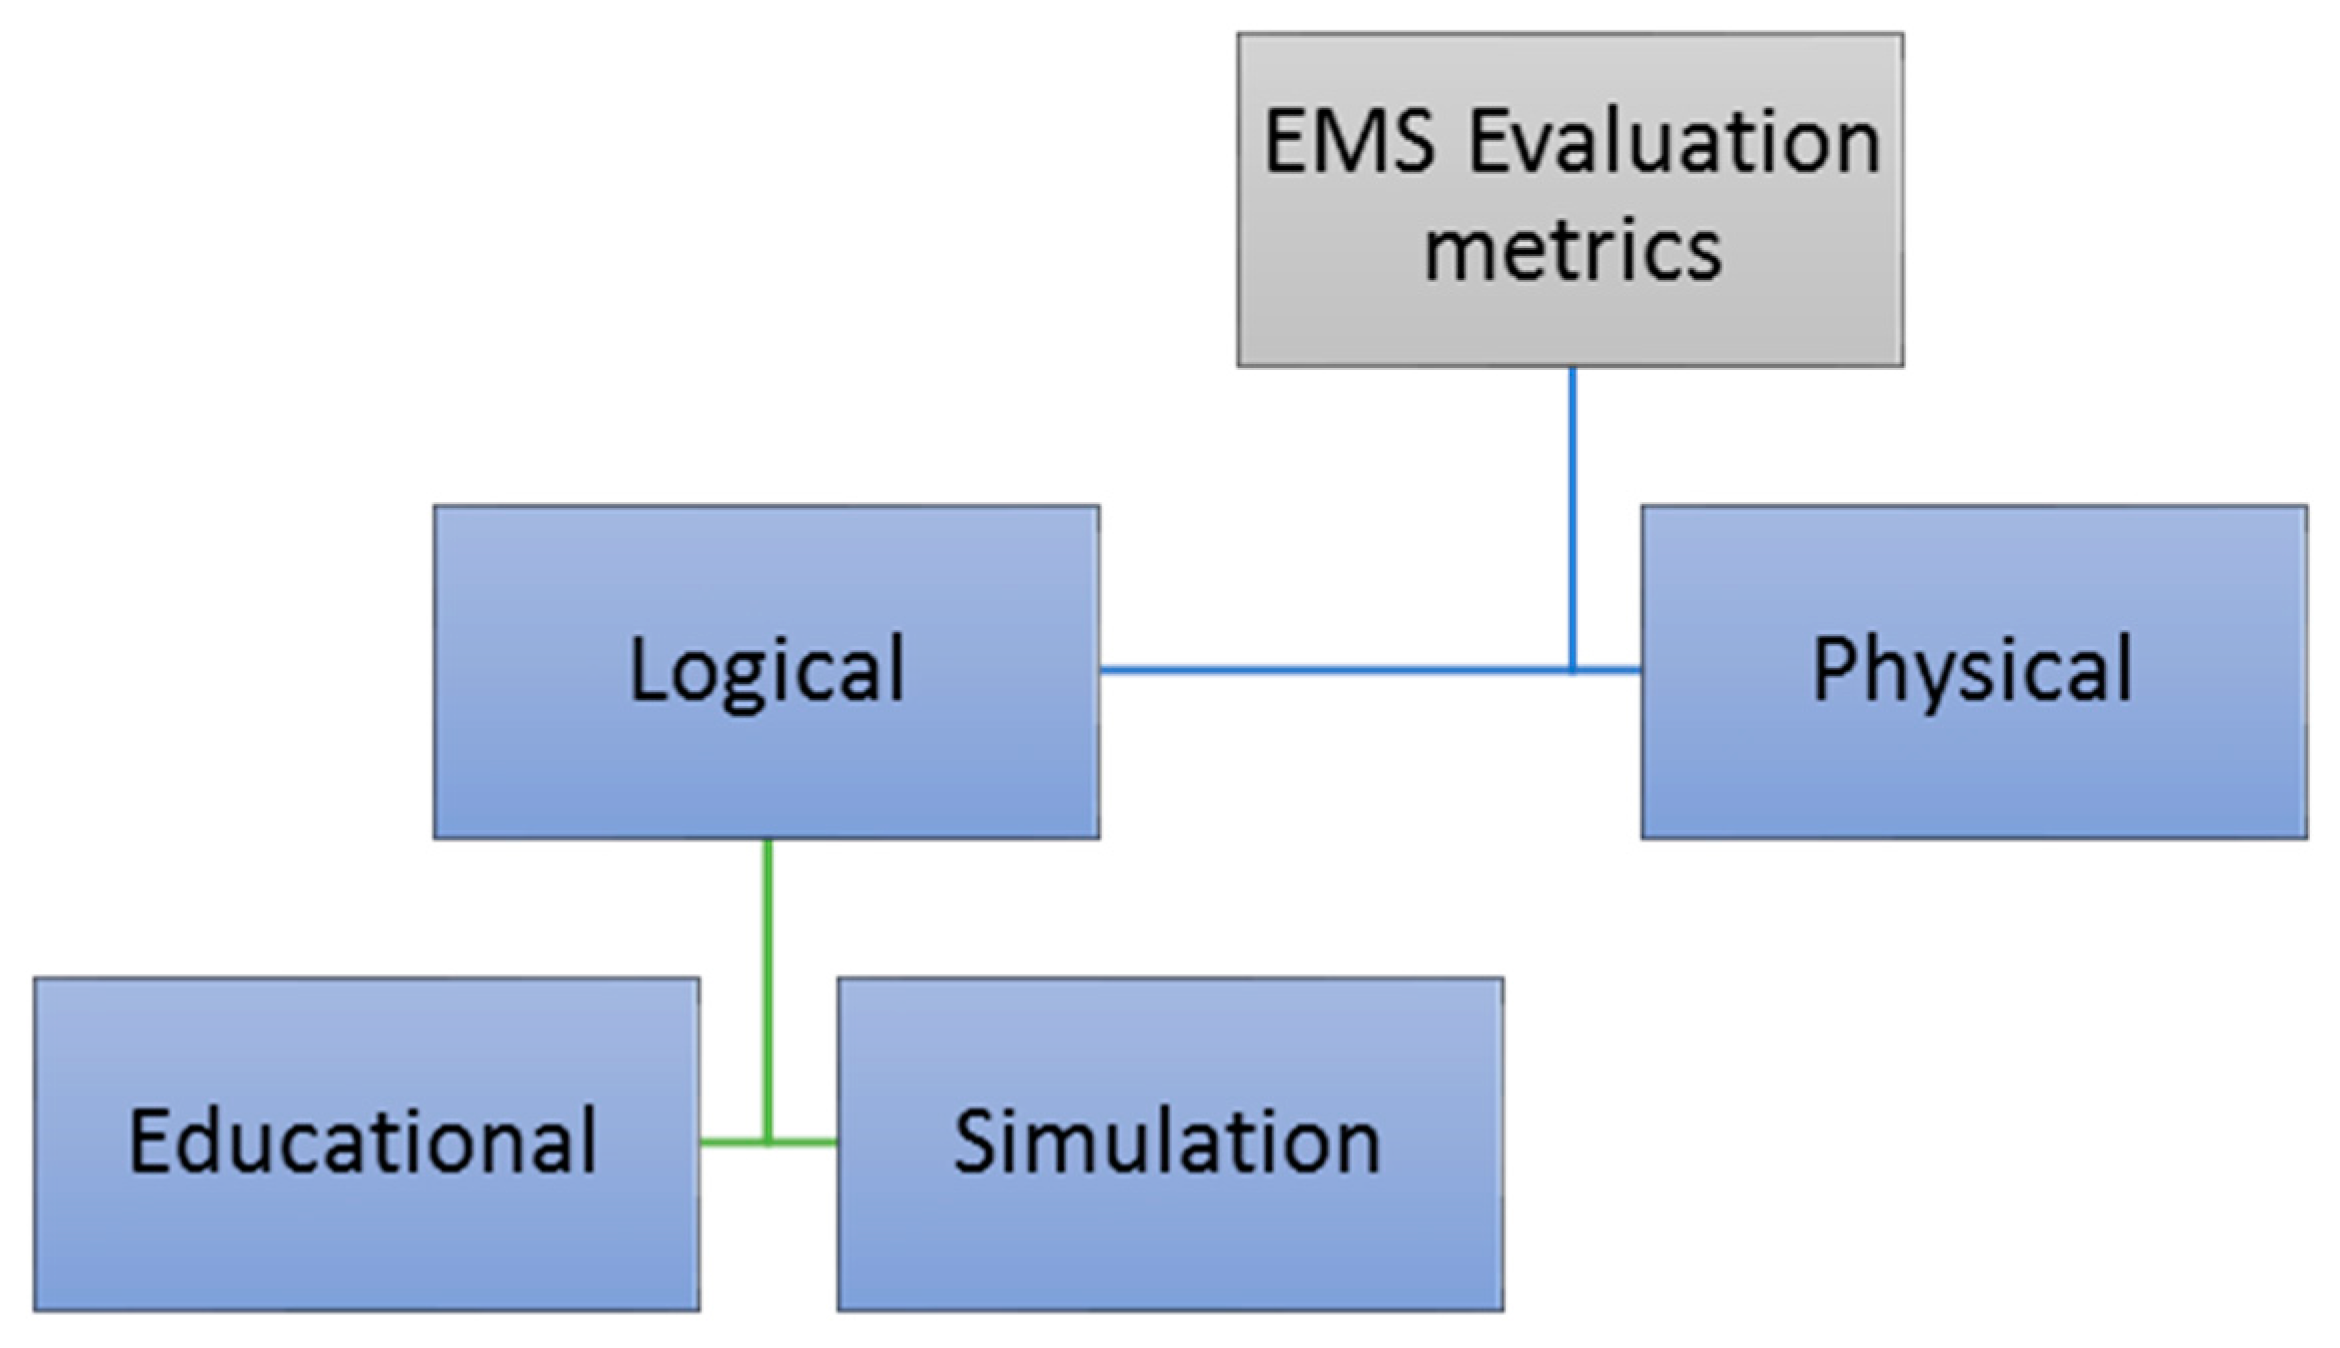
5. Metrics
- (1)
- In regards to the interface and logic of the application, the metrics must be able to evaluate simulation and educational features.
- (2)
- The metrics must evaluate technical features.
- (3)
- The metrics should be divided in two parts for evaluation by software developers and end users because certain metrics may be clear to a technical user but may be unclear for an end user. The developer evaluates both physical and logical features, but the end user only evaluates logical features.
6. Long List of Energy-Related Applications
7. Discussion
8. Conclusions
Acknowledgments
Author Contributions
Conflicts of Interest
Abbreviations
| EMS | Energy Management System. |
| ACE | Intelligent Management System for Energy Efficient Buildings user behavior. |
| EMAS | Eco-Management and Audit Scheme. |
| SQMO | Systemic Quality Model. |
References
- International Union for Conservation of Nature and Natural Resources; United Nations Environment Programme; Word Wide Fund. World Conservation Strategy. 1980. Available online: https://portals.iucn.org/library/efiles/documents/WCs-004.pdf (accessed on 12 October 2016).
- Fehrenbacher, K. 5 Reasons Google PowerMeter Didn’t Take off. GIGAOM. 2011. Available online: https://gigaom.com/2011/06/26/5-reasons-google-powermeter-didnt-take-off/ (accessed on 10 July 2016).
- Fehrenbacher, K. 5 Reasons Why Microsoft Hohm Didn’t Take off. GIGAOM. 2011. Available online: https://gigaom.com/2011/07/01/5-reasons-why-microsoft-hohm-didnt-take-off/ (accessed on 10 July 2016).
- Tourais, P.; Videira, N. Why, How and What Do Organizations Achieve with the Implementation of Environmental Management Systems?—Lessons from a Comprehensive Review on the Eco-Management and Audit Scheme. Sustainability 2016, 8, 283. [Google Scholar] [CrossRef]
- Merli, R.; Preziosi, M.; Ippolito, C. Promoting Sustainability through EMS Application: A Survey Examining the Critical Factors about EMAS Registration in Italian Organizations. Sustainability 2015, 8, 197. [Google Scholar] [CrossRef]
- Yazgan, H.; Boran, S.; Goztepe, K. An ERP software selection process with using artificial neural network based on analytic network process approach. Expert Syst. Appl. 2009, 36, 9214–9222. [Google Scholar] [CrossRef]
- Gürbüz, T.; Alptekin, S.; Işıklar Alptekin, G. A hybrid MCDM methodology for ERP selection problem with interacting criteria. Decis. Support Syst. 2012, 54, 206–214. [Google Scholar] [CrossRef]
- Zaidan, A.; Zaidan, B.; Hussain, M.; Haiqi, A.; Mat Kiah, M.; Abdulnabi, M. Multi-criteria analysis for OS-EMR software selection problem: A comparative study. Decis. Support Syst. 2015, 78, 15–27. [Google Scholar] [CrossRef]
- Wevera, R.; Kuijkb, J.; Bok, C. User-centred design for sustainable behaviour. Int. J. Sustain. Eng. 2008, 1, 9–20. [Google Scholar] [CrossRef]
- Foster, D.; Lawson, S.; Wardman, J.; Blythe, M.; Linehan, C. “Watts in it for me?”: Design implications for implementing effective energy interventions in organisations. In Proceedings of the SIGCHI Conference on Human Factors in Computing Systems, Austin, TX, USA, 5–10 May 2012; pp. 2357–2366.
- Zachrisson, J.; Boks, C. Exploring behavioural psychology to support design for sustainable behaviour research. J. Des. Res. 2012, 10, 50–66. [Google Scholar] [CrossRef]
- Woods, R.; Skeie, K.S.; Haase, M. The Influence of User Behaviour on Energy Use in European Shopping Centres. Sustain. Dev. 2016. [Google Scholar] [CrossRef]
- Alción, A.; Kuchen, E.; Alamino Naranjo, Y. Providing accurate information may help to modify the behavior of the user Behaviour indoors. In Proceedings of the 31th PLEA Conference—Architecture in (R)Evolution, Bologna, Italy, 9–11 September 2015.
- Universitat Politècnica de Catalunya—BarcelonaTech. Intelligent Management System for Energy Efficient Buildings User Behavior. InLab FIB. 2015. Available online: https://inlab.fib.upc.edu/en/intelligent-management-system-energy-efficient-buildings-user-behavior-ace (accessed on 10 July 2016).
- Xepapadeas, A. Ecological economics. In The New Palgrave Dictionary of Economics, 2nd ed.; Palgrave Macmillan: London, UK, 2008. [Google Scholar]
- Faber, M. How to be an ecological economist. Ecol. Econ. 2008, 66, 1–7. [Google Scholar] [CrossRef]
- Green Button Data. Available online: http://www.greenbuttondata.org/learn/ (accessed on 10 July 2016).
- Energy Challenge. 2013. Available online: http://energychallenge.energy.gov/ (accessed on 10 July 2016).
- Rincon, G.; Alvarez, M.; Perez, M.; Hernandez, S. A discrete-event simulation and continuous software evaluation on a systemic quality model: An oil industry case. Inf. Manag. 2005, 42, 1051–1066. [Google Scholar] [CrossRef]
- House of Commons, Energy and Climate Change Committee. Consumer Engagement with Energy Markets; House of Commons: London, UK, 2013. [Google Scholar]
- Nejat, P.; Jomehzadeh, F.; Taheri, M.M.; Gohari, M.; Majid, M.Z. A global review of energy consumption, CO2 emissions and policy in the residential sector (with an overview of the top ten CO2 emitting countries). Renew. Sustain. Energy Rev. 2015, 43, 843–862. [Google Scholar] [CrossRef]
- OPOWER. Transform Every Customer into a Demand Response Resource. 2014. Available online: http://fuelrfuture.com/business/TurnEveryCustomerIntoADemandResponseResource.pdf (accessed on 12 October 2016).
- OPOWER. Home Energy Report. 2016. Available online: http://ilsagfiles.org/SAG_files/Evaluation_Documents/ComEd/ComEd_EPY7_Evaluation_Reports/ComEd_HER_Opower_PY7_Evaluation_Report_2016-02-15_Final.pdf (accessed on 12 October 2016).
- Goldstein, N. Yes!: 50 Scientifically Proven Ways to Be Persuasive; Free Press: New York, NY, USA, 2008. [Google Scholar]
- Letwin, O.; Barker, G.; Stunell OBE, A. Behaviour Change and Energy Use. 2011. Available online: https://www.gov.uk/government/uploads/system/uploads/attachment_data/file/60536/behaviour-change-and-energy-use.pdf (accessed on 12 October 2016). [Google Scholar]
- Cialdini, R. Influence: The Psychology of Persuasion; HarperCollins Publishers: New York, NY, USA, 2009. [Google Scholar]
- eLearning Industry. Free eBook—How Gamification Reshapes Learning. Available online: http://elearningindustry.com/how-gamification-reshapes-learning#an-coppens (accessed on 2 May 2015).
- Adams, E. The Designer’s Notebook: Sorting out the Genre Muddle. GAMASUTRA. 2009. Available online: http://www.gamasutra.com/view/feature/4074/the_designers_notebook_sorting_.php?page=2 (accessed on 10 July 2016).
- Mouaheb, H.; Fahli, A.; Moussetad, M.; Eljamali, S. The Serious Game: What Educational Benefits? Procedia Soc. Behav. Sci. 2012, 46, 5502–5508. [Google Scholar] [CrossRef]
- Villar, M. 7 Essential Criteria for Evaluating Mobile Educational Applications. 2012. Available online: https://mayraixavillar.wordpress.com/2012/12/06/7-essential-criteria-for-evaluating-mobile-educational-applications/ (accessed on 10 July 2016).
- Ortega, M.; Perez, M.; Rojas, T. Construction of a systemic quality model for evaluating a software product. Softw. Qual. J. 2003, 11, 219–242. [Google Scholar] [CrossRef]
- Blanc, M.; Jelassi, M. DSS software selection: A multiple criteria decision methodology. Inf. Manag. 1989, 17, 49–65. [Google Scholar] [CrossRef]
- Universitat Politècnica de Catalunya—BarcelonaTech. ACE. 2015. Available online: https://ace.fib.upc.edu (accessed on 15 July 2016).
- Kinética Mobile. Boltio. 2014. Available online: http://www.kinetica.mobi/pagar-menos-luz-sera-posible-con-la-app-boltio/ (accessed on 10 July 2016).
- TerraPass. Carbon Calculator. 2016. Available online: http://www.terrapass.com/carbon-footprint-calculator/ (accessed on 15 July 2016).
- Control4 Corporation. Control4. 2016. Available online: http://www.control4.com/ (accessed on 10 July 2016).
- Fogt, R. Online Conversion. 2010. Available online: http://www.onlineconversion.com/energy.htm (accessed on 10 July 2016).
- Dexma Energy Manegament. Dexmatech: DEXCell Energy Manegament. Available online: http://www.dexmatech.com/ (accessed on 15 July 2016).
- Wood, H.; Gabriel, D.; Ing, M.; Hinman, R. DRIVE™ System. 2014. Available online: http://devpost.com/software/drive-mobile-app (accessed on 10 July 2016).
- Instituto Tecnológico de Galicia. E4Rsim Project. 2013. Available online: http://www.itg.es/?p=11619 (accessed on 15 July 2016).
- EcoFactor. Three Energy Services. One Platform. 2015. Available online: http://www.ecofactor.com/ (accessed on 15 July 2016).
- Pugazhenthi, V. Energy Cost Calculator. 2015. Available online: https://itunes.apple.com/us/app/energy-cost-calculator/id531132387?mt=8 (accessed on 15 July 2016).
- iOS Apps Austria. Energy Tracker. 2011. Available online: https://itunes.apple.com/us/app/energy-tracker/id428830805?mt (accessed on 15 July 2016).
- ETRES Consultores. Ahorra Tu Energía v2.0. 2016. Available online: http://www.ahorratuenergia.es/ (accessed on 15 July 2016).
- Hill, D. GEMS. 2014. Available online: http://devpost.com/software/gems (accessed on 15 July 2016).
- Greenbutton. Green Button Alliance: Greenbutton. Available online: http://www.greenbuttondata.org/ (accessed on 15 July 2016).
- Zerofootprint Software Inc. GoodCoins. 2015. Available online: https://www.goodcoins.ca/portal/rewards? (accessed on 15 July 2016).
- EnergyCAP, Inc. EnergyCAP. 2016. Available online: http://www.energycap.com/software (accessed on 15 July 2016).
- iOS iPhone Utilities Green Outlet. 2011. Available online: http://appshopper.com/utilities/green-outlet (accessed on 15 July 2016).
- The Alliance to Save Energy. Energyhog. 2016. Available online: http://www.energyhog.org/childrens.htm (accessed on 15 July 2016).
- Microsoft Corporation. Hohm. 2009. Available online: https://en.wikipedia.org/wiki/Hohm (accessed on 15 July 2016).
- iControl Networks, Inc. iControl. 2016. Available online: https://www.icontrol.com/ (accessed on 15 July 2016).
- JouleBug. 2016. Available online: https://joulebug.com/ (accessed on 15 July 2016).
- Touchstone Energy. Kids Energy Zone. 2016. Available online: http://www.kidsenergyzone.com/games/activitiesdetail63.cfm?activityid=8 (accessed on 15 July 2016).
- Kill-Ur-Watts. 2014. Available online: https://www.facebook.com/KillUrWatts (accessed on 15 July 2016).
- Edgar, T.; Jhaveri, N. Leafully. 2012. Available online: http://appsforenergy.devpost.com/submissions/7987-leafully (accessed on 15 July 2016).
- The3devs. Luz + Precio. 2016. Available online: https://play.google.com/store/apps/details?id=com.the3devs.luzplus&hl=es (accessed on 15 July 2016).
- WegoWise Inc. WegoWise. 2016. Available online: https://www.wegowise.com/ (accessed on 15 July 2016).
- Haley, G. Meter Readings. 2011. Available online: https://itunes.apple.com/us/app/meter-readings/id320551309?mt=8 (accessed on 15 July 2016).
- Zero Above Ltd. My CO2 Calculator. 2012. Available online: https://play.google.com/store/apps/details?id=com.zeroabove.co2&hl=en (accessed on 15 July 2016).
- Universitat Politècnica de Catalunya—BarcelonaTech. NECADA. 2016. Available online: http://necada.com/ (accessed on 15 July 2016).
- Fonseca i Casas, P.; Fonseca i Casas, A. NECADA. Optimization Software for Sustainable Architecture. In Proceedings of the 14th Conference of International Building Performance Simulation Association, Hyderabad, India, 7–9 December 2015.
- Nest Labs. NEST. 2016. Available online: https://nest.com/ (accessed on 15 July 2016).
- Sustain Ability International. Ollie’s Club Energy Saving. 2014. Available online: http://www.olliesworld.com/club/gamehouse.htm (accessed on 15 July 2016).
- Opower Inc. Opower. 2016. Available online: https://opower.com/ (accessed on 15 July 2016).
- Google Corporation. Google PowerMeter. 2011. Available online: https://en.wikipedia.org/wiki/Google_PowerMeter (accessed on 15 July 2016).
- Neapp Soft. Precio de la Luz. 2015. Available online: https://play.google.com/store/apps/details?id=com.neappsoft.precioluz&hl=es (accessed on 15 July 2016).
- Redpolas Precio Luz. 2014. Available online: https://play.google.com/store/apps/details?id=com.consule.consule (accessed on 15 July 2016).
- Enerbyte. 2015. Available online: http://enerbyte.com/ (accessed on 15 July 2016).
- Emp Mobile. Standby Energy Cost Calculator. 2012. Available online: http://www.amazon.com/Emp-Mobile-Standby-Energy-Calculator/dp/B008X2YBR0 (accessed on 15 July 2016).
- AppEventos Mobile S.L. Tarifazo. Tarifa de la Luz. 2014. Available online: https://play.google.com/store/apps/details?id=com.appeventos.tarifazo (accessed on 15 July 2016).
- Tendril. 2016. Available online: https://www.tendrilinc.com/ (accessed on 15 July 2016).
- UK Crown. Green Deal: Energy Saving For Your Home. 2014. Available online: https://www.gov.uk/green-deal-energy-saving-measures (accessed on 15 July 2016). [Google Scholar]
- Schneider Electric USA, Inc. Energy Monitor Pro. 2016. Available online: https://itunes.apple.com/us/app/wiser-home/id470316647?mt=8 (accessed on 15 July 2016).
- University of California. Wotz. 2016. Available online: http://wotz.ps.uci.edu/ (accessed on 15 July 2016).


| Category | Characteristics |
|---|---|
| Functionality | Fit to Purpose (FPU) |
| Interoperability (INT) | |
| Security (SEC) | |
| Usability | Easy of Understanding and Learning (EUL) |
| Graphical Interface (GIN) | |
| Operability (OPR) | |
| Efficiency | Execution Performance (EPE) |
| Resource Utilization (RUT) |
| Type | Description |
|---|---|
| Game | Is not usually connected with the reality, gives the idea how to spend energy, advices in a form of a play. |
| Energy Management tool with the smart meter | Usage of smart meter allows to obtain quite informative real-time or near real-time data and then watch the changes in the application. |
| Power Management entering invoice data | The information added by you or provided by Energy Company automatically. You can only see the difference by period. |
| Energy costs simulator | Simulates your expenses based on comprehensive data you entered about your home. |
| Emanation of carbon simulation | Simulates the emission of carbon you produce based on energy used by your home and your lifestyle. |
| Project | Operative | Company | Description |
|---|---|---|---|
| ACE [33] | Yes | Universitat Politècnica de Catalunya—BarcelonaTech, VIAS, Lavola | The web application is based on the characteristics of the building and the resident use, the system provides a set of recommendations for reducing energy expenditure and consumption associated to CO2. |
| Boltio [34] | Yes | Kinética Mobile | It is a simple application that shows the price of kilowatt per hour. Thus, we can choose the right time to turn certain appliances and save on the bill. |
| Carbon Footprint Calculator [35] | Yes | TerraPass | Carbon footprint calculator for individuals and households. |
| Control4 [36] | Yes | Control4 | A home automation system from with the aim to turn your home into a smart home. |
| Online Conversion [37] | Yes | Robert Fogt. | A-conversion tool for energy units. |
| DEXCell [38] | Yes | Dexmatech | Software-as-a-Service platform to reduce energy use, through analysis, alarms and recommendations, compatible with most meters, BMS systems and other devices |
| Drive Mobile App [39] | Yes | Holland Wood, Derek Gabriel, Matthew Ing, and Rod Hinman | The DRIVE™ System is a patent-pending solution that provides incentives to residential customers to reduce power consumption during peak and critical peak times. |
| E4RSIM [40] | No | E4RSIM | A international project from 2011 to 2013 that develops a tool that allows to analyze the energy consumption of a building, with the aim to improve the rehabilitation. |
| EcoFactor [41] | Yes | EcoFactor | Ecofactor provides automated energy savings, comfort and control through energy efficiency, demand response and HVAC performance monitoring services. |
| Energy Cost Calculator [42] | Yes | Vpugazhenthi | Calculates the Operating cost and Energy Usage of Electric Equipment or Machinery. |
| Energy Tracker [43] | Yes | iOS Apps Austria | Application that allows to track of how much energy are used on average. This allows to estimate the bill. |
| Etres Consultores [44] | Yes | Ahorra tu energía | Web application that allows to generate an automatic report for your building. |
| GEMS [45] | Yes | Green Impact Campaign | The GEMS application allows student volunteers to survey building systems using an easy to understand, self-training guide for small businesses in their community. |
| Greenbutton [46] | Yes | Green Button Alliance, Inc. | Green Button is a secure way to get your energy usage information electronically. |
| GoodCoins [47] | Yes | Zerofootprint | A social currency that engages communities and drives sustainable change. Essentially, it rewards good behavior with good things. |
| GreenQuest [48] | Yes | EnergyCap | A personal energy efficiency manager. |
| Green Outlet [49] | No | iOS iPhon Utilities | Application with the aim to help the user in the reduction of electricity use. |
| Hog Busters Energy Hogs [50] | Yes | Alliance to Save Energy | The Energy Hog Challenge is a set of classroom activities that guide children through lessons about different sources of energy, how we use energy at home, and how to bust energy hogs to save energy. |
| Hohm [51] | No | Microsoft | Microsoft Hohm was an online web application by Microsoft that enables consumers to analyze their energy usage and provides energy saving recommendations. |
| iControl [52] | Yes | iControl Networks | Smart Home devices and solutions. |
| JoulBug [53] | Yes | Cleanbit Systems | JouleBug is the easy way to make your everyday habits more sustainable, at home, work, and play. Discover how you and your friends can use resources—without using them up. |
| Kids Energy Zone [54] | Yes | Touchstone Energy | A fully integrated energy education campaign that includes web-based lessons, web activities and games, and printed materials. The program teaches children about energy, electrical safety, energy efficiency and renewable energy. |
| Kill-Ur-Watts [55] | Yes | KeyLogic Systems | Kill-Ur-Watts is an iPhone/iPad/iPod Touch application that uses your Green Button data provided by your electric utility provider. The application will calculate your annual, monthly, daily or hourly usage and display graphical representation of each. |
| Leafully [56] | Yes | Trick Shot Studios | Leafully recognizes that energy usage is more than just electricity usage and thus tries to give the user a total tree footprint—the amount of trees needed to offset the pollution created by one’s energy consumption. |
| Luz + Precio [57] | Yes | the3devs | Gives recommendations of when are the best times to consume electricity in Spain. |
| Melon [58] | Yes | Wegowise | Benchmarking tool for the buildings energy and water usage. |
| Meter Readings [59] | Yes | Graham Haley | Application to read meters (electricity, gas, water, …) on the phone. |
| My CO2 Calculator [60] | Yes | Zero Above Ltd. | Allows to quantify your effect on the environment whilst at work, home and while travelling. |
| NECADA [61,62] | Yes | Universitat Politècnica de Catalunya—BarcelonaTech | Urban area and building co-simulator capable to find the optimal parameters to improve sustainability. |
| Nest [63] | Yes | Nest Labs | A home automation company that builds programmable, self-learning thermostats as well as builds smoke detectors, security cameras and other systems. |
| Ollie’s club Energy Saving [64] | No | Sustain Ability International | A game with the goal to reduce energy in a house and make the energy usage meter go down. |
| OPOWER [65] | Yes | ORACLE | A set of solutions to achieve an efficiency use of the energy. |
| PowerMeter [66] | No | Google PowerMeter was a software project of Google’s philanthropic arm, Google.org, to help consumers track their home electricity usage. | |
| Precio de la Luz [67] | Yes | Neapp Soft | A simple application to know in time real the cost of the energy electric that is consumed in your home or place of work in Spain. |
| Precio Luz [68] | Yes | redpolas | With this application you can access to the ranking of the energy auction that will be applied to the current and the next day in Spain. |
| EnerByte [69] | Yes | Enerbyte | Virtual Energy Advisor guides you to be more efficient, according to your consumption profile, your behavior, and your motivation. |
| Standby Energy Cost Calculator [70] | Yes | EmpMobile | Calculate how much money you are spending just by leaving common electronics plugged in. |
| Tarifazo [71] | Yes | AppEventos Mobile S.L. | Save energy and reduce the bill applying the new Spain electric rates. |
| Tendril [72] | Yes | Tendril | A software platform using behavioral science and energy information to improve how products are marketed and consumed. |
| The Green Deal App [73] | No | Green Deal Group | The Green Deal UK program helps you make energy-saving improvements to your home and find the best way to pay for them. |
| Wiser EMS [74] | Yes | Schneider Electric’s | The Energy Monitor Pro system, a comprehensive demand management solution for utilities and consumers, allows homeowners to reduce or shift energy use during peak times and helps electricity providers improve grid efficiency and network reliability. |
| Wotz [75] | Yes | Students work | A game using GreenButton data to represent the amount of energy used on a building. |
| Criterion | Description and Importance to the Project | Scale |
|---|---|---|
| 1. Content (FPU) | ||
| 1.1. Presentation | This is one of the most important blocks because we must balance the information we give to user that should not be obvious, avoiding overwhelming the user with tons of information. | 1: Information is poorly structured |
| 3: Some blocks of information are presented better than others | ||
| 5: Well-structured information | ||
| 1.2. Accuracy | 1: The information is not reliable | |
| 3: The information is not totally reliable | ||
| 5: The information is reliable | ||
| 1.3. Relevance | 1: High | |
| 3: Medium | ||
| 5: Low | ||
| 1.4. Connection to the learning objectives | 1: High | |
| 3: Medium | ||
| 5: Low | ||
| 1.5. Adequacy for the consumer | 1: Does not meet customer’s expectations | |
| 3: Moderately satisfied with the application | ||
| 5: Totally satisfied | ||
| 2. Control (FPU) | The ability of user to personalize settings by his needs. The possibility of adjusting content and settings to meet specific needs of the customer. | 1: Low ability of control |
| 3: Medium | ||
| 5: High | ||
| 3. Meaningful Feedback (FPU) | Important criterion to provide customers understanding. Good feedbacks can change customer’s habits. | 1: Low useful feedback |
| 3: Medium | ||
| 5: High | ||
| 4. High-order thinking skills (FPU) | Implies customer’s curiosity and imagination. Shows the development of knowledge. | 1: The tasks are too easy/not interesting |
| 2: The tasks are too difficult/the user loses interest | ||
| 3: The tasks have medium difficulty but the user is not captivated | ||
| 4: The tasks are quite interesting but not difficult enough | ||
| 5: Tasks are difficult and very interesting | ||
| 5. Usability and technical performance (EUL) | ||
| 5.1. Learnability | How easy is it for users to accomplish basic tasks the first time they encounter the design? | 1: Difficult |
| 3: Medium | ||
| 5: Easy | ||
| 5.2. Efficiency | Once users have learned the design, how quickly can they perform tasks? | 1: It takes a lot of time |
| 3: It does not take a lot of time | ||
| 5: It is quick | ||
| 5.3. Memorability | When users return to the design after a period of not using it, how easily can they re-establish proficiency? | 1: It takes a lot of time |
| 3: It takes some time | ||
| 5: It is easy | ||
| 5.4. Errors | How many errors do users make, how severe are these errors, and how easily can they recover from the errors? | 1: Many severe errors, difficult to recover from them |
| 2: Low amount of severe errors, difficult to recover from them | ||
| 3: A lot of insignificant errors | ||
| 4: Low amount of insignificant errors, difficult to recover | ||
| 5: Low amount of insignificant errors, easy to recover | ||
| 5.5. Satisfaction | How pleasant is it to use the design? | 1: There is no comparison |
| 3: Comparison with ideal situation or anonymous users only | ||
| 5: Specific Users (friends in social networks) | ||
| 6. Interactivity and engagement (EUL) | Does the application show the information or require the user to participate in order to see this information? | 1: Low level of interactivity and engagement |
| 2: Low level of interactivity and medium level of engagement | ||
| 3: Medium level of interactivity and low level of engagement | ||
| 4: More than a medium level of interactivity and engagement | ||
| 5: High level of interactivity and engagement | ||
| 7. Type of comparison (EUL) | If there is any way comparison of to others. | 1: There is no comparison |
| 3: Comparison with ideal situation or anonymous users only | ||
| 5: Specific Users (friends in social networks) | ||
| 8. Need to solve missions (EUL) | Using the imagination in solving user tasks playing educates and can use new knowledge into reality. | 1: There are missions |
| 5: There are no missions | ||
| 9. Advice (EUL) | Does the application give tips on how to spend less energy? | 1: The application does not give advice |
| 3: The application gives advice | ||
| 5: The users and the application give advice | ||
© 2016 by the authors; licensee MDPI, Basel, Switzerland. This article is an open access article distributed under the terms and conditions of the Creative Commons Attribution (CC-BY) license (http://creativecommons.org/licenses/by/4.0/).
Share and Cite
Fonseca i Casas, A.; Fonseca i Casas, P.; Casanovas, J. Analysis of Applications to Improve the Energy Savings in Residential Buildings Based on Systemic Quality Model. Sustainability 2016, 8, 1051. https://doi.org/10.3390/su8101051
Fonseca i Casas A, Fonseca i Casas P, Casanovas J. Analysis of Applications to Improve the Energy Savings in Residential Buildings Based on Systemic Quality Model. Sustainability. 2016; 8(10):1051. https://doi.org/10.3390/su8101051
Chicago/Turabian StyleFonseca i Casas, Antoni, Pau Fonseca i Casas, and Josep Casanovas. 2016. "Analysis of Applications to Improve the Energy Savings in Residential Buildings Based on Systemic Quality Model" Sustainability 8, no. 10: 1051. https://doi.org/10.3390/su8101051