1. Introduction
Sustainable agriculture has become a severe problem in many areas, especially arid regions in China. According to Ramos [
1], the increase in yields in the past half-century is due to the intensification of soil cultivation practices, the development of high yielding crop varieties, and the increasing use of chemical fertilizers, pesticides, irrigation and mechanization. Hence, long-term cropping often results in differences in physical, chemical and biological properties of soil which, in turn, lead to changes in the functional quality of soil [
2,
3,
4]. Inappropriate long-term land use and cultivation pattern result in the depletion of organic matter and soil erosion, which results in permanent soil gradation and productivity decreases [
1,
5]. Hence, Agricultural sustainability has become a major concern. Issues of agricultural sustainability are related to soil quality (SQ) and assessment, and the direction of change of SQ with time is a primary indicator of whether agriculture is sustainable [
6,
7].
SQI can be defined as the soil processes and properties that are sensitive to changes in soil functions [
6], and it can be used to evaluate sustainability of soil management and land use practices. Conventionally, studies of soil quality concentrate on soil physical and chemical properties because of easy analysis methods [
8], but it was found in recent years that soil biological properties act as important indicators in response to alteration in management patterns [
1,
9]. Consequently, soil biological parameters together with physical and chemical properties are recognized to be necessary to assess soil quality as affected by alteration in management systems [
5,
10].
In the last half-century, many farmers in the Alar Oasis began to reclaim wasteland in the desert-oasis ecotone. Large-scale land reclamation and cultivation of water resources in Xinjiang have resulted in farmland largely increasing in the oasis. The oasis system involves continuous monoculture (cotton in this case) cropping and generates greater economic benefits [
5]. Hence, a better understanding of the impact of continuous cropping on soil physical, chemical, and biological properties is required to determine the optimum duration of continuous cropping and improve sustainability of this practice in the study area.
The objectives of this study were to (1) compare soil properties under different durations of continuous cropping; (2) assess the relationships among soil physicochemical properties, nutrient contents and enzyme activity parameters; and (3) identify soil quality indexes and advance improved management practices under different continuous cropping years in the Alar Irrigation Area of Xinjiang, China.
2. Materials and Methods
2.1. Study Area
The study was carried out in Alar Oasis (80°30′–81°58′ E and 40°22′–40°57′ N), located in the southern Tianshan Mountains of Central Asia and the northern margin of Taklimakan desert, within the upper reaches of the Tarim River. The region has a typical arid continental climate with an average annual temperature of 10.7 °C. Average annual precipitation is less than 50 mm, but annual potential evaporation is more than 2000 mm. Alar Oasis is mainly distributed on an alluvial plain, and has simple topography. There is native vegetation consisting dominantly of Populus euphratica, Tamarix chinensis and Phragmites australis. In the last half-century, farmland has been the main land use type, with cotton, maize and wheat being the main crops. The planting areas of cotton are now more than 80% in Alar Oasis.
2.2. Experimental Design and Soil Sampling
Sampling sites are located in the Twelfth Regiment in the First Division, Xinjiang Production and Construction Corps. The Xinjiang Production and Construction Corps is a unique economic and semi-military governmental organization of China, and it is primarily engaged in food- and agriculture-related industries. In the study, six plots were selected from uncultivated land (as a zero year treatment duration) and five different continuous cropping years on cotton fields, with different cropping durations (5, 10, 15, 20 and 25 years, respectively). Cotton was the main crop in all experimental fields. Annual yields from each field were recorded, from harvesting a plot of 1 ha every year. The study was conducted in 90 × 120 m six plots divided into 30 × 30 m grid cells, and 12 soil samples were collected from upper nodes of each grid. Each cropping duration field was cultivated following an identical model of farming, which represented typical farmland management intensities in Alar Oasis (
Table 1).
Table 1.
Characterization of the plots.
Table 1.
Characterization of the plots.
| Plots (Cropping Years) | Position | Latitude -Longitude | Irrigation Water Sources and Methods | Annual Fertilizer Amount (kg/hm2) | Fertilization Application Rate |
|---|
| Organic Fertilizer | Inorganic Fertilizer (N+P+K) |
|---|
| 0 | desert-oasis ecotone | (40°36′35.93″, 80°57′19.41″) | -, - | - | - | - |
| 5 | desert-oasis ecotone | (40°36′36.02″, 80°56′44.19″) | Groundwater, drip-irrigation | 0 | 370 | One time per month (May–September) |
| 10 | Oasis interior | (40°36′00.33″, 80°55′03.10″) | Groundwater, drip-irrigation | 0 | 370 | One time per month (May–September) |
| 15 | Oasis interior | (40°35′49.03″, 80°53′45.26″) | Groundwater, drip-irrigation | 0 | 370 | One time per month (May–September) |
| 20 | Oasis interior | (40°34′30.10″, 80°50′29.95″) | Groundwater, drip-irrigation | 0 | 370 | One time per month (May–September) |
| 25 | Oasis interior | (40°33′58.39″, 80°47′27.23″) | Groundwater, drip-irrigation | 0 | 370 | One time per month (May–September) |
Surface soil samples (0–20 cm deep) were collected from plots after the harvest of cotton in October 2011. Soil bulk density was determined by the clod method and directly measured in the field. The field-moist samples were weighed and mixed before taking a 20 g subsample at 105 °C to determine soil water content (SWC). All the other soil samples were passed through a 2-mm mesh sieve, after which the stems were removed. The remaining soil samples were brought to the laboratory, where they were air-dried. In order to avoid the influence of precipitation on soil properties, sampling was not performed within 20 days of precipitation falling in the region. These indicators were selected based on the performance of considered soil functions (
Table 2), four physicochemical properties: SWC, bulk density (BD), total salt content (TSC) and pH; four soil nutrients properties: soil organic matter (SOM), total nitrogen (TN), available phosphorus (AP) and available potassium (AK); and five soil enzymatic activities: catalase (Cat), polyphonal oxidase (PO), urease (Ure), invertase (Inv) and phosphatase (Pho).
Table 2.
Protocol of measurements for each soil indicator.
Table 2.
Protocol of measurements for each soil indicator.
| Soil Indicators | Protocol |
|---|
| Soil physicochemical Properties | Soil water content (SWC) | Oven-drying method |
| Bulk density (BD) | Clod method |
| pH | Saturated soil paste extract |
| Total salt content (TSC) | Saturated soil paste extract |
| Soil nutrients | Soil organic matter (SOM) | Modified Walkley-Black |
| Total nitrogen (TN) | Kjeldah method |
| Available phosphorus (AP) | Sodium bicarbonate Olsen method |
| Available potassium K (AK) | Flame photometry method |
| Soil enzyme activity | Catalase (Cat) | Potassium permanganate titration |
| Polyphenol oxidase (PO) | Spectrophotometry |
| Urease (Ure) | 0.1 M phosphate buffer at pH 7 |
| Invertase (Inv) | Sodium thiosulfate titration |
| Phosphatase (Pho) | P-nitrophenyl phosphate disodium (PNPP, 0.115 M) |
2.3. Soil Quality Index (SQI)
The calculation of SQI was according to Karlen
et al. [
11]. Each indicator was assigned scores using mathematical functions. The scores were integrated resulting in a comparative index of soil quality, as described below.
First, the indicators were scored. Scoring functions were used to transform soil indicators into normalized numerical scores. According to Liebig
et al. [
12], data for the chosen variables were ranked through a linear scoring technique because different indicators are expressed by different numerical scales. Scores ranging from 0 to 1 were assigned to the soil indicators by applying the more is better or less is better function [
13,
14].
The variables were scored using linear functions. After deciding the linear relationship of the anticipated response (
i.e., “less is better”, “more is better” or “optimum value”), threshold or limits values were assigned to each indicator variable. A curve of “less is better” was applied to total salt content, because it has negative effects on soil organisms and plant growth. A curve of “more is better” was applied to soil water content, bulk density, nutrients and enzyme activity. Schjonning [
15] reported that a desirable BD could increase soil water-reserving ability. In this study, the ideal BD was considered to be 1.60 g·cm
−3 [
16,
17], and all of the six cropping durations had soil with BD lower than this critical value. Therefore, a curve of “more is better” was applied to BD. The study region was an oasis-desert ecosystem with low precipitation, nutrient content and enzyme activity; therefore, any extra water, nutrients and enzyme activity would increase soil quality [
16].
The weight of pH in determination of the SQI was determined using an “optimum value” model [
18,
19] and assigned based on
Table 3.
Table 3.
Memberships values of pH value.
Table 3.
Memberships values of pH value.
| pH Value | <6.50 | 6.50–7.00 | 7.01–7.50 | 7.50–8.00 | 8.01–8.25 | 8.26–8.50 | >8.50 |
| Memberships Values | 0.5 | 1.0 | 0.9 | 0.7 | 0.5 | 0.2 | 0.1 |
After determining the weight of each determinant of soil properties, SQI was calculated with Equation (1) as follows [
20]:
where
S is the score assigned to each indicator,
n is the number of indicators included in the index. According to Marzaioli
et al. [
21], the SQI was then divided into three grades. SQI < 0.50 was regarded as low soil quality; 0.50 < SQI < 0.70 was regarded as intermediate soil quality; SQI > 0.70 was regarded as high soil quality.
2.4. Sustainable Yield Index (SYI)
In our study, the sustainable yield index (SYI) of cotton field was calculated to evaluate the ability of soil to maintain sustainable productivity according to Equation (2) [
17]:
Yave is the average yield of an experimental field; s is the yield standard deviation; and Ymax is the maximum yield in the field over five years.
2.5. Statistical Analysis
One-way analysis of variance (ANOVA) procedures were performed to assess the effects of different cropping years on soil physicochemical properties, nutrient properties and enzymatic activities. Correlation analysis was conducted using the Pearson correlation coefficients to identify relationships among the measured properties. Where the F-test was significant, a least significant difference (LSD) test was used at p < 0.05, if not stated otherwise, to separate the means. ANOVA, LSD and correlation analysis were conducted using the SPSS software (version 19.0).
3. Results and Discussion
3.1. Soil Physicochemical Indicator among Cropping Years
SWC was significantly influenced by cropping duration (
Table 4). The SWC in 15-year (27.58% ± 1.87%) and 20-year (25.75% ± 3.07%) cropping fields was significantly higher compared to its values in all other cropping durations. In the paper, the SWC of plots initially increased and then rapidly fell even after 20 years of cropping, apparently because irrigation increases soil SWC in the early years, while long-term excessive irrigation decreases water retention [
22]. For the new cultivated wasteland with lower initial moisture in the Alar Oasis, irrigation can remarkably enhance the SWC. Generally, intensive cropping causes a soil degradation in water-holding capacity over time [
23].
In this study, the texture of soil was determined as loose soil [
16], for which the ideal BD should be less than 1.60 g·cm
−3 [
5]. The comparison of BD after harvest in the six cropping durations showed that all of them had soil with BD lower than the critical value (1.60 g·cm
−3). Only 15 and 20 years maintained the best observed BD (1.38 g·cm
−3 and 1.37 g·cm
−3).
The detrimental effects on soil quality are quantified in terms of TSC. Salt may accumulate through inappropriate soil drainage. Across different cropping years, soil salinization in the study area was serious, which suggested soils from all plots had high pH values and soil salinity. The occurrence of soil salinization in the study area was due to soil parent materials, low topography, high water table as well as groundwater with high salinity, which significantly affected soil salt content. In this study, we find that the lowest and highest values of TSC were observed in 10-year (0.75 ± 0.07 g·kg
−1) and 25-year (8.52 ± 1.80 g·kg
−1) cropping, respectively. This might be due to naturally high soil TSC levels in the Alar Oasis (the natural background values of TSC at 0 year was 6.72 ± 1.49 g·kg
−1). Continuous irrigation would improve soil conditions and reduce TSC (10 years). However, long-term excessive irrigation (25 years) has caused secondary salinity buildup, which can lead to high salinity and even surface assembled [
24].
The pH in 0-year duration soil was 8.81, which was significantly higher than in the other five cropping durations, but no significant difference was detected among the remaining five cropping years. This is likely caused by irrigation decreasing soil pH significantly [
23] (
p < 0.05).
Table 4.
Multiple comparisons (LSD) of mean values of soil physicochemical indicators among cropping years.
Table 4.
Multiple comparisons (LSD) of mean values of soil physicochemical indicators among cropping years.
| Cropping Years | SWC (%) | BD (g·cm−3) | TSC (g·kg−1) | pH |
|---|
| 0 | 15.33 ± 1.22 d | 1.27 ± 0.03 d | 6.72 ± 1.49 a,b | 8.81 ± 0.12 a |
| 5 | 20.03 ± 0.54 c | 1.30 ± 0.02 c,d | 2.34 ± 0.92 c | 8.43 ± 0.19 b |
| 10 | 22.78 ± 1.99 b | 1.32 ± 0.03 b,c | 0.75 ± 0.07 d | 8.42 ± 0.09 b |
| 15 | 27.58 ± 1.87 a | 1.38 ± 0.07 a | 2.20 ± 1.16 c | 8.37 ± 0.07 b |
| 20 | 25.75 ± 3.07 a,b | 1.37 ± 0.04 a,b | 5.91 ± 1.28 b | 8.37 ± 0.14 b |
| 25 | 20.53 ± 2.27 c | 1.27 ± 0.02 d | 8.52 ± 1.80 a | 8.41 ± 0.05 b |
| F | 19.43 ** | 6.56 ** | 24.27 ** | 12.55 ** |
3.2. Soil Nutrient Indicators among Cropping Years
The measured values of soil nutrient indicators under the six cropping durations are shown in
Table 5. The comparison of SOM, TN and AP under different cropping durations showed that 15 years of continuous cropping exhibited maximum values for these indicators and 0 year produced minimum values. In the early stages, the main causes for soil nutrient increase were that cultivation practices can modify soil conditions, increase soil nutrients, and improve soil fertility [
24].
Cultivation also increases the rate of decomposition of soil humus [
25]. Higher soil organic carbon and nutrients have been reported in soil with crop residue retained as surface mulch in long-term cultivation. However, continuous single planting patterns for long-term consecutive years by a tillage system had adverse effects on soil nutrient properties, which led to soil nutrient deficiency and unbalance [
21]. The results showed that, as continuous cropping duration increased, soil nutrient indicators (SOM, TN and AP) initially increase and then rapidly fall at longer durations. However, AK was, in fact, quite level across the six cropping durations. The uptake of potassium by cotton is low, and cotton fertilization mainly includes N, and P with small amounts of K applied at plowing. Therefore, the AK of soil under the six cropping durations did not significantly differ.
Table 5.
Multiple comparisons (LSD) of mean values of soil nutrient indicators among cropping years.
Table 5.
Multiple comparisons (LSD) of mean values of soil nutrient indicators among cropping years.
| Cropping Years | SOM (g·kg−1) | TN (mg·kg−1) | AP (mg·kg−1) | AK (mg·kg−1) |
|---|
| 0 | 2.06 ± 0.56 c | 245.90 ± 31.59 d | 4.23 ± 1.63 c | 132.08 ± 6.51 a |
| 5 | 2.67 ± 0.42 c | 291.75 ± 30.66 c | 26.28 ± 3.11 a | 148.03 ± 6.01 a |
| 10 | 4.13 ± 0.63 b | 324.65 ± 23.35 b | 26.98 ± 1.44 a | 153.50 ± 4.60 a |
| 15 | 8.77 ± 1.27 a | 418.43 ± 15.43 a | 27.53 ± 1.81 a | 153.73 ± 5.89 a |
| 20 | 7.50 ± 0.87 a | 399.58 ± 18.42 a | 27.48 ± 1.95 a | 153.55 ± 10.07 a |
| 25 | 2.71 ± 0.35 c | 282.80 ± 23.62 c,d | 20.75 ± 2.69 b | 138.55 ± 5.74 a |
| F | 56.22 ** | 31.05 ** | 70.26 ** | 7.59 ** |
3.3. Soil Enzyme Activity Indicator among Cropping Years
Enzyme activities have been good indicators and we use them to express SQ [
26]. The soil properties determined in this study of farmlands with differing cropping durations are presented in
Table 6. The soil enzymatic properties (CAT, PO, Ure, Inv, Pho) for 15- and 20-year durations were significantly higher compared to all other cropping durations, and 0- and 25-year durations were significantly lower. Soil cultivation not only changed soil physicochemical and nutrient properties, but it also affected enzymatic activities, which are an index of soil microbial activity [
27,
28]. Continuous cultivation at an early stage increased soil enzymatic activities, which peaked between 15 and 20 years of cultivation. Cultivation could result in the variation of enzymatic activity, which improves soil physical and chemical conditions and provides nutrients, indirectly leading to enzymatic activities being increased. However, as cultivation duration increased beyond 20 years, soil enzymatic activities dropped with increasing cropping duration. The main reason for the change is that long-term monoculture farming patterns aroused secondary soil problems, indirectly leading to enzymatic activities being dropped [
26].
Table 6.
Multiple comparisons (LSD) of mean values of soil enzyme activity indicators among cropping years.
Table 6.
Multiple comparisons (LSD) of mean values of soil enzyme activity indicators among cropping years.
| Cropping Years | CAT (mL 0.l N KMnO4/g·20 min 37 °C) | PO (mg Gallic Acid/g·20 min 37 °C) | Ure (mg NH3-N/g·24 h 37 °C) | Inv (mL 0.1N Na2S2O3/g·24 h 37 °C) | Pho (mg phenol/g·24 h 37 °C) |
|---|
| 0 | 4.52 ± 0.60 b | 0.43 ± 0.02 e | 0.15 ± 0.00 d | 0.68 ± 0.06 e | 0.10 ± 0.01 d |
| 5 | 12.31 ± 0.47 a | 0.70 ± 0.01 c | 0.39 ± 0.01 b | 3.28 ± 0.13 c | 0.15 ± 0.01 c |
| 10 | 12.34 ± 0.45 a | 0.98 ± 0.10 b | 0.44 ± 0.03 a | 3.58 ± 0.43 b | 0.19 ± 0.01 b |
| 15 | 12.91 ± 0.40 a | 1.18 ± 0.04 a | 0.46 ± 0.01 a | 4.15 ± 0.13 a | 0.20 ± 0.01 a |
| 20 | 12.69 ± 0.37 a | 1.12 ± 0.09 a | 0.46 ± 0.02 a | 3.98 ± 0.19 a | 0.20 ± 0.01 a |
| 25 | 4.35 ± 0.81 b | 0.54 ± 0.15 d | 0.26 ± 0.00 c | 1.68 ± 0.06 d | 0.11 ± 0.01 d |
| F | 242.266 ** | 54.276 ** | 325.273 ** | 180.851 ** | 89.004 ** |
3.4. Soil Quality Indexes under Different Cropping Years
Correlation analysis of the 13 soil properties representing soil physicochemical, nutrients and enzyme activity parameters resulted in a significant correlation of the 30 soil samples (
Table 7). We found a negative but significant relationship between TSC and other soil properties of the soil surface layer.
Table 7.
Relationship among soil physicochemical properties, nutrients and enzyme activity parameters under different cropping years.
Table 7.
Relationship among soil physicochemical properties, nutrients and enzyme activity parameters under different cropping years.
| SWC | BD | TSC | PH | SOM | TN | AP | AK | CAT | PO | Ure | Inv | Pho |
|---|
| SWC | 1 | | | | | | | | | | | | |
| BD | 0.77 ** | 1 | | | | | | | | | | | |
| TSC | −0.32 ** | −0.28 * | 1 | | | | | | | | | | |
| PH | 0.78 ** | 0.72 ** | −0.34 * | 1 | | | | | | | | | |
| SOM | 0.82 ** | 0.69 ** | −0.27 * | 0.80 ** | 1 | | | | | | | | |
| TN | 0.87 ** | 0.81 ** | −0.32 * | 0.78 ** | 0.91 ** | 1 | | | | | | | |
| AP | 0.71 ** | 0.45 ** | −0.50 ** | 0.54 ** | 0.56 ** | 0.64 ** | 1 | | | | | | |
| AK | 0.66 ** | 0.62 ** | −0.56 ** | 0.60 ** | 0.57 ** | 0.63 ** | 0.74 ** | 1 | | | | | |
| CAT | 0.68 ** | 0.64 ** | −0.72 ** | 0.64 ** | 0.65 ** | 0.70 ** | 0.80 ** | 0.76 ** | 1 | | | | |
| PO | 0.84 ** | 0.76 ** | −0.52 ** | 0.79 ** | 0.85 ** | 0.86 ** | 0.74 ** | 0.77 ** | 0.82 ** | 1 | | | |
| Ure | 0.80 ** | 0.66 ** | −0.63 ** | 0.68 ** | 0.72 ** | 0.79 ** | 0.91 ** | 0.81 ** | 0.93 ** | 0.90 ** | 1 | | |
| Inv | 0.80 ** | 0.69 ** | −0.63 ** | 0.73 ** | 0.74 ** | 0.79 ** | 0.89 ** | 0.82 ** | 0.94 ** | 0.90 ** | 0.98 ** | 1 | |
| Pho | 0.79 ** | 0.78 ** | −0.58 ** | 0.75 ** | 0.81 ** | 0.84 ** | 0.73 ** | 0.77 ** | 0.89 ** | 0.94 ** | 0.92 ** | 0.92 ** | 1 |
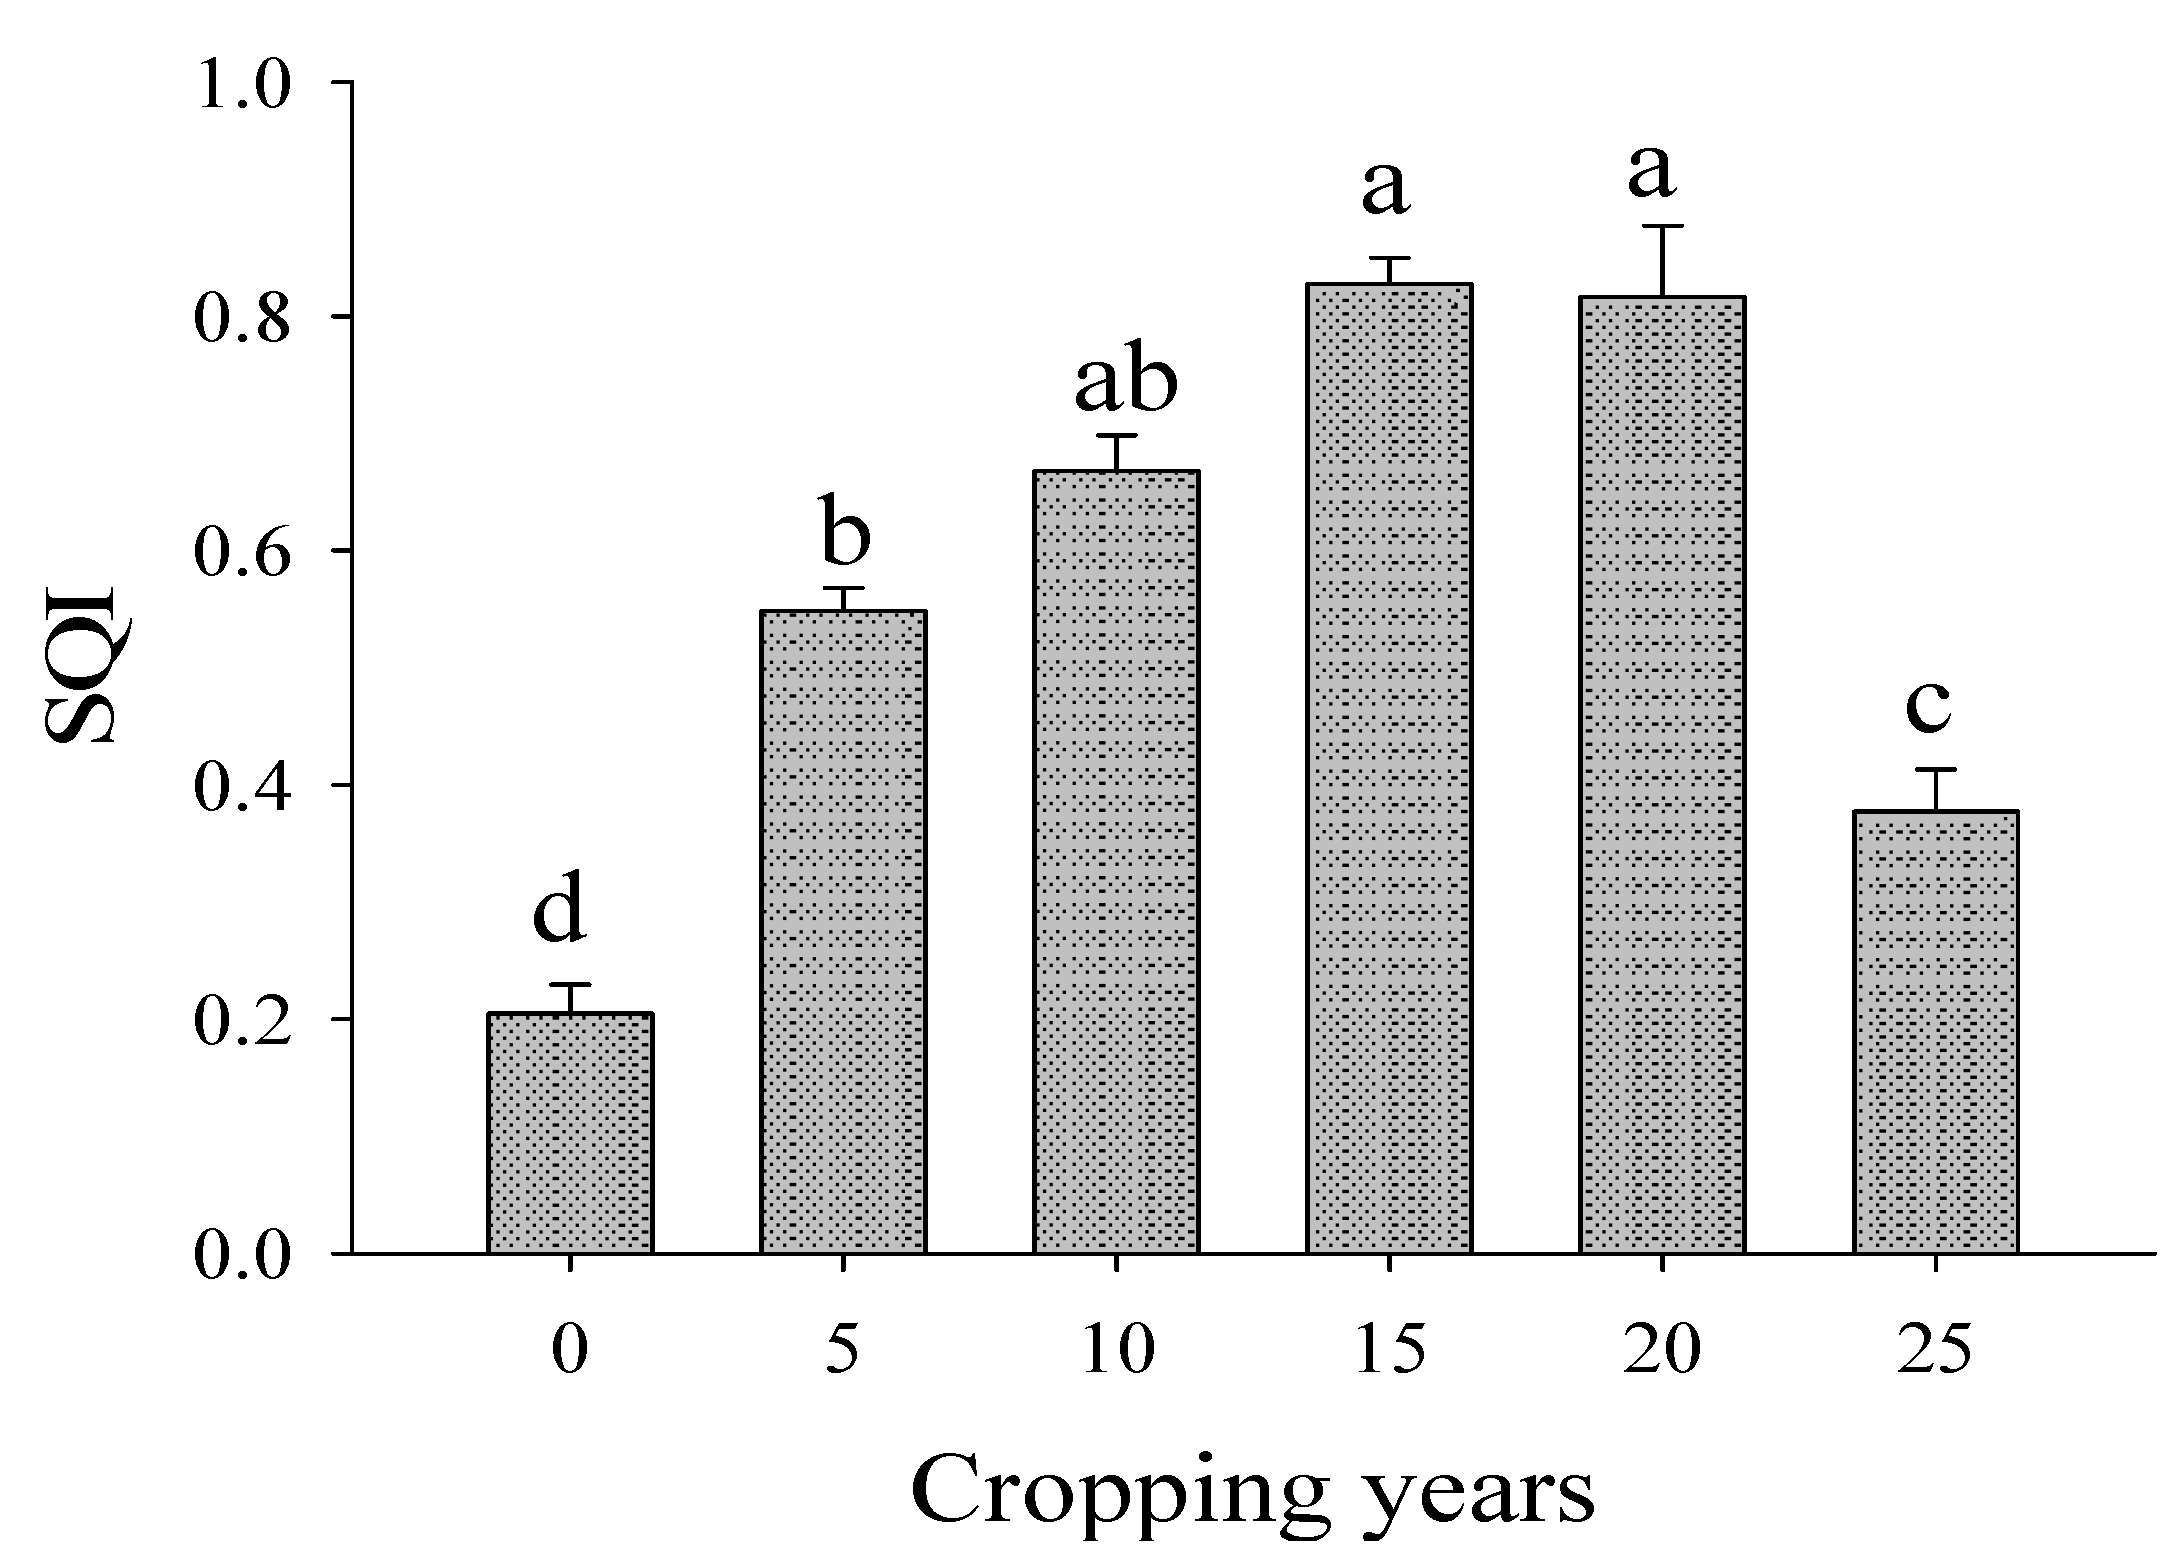
The soil quality was calculated with Equation (1) using soil physicochemical properties, nutrient levels and enzyme activity parameters, and compared using an LSD test (
Figure 1). The higher SQI value for 15 and 20 year cropping implies that soil quality under these cropping durations is superior to that of other durations. In the present investigation, we observed better soil quality under 15 and 20 years of cultivation. Finally, cultivation durations ranked according to SQI are as follows: 15 years (0.828) > 20 years (0.816) > 10 years (0.668) > 5 years (0.548) > 25 years (0.377) > 0 years (0.205). Results of LSD tests point to significant differences in soil quality among the studied cultivation durations with low soil quality (SQI < 0.50) at 25 and zero cropping years; intermediate soil quality (0.5 < SQI < 0.75) at 5 and 10 cropping years; and high soil quality (SQI > 0.75) at 15 and 20 cropping years.
The highest soil quality of the six cultivation durations was seen for 15 and 20 years of continuous cropping. This is contrary to findings in other regions where land degradation occurred and soil nutrient contents were reduced after land use transformed original natural land to cultivated land [
16,
29]. These differences in soil quality response to cultivation are likely due to ecosystem type. The present study area is an oasis-desert ecosystem with high soil salt content, low precipitation and very low soil nutrients; therefore, any agricultural activity improving these characteristics (such as fertilization and irrigation) helps improve the soil's ability [
3]. However, long-term excessive irrigation, fertilization and monoculture farming patterns aroused secondary soil problems, such as secondary salinization, soil nutrient loss and decreased soil water retention, leading to sharply deteriorating soil quality [
30]. To conserve soils and rehabilitate sustainability, the degraded croplands of 25 cropping years should not be farmed like a monoculture system.
Figure 1.
Soil quality indexes under different cropping years. Means followed by same letter are not significantly (p < 0.05) different according to LSD test. Data are mean ± SE, n = 5 per cropping years.
Figure 1.
Soil quality indexes under different cropping years. Means followed by same letter are not significantly (p < 0.05) different according to LSD test. Data are mean ± SE, n = 5 per cropping years.
3.5. Sustainable Yield Index under Different Cropping Years
Crop productivity is one reliable way to evaluate the SQI [
31,
32]. The
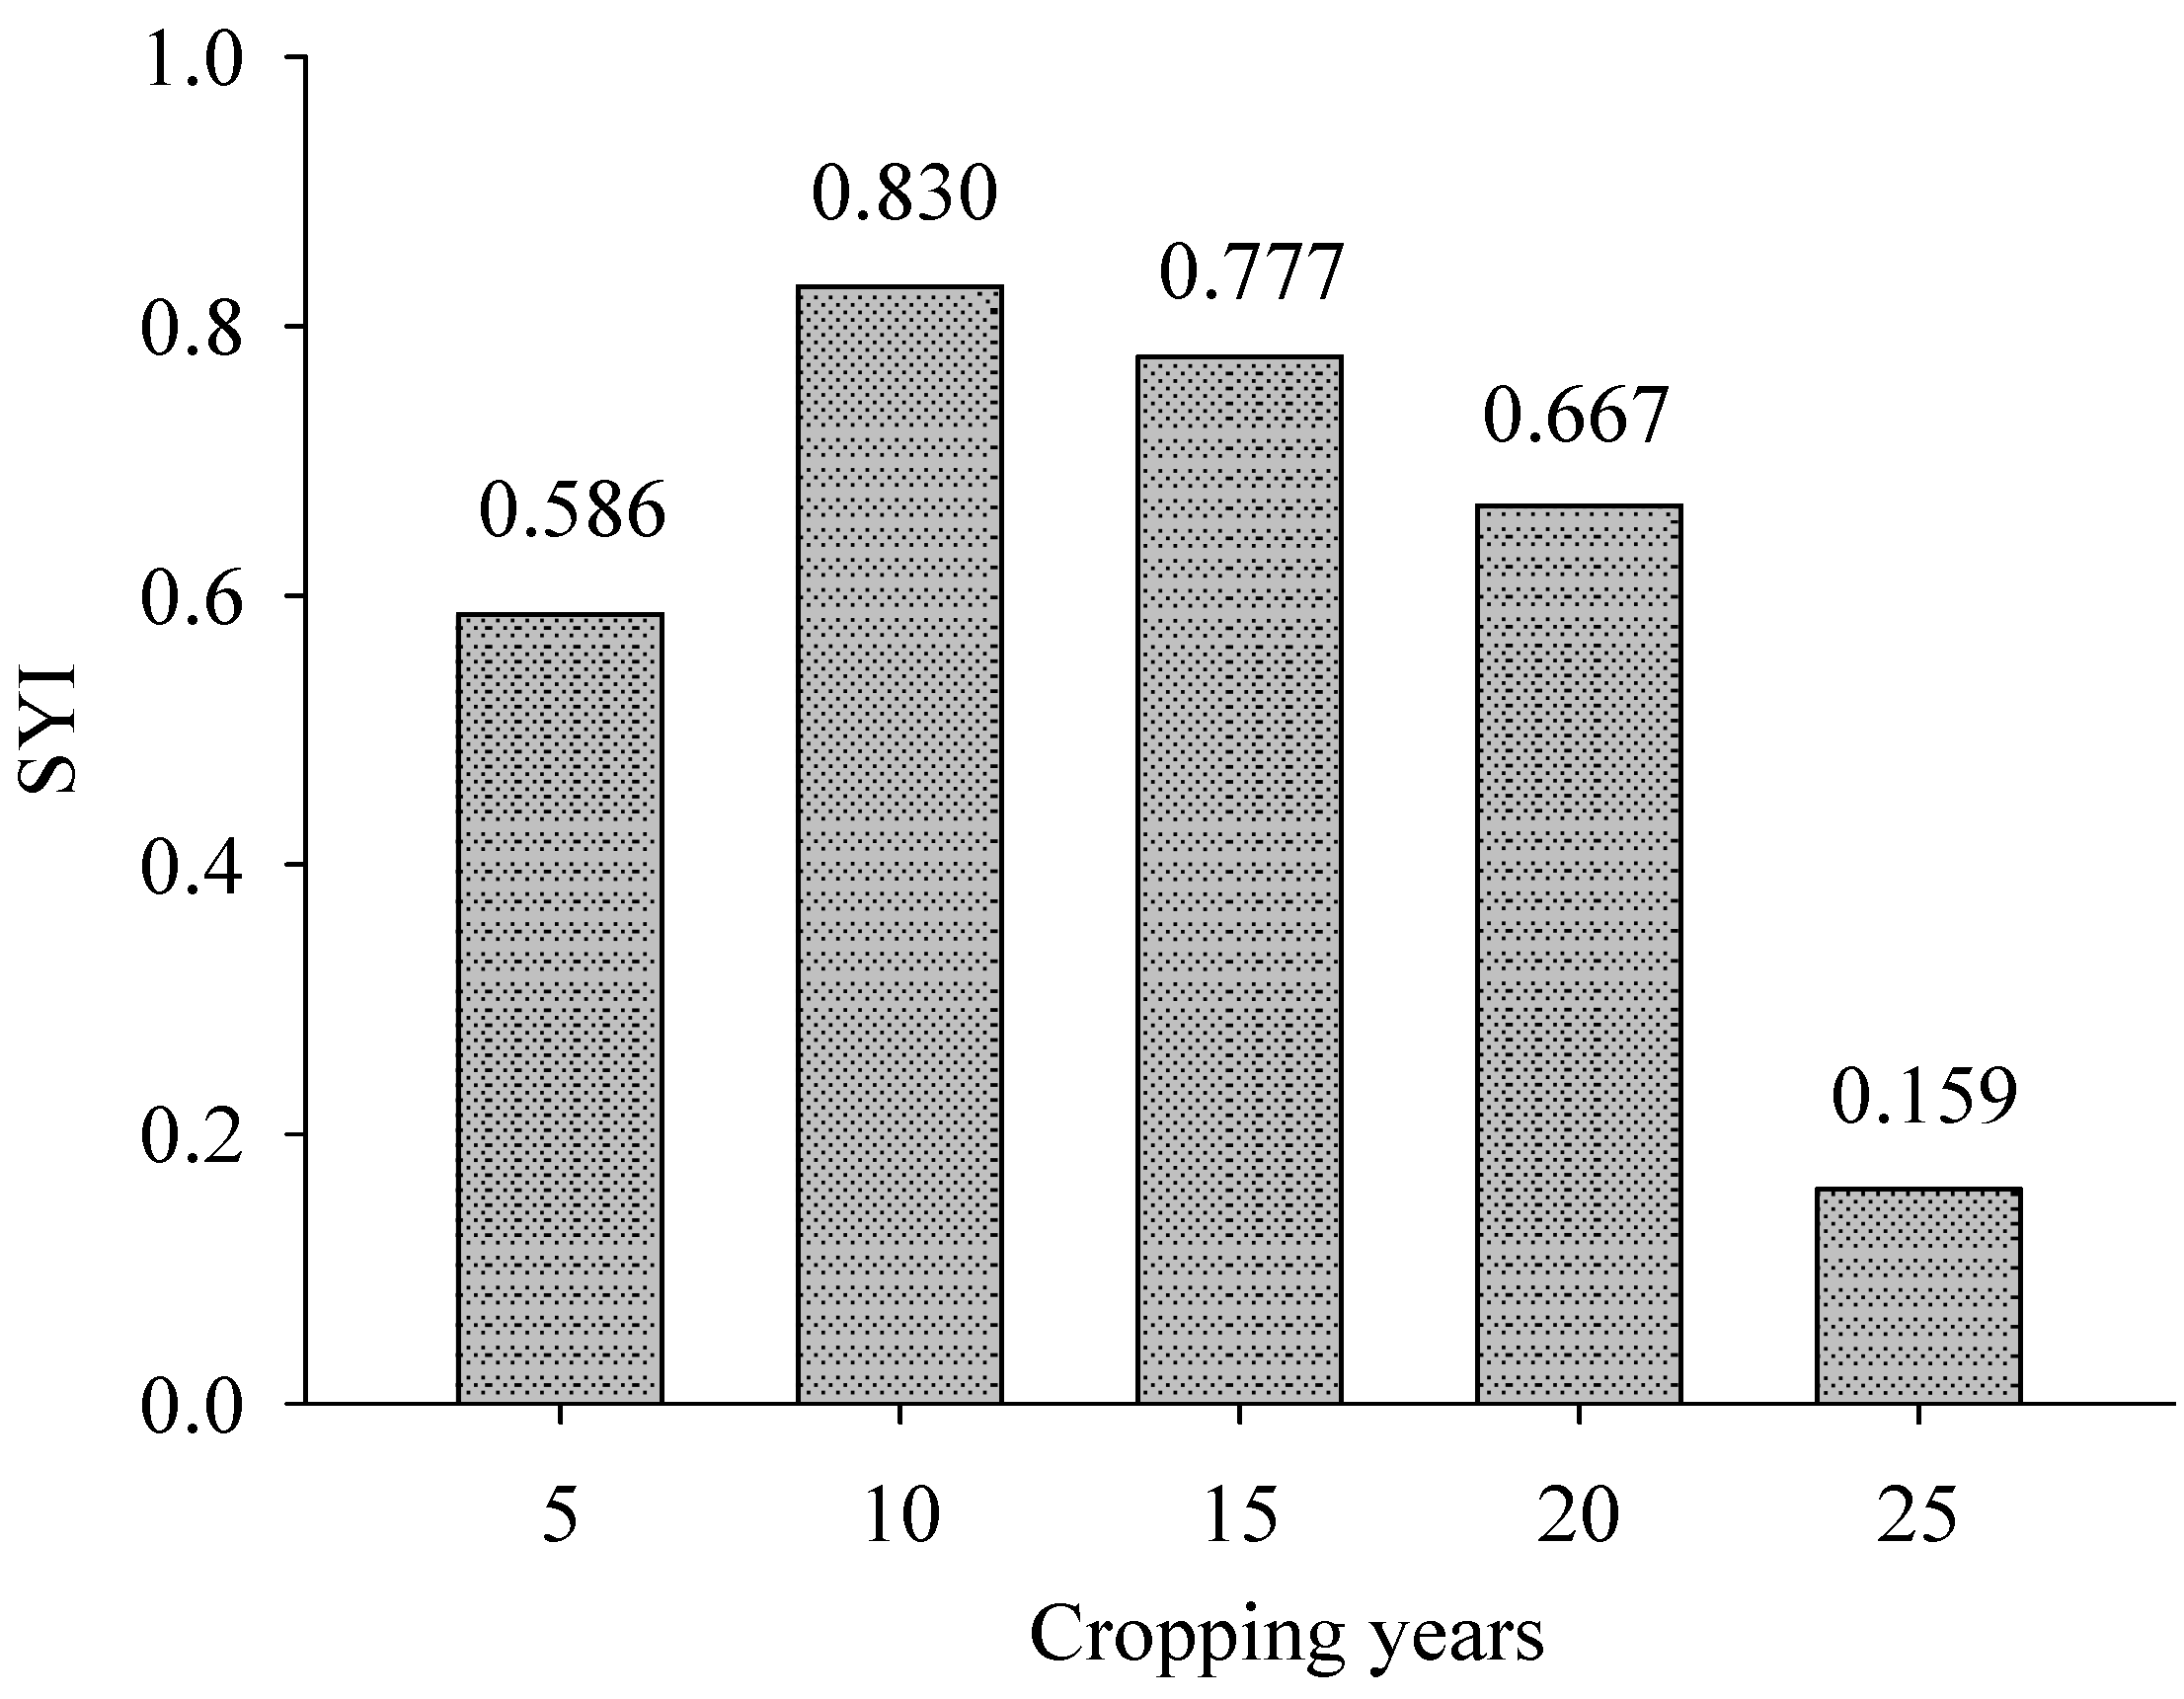
sustainable yield index (SYI) was calculated with Equation (2). The SYI gives an idea of the overall yield sustainability, and was calculated on the basis of cotton yields of the different cropping years over five years (
Figure 2). High SYI indicates better production stability. SYI were in the order 10 years (0.830) > 15 years (0.777) > 20 years (0.667) > 5 years (0.586) > 25 years (0.159).
SYI is considered as the primary indicator of sustainable land management [
32,
33]. The results show that as continuous single cropping years increased, SQI initially increase, but it is not sustainable. A better understanding of the impact of continuous cropping on SQI is needed to optimize the cropping years to research the cropping system sustainability in the study area. This research supports management practices of intercropping, crop rotations and fallow after 20 years of continuous cropping to prevent degradation of oasis soils and maintain sustainability of oasis agriculture developments.
Figure 2.
The sustainable yield indexes of different cropping years.
Figure 2.
The sustainable yield indexes of different cropping years.
4. Conclusions
Tillage practices affect various soil physicochemical properties, nutrient properties and enzymatic activities. SWC and BD initially increase and then decrease with increasing cropping duration, and both peaked between 15 or 20 years of cultivation. The opposite trend was seen in TSC, which peaked at 10 years of continuous cropping. The soil pH of non-cultivated fields (zero year of cropping) was significantly higher than in the other five cropping durations. Soil nutrient indicators (SOM, TN and AP) initially increased then rapidly fell (15 years) at longer durations. However, AK remained level among all six cropping durations. Continuous cultivation initially increased soil enzymatic activities, which appeared to peak at 15 or 20 years, and then reduced as the cropping duration further increased.
Cropping duration ranked according to decreasing SQI is as follows: 15 years (0.828) > 20 years (0.816) > 10 years (0.668) > 5 years (0.548) > 25 years (0.377) > 0 years (0.205), and SYI is as follows: 10 years (0.830) > 15 years (0.777) > 20 years (0.667) > 5 years (0.586) > 25 years (0.159). Results showed that continuous cultivation for 20 consecutive years by a tillage system had adverse effect on soil quality. The monoculture system of cotton has not met the need of present oasis agriculture production. Governments should adjust the right tillage patterns to prevent degradation of oasis soils and maintain sustainability according to the soil quality situation.
Acknowledgements
The authors want to thank to the financial support of Funds of the National Natural Science Foundation of China (U1138303, 31160127 and 41461105). We would also like to thank Christine Verhille at the University of British Columbia for her assistance with English language and grammatical editing of the manuscript. Additionally, we acknowledge the anonymous reviewers for their valuable comments.
Author Contributions
Lu Gong and Weiguo Liu conceived and designed the study; Lu Gong and Guixiang He conducted the content analysis; Guixiang He and Weiguo Liu wrote the paper; Lu Gong and Weiguo Liu contributed to literature review and edited the manuscript.
Conflicts of Interest
The authors declare no conflict of interest.
References
- Ramos, M.E.; Robles, A.B.; Sanchez, N.A.; Gonzalez-Rebollar, J.L. Soil responses to different management practices in rainfed orchards in semiarid environments. Soil Tillage Res. 2011, 112, 85–91. [Google Scholar] [CrossRef]
- Islam, K.R.; Weil, R.R. Soil quality indicator properties in mid-Atlantic soils as influenced by conservation management. J. Soil Water Conserv. 2000, 55, 69–78. [Google Scholar]
- Celik, I.; Barut, Z.B.; Ortas, I.; Gok, M.; Demirbas, A.; Tulun, Y.; Akpinar, C. Impacts of different tillage practices on some soil microbiological properties and crop yield under semi-arid Mediterranean conditions. Int. J. Plant Product. 2011, 5, 237–254. [Google Scholar]
- Ding, X.; Zhang, B.; Zhang, X.; Yang, X.; Zhang, X. Effects of tillage and crop rotation on soil microbial residues in a rainfed agroecosystem of northeast China. Soil Tillage Res. 2011, 114, 43–49. [Google Scholar] [CrossRef]
- Aziz, I.; Mahmood, T.; Islam, K. Effect of long term no-till and conventional tillage practices on soil quality. Soil Tillage Res. 2013, 131, 28–35. [Google Scholar] [CrossRef]
- Doran, J.W. Soil health and global sustainability: Translating science into practice. Agric. Ecosyst. Environ. 2002, 88, 119–127. [Google Scholar] [CrossRef]
- Fageria, N.K. Nutrient management for improving upland rice productivity and sustainability. Commun. Soil Sci. Plant Anal. 2001, 32, 2603–2629. [Google Scholar] [CrossRef]
- Larson, W.E.; Pierce, F.J. The dynamics of soil quality as a measure of sustainable management. In Defining Soil Quality for a Sustainable Environment; Doran, J.W., Coleman, D.C., Bezdicek, D.F., Stewart, B.A., Eds.; Soil Science Society of America, Inc.: Madison, WI, USA, Special Publication, Number 35; 1994; pp. 37–51. [Google Scholar]
- Aweke, M.G.; Singh, B.R.; Lal, R. Soil Quality Indices for Evaluating Smallholder Agricultural Land Uses in Northern Ethiopia. Sustainability 2015, 7, 2322–2337. [Google Scholar] [Green Version]
- Luo, G.P.; Chen, X.; Xu, W.Q. Soil properties related to land-use systems in oases of Sangong river watershed, Xinjiang. J. Geogr. Sci. 2008, 18, 483–498. [Google Scholar] [CrossRef]
- Karlen, D.L.; Doran, J.W.; Weinhold, B.J.; Andrews, S.S. Soil quality: Humankind’s foundation for survival. J. Soil Water Conserv. 2003, 58, 171–179. [Google Scholar]
- Liebig, M.A.; Varvel, G.; Doran, J. A simple performance-based index for assessing multiple agroecosystem functions. Agron. J. 2001, 93, 313–318. [Google Scholar] [CrossRef]
- Karlen, D.L.; Tomer, M.D.; Neppel, J.C.; Cambardella, A. A preliminary watershed scale soil quality assessment in north central Iowa, USA. Soil Tillage Res. 2008, 99, 291–299. [Google Scholar] [CrossRef]
- Chen, Y.D.; Wang, H.Y.; Zhou, J.M.; Xing, L.; Zhu, B.L.; Zhao, Y.C.; Chen, X.Q. Minimum data set for assessing soil quality in farmland of northeast China. Pedosphere 2013, 23, 564–576. [Google Scholar] [CrossRef]
- Schjonning, P.; Christensen, B.T.; Arstensen, B.C. Physical and chemical properties of a sandy loam receiving animal manure, mineral fertilizer or no fertilizer for 90 years. Eur. J. Soil Sci. 1994, 45, 257–268. [Google Scholar] [CrossRef]
- Wang, D.; Fu, B.J.; Zhao, W.W.; Hu, H.F.; Wang, Y.F. Multi-fractal characteristics of soil particle size distribution under diferent land-use types on the Loess Plateau, China. Catena 2008, 72, 29–36. [Google Scholar] [CrossRef]
- Gui, D.W.; Lei, J.Q.; Zeng, F.J. Farmland management effects on the quality of surface soil during oasification in the southern rim of the Tarim Basin in Xinjiang, China. Plant Soil Environ. 2010, 56, 348–356. [Google Scholar]
- Karlen, D.L.; Stott, D.E. A framework for evaluating physical and chemical indicators of soil quality. In Defining Soil Quality for a Sustainable Environment; Doran, J.W., Coleman, D.C., Bezdicek, D.F., Stewart, B.A., Eds.; SSSA Special Publ. Soil Science Society of America: Madison, WI, USA, 1994; Volume 34, pp. 53–72. [Google Scholar]
- Andrews, S.S.; Karlen, D.L.; Mitchell, J.P. A comparison of soil quality indexing methods for vegetable production systems in Northern California. Agric. Ecosyst. Environ. 2002, 90, 25–45. [Google Scholar] [CrossRef]
- Andrews, S.S.; Flora, C.B.; Mitchell, J.P.; Karlen, D.L. Growers’ perceptions and acceptance of soil quality indices. Geoderma 2003, 114, 187–213. [Google Scholar] [CrossRef]
- Madejon, E.; Murillo, J.M.; Moreno, F.; Lopez, M.V.; Alvaro, F.J. Effect of long-term conservation tillage on soil biochemical properties in Mediterranean Spanish areas. Soil Tillage Res. 2009, 105, 55–62. [Google Scholar] [CrossRef]
- Kuntal, M.H.; Anand, S.; Dwivedi, A.K.; Misra, A.K.; Bandyopadhyay, K.K. Changes in soil physical properties and organic carbon status at the topsoil horizon of a vertisol of central India after 28 years of continuous cropping, fertilization and manuring. Agric. Ecosyst. Environ. 2007, 119, 127–134. [Google Scholar]
- Lal, R. Conservation tillage for sustainable agriculture: Tropics vs. temperate environments. Adv. Agron. 1989, 42, 85–197. [Google Scholar]
- Yao, R.J.; Yang, J.S.; Gao, P.; Zhang, J.B.; Jin, W.H. Determining minimum data set for soil quality assessment of typical salt-affected farmland in the coastal reclamation area. Soil Tillage Res. 2013, 128, 137–148. [Google Scholar] [CrossRef]
- Morris, D.R.; Gilbert, R.A.; Reicosky, D.C.; Gesch, R.W. Oxidation potentials of soil organic matter in histosols under different tillage methods. Soil Sci. Soc. Am. J. 2004, 68, 817–826. [Google Scholar] [CrossRef]
- Six, J.; Bossuyt, H.; Degryze, S.; Denef, K. A history of research on the link between (micro) aggregates, soil biota and soil organic matter dynamics. Soil Tillage Res. 2004, 79, 7–31. [Google Scholar] [CrossRef]
- Saha, S.; Gopinath, K.A.; Mina, B.L.; Gupta, H.S. Influence of continuous application of inorganic nutrients to a Maize–Wheat rotation on soil enzyme activity and grain quality in a rainfed Indian soil. Eur. J. Soil Biol. 2008, 44, 521–531. [Google Scholar] [CrossRef]
- Wright, A.L.; Reddy, K.R. Phosphorus loading effects on extracellular enzyme activity in Everglades wetland soils. Soil Scie. Soc. Am. J. 2001, 65, 588–595. [Google Scholar] [CrossRef]
- Brzezinska, M. Significance of soil enzymes in nutrient transformations. Acta Agrophys. 2002, 63, 5–23. [Google Scholar]
- Sharma, K.L.; Mandal, U.K.; Srinivas, K.P.R.; Vittal, K.; Mandal, B.; Grace, J.K.; Ramesh, V. Long-term soil management effects on crop yields and soil quality in a dryland Alfisol. Soil Tillage Res. 2005, 83, 246–259. [Google Scholar] [CrossRef]
- Fischer, R.A.; Santiveri, F.; Vidal, I.R. Crop rotation, tillage and crop residue management for wheat and maize in the sub-humid tropical highlands. II. Wheat and legume performance. Field Crops Res. 2002, 79, 107–122. [Google Scholar] [CrossRef]
- Mohanty, M.; Painuli, D.K.; Misra, A.K.; Ghosh, P.K. Soil quality effects of tillage and residue under rice–wheat cropping on a vertisol in India. Soil Tillage Res. 2007, 92, 243–250. [Google Scholar] [CrossRef]
- Thierfelder, C.; Mwila, M.; Rusinamhodzi, L. Conservation agriculture in eastern and southern provinces of Zambia: Long-term effects on soil quality and maize productivity. Soil Tillage Res. 2013, 126, 246–258. [Google Scholar] [CrossRef]
© 2016 by the authors; licensee MDPI, Basel, Switzerland. This article is an open access article distributed under the terms and conditions of the Creative Commons by Attribution (CC-BY) license (http://creativecommons.org/licenses/by/4.0/).


