Article

The Economic Impact of Climate Change on Road Infrastructure in Ghana

by
Daniel Kwabena Twerefou
1,*,
Paul Chinowsky
2,
Kwame Adjei-Mantey
1 and
Niko Lazar Strzepek
3
1
Department of Economics, University of Ghana, P.O. Box LG 57, Accra, Ghana
2
Civil, Environmental and Architectural Engineering Department, University of Colorado, Boulder, CO 80309-0428, USA
3
Institute of Climate and Civil Systems, University of Colorado, Boulder, CO 80309-0428, USA
*
Author to whom correspondence should be addressed.
Sustainability 2015, 7(9), 11949-11966; https://doi.org/10.3390/su70911949
Submission received: 23 June 2015 / Revised: 17 August 2015 / Accepted: 20 August 2015 / Published: 28 August 2015

Abstract

:
This paper estimates the economic impact of climate change on road infrastructure using the stressor-response methodology. Our analysis indicates that it could cumulatively (2020–2100) cost Ghana $473 million to maintain and repair damages caused to existing roads as a result of climate change (no adapt scenario). However, if the country adapts the design and construction of new road infrastructure, expected to occur over the asset’s lifespan (adapt scenario), the total cumulative cost could increase to $678.47 million due to the initial costs of adaptation. This investment provides lower costs on a decadal basis later in the infrastructure lifespan. This creates the planning question of whether lower decadal costs in the future are a priority or if minimizing initial costs is a priority. The paper addresses this question through decadal and average annual costs up to the year 2100 for the ten regions, using the potential impacts of 54 distinct potential climate scenarios.

1. Introduction

Ghana has been experiencing long periods of drought and erratic rainfall, particularly in the arid north (savannah) and along the coast. Irregular climatic conditions like untimely onset and cessation of rainfall during the crop-growing season have also been observed [1]. Furthermore, erratic rainfall has also been observed during the minor crop season (September and November) in the forest-savannah transition zone. In general, the work of Environmental Protection Agency [2] indicates that over the thirty year period covering 1961–1990, annual total rainfall declined by 20%, stream flow or runoff in all the river basin systems declined by 30%, while temperature increased by 1 °C.
Several climate change scenarios have been developed for Ghana, all indicating that temperature will increase while the changes in rainfall are uncertain and span a wide range. Scenarios reported by Environmental Protection Agency (EPA) et al. [3], using data from 1961 to 2000, indicated that there will be a progressive rise in both maximum and minimum temperatures, for all regions of Ghana, and a decreasing trend in rainfall patterns. Specifically, average annual temperature is estimated to increase by 0.8 °C in 2020 and 5.4 °C in 2080 compared to the 1960–2000 average. With regards to rainfall, average annual rainfall is estimated to decline by 1.1% in 2020 and 20.5% in 2080 compared to the 1960–2000 average. A recent study by McSweeney et al. [4] indicates that mean annual temperature is projected to increase by 1.0 to 3.0 °C by the 2060s, and the projected rate of warming is more rapid in the northern inland regions than the coastal regions. Additionally, although the projected mean temperature will increase most rapidly in the interior regions than near the coast, the projected changes in daily temperature extremes are the largest in the coastal areas. With regards to rainfall, projections of mean annual rainfall averaged over the country from different models projected a wide range of changes in rainfall with around half the models projecting increases and half projecting decreases.
Several researchers have documented the impact of climate change on economic systems, which is envisaged to be high. A study by the World Bank [5] indicates that average global temperatures will increase by 1.4 to 5.8 °C over the next 100 years if no action is taken globally to control it. The increase in the Earth’s temperature could have a more drastic consequence than all other natural climatic changes that have been documented over the last 100,000 years due to the intensity of human activities [6]. In Ghana, Agyeman-Bonsu et al. [7] have undertaken studies which have assessed the impact of climate change on key sectors of the Ghanaian economy to be high and out of these studies a National Climate Change Adaptation Strategy had been drafted. One important component of the strategy is to undertake research to support its implementation.
Climate change will directly affect road infrastructure in several ways. High temperatures will cause roads to easily develop cracks within a short period after their construction. Furthermore, higher temperatures combined with increased solar radiation may reduce the life of asphalt road surfaces [8]. Additionally, high precipitation will allow new roads to easily develop potholes while existing potholes will deepen fast. Rising sea levels can also flood graveled and unpaved roads adjacent to the sea shore. The Intergovernmental Panel on Climate Change [9] reports that the impact of climate change on people’s livelihood will be greatest in the tropics and subtropics, particularly in Africa. That is why climate change in Ghana, and in Africa as a whole, albeit being an age-old phenomenon, has to be taken seriously.
The direct impact of climate change on roads and its indirect impact on other economic systems are equally enormous. Poor roads resulting from huge potholes can lead to road accidents and delay the transport of foodstuffs and other goods across the country while vehicular traffic jams can lead to more fuel consumption in addition to huge time loss. Already, Ghana is suffering from the impacts of climate change in the transport sector. Information from the Environmental Protection Agency [10] indicates that, 13 bridges collapsed, 1016 km of feeder roads were destroyed and 442 culverts damaged in the northern region in 2007 from climate related events. Currently, there is no work on Ghana that attempts to economically assess the impact of climate change on road infrastructure that can inform policy makers on the need to adapt to the impact of climate change on roads, as well as assessing the costs and benefits of various adaptation options. In this regard, research questions that arise are: What is the nexus between climate change and road infrastructure? What is the economic cost of climate change on road infrastructure?
In line with these research questions, this study aims at quantifying the economic cost of the impact of climate change on road infrastructure in Ghana with the view to helping policy makers in Ghana make informed decisions about the need to adapt to climate change or otherwise. This work is very relevant in that studies on the economic impact of climate change on road infrastructure in sub-saharan African countries are largely unavailable. Studies that have been undertaken in this area (for example [11]) are largely qualitative, making it difficult for policy makers to know the monetary value of the impact, which can inform the need to adapt.

2. Literature Review

Many studies have examined the cost of policies such as carbon taxes and cap-and-trade systems to mitigate climate change, but few address the costs of climate change adaptation [12,13,14]. Those that attempt to address the impact of climate change has focused mainly on using predictions in weather conditions to hypothesize the potential impacts on road infrastructure and consequently are qualitative in nature. Serrao-Neuman et al. [15] in their work on climate change impacts on road infrastructure systems and services in south east Queensland noted that changes in average rainfall, temperature and evaporation patterns can alter the moisture balance in the pavement foundation of roads and recommended a re-think on how roads are designed, constructed and maintained while the increase in the water table due to rising sea level can lead to a reduction of the structural strength of pavements [16].
The Natural Resources Department of Canada has asserted that an increase in the frequency and severity of hot days could cause traffic-related rutting as well as the migration of liquid asphalt (flushing and bleeding) to pavement surfaces from older or poorly constructed pavements while Jackson and Puccinelli [17] report that increased freeze-thaw cycles in the northern climatic zones have the potential to increase degradation of infrastructure.
Research conducted by the Transportation Research Board [18], Galbraith et al. [19] and AUSTROAD [20] focused on disasters related to weather and emphasized the severity of their potential impacts on transport operations. The work of the United State’s Department of Energy [21] emphasized on studies that will identify the specific impacts of temperature, rain, snow and ice, wind, fog and coastal flooding on roads. A more comprehensive work on the impact of climate change on transportation provided a framework for making an assessment of the impact of climate change on the transport sector and concluded that weather related hazards have the potential to affect transport infrastructure and operation. In general, the National Research Council of the National Academies of the United States [22] documents the potential impacts of climate change on road infrastructure and its downstream impact on road transport services.
Chinowsky et al. [23] enumerates the limitation of these studies to include their narrow discussion of the potential impact of climate change and failure of the studies to provide specific quantitative estimates of cost of the potential impacts. Based on these limitations, Chinowsky et al. [24] estimated the potential costs of climate change adaptation in ten countries that are geographically and economically diverse. Stratus Consulting [25] also estimated the potential impacts of climate change on bridges and Industrial Economics [26] provided the same on roads in northern climatic zones.

3. Methodology

This study uses the Infrastructure Planning Support System (IPSS) software developed by the Institute for Climate and Civil Systems, of the United States of America, to calculate the cost of climate change on roads. The software has been used in a number of studies to assess climate change impacts on infrastructure, such as Chinowsky et al. [27] on some Southern African countries, Chinowsky et al. [28] on Africa, and Schweikert et al. [29] on South Africa.
It is a dynamic infrastructure simulation model that uses a design-based stressor-response methodology. The contribution of the current study is to explore the effects of climate change on road infrastructure in Ghana. The IPSS software facilitates this exploration and, thus, it is the result of the exploration rather than the tool itself that are emphasized in this study. Details of the methodological framework are provided by [23,30]. In the next sections we provide a summary of the framework.

3.1. Impact Functions

The stressor-response framework is made up of two steps—use of foresight to determine the potential impact of climate change on a specific road in a specific location and using that information to determine the cost of the impact based on a set of stressor-response functions. The framework is based on the idea that exogenous factors (stressors)—such as precipitation, temperature and flooding (extreme events) affect focal elements—roads, which subsequently respond to the effects caused by the stressors. The impacts of climate change on roads are different depending on the type of road (paved and unpaved) and the functional classification (economic importance) of the road (tertiary, secondary and primary). Thus, each stressor is examined for the different types of roads to illustrate its impact on the road based on the intensity of the stressor.
The stressor-response framework, using climate change projections from Global Circulation Models (GCMs), determines the infrastructure elements within specific climatic zones and finally determines the climate impacts on the infrastructure. The GCMs provide climatological data for future climate change scenarios through 2100. Data used in this analysis include the available A2, A1B and B1 scenarios from the CMIP-3 family of scenarios, based on the accepted definitions (The A2 storyline and scenario family describes a very heterogeneous world. The underlying theme is self-reliance and preservation of local identities. The A1B (Balanced) is one of the scenarios in the A1 family. The A1 storyline and scenario family describes a future world of very rapid economic growth, global population that peaks in mid-century and declines thereafter, and the rapid introduction of new and more efficient technologies. Balanced is defined as not relying too heavily on one particular energy source, on the assumption that similar improvement rates apply to all energy supply and end use technologies. The B1 storyline and scenario family describes a convergent world with the same global population that peaks in mid-century and declines thereafter, as in the A1 storyline, but with rapid changes in economic structures toward a service and information economy, with reductions in material intensity, and the introduction of clean and resource efficient technologies) of [31]. In total, 54 climate scenarios from 18 GCMs (three scenarios per GCM) were used for the analysis. The newer CMIP-5 downscaled scenarios were not available for this region at the time of the study.
Scientific studies and case studies have been used to develop response functions for the different road categories. To develop stressor-response values specific to individual countries, the U.S.-based cost estimates are scaled using an inter-country construction cost index published by [32]. The stressor-response factors have been divided into two general categories: impacts on new construction costs and impacts on maintenance costs.

3.2. Stressor-Response Values for New Construction Costs

New construction cost factors are focused on the additional costs required to adapt the design and construction of a new infrastructure asset or rehabilitating the asset to changes in climate expected to occur over the asset’s lifespan (adapt). Two approaches—change in material used and change in infrastructure are used to determine the stressor-response values for new construction costs. Each approach retains the focus of building a new infrastructure component to a standard that enables it to withstand projected climate change impacts over its design lifespan.
The material methodology used to generate stressor-response values for paved gravel roads assumes that climatic conditions will change in future, which will consequently affect roads. Thus, material used in construction now should also be changed to accommodate future change in roads brought about by climate change. In other words, if throughout the lifespan of the road it is anticipated that a significant climate change stressor will occur, then roads, such as paved roads should be constructed with better materials that can withstand the change. Using data from several sources including [33,34,35] it was assumed that for every 10 centimeter increase in maximum monthly precipitation for both paved and gravel roads or 6 °C maximum pavement temperature increase for paved roads, there will be a material change. The reason is that for paved roads, increased precipitation results in increased potholes, erosion of the sub-base, drainage capacity, etc., and, thus, reduced amount of time until resurfacing is required. For temperature, based on pavement binder requirements, for every 6° projected pavement increase, a new asphalt binder must be used. This is due to the fact that increased temperature and traffic loads lead to rutting. These changes result in cost increases over base construction costs to the overall project.
The benefit of the material methodology is that basic and climate-related maintenance is eliminated during the life span of the road. This benefit is evaluated at the decision point. If it is positive, the paved road alternative is recommended. Otherwise, the emphasis is placed on anticipated increase in maintenance costs. With regards to change in infrastructure that is used mainly for unpaved roads, the idea is to change the type of infrastructure being constructed to adapt to the anticipated climate change. Thus, in order to adapt unpaved roads to climate change, there will be the need to increase maintenance or gravel the road, which comes at a cost.

3.3. Stressor-Response Values for Maintenance Costs

Maintenance cost effects are maintenance costs which are anticipated to be incurred due to climate to achieve the designed lifespan (no adapt). This strategy is realized individually for the various road categories, and, in each road category, the underlying concept is to retain the designed life span for the structure.
The approach for paved roads is based on the cost of maintaining the road to achieve its lifespan or the cost of preventing a reduction in lifespan. Two basic steps are involved—estimating the lifespan decrease that would result from a unit change in climate stress and estimating the costs of avoiding this reduction in a lifespan. In estimating the reduction in lifespan, it is assumed that such a reduction is equal to the percentage change in climate stress, scaled for the stressor’s effect on maintenance costs. This indicates that the potential change in lifespan is dependent on the change in climate stress.
The change in maintenance costs is calculated as the product of the potential percentage reduction in lifespan and the base construction costs of the asset. To estimate the reduction in lifespan that could result from an incremental change in climate stress, it is assumed that such a reduction is equal to the percentage change in climate stress, scaled for the stressor’s effect on maintenance costs. For gravel and dirt roads, maintenance impacts are induced by changes in maximum monthly precipitation rates. The result of increased precipitation is increased erosion, creating a need to increase maintenance to retain the original design life.
The amount of erosion is used as a basis for determining the percentage of maintenance increase required which is used to estimate the changes in road maintenance costs. Three factors affect the calculation of erosion rates for roads—precipitation amount, traffic levels, and slope of the road. In terms of precipitation, studies indicate that a 1% increase results in an approximate 1% impact on the design life in a minimal slope condition with low traffic levels [36]. This is used as the base condition for maintenance calculations. However, this base case is augmented as traffic rates and slope percentages increase resulting in significantly greater erosion rates. Once the appropriate modifiers are taken into account, the total cost can be calculated for a specific climate scenario.
The software analyses all costs and climate impacts from two policy perspectives: a “No Adapt” (business as usual) scenario which assumes that there is no adaptation, roads are rebuilt according to existing standards and the costs incurred are from increased maintenance necessary to retain the design life of the original road as degradation of the road infrastructure occurs from climate change stressors and an “Adapt” policy which assumes perfect foresight with respect to climate change. These forward-looking climate projections are applied to upgrade new roads as they are re-built and maintained. Thus, it incurs up-front costs to adapt a road to mitigate future damages that are projected from increases in precipitation or temperature.

3.4. Determination of Opportunity Cost

In order to establish a common evaluation metric, the opportunity cost metric was used. In quantitative terms, the opportunity cost is defined as:
OC = CC/SRC
where OC is Opportunity Cost in kilometers, CC is the total estimated climate change cost for Ghana including both maintenance and new costs through 2100, and SRC is the cost of constructing a kilometer of new paved road. The equation indicates that the opportunity cost for Ghana is equal to the total increase in the paved road network that could have been achieved if the money was not being diverted to climate change adaptation.

3.5. Data Source

The basic input data for the IPSS software is road stock inventory classified by road class: primary, secondary and tertiary, road type: paved and unpaved, and by Administrative area: regions and districts. Using the road class and road type classifications, the software recognizes nine main types of roads—paved primary roads, paved secondary roads, paved tertiary roads, gravel primary roads, gravel secondary roads, gravel tertiary roads, unpaved primary roads, unpaved secondary roads and unpaved tertiary roads. All roads in Ghana were assigned to one of these classifications by regions and districts. Other data that are used and incorporated in the IPSS include climate data from internationally approved climate scenarios, engineering design standards for infrastructure (precipitation impacts, temperature impacts and extreme events impacts) and documented research for traffic, geographical, and other impacts.
In Ghana, the Ministry of Roads and Highways is the principal institution in charge of formulating policies, monitoring and evaluating programs and projects on roads. Four departments and agencies—Ghana Highway Authority (GHA), Department of Urban Roads (DUR), Department of Feeder Roads (DFR) and the Ghana Road Fund Secretariat—come under the ministry. With the exception of the Ghana Road Fund Secretariat, which basically provides funding to Ghana’s road fund, the other three departments are responsible for the physical road infrastructure at various levels.
The GHA is in charge of trunk roads: major roads linking major cities and other places in the country. The DUR is responsible for the provision and management of urban road networks in support of quality transport systems in Metropolitan, Municipal and District Assemblies (MMDAs) while the DFR is the agency responsible for the provision of safe all weather accessible feeder roads at optimum cost to promote socio-economic development in rural areas. These departments are in charge of compiling information on road statistics.
Roads in Ghana are classified based on the cover of the surface, Surface Classification (paved and unpaved), and on the function that the road provides, Functional Classification. There are other sub classifications under the paved and unpaved roads but for the purpose of this study, roads were classified only into paved and unpaved. Functional classification of roads is based on the functions that the road provides in the road network system of each department (GHA, DUR and DFR) and therefore the different departments have different functional classifications of their road network. The GHA has three main functional classifications of roads namely national roads, inter regional roads, and regional roads. National roads are roads that link the national capital with the various regional capitals and neighboring countries, which are of strategic importance. Inter-regional roads are roads that link the various regions in Ghana. Regional Roads, on the other hand, link district capitals to their respective regional capitals. Regional roads also link district capitals to the nearest district capital, as well as major industrial, trade, or tourist centers.
The DUR functionally classifies its roads into three main functional categories—Arterials, collectors/distributors and local/access roads. Arterial roads are high capacity urban roads whose main function is to deliver traffic from collector roads. The collectors are moderate capacity roads, which move traffic from local roads to the arterial roads. Collectors, also known as distributors are mainly designed to provide access to residential areas. The DFR functionally classifies its roads into inter district roads, connectors/ travel mobility feeder roads and Access Feeder Roads. Inter-district roads connect one district capital to the other and carry relatively high volumes of traffic compared to travel mobility feeder roads (Connectors), which are feeder roads with their ends connected to two other roads. Access feeder roads connect only one road, i.e., the road moves to a dead end and a motorist will have to travel back on that same road once that road is taken. They are relatively short in length and carry relatively low volumes of motorized traffic.
To conform to the IPSS format, the functional classifications of roads by the three departments—GHA, DFR and the DUR—were re-aligned to the IPSS classification, as depicted in Table 1.
Table 1. Functional classification of roads by road agencies.
ClassificationGhana Highway Authority (GHA) Department of Urban Roads (DUR)Department of Feeder Roads (DFR)
PrimaryNationalMajor ArterialsInter-District
SecondaryInter RegionalCollectors/DistributorsTravel Mobility Feeder Roads (Connectors)
TertiaryRegionalLocal/AccessAccess
Source: Compiled by Authors with data from [37,38,39].
Using the surface and functional classification discussed, six main categories of roads were established—paved primary roads, paved secondary roads, paved tertiary roads, unpaved primary roads, unpaved secondary roads and unpaved tertiary roads for which data was collected by districts. The gravel road in the IPSS, therefore, does not fall within the classifications of surface types maintained in Ghana. All roads in Ghana were assigned to one of these classifications and by regions and districts.
To obtain these categories of data from the Departments, different methods were used due to the different formats in which the departments keep the data. The GHA uses the Pavement Maintenance Management Programme (PMMP) as part of its Pavement Management System tool. The software provides information on the entire road network under the jurisdiction of the Department and their lengths. The roads are grouped based on their functional classification and the surface type, but are not organized into districts. To obtain the data by districts, the spatial database of the network was opened and superimposed on the spatial digital map of metropolitan, municipal and districts boundaries. The various lengths of roads within each metropolitan, municipal and district were calculated. The DFR roads database is organized according to metropolitan, municipal and district and also by surface type and functional classification. It was, therefore, easy to obtain the requisite data. The DUR is found in about 15 municipal and metropolitan assemblies in Ghana, and have an excel database with their roads organized according to surface type and functional classification. Table 2 provides information on the classifications adopted for the IPSS and the corresponding road in the various departments.
Table 2. Classifications adopted in the Infrastructure Planning Support System (IPSS) and corresponding road in various departments.
IPSS ClassificationGHADFRDUR
Paved PrimaryPaved NationalBitumen Inter DistrictAsphalt/Surface Dressing Major/Minor Arterial
Paved SecondaryPaved Inter-RegionalBitumen AccessAsphalt/Surface Dressing Distributor/Collector
Paved TertiaryPaved RegionalBitumen ConnectorAsphalt/Surface Dressing Local/Access
Unpaved PrimaryUnpaved NationalGravel/Earth Inter DistrictGravel Major/Minor Arterial
Unpaved SecondaryUnpaved Inter-RegionalGravel/Earth ConnectorGravel Distributor/Collector
Unpaved TertiaryUnpaved RegionalGravel/Earth AccessGravel Local/Access
Source: Compiled by Authors with data from [37,38,39].

3.6. Limitations

There are limitations that introduce some uncertainty in the results. First, the study uses 54 different GCMs not only with acknowledged variability and uncertainty but also, the projections are performed on a 2° by 2° geographic grid, which necessitates down-scaling for application to region-specific analysis. This is accomplished in the study by mapping the climate grids to a historic weather grid of 0.5° by 0.5°, as defined by the Climate Research Unit (CRU). This allows the larger climate projection areas to be applied to historical variances experienced in a local region. However, the CRU units remain at a 50 km by 50 km grid, which introduces an element of uncertainty to the specific impacts. Secondly, quantitative cost estimates are based on existing material studies that use specific localized pavement types, local conditions, construction and maintenance techniques which may be different from what is found in Ghana. Data limitations, in terms of localized data specific to Ghana, made it difficult to include some components in the cost analysis. For example, flooding is an important factor in understanding damages in climate change, but is not considered in this analysis because of specificity of data required in terms of micro-scale hydrologic modeling and detailed road infrastructure placement data, which is beyond the CRU grid limitation. Finally, it is important to note that all of the climate scenarios are treated as equally likely to occur or not occur. Because of the uncertainty in the models, a probability distribution is not applied to the scenarios. Additionally, the groups of climate scenarios are presented together in the results to provide an indication of the breadth of the results. Individual differences between scenario classes are not specified in the study results.

4. Results and Discussion

We first examine the variance in terms of the distribution of the potential impacts based on the climate scenarios and later the variance in both the “adapt” and “no adapt” policies. As indicated in Figure 1, there are some distinct distributions of potential impacts based on the 54 GCMs considered.
As illustrated, the adapt scenarios produced the greatest balance of potential impacts compared to the “no adapt” scenario. About 28% of the scenarios can be found in the main grouping in both the “adapt” and “no adapt” scenarios, with about 20% and 13% falling in the second group in the “adapt” and “no adapt” scenarios, respectively. A particular observation in both the “adapt” and “no adapt” scenarios is the high number of scenarios that occur in the highest two groupings. Specifically, about 22% and 19% of the scenarios, in both the “no adapt” and “adapt”, are found in the highest two groupings, indicating that the probability of their occurrence is high compared to the lowest two groupings, which are 24 and 17, respectively.
Figure 1. Histogram of cost impacts of various (Global Circulation Models (GCM). Source: Authors’ Computation using IPSS.
Sustainability 07 11949 g001

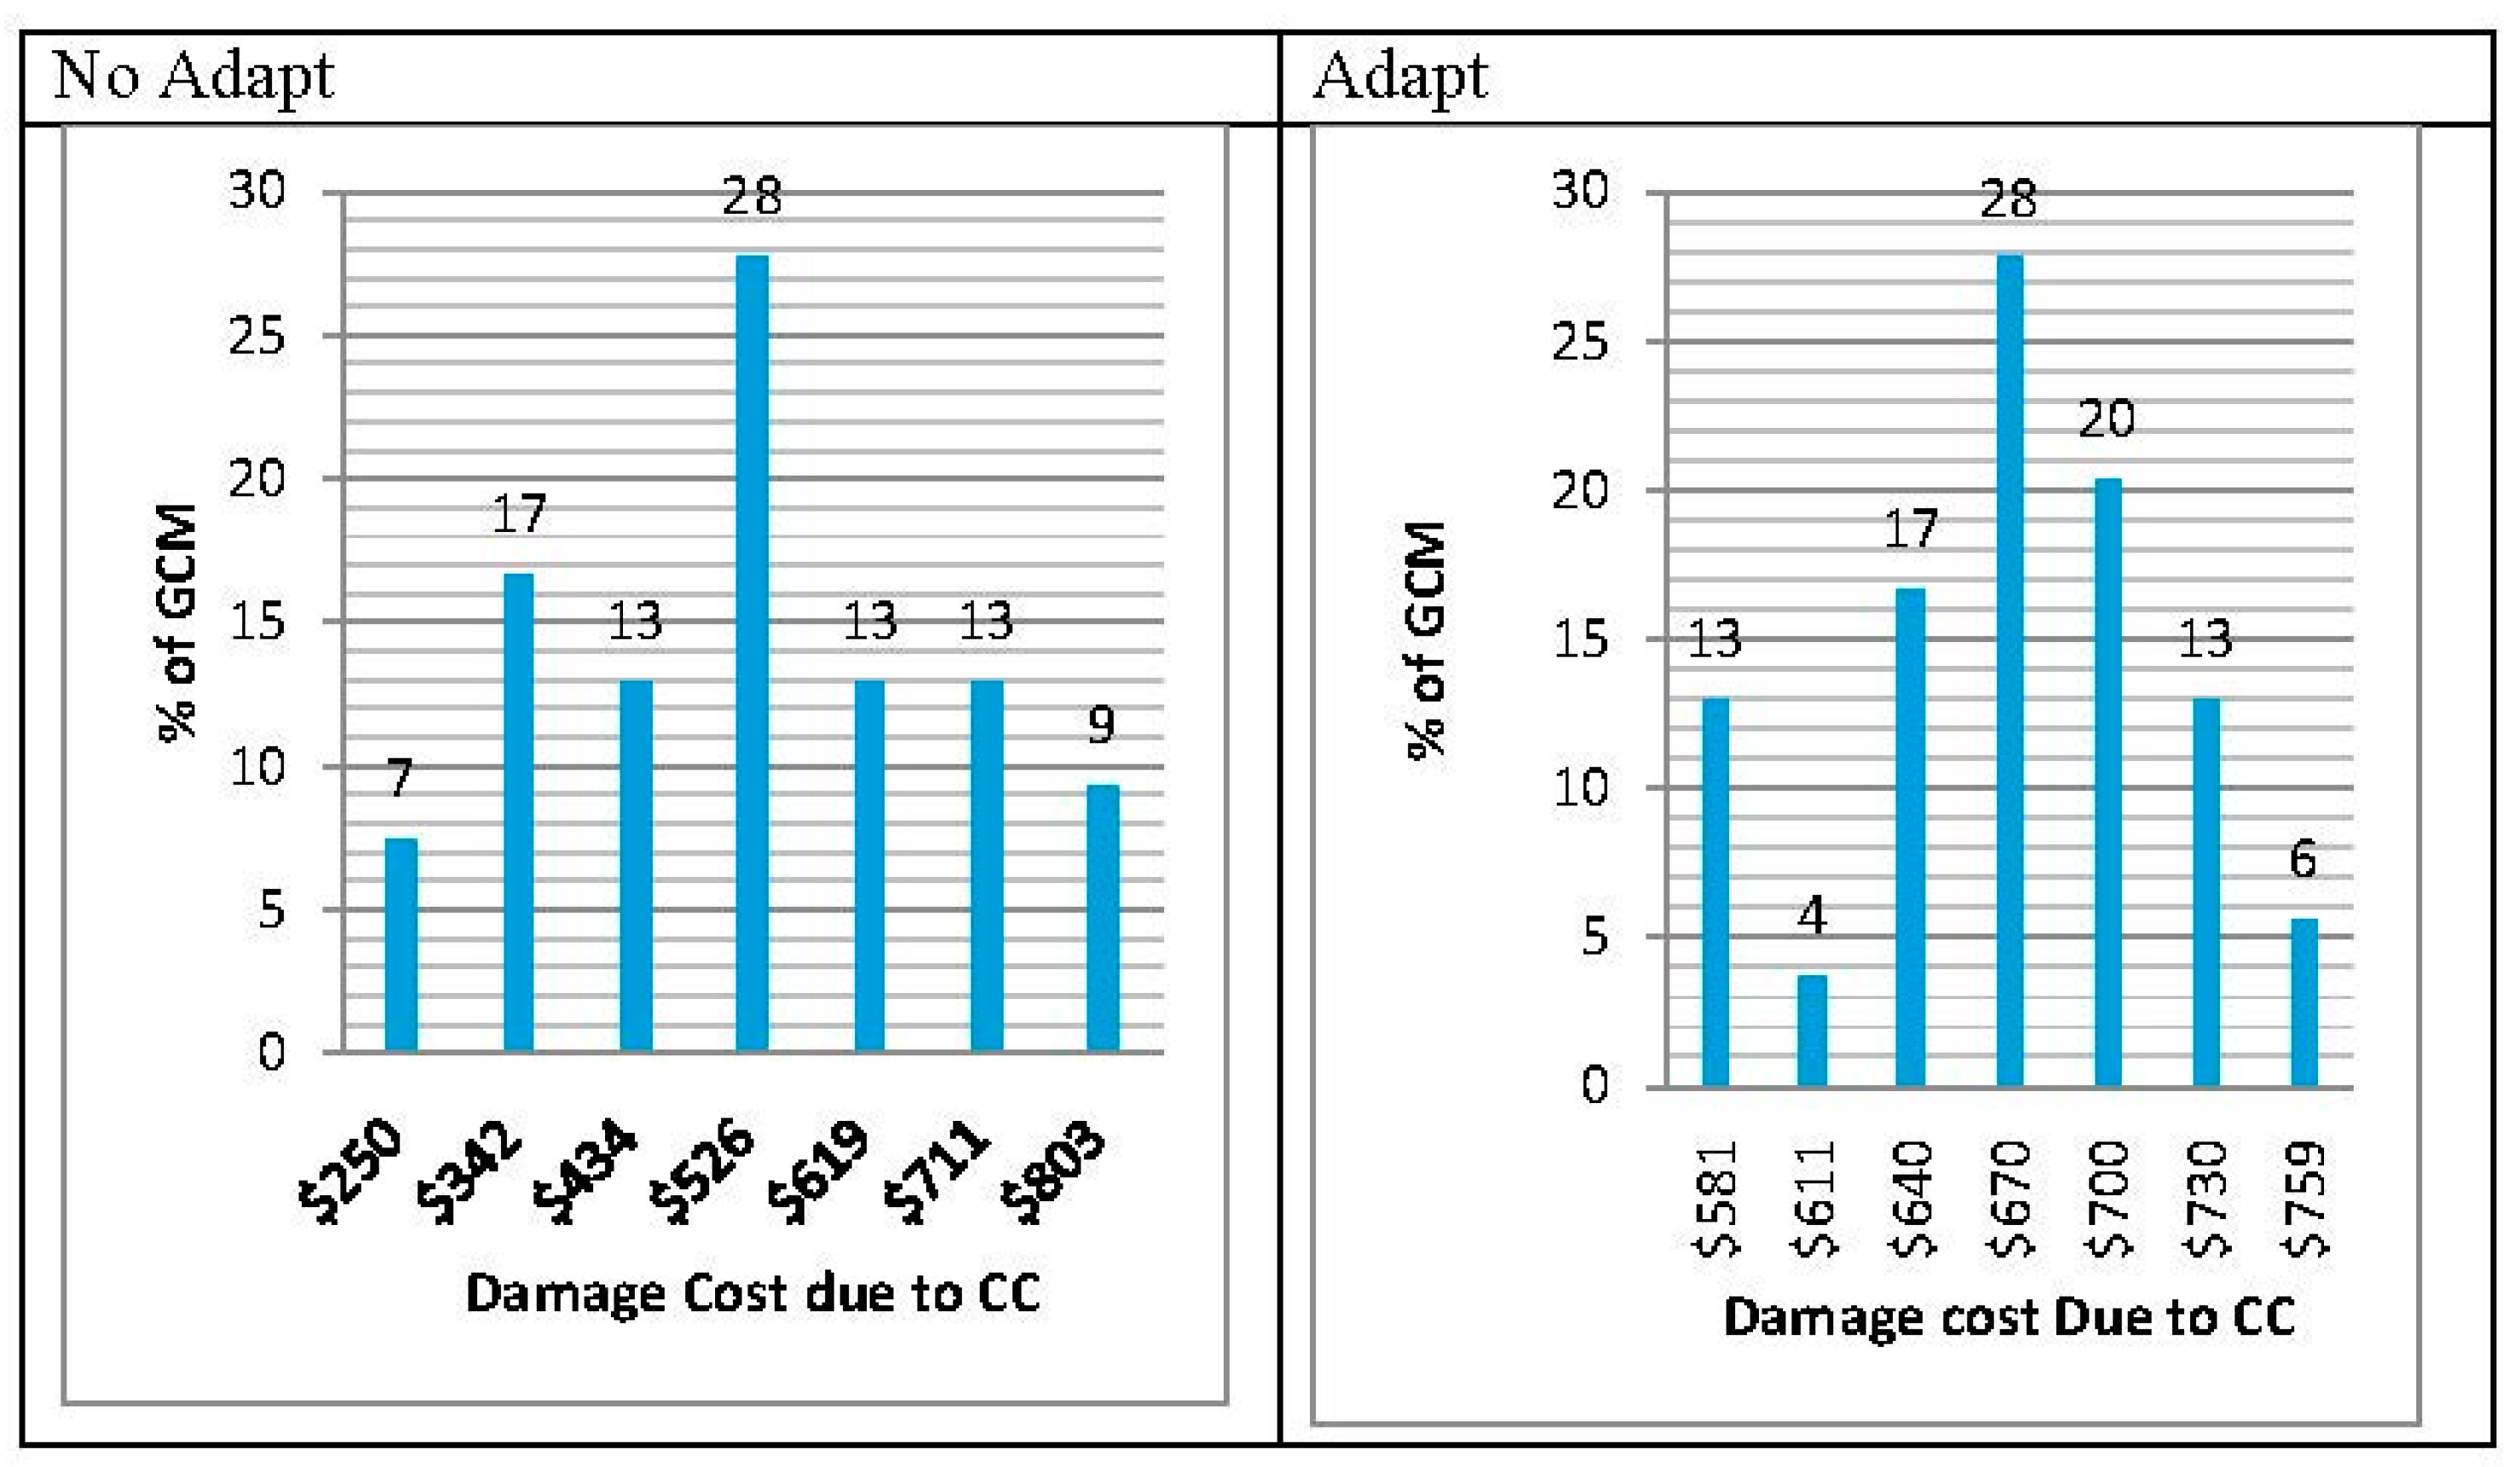
4.1. National Level Analysis

Results of the variance in both the “adapt” and “no adapt” policies as shown in Table 3 indicates that it may cost Ghana cumulatively about $473 million US dollars in maintaining and repairing damages caused to existing roads directly as a result of climate change (changes in precipitation, temperature and flooding) from the year 2020 through 2100 based on median climate scenarios. The cost will go directly to the maintenance of the current road inventory. However, if Ghana focuses on a proactive response to climate change by adapting the designing and construction of a new infrastructure asset or rehabilitating the asset to changes in climate expected to occur over the asset’s lifespan, the total cumulative median cost will increase to about $678.47 million US dollars in 2100. While the adapt cost is more than the no-adapt cost in these scenarios, these costs are restricted to capital construction and maintenance costs. Specifically, the associated economic losses that will be incurred with the no-adapt scenario, due to roads being inaccessible until maintenance is completed, are not included in this analysis. However, this can be significant in areas where communities are served by a limited road inventory. In these cases, if roads are not repaired expediently, the economic losses can outpace the increased costs of adaptation.
Table 3. Total cumulative costs (in million USD) and road lost (in km).
No AdaptAdapt
CostsKM LostCostsKM Lost
$473.723158.17$678.474523.2
Source: Authors’ Computation using IPSS.
The opportunity costs of spending that amount ($473.72 million) in maintaining and repairing the roads is 3158 km of paved roads, which could have otherwise been constructed, or, in the case of unpaved roads, which could have been upgraded. On the other hand, if adaptation is employed in which case, unpaved roads are upgraded and other adaptive measures are implemented, the costs increased to $678.47 million US through year 2100, which translates into 4523.2 km of roads that could be paved for the estimated impact costs.
Evidently, the cost of an “adapt” policy is higher than a “no adapt” policy. This could be due to the fact that implementing policies on adaptation comes at a higher cost because it requires changing methods of construction and rehabilitation of roads whose benefits may not be felt initially until the impact of climate change has set in. Specifically, there is no immediate benefit from adaptation until the impact of climate change has set in even though costs will be incurred. Additionally, [23] argues that, the level of upgrade required in an “adapt” policy may be higher than the extent of the impact of climate change leading to excess costs above the benefit. Furthermore, the large number of unpaved roads also explains the high adaptation cost since the adaptation policy for unpaved road involves the paving of the road and it costs more to adapt an unpaved road to better withstand the impacts of climate change than to adapt a paved road. Specifically, the total kilometers of roads that are unpaved in Ghana are a little less than four times the total number of paved roads. Total unpaved roads in Ghana, as used in this study, stands at 54,604.59 km, against total paved roads, which stand at 14,232.97 km. These, among other reasons, could explain why an “adapt” policy costs more than a “no adapt” policy.
Figure 1 details the costs of employing an “adapt” and “no adapt” policy from the year 2020 through 2100 on a decadal scale.
From Figure 2, it can be seen that the decadal cost of the “adapt” policy decreases over time while that of the “no adapt” policy increases over time. Specifically, while the decadal cost of the “adapt” policy decreased from about $178.80 million US in 2020 to about $53.74 million US in 2100, that of the “no adapt” policy increased from about $29.45 million US to $77.77 million US over the same period. A very high cost is incurred at the decade ending year (2020) largely as a result of upfront costs incurred in adapting roads. However, the cost reduces with time due to savings from adaptation. A notable observation is that costs for “adapt” and “no adapt” policies stabilized in the 2050–2070 decades, but those of “no adapt” overrun the “adapt” policy thereafter.
Figure 2. Median average annual cost by decade (USD million), 2020–2100. Source: Authors’ Computation using IPSS.
Sustainability 07 11949 g002
The reason could be that, the benefits of an adapt policy are likely to be felt in the long term (about 30 years) since the impact of climate change will be felt in the long term. Hence, incurring huge costs to adapt upfront before the impact of climate change sets in renders the net cost very high initially. However, in the long term, as the impact of climate change begins to manifest, the adapt policy begins to yield its full benefit thus reducing the net costs to the country. In the case of the no adapt policy, since the impact of climate change may not be felt initially, the cost of not adapting becomes lower but increases in the long term as the impact of climate change becomes eminent.

4.2. Regional Level Analysis

Table 4 shows the costs and opportunity costs on regional basis for both climate change response options. As evidenced from the table, the highest cost of $113.16 million US will be incurred in the Northern Region if the country decides to opt for the adapt policy. The opportunity cost is 754.47 km of roads lost. The lowest cost of $44.2 million US is incurred in the Greater Accra Region, which translates into 294.62 km of road lost.
Table 4. Total cumulative costs (in million USD) and road lost (in km) by regions (up to 2100).
RegionAdaptNo Adapt
CostKm lostCostKm lost
Ashanti83.49556.5664.78431.85
Brong Ahafo81.66544.2958.82392.17
Central 46.56310.4143.28288.48
Eastern68.51456.5849.19327.92
Greater Accra44.2294.6235.31235.39
Northern113.16754.4769.21461.55
Upper East48.09320.5731.12207.45
Upper West54.7364.6633.05220.34
Volta70.95472.9750.42336.17
Western67.2448.0738.54256.85
Source: Authors’ Computation using IPSS.
This may be explained by the fact that Greater Accra Region has more paved roads and less unpaved roads while the reverse is the case in the Northern Region. Specifically, Greater Accra Region has about 2897 km and 4854 km of paved and unpaved roads respectively while the Northern region has 1150 km and 9139 km of paved and unpaved roads respectively. Adapting more kilometers of unpaved roads in the Northern Region will cost more than what it will cost to adapt the fewer unpaved roads and more paved roads in the Greater Accra Region. Additionally, the Northern Region is the largest region in Ghana in terms of land size, while the Greater Accra Region is among the smallest regions. Thus, the Northern Region generally has more kilometers of roads than in the Greater Accra Region. Furthermore, changes in temperature and precipitation may be more intense in the north than in the south.
These same reasons account for the fact that under a “no adapt” policy, the Northern Region’s cost of $69.21 million US is the highest, while the Upper East’s cost of $35.31 million US is the lowest. In terms of opportunity costs, these costs translate into 461.55 km and 207.45 km of roads that will not be constructed in the Northern and Upper East regions, respectively.

4.3. Average Annual Cost by Road Type

Table 5 shows the average annual costs, in million USD, to be incurred on each road type for both the “adapt” and “no adapt” policies. From the table it can be seen that the average annual cost of adapting unpaved roads is higher than that of the paved road in the “adapt” policy, while the reverse is the case in the “no adapt” policy.
Table 5. Total cumulative costs (in million USD) by road type.
YearAdapt Policy
PavedUnpaved
PrimarySecondaryTertiaryTotalPrimarySecondaryTertiaryTotal
203017.403.264.5325.1913.6223.6016.7253.94
20509.312.474.3416.129.3918.2011.6339.22
20908.032.174.0314.239.5118.1211.7339.36
YearNo Adapt Policy
PavedUnpaved
PrimarySecondaryTertiaryTotalPrimarySecondaryTertiaryTotal
203012.111.741.8615.711.151.751.474.37
205035.985.205.6846.860.020.040.030.09
209043.996.386.8457.212.164.763.6010.52
Source: Authors’ Computation using IPSS.
This confirms the earlier assertion that under an adaptation policy, initial costs are high but reduce over time since the benefits of adaptation will be experienced many years after implementing the policy.

5. Conclusions

In this work, we provide an initial quantitative estimate of the cost of climate change impacts on roads using the stressor–impact methodology, which has been developed into the IPSS and requires comprehensive data on road infrastructure classified by road type and road function. Analysis of the data reveals that the “adapt” policy produces the greatest balance of potential impacts compared to the “no adapt” scenario. A particular observation in both the “adapt” and “no adapt” policies is the high number of scenarios that occur in the highest two ranges indicating that the probability of their occurrence is high.
The results also indicate that it may cost Ghana, cumulatively from 2020–2100, about $473 million US dollars in maintaining and repairing damages caused to existing roads directly as a result of climate change, based on median climate scenarios. However, if Ghana focuses on a proactive response to climate change, by adapting the designing and construction of a new infrastructure asset or rehabilitating the asset to changes in climate expected to occur over the asset’s lifespan the total cumulative median cost will increase to about $678.47 million US in 2100. This implies that it is economically beneficial for Ghana to use the “no adapt” scenario. We, therefore, recommend the no adapt policies for Ghana—repairing and maintaining roads as and when they are impacted by climate change. This recommendation highlights the differences that climate can have in different parts of Africa. In Ghana, it is not always clear that adapting is the appropriate policy to implement under all climate scenarios. This is in contrast to other areas in Africa, where climate impacts have an immediate benefit for adaptation. For example, [27] established that adapting to road infrastructure was more beneficial than not adapting largely as a result of their resilience to climate change impacts, which results in significant savings in the early years. This raises the issues of risk in applying an adaptation policy and what are the concurrent economic benefits that influence the argument.
The decadal cost of the “adapt” policy decreases over time while that of the “no adapt” policy increases over time largely as a result of the benefits of an adaptive policy being felt in later years than earlier, while the cost of adaptation will be higher in the later years than the earlier years. Regional analysis of the results indicate that the highest cost will be incurred in the Northern Region if the country decides to opt for the adapt policy, while the lowest cost will be incurred in the Greater Accra Region, largely as a result of the large number of unpaved roads in the Northern Region that needs to be adapted to changes in climate. Furthermore, the cost of adapting unpaved roads is higher than that of paved roads in the “adapt” policy while the reverse is the case in the “no adapt” policy.
This study provides the starting point for broader discussions on the potential impacts of climate change on road infrastructure, as well as an opportunity for evaluating the options available for adapting these infrastructures to the potential impacts of climate change on roads in Ghana. The stressor response methodology is an innovative tool that could be used to develop a comprehensive instrument for evaluating the economy-wide impact of climate change through its impact on road infrastructure. This could be done by linking the model to general equilibrium models that includes infrastructure, Additionally, the stressor response functions uses information on global literature on engineering that does not take into consideration specific Ghanaian context. This could affect the accuracy of our estimates. Future studies should address this limitation by using specific information on local condition, pavement types, construction and maintenance techniques, etc. Additionally, unavailability of micro-scale hydrologic modeling and detailed road infrastructure placement data made it impossible to include the impact of flooding even though it is an important factor in understanding damages in climate change. Furthermore, the current analysis does not include bridges even though they are critical components of road infrastructure. These issues could be addressed if engineering work on the impact of climate change on specific types of bridges are incorporated into the model.

Acknowledgments

This work was fully supported by the United Nations University–World Institute for Development Economic Research (UNU-WIDER) under the Development under Climate Change (DUCC) research effort.

Author Contributions

Daniel Kwabena Twerefou and Kwame Adjei-Mantey collected data required for the model, run the model with the support of Niko Lazar Strzepek, analysed the results and wrote majority of the manuscript. Paul Chinowsky designed the research. He is the main developer of the IPSS model, provided backstoping and reviewed the manuscript. Additionally, Niko Lazar Strzepek provided training on the IPSS model.

Conflicts of Interest

The authors declare no conflict of interest.

References

  1. Food and Agriculture Organization (FAO); Global Information and Early Warning System on Food and Agriculture (GIEWS). Foodcrops & Shortages; Country Reports; FAO: Rome, Italy, 2000. [Google Scholar]
  2. Environmental Protection Agency (EPA). Ghana’s Initial National Communication under the United Nations Framework Convention on Climate Change; EPA: Accra, Ghana, 2000.
  3. Environmental Protection Agency (EPA); United Nations Development Programme (UNDP); United Nations Environment Programme (UNEP). National Climate Change Adaptation Strategy; Environmental Protection Agency: Accra, Ghana, 2000.
  4. McSweeney, C.F.; Jones, R.G.; Booth, B.B.B. Selecting Ensemble Members to Provide Regional Climate Change Information. J. Clim. 2012, 25, 7100–7121. [Google Scholar] [CrossRef]
  5. World Bank. Toward Environmentally Sustainable Development in Sub-Saharan Africa: A World Bank Agenda; The World Bank: Washington, DC, USA, 1996. [Google Scholar]
  6. Lean, J.; Mahlman, J.D. What’s Driving Climate Change in the 20th Century—Changes in Solar Radiation or the Buildup of Greenhouse Gases? In Proceedings of the US Global Change Research Program Seminar, Washington, DC, USA, 23 November 1999.
  7. Agyeman Bonsu, W.; Minia, Z.; Dontwi, J.; Dontwi, I.K.; Buabeng, S.N.; Baffoe-Bonnie, B.; Yeboah, F.A.; Ofori, E.; Gyasi, E.A.; Karikari, O.; et al. Ghana Climate Change Impacts, Vulnerability and Adaptation Assessments; Allotey, J., Mensah, L., Eds.; Environmental Protection Agency: Accra, Ghana, 2008.
  8. Taylor, M.; Philp, M. Adapting to climate change—Implications for transport infrastructure, transport systems and travel behavior. Road Transp. Res. 2011, 19, 66–79. [Google Scholar]
  9. Intergovernmental Panel on Climate Change. Climate Change Impacts, Adaptations, and Vulnerability. A Contribution of Working Group II to the Third Assessment Report of the Intergovernmental Panel on Climate Change; McCarthy, J.J., Canziani, O.F., Leary, N.A., Dokken, D.J., White, K.S., Eds.; Cambridge University Press: Cambridge, UK; New York, NY, USA, 2001; p. 1032. [Google Scholar]
  10. Environmental Protection Agency. Climate Change in Ghana: Disaster Risks are an Increasing Concern for All; EPA Policy Advice Series No. 3; Environmental Protection Agency: Accra, Ghana, 2010.
  11. World Bank. Ghana—Making Transport Climate Resilient; World Bank: Washington, DC, USA, 2010. [Google Scholar]
  12. Stern, N. The Economics of Climate Change: The Stern Review; Cambridge University Press: New York, NY, USA, 2007. [Google Scholar]
  13. Claussen, E.; Cochran, V.A.; Debra, D. Climate Change: Science, Strategies & Solutions; Brill Academic Publishers: Boston, MA, USA, 2001. [Google Scholar]
  14. Nordhaus, W.D. A Question of Balance: Weighing the Options on Global Warming Policies; Yale University Press: London, UK, 2008. [Google Scholar]
  15. Serrao-Neumann, S.; Choy, D.L.; van Staden, R.; Crick, F.; Sahin, O.; Guan, H.; Chai, G. Climate Change Impacts on Road Infrastructure Systems and Services in South East Queensland: Implications for Infrastructure Planning And Management. In Proceedings of the State of Australian Cities National Conference, Gold Coast, Australia, 29 November–2 December 2011.
  16. Doré, G.; Konrad, J.M.; Roy, M. Role of De-icing Salt in Pavement Deterioration by Frost Action. J. Transp. Res. Board 1997, 1596, 70–75. [Google Scholar] [CrossRef]
  17. Jackson, N.; Puccinelli, J. Long-Term Pavement Performance Data Analysis Support: Effects of Multiple Freeze Cycles and Deep Frost Penetration on Pavement Performance and Cost; FHWA-HRT-06-121; Federal Highway Administration: Washington, DC, USA, 2006.
  18. Transportation Research Board. Potential Impacts of Climate Change on U.S. Transportation; TRB Special Report 290; Transportation Research Board: Washington, DC, USA, 2008. [Google Scholar]
  19. Galbraith, R.M.; Price, D.J.; Shackman, L. Scottish Road Network Climate Change Study; Scottish Executive: Edinburgh, UK, 2005.
  20. AUSTROADS. Impact of Climate Change on Road Infrastructure; No. AP–R243/04; AUSTROADS Publication: Sydney, Australia, 2004. [Google Scholar]
  21. Department of Energy. DeClimate Change Science Programme Effects of Climate Change on Energy Production and Use in the United States. U.S. Climate Change Science Program; Department of Energy: Germantown, MD, USA, 2008.
  22. National Research Council of the National Academies. Potential Impacts of Climate Change on U.S. Transportation; Transportation Research Board Special Report, No. 290; National Academies Press: Washington, DC, USA, 2008. [Google Scholar]
  23. Chinowsky, P.S.; Schweikert, A.E.; Strzepek, N.L. Costing and Impact Methodology Development Under Climate Change Research Project. 2010; unpublished work. [Google Scholar]
  24. Chinowsky, P.S.; Hayles, C.; Schweikert, A.; Strzepek, N. Climate Change as Organizational Challenge: Comparative Impact on Developing and Developed Countries. Eng. Proj. Organ. J. 2011, 1, 67–80. [Google Scholar] [CrossRef]
  25. Stratus Consulting. Climate Change Impacts on Transportation Infrastructure; A Technical Report Prepared for U.S. Environmental Protection Agency; Stratus Consulting: Boulder, CO, USA, 2010. [Google Scholar]
  26. Industrial Economics. Costing Climate Impacts and Adaptation: A Canadian Study on Public Infrastructure; Report to the National Round Table on the Environment and the Economy; Industrial Economics Inc.: Cambridge, MA, USA, 2010. [Google Scholar]
  27. Chinowsky, P.S.; Schweikert, A.E.; Strzepek, N.L.; Strzepek, K. Infrastructure and climate change: A study of impacts and adaptations in Malawi, Mozambique, and Zambia. Clim. Chang. 2015, 130, 49–62. [Google Scholar] [CrossRef]
  28. Chinowsky, P.; Schweikert, A.E.; Strzepek, N.; Manahan, K.; Strzepek, K.; Schlosser, C.A. Adaptation Advantage to Climate Change Impacts on Road Infra-Structure in Africa through 2100; Working Paper 25; UNU-WIDER: Helsinki, Finland, 2011. [Google Scholar]
  29. Schweikert, A.; Chinowsky, P.; Kwiatkowski, K.; Johnson, A.; Shilling, E.; Strzepek, K.; Strzepek, N. Road Infrastructure and Climate Change: Impacts and Adaptations for South Africa. J. Infrastruct. Syst. 2015, 21. [Google Scholar] [CrossRef]
  30. Schweikert, A.; Chinowsky, P.; Kwiatkowski, K.; Espinet, X. The infrastructure planning support system: Analyzing the impact of climate change on road infrastructure and development. Transp. Policy 2014, 35, 146–153. [Google Scholar] [CrossRef]
  31. Intergovernmental Panel on Climate Change. Climate Change 2007: Synthesis Report, in Contribution of Working Groups I, II and III to the Fourth Assessment Report of the Intergovernmental Panel on Climate Change 2007; Pachauri, R.K., Reisinger, A., Eds.; IPCC: Geneva, Switzerland, 2007. [Google Scholar]
  32. Compass International Consultants, Inc. Global Construction Costs Yearbook; Compass International: Morrisville, PA, USA, 2009. [Google Scholar]
  33. American Association of State Highway and Transportation Officials. AASHTO Provisional Standards; American Association of State Highway and Transportation Officials: Washington, DC, USA, 2001. [Google Scholar]
  34. NOAA Heating and Cooling Degree Day Data. NOAA Satellite and Image Information Service, 2009. Available online: http://www.ncdc.noaa.gov/oa/documentlibrary/hcs/hcs.html#51overview (accessed on 21 June 2015).
  35. Lea International, L.D. Modelling Road Deterioration And Maintenance Effects In HDM-4, RETA 5549-Reg Highway Development and Management Research, Final Report. 1995; unpublished work. [Google Scholar]
  36. Dubé, K.; Megahan, W.; McCalmon, M. Washington Road Surface Erosion Model; A Report Prepared for State of Washington; Department of Natural Resources: Colville, WA, USA, 2004.
  37. Ghana Highway Authority and German Technical Cooperation (GTZ). Pavement Management and Maintenance Programme: A Planning and Busgeting Tool for Road Maintenance and Development; Ghana Highway Authority: Accra, Ghana, 1995.
  38. Department of Urban Roads. Functional Classification of Roads in District Assemblies; Department of Urban Roads: Accra, Ghana, 1995.
  39. Department of Feeder Roads. Factssheet on Feeder Roads in Ghana; Department of Feeder Roads: Accra, Ghana, 1996.

