
Temperature Vegetation Dryness Index Estimation of Soil Moisture under Different Tree Species


Abstract
:1. Introduction
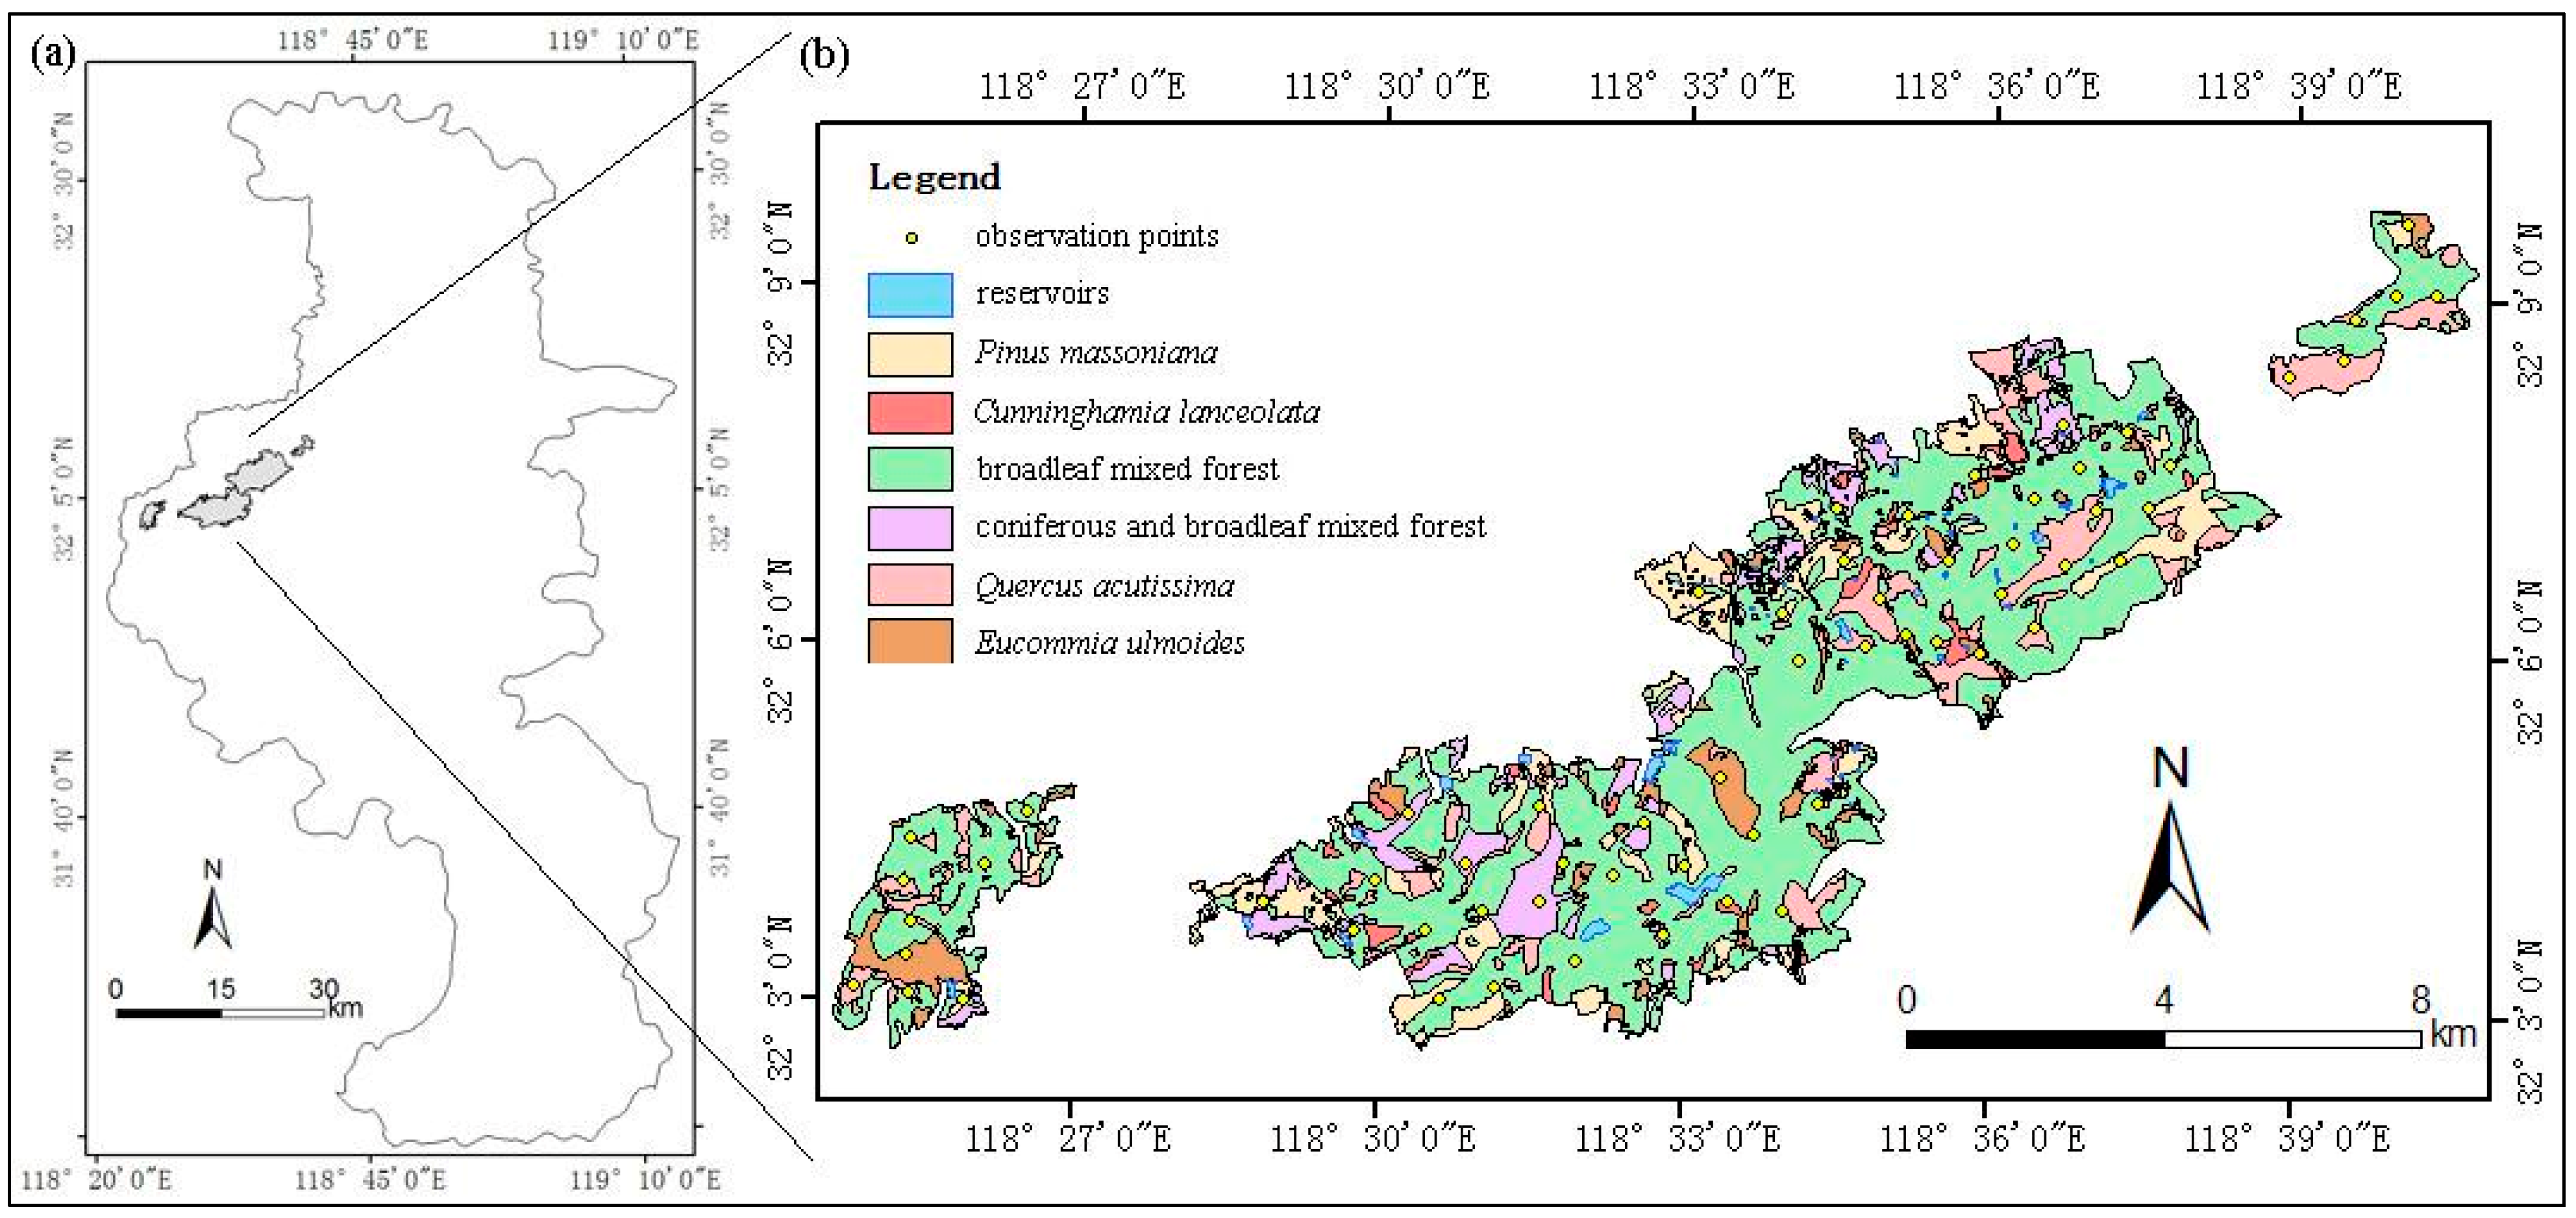
2. Study Area

| Land Cover Type | Area (units: ha) |
|---|---|
| broadleaf mixed forest | 5364.988 |
| Quercus acutissima | 704.342 |
| Pinus massoniana | 606.933 |
| coniferous and broadleaf mixed forest | 359.664 |
| Eucommia ulmoides | 269.748 |
| Cunninghamia lanceolata | 187.325 |
3. Methodology
3.1. Field Work
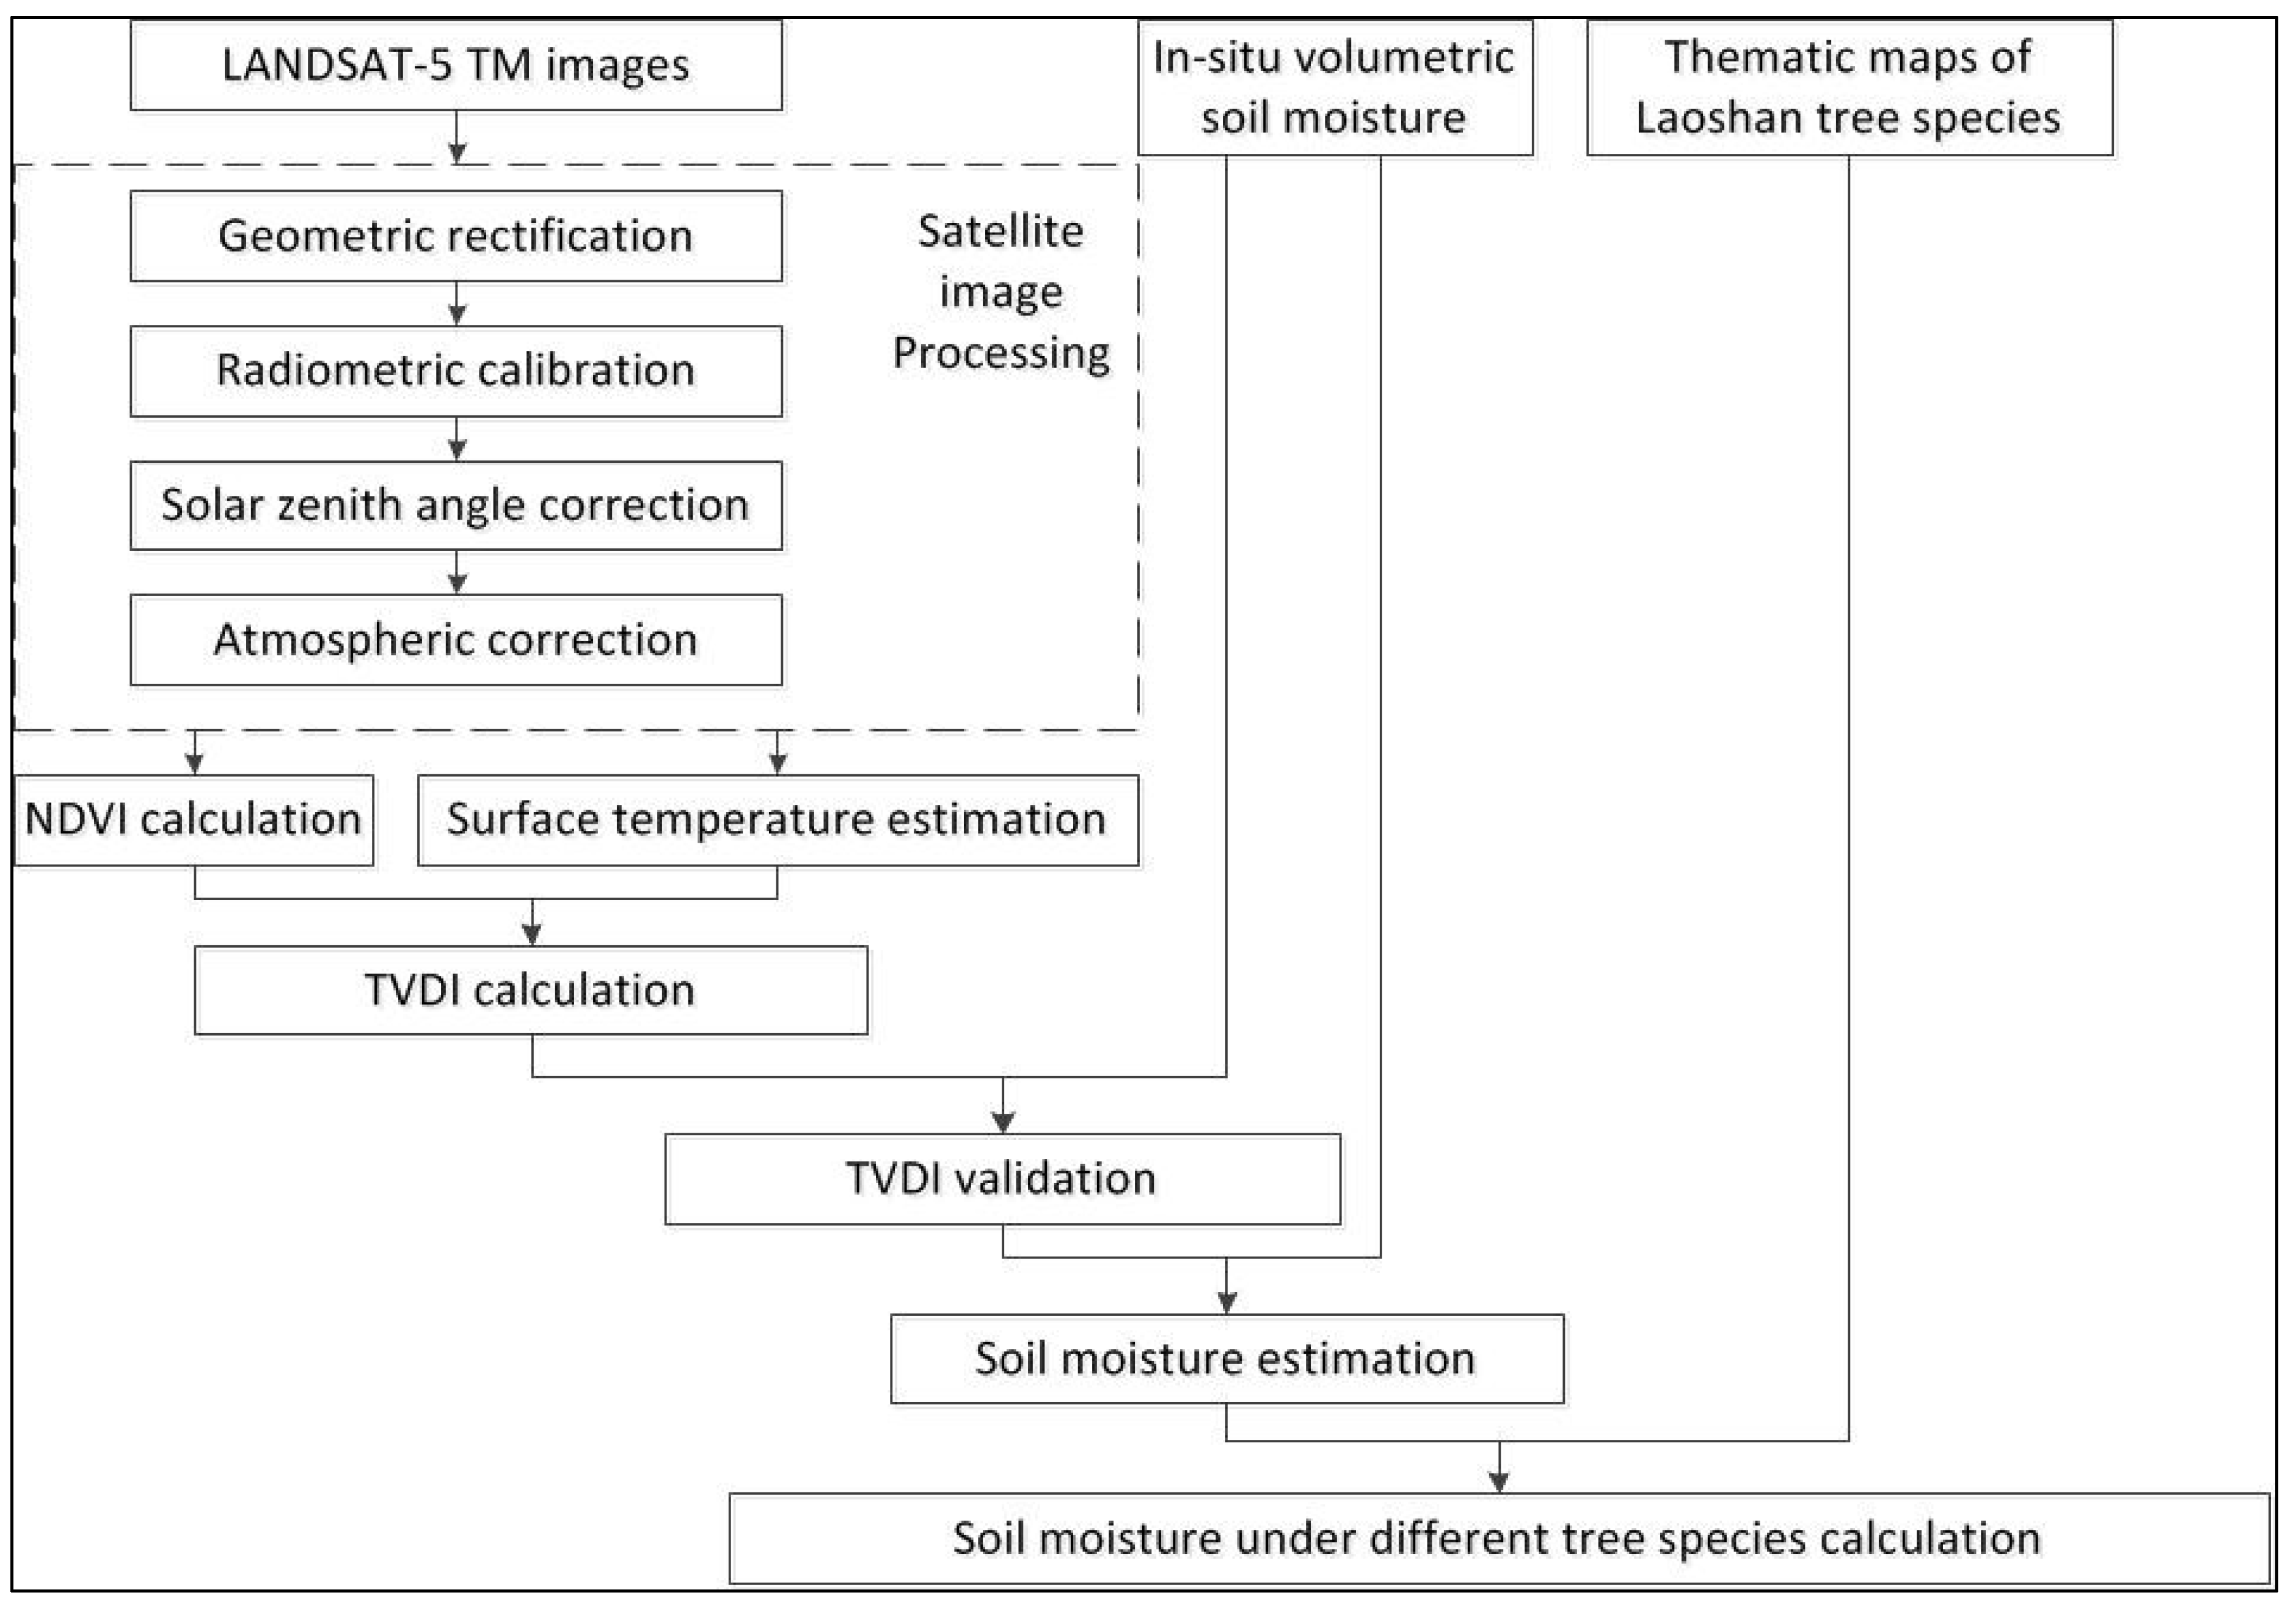
3.2. Satellite Image Processing
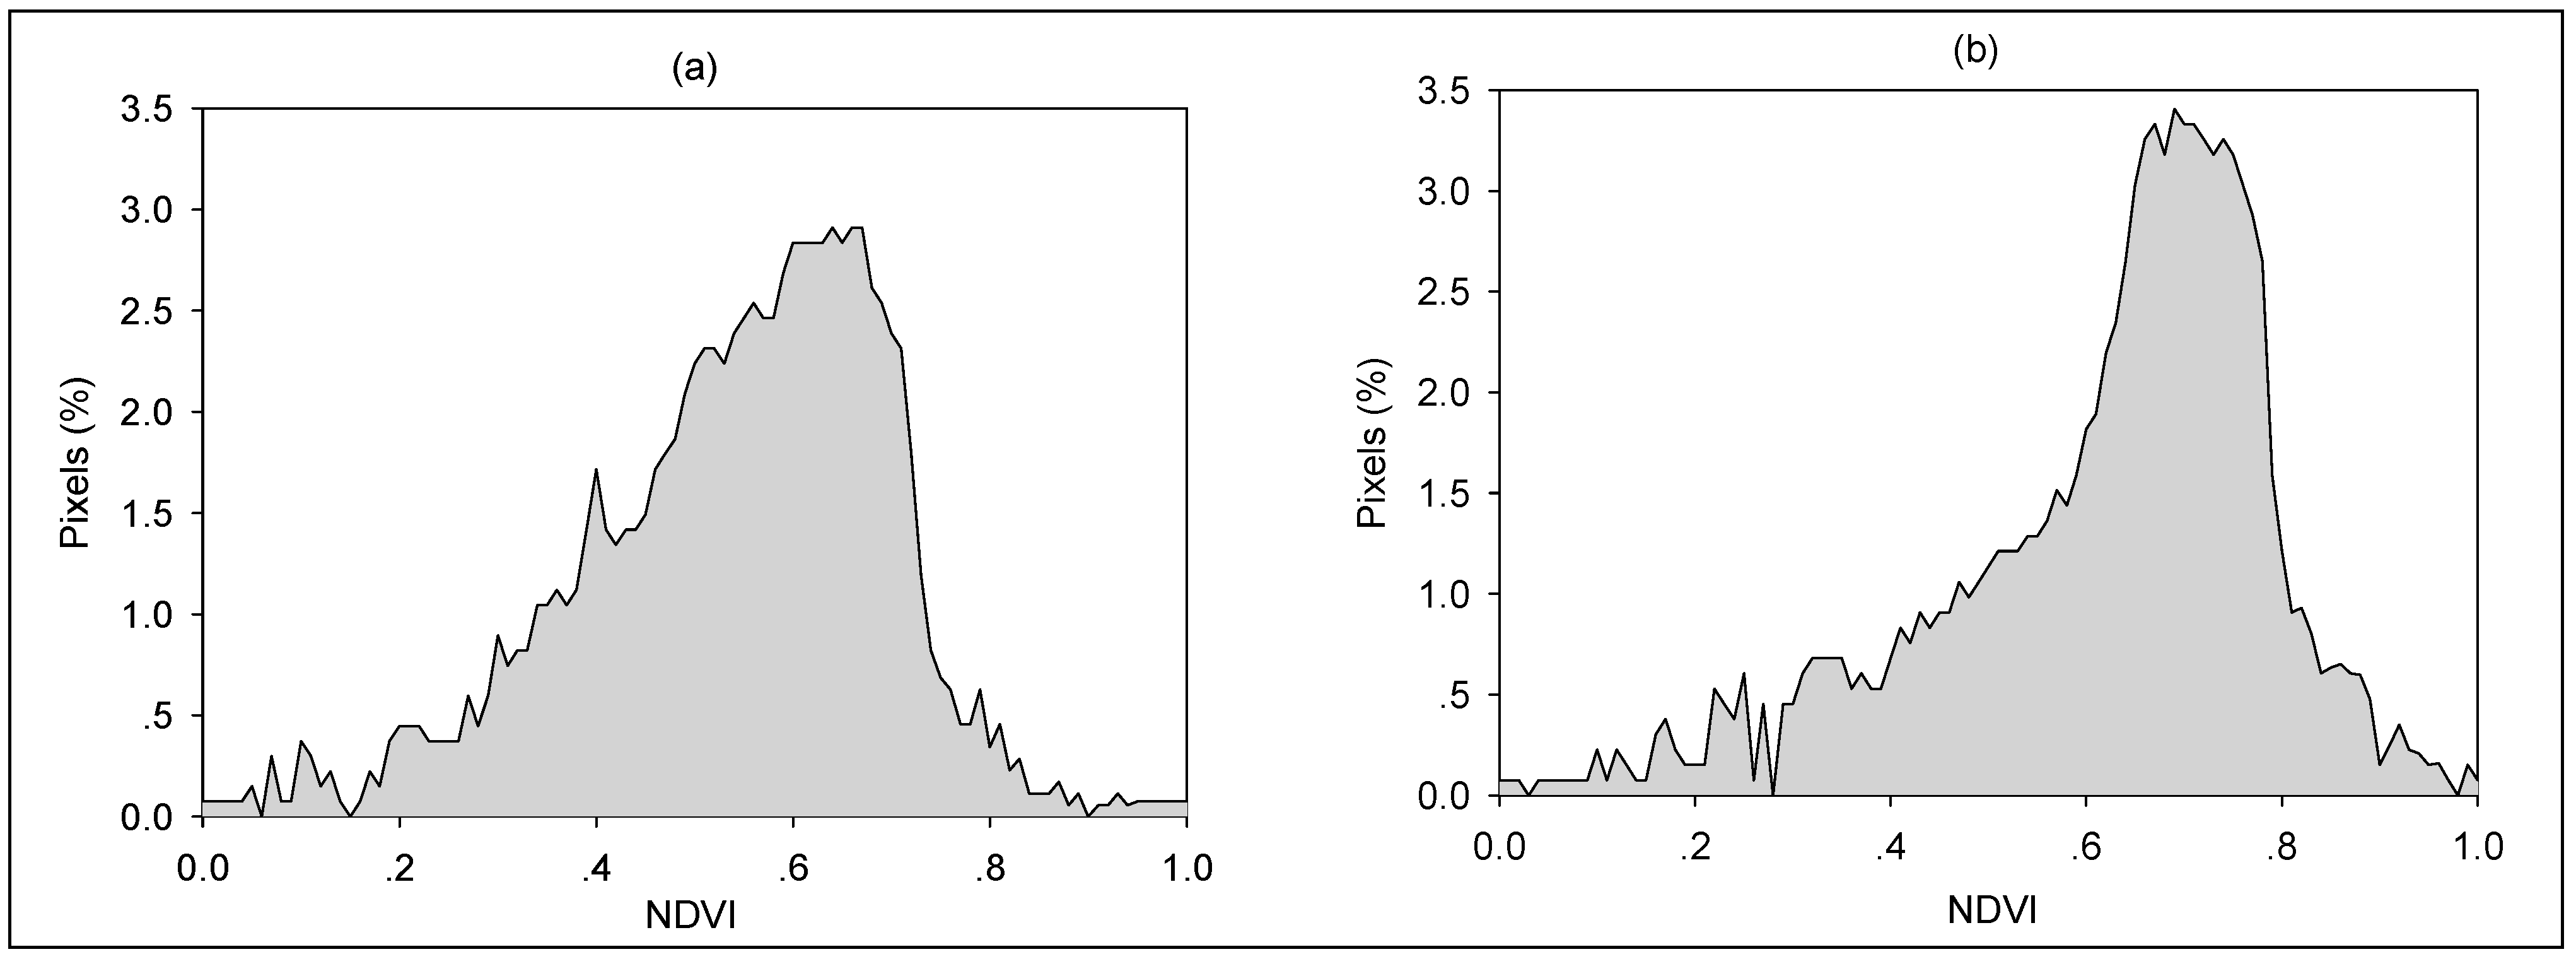
3.3. Calculation of Normalized Difference Vegetation Index
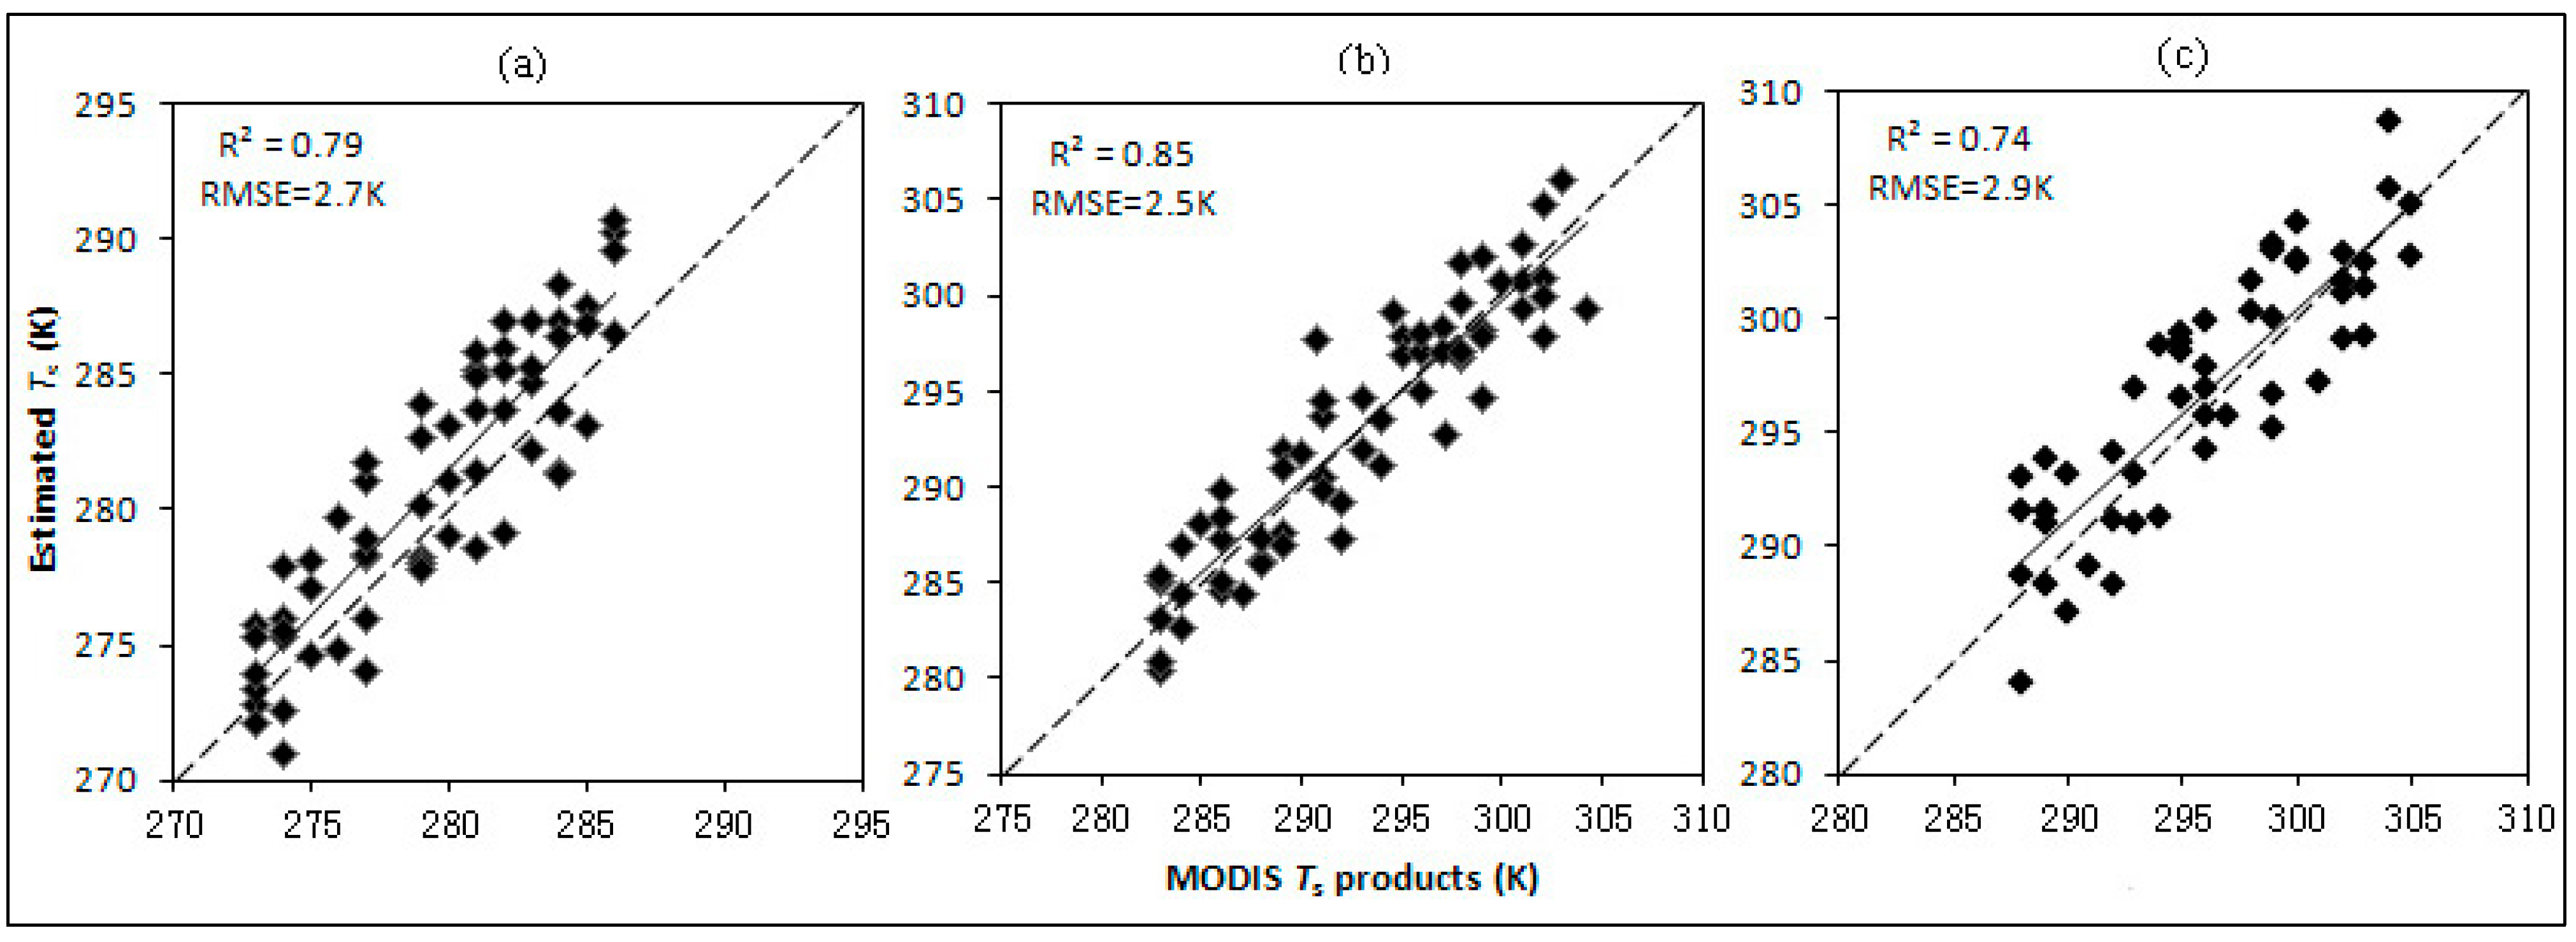
3.4. Retrieval of Surface Temperature (Ts)
3.5. Calculation of Temperature Vegetation Dryness Index

4. Results and Discussion
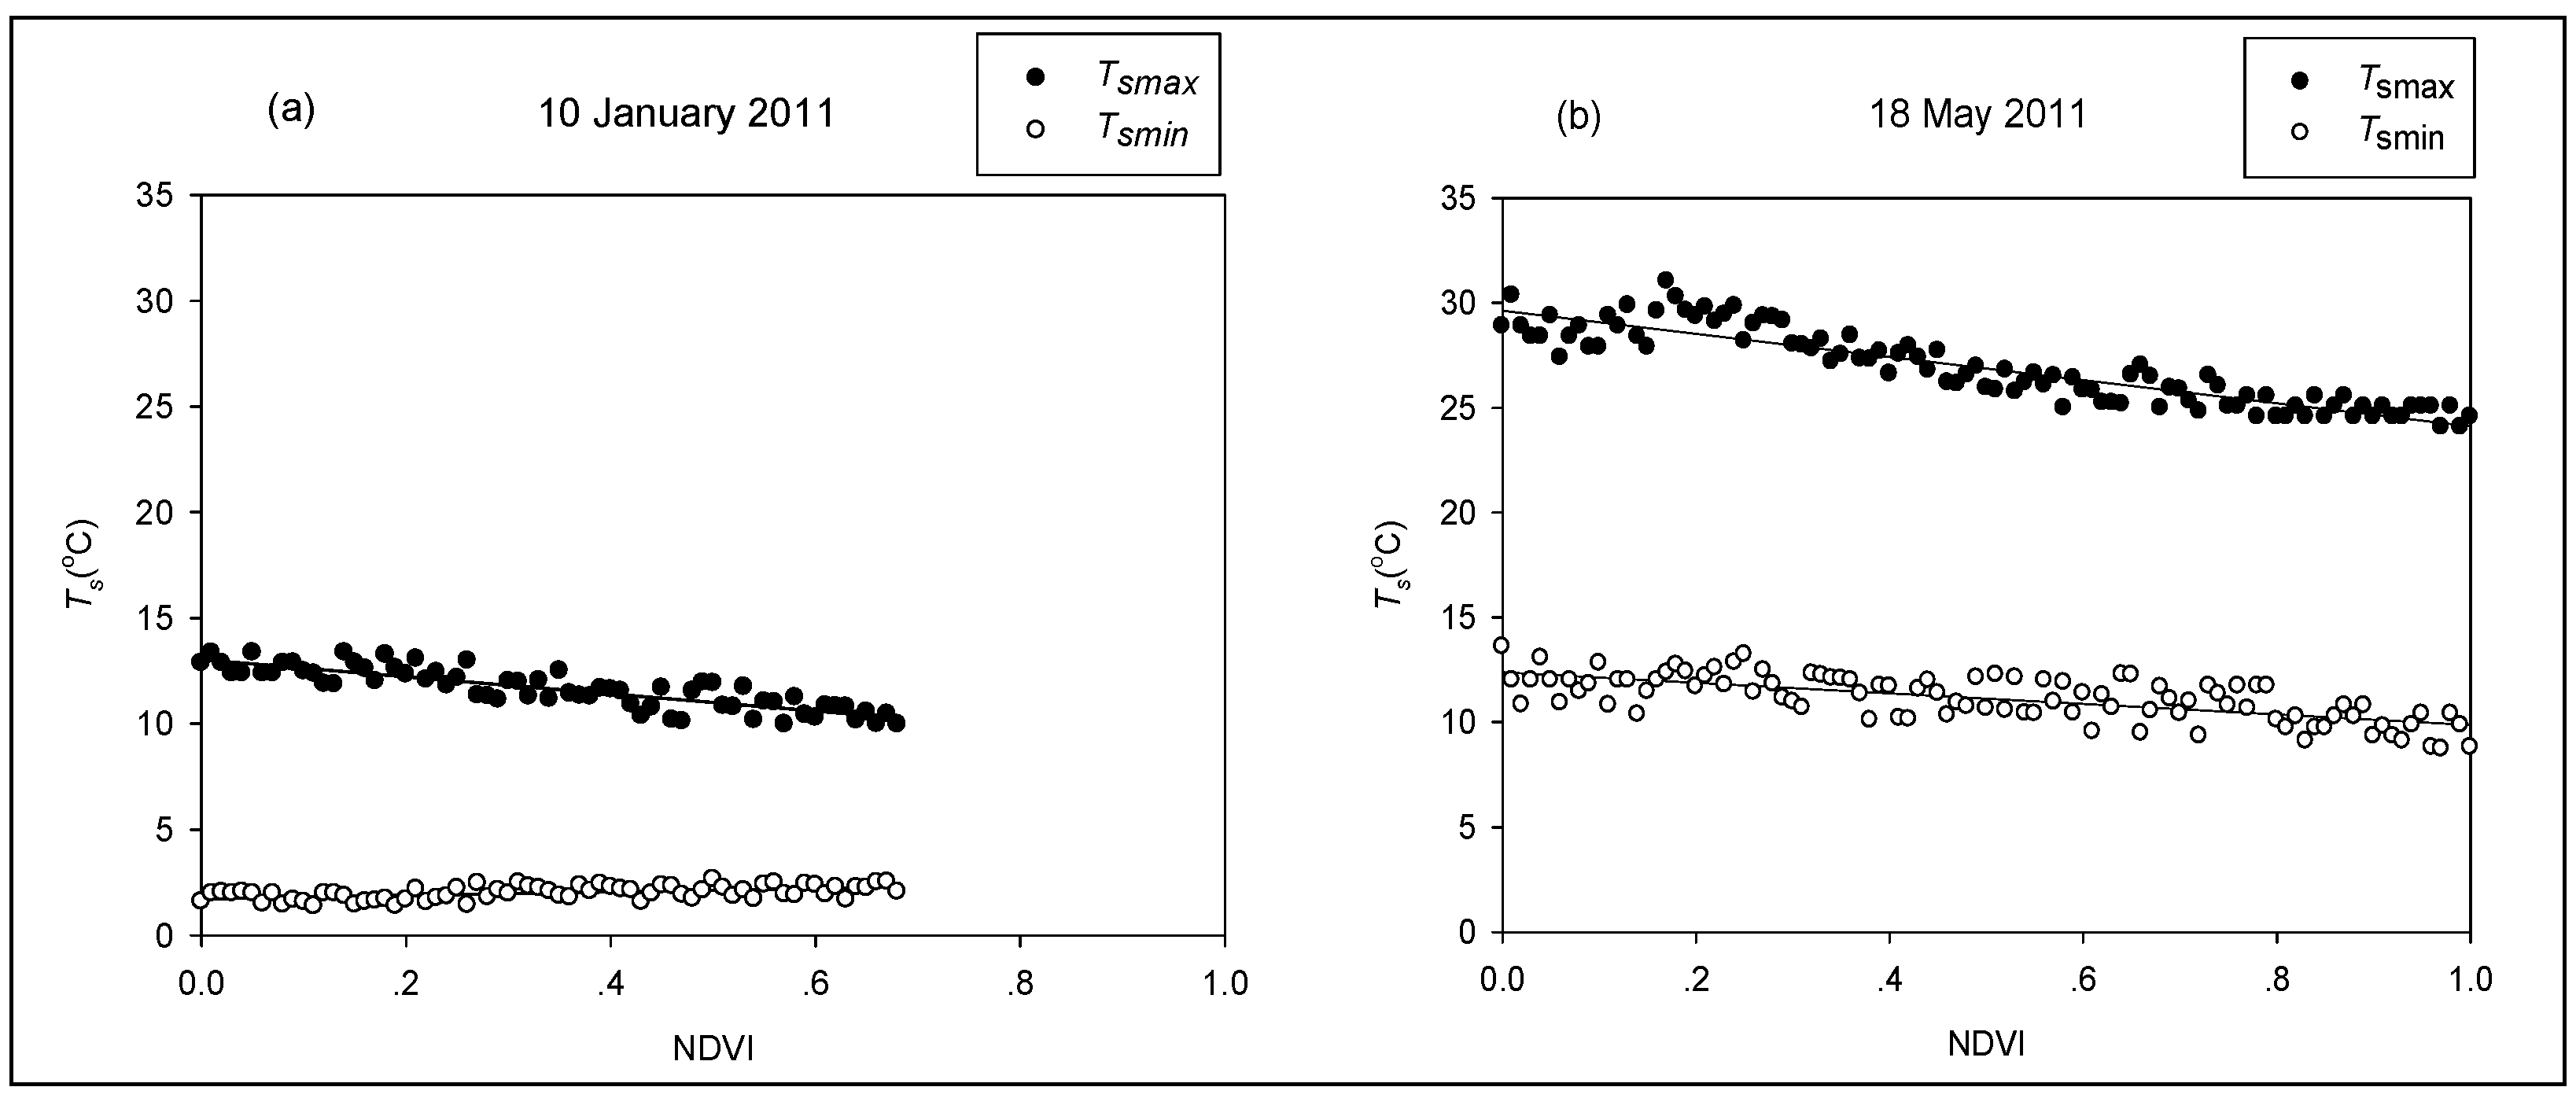
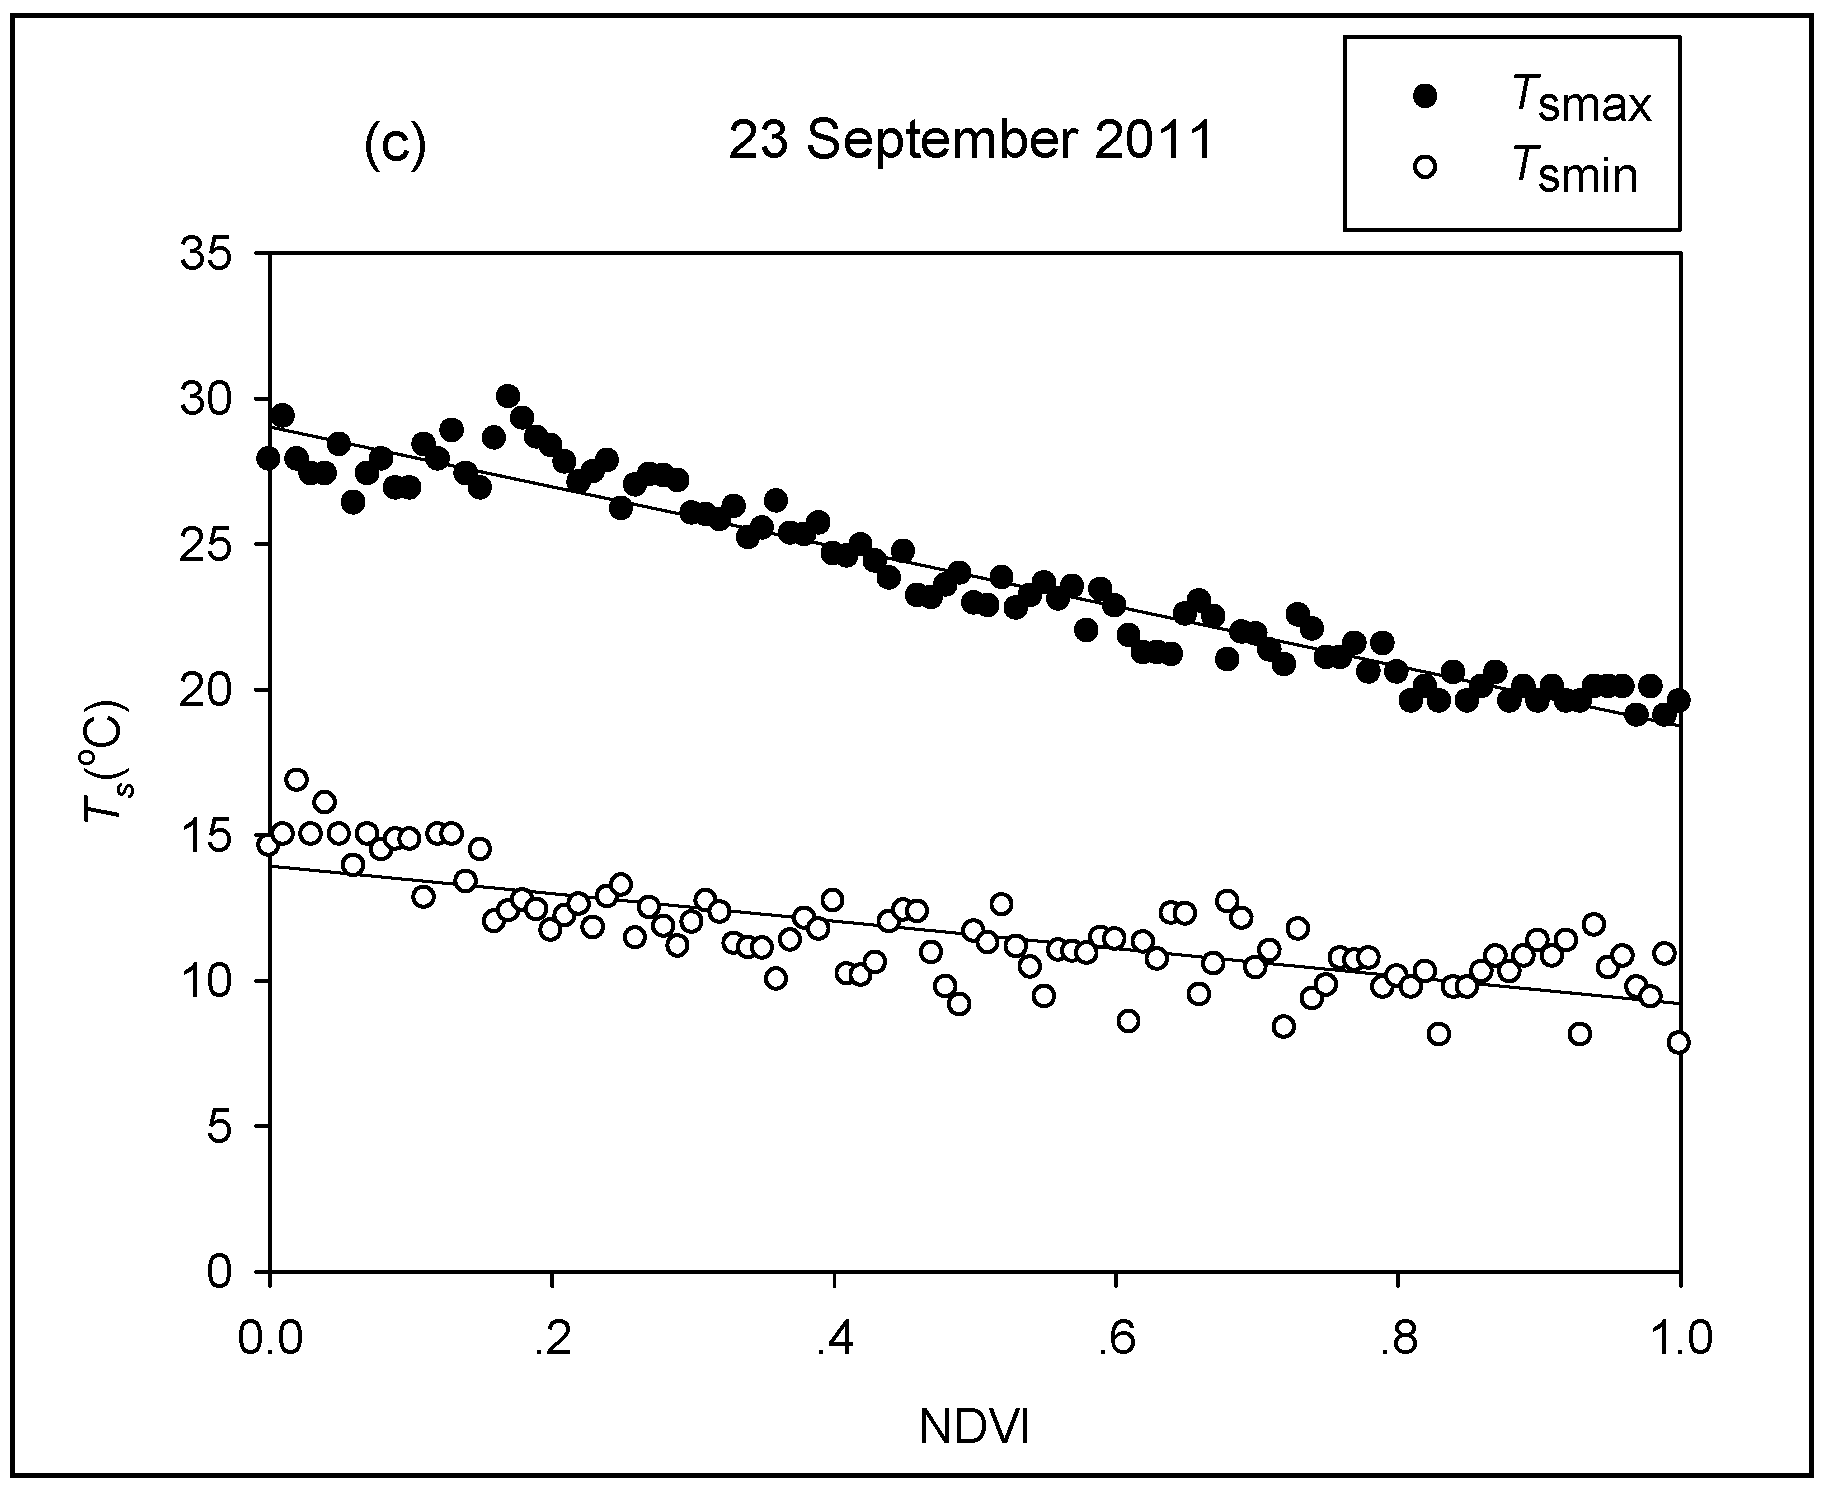
4.1. Analysis of the Ts/NDVI Feature Space
| Date | Dry Edge | Wet Edge |
|---|---|---|
| 10 January 2011 | Tsmax = –4.049 (NDVI) + 13.037 R² = 0.72 | Tsmin = 0.819 (NDVI) + 1.726 R² = 0.26 |
| 18 May 2011 | Tsmax = –5.510 (NDVI) + 29.621 R² = 0.82 | Tsmin = –2.514 (NDVI) + 12.387 R² = 0.46 |
| 23 September 2011 | Tsmax = –10.285 (NDVI) + 29.029 R² = 0.93 | Tsmin = –4.734(NDVI) + 13.942 R² = 0.59 |
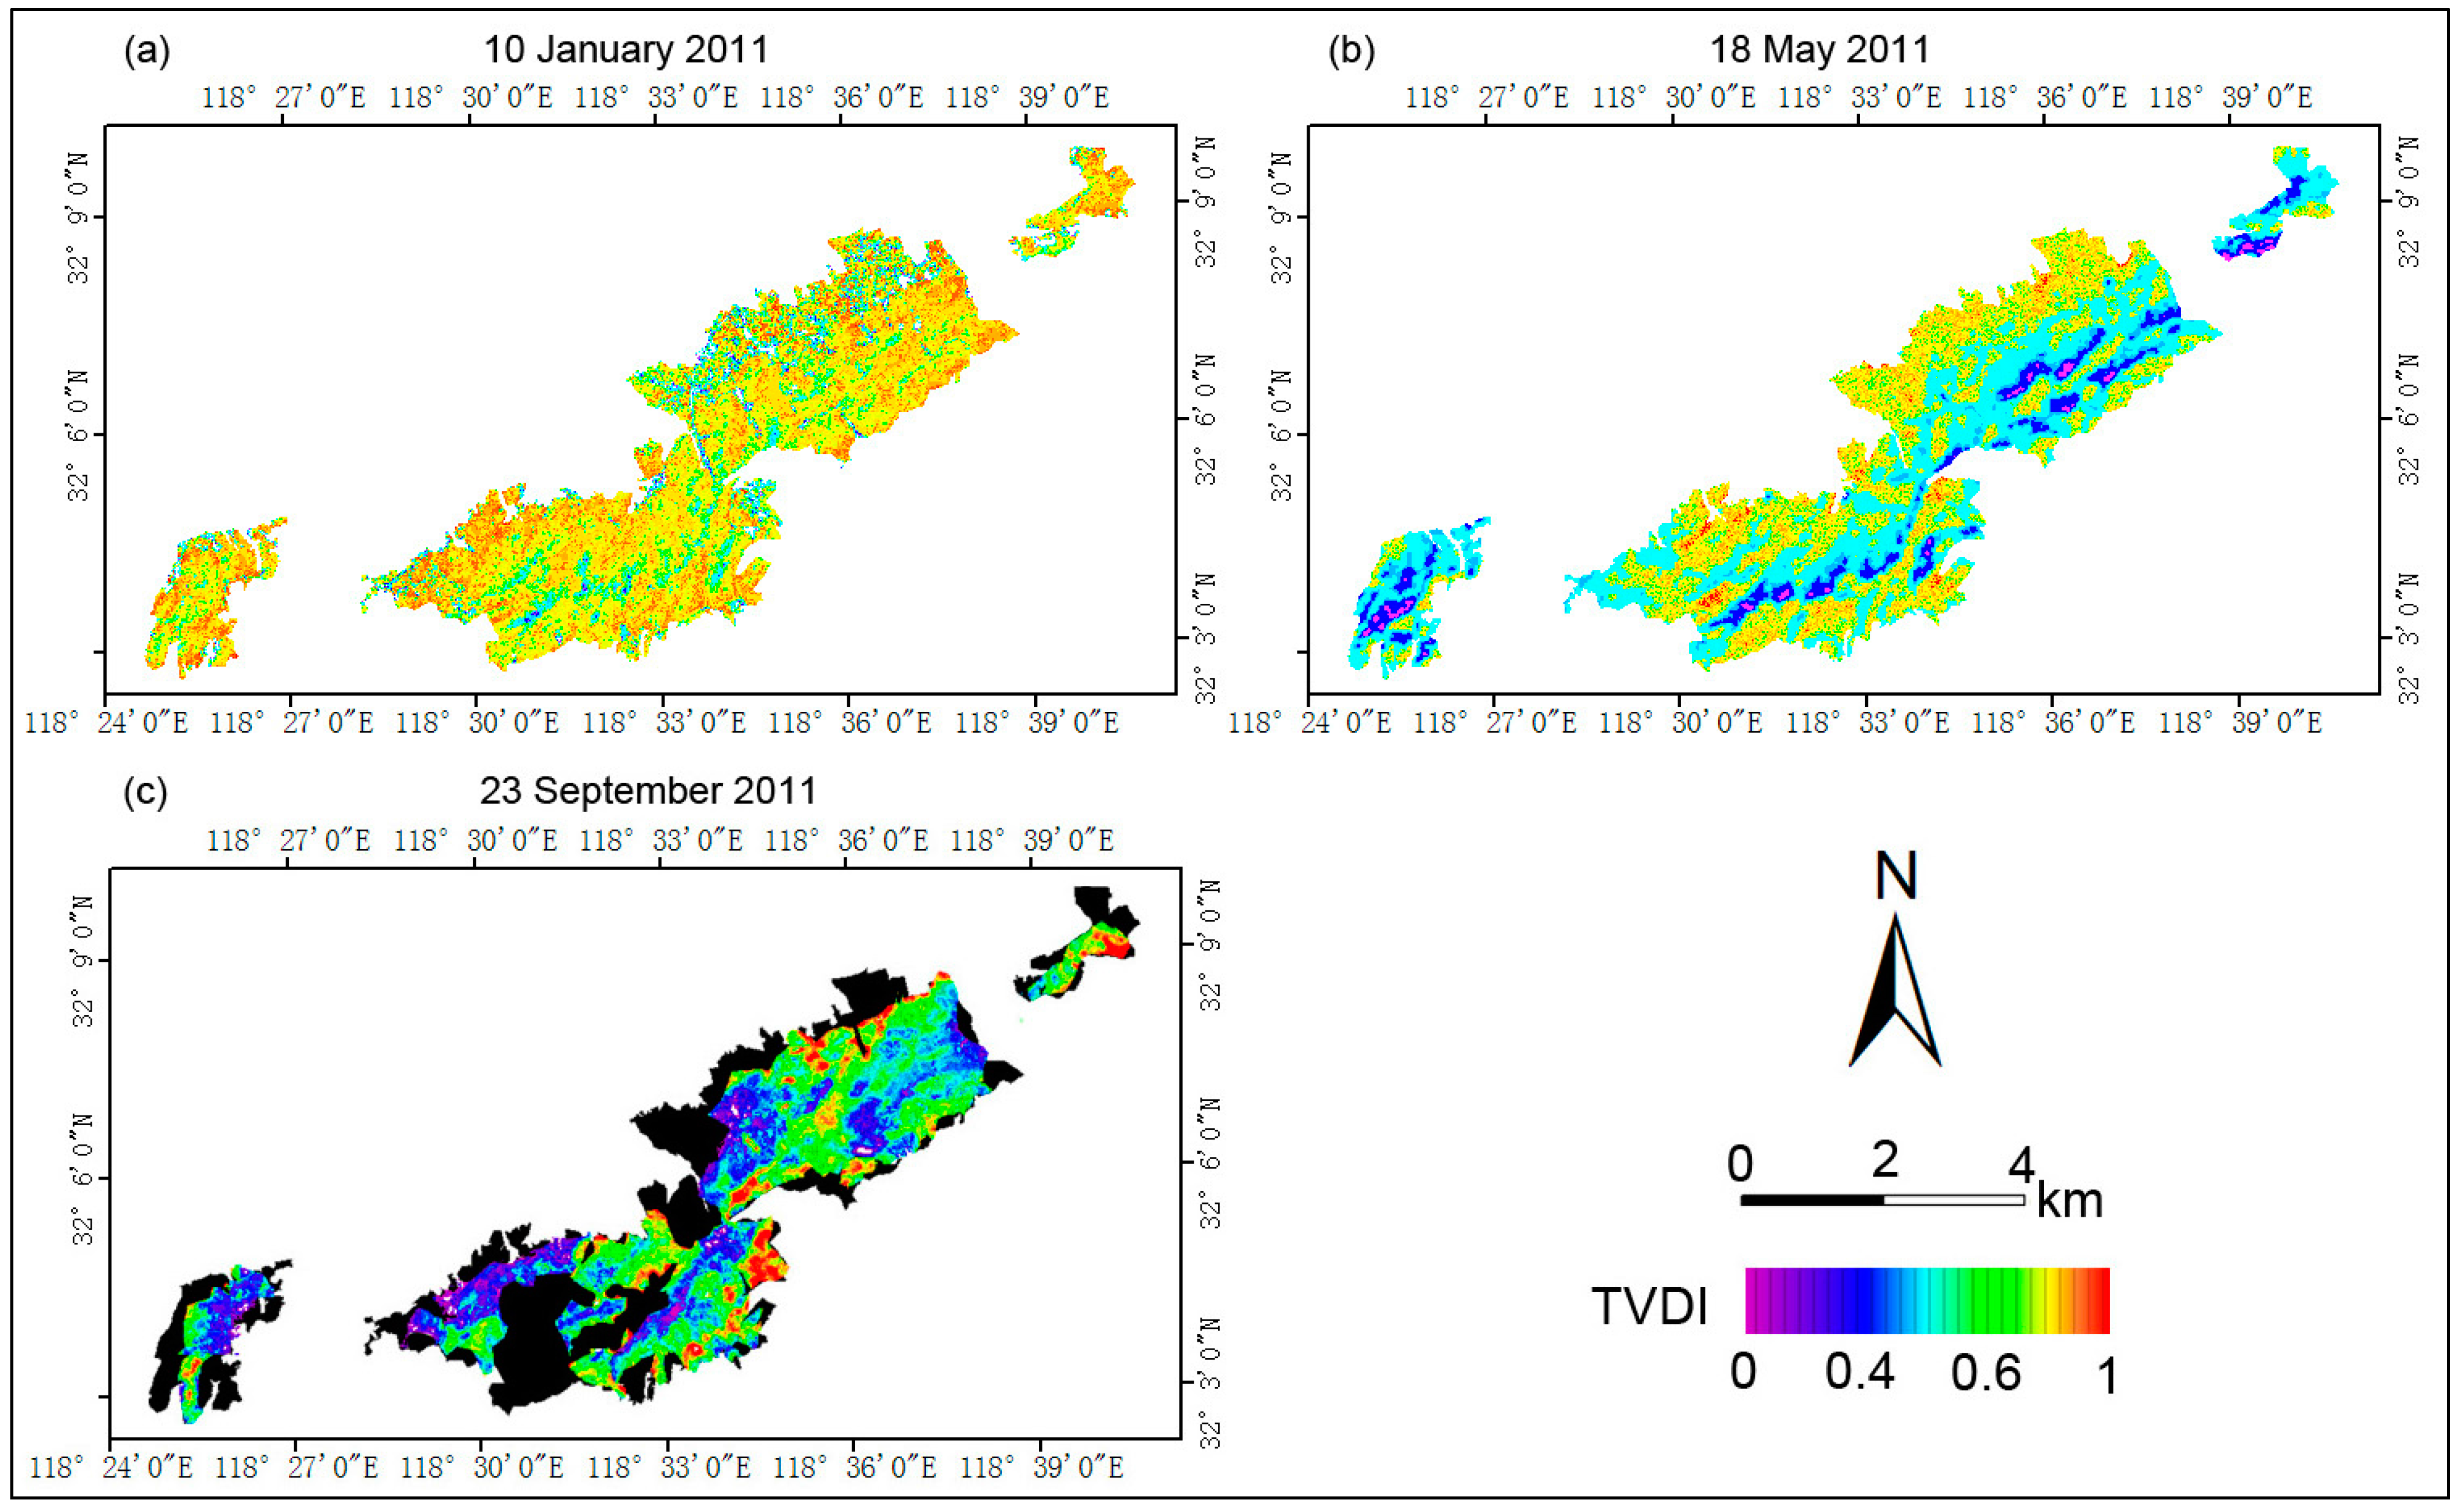
4.2. Spatial Variation of TVDI
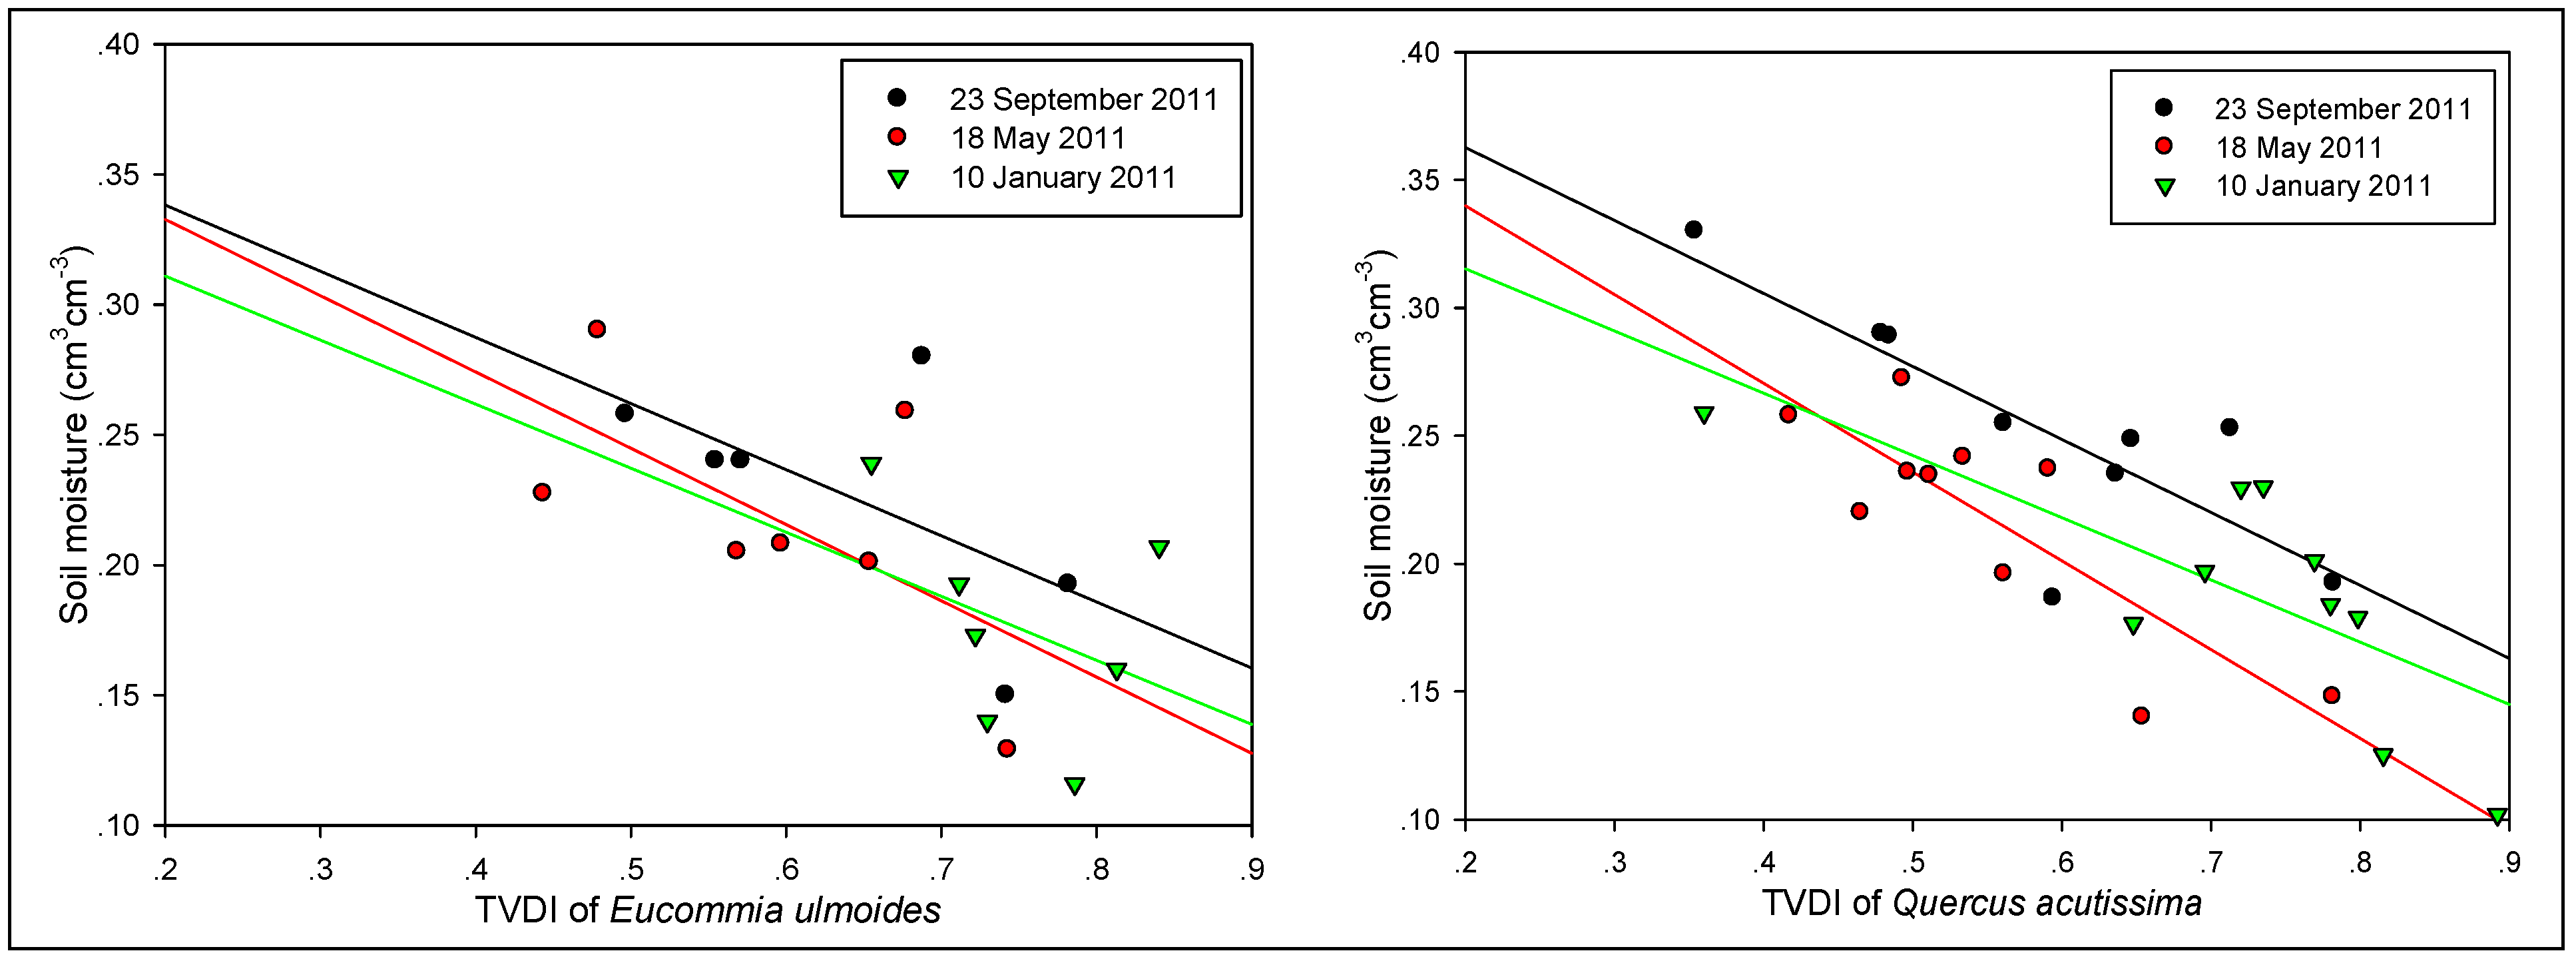
4.3. Comparison of TVDI with In Situ Measurements

| Date | Land Cover Type | e | f | R2 | SE |
|---|---|---|---|---|---|
| 10 January 2011 | Eucommia ulmoides | –0.25 | 0.36 | 0.15 | 0.036 |
| Quercus acutissima | –0.24 | 0.36 | 0.54 | 0.030 | |
| broadleaf mixed forest | –0.29 | 0.42 | 0.34 | 0.033 | |
| Cunninghamia lanceolata | –0.31 | 0.43 | 0.54 | 0.024 | |
| coniferous and broadleaf mixed forest | –0.25 | 0.40 | 0.28 | 0.038 | |
| Pinus massoniana | –0.27 | 0.45 | 0.65 | 0.017 | |
| 18 May 2011 | Eucommia ulmoides | –0.29 | 0.39 | 0.38 | 0.037 |
| Quercus acutissima | –0.35 | 0.41 | 0.68 | 0.024 | |
| broadleaf mixed forest | –0.30 | 0.41 | 0.58 | 0.031 | |
| Cunninghamia lanceolata | –0.26 | 0.40 | 0.29 | 0.041 | |
| coniferous and broadleaf mixed forest | –0.30 | 0.41 | 0.47 | 0.034 | |
| Pinus massoniana | –0.38 | 0.47 | 0.79 | 0.023 | |
| 23 September 2011 | Eucommia ulmoides | –0.25 | 0.39 | 0.38 | 0.034 |
| Quercus acutissima | –0.29 | 0.42 | 0.66 | 0.026 | |
| broadleaf mixed forest | –0.28 | 0.41 | 0.46 | 0.026 | |
| Cunninghamia lanceolata | –0.29 | 0.44 | 0.36 | 0.023 | |
| coniferous and broadleaf mixed forest | –0.45 | 0.48 | 0.80 | 0.015 | |
| Pinus massoniana | –0.25 | 0.44 | 0.53 | 0.027 |

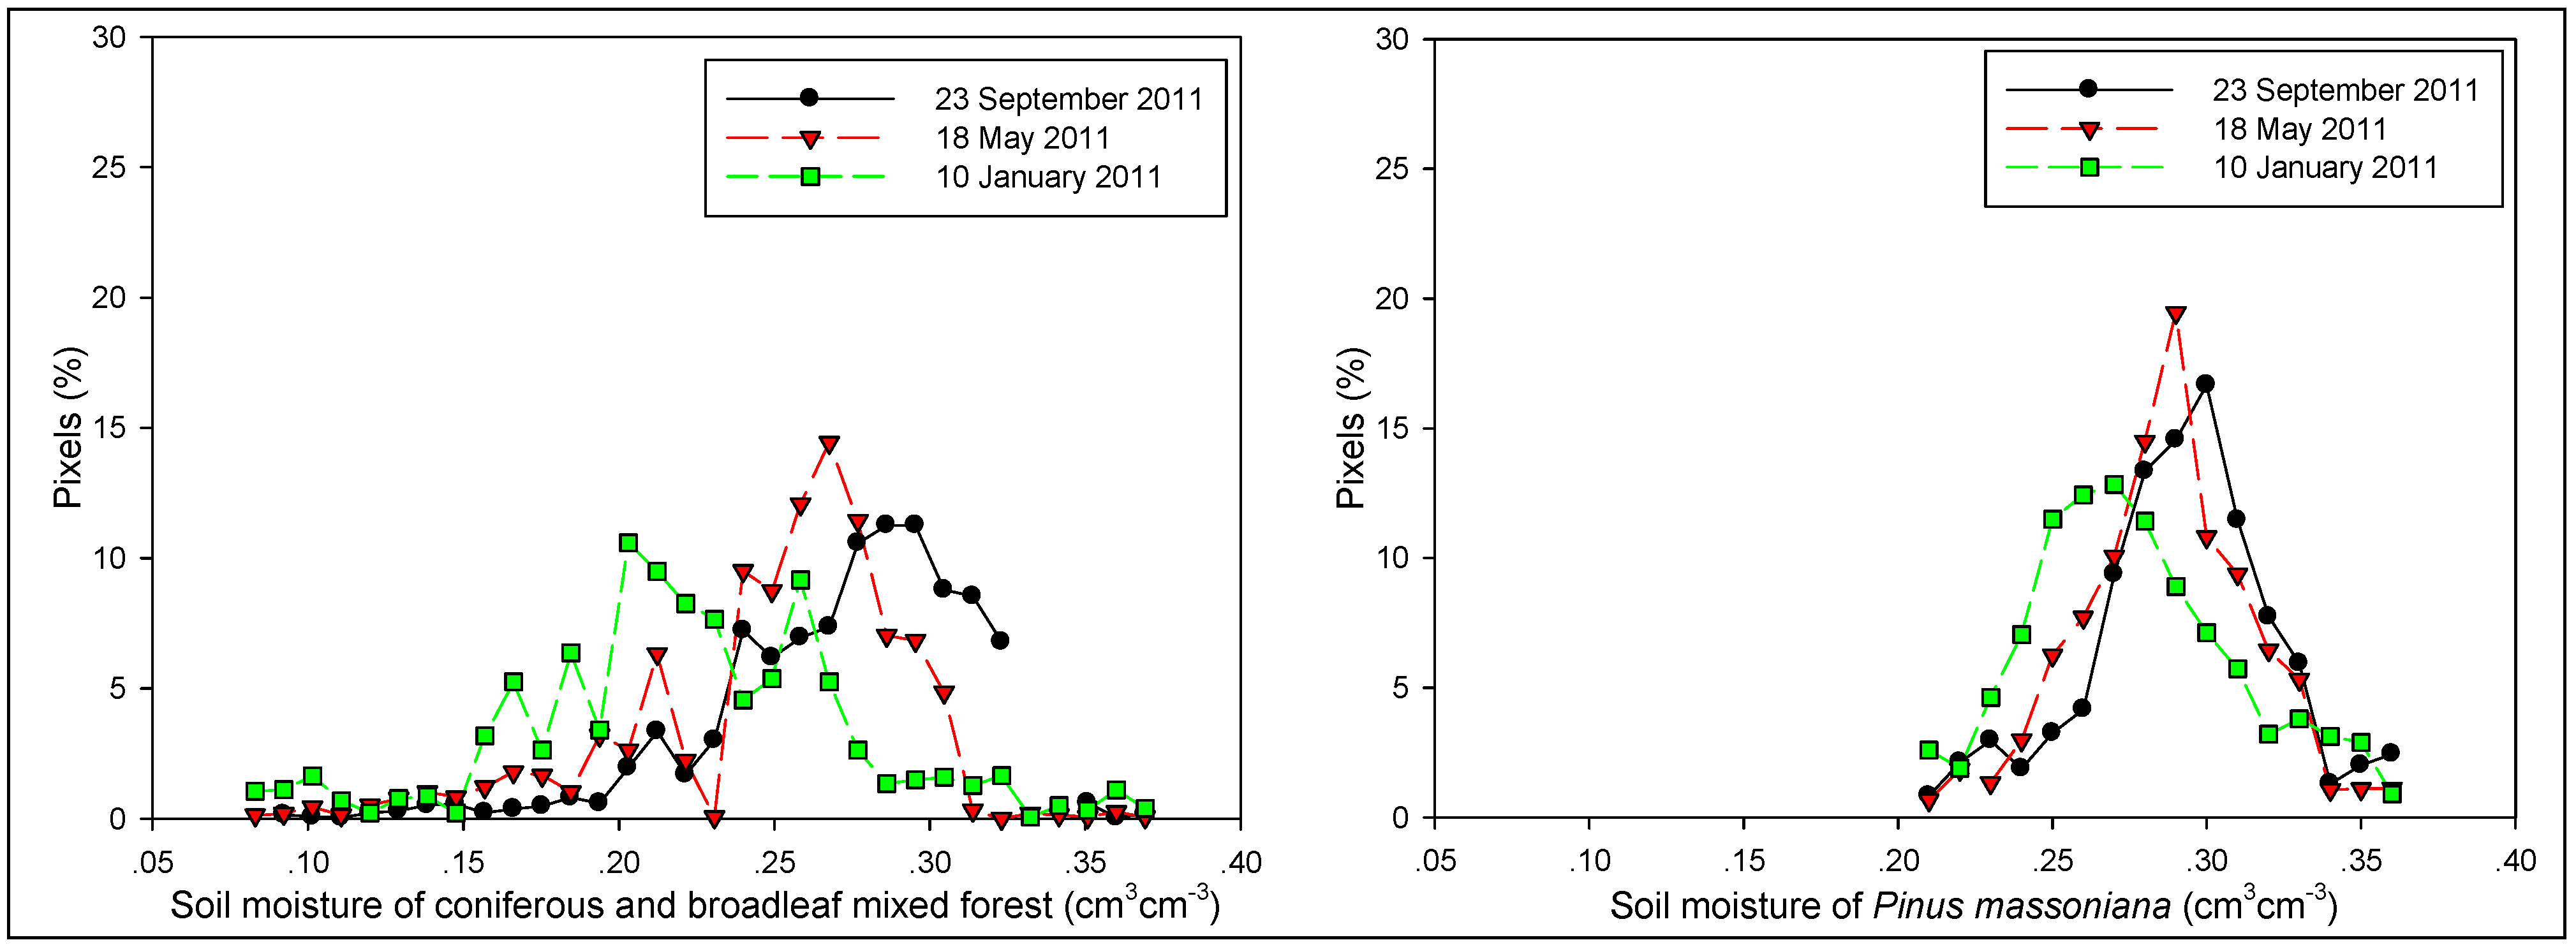
4.4. Soil Moisture under Different Types of Land Cover

| Types | 10 January 2011 | 18 May 2011 | 23 September 2011 | |||
|---|---|---|---|---|---|---|
| Mean | Variance | Mean | Variance | Mean | Variance | |
| Eucommia ulmoides | 0.2072 | 0.0010 | 0.2149 | 0.0011 | 0.2247 | 0.0014 |
| Quercus acutissima | 0.2130 | 0.0004 | 0.2167 | 0.0009 | 0.2198 | 0.0007 |
| broadleaf mixed forest | 0.2154 | 0.0012 | 0.2360 | 0.0018 | 0.2448 | 0.0015 |
| Cunninghamia lanceolata | 0.2322 | 0.0017 | 0.2408 | 0.0014 | 0.2454 | 0.0012 |
| coniferous and broadleaf mixed forest | 0.2539 | 0.0032 | 0.2701 | 0.0022 | 0.2886 | 0.0016 |
| Pinus massoniana | 0.2745 | 0.0009 | 0.2869 | 0.0007 | 0.2917 | 0.0006 |
5. Conclusions
Acknowledgments
Author Contributions
Conflicts of Interest
References
- Seneviratne, S.I.; Corti, T.; Davin, E.L.; Hirschi, M.; Jaeger, E.B.; Lehner, I.; Orlowsky, B.; Teuling, A.J. Investigating soil moisture—Climate interactions in a changing climate: A review. Earth-Sci. Rev. 2010, 99, 125–161. [Google Scholar] [CrossRef]
- Mathys, A.; Coops, N.C.; Waring, R.H. Soil water availability effects on the distribution of 20 tree species in western North America. Forest Ecol. Manag. 2014, 313, 144–152. [Google Scholar] [CrossRef]
- Wu, Y.M. Challenges and countermeasures of water resources in the process of urbanization. Jiangsu Water Resour. 2003, 5, 29–30. (In Chinese) [Google Scholar]
- Skierucha, W.; Wilczek, A. A FDR sensor for measuring complex soil dielectric permittivity in the 10–500 MHz frequency range. Sensors 2010, 10, 3314–3329. [Google Scholar] [CrossRef] [PubMed]
- Skierucha, W.; Wilczek, A.; Szypłowska, A.; Sławiński, C.; Lamorski, K. A TDR-based soil moisture monitoring system with simultaneous measurement of soil temperature and electrical conductivity. Sensors 2012, 12, 13545–13566. [Google Scholar] [CrossRef] [PubMed]
- Grayson, R.B.; Western, A.W. Towards areal estimation of soil water content from point measurement: Time and space stability of mean response. J. Hydrol. 1998, 207, 68–82. [Google Scholar] [CrossRef]
- Patel, N.R.; Anapashsha, R.; Kumar, S.; Saha, S.K.; Dadhwal, V.K. Assessing potential of MODIS derived temperature/vegetation condition index (TVDI) to infer soil moisture status. Int. J. Remote Sens. 2009, 30, 23–39. [Google Scholar] [CrossRef]
- Chen, S.L.; Liu, Y.B.; Wen, Z.M. Satellite retrieval of soil moisture: An overview. Adv. Earth Sci. 2012, 27, 1192–1203. (In Chinese) [Google Scholar]
- Goetz, S.J. Multi-sensor analysis of NDVI, surface temperature and biophysical variables at a mixed grassland site. Int. J. Remote Sens. 1997, 18, 71–94. [Google Scholar] [CrossRef]
- Sandholt, I.; Rasmussen, K.; Andersen, J. A simple interpretation of the surface temperature vegetation index space for assessment of surface moisture status. Remote Sens. Environ. 2002, 79, 213–224. [Google Scholar] [CrossRef]
- Goward, S.N.; Xue, Y.K.; Czajkowski, K.P. Evaluating land surface moisture conditions from the remotely sensed temperature/vegetation index measurements: An exploration with the simplified simple biosphere model. Remote Sens. Environ. 2002, 79, 225–242. [Google Scholar] [CrossRef]
- Friedl, M.A.; Davis, F.W. Sources of variation in radiometric surface temperature over a tallgrass prairie. Remote Sens. Environ. 1994, 48, 1–17. [Google Scholar] [CrossRef]
- Carlson, T.N.; Gillies, R.R.; Perry, E.M. A method to make use of thermal infrared temperature and NDVI measurements to infer surface soil water content and fractional vegetation cover. Remote Sens. 1994, 9, 161–173. [Google Scholar] [CrossRef]
- Moran, M.S.; Clarke, T.R.; Inoue, Y.; Vidal, A. Estimating crop water deficit using the relation between surface–Air temperature and spectral vegetation index. Remote Sens. Environ. 1994, 49, 246–263. [Google Scholar] [CrossRef]
- Xin, J.F.; Tian, G.L.; Liu, Q.H.; Chen, L.F. Combining vegetation index and remotely sensed temperature for estimation of soil moisture in China. Int. J. Remote Sens. 2006, 27, 2071–2075. [Google Scholar] [CrossRef]
- Wang, C.Y.; Qi, S.H.; Niu, Z.; Wang, J.B. Evaluating soil moisture status in China using the temperature–vegetation dryness index (TVDI). Can. J. Remote Sens. 2004, 30, 671–679. [Google Scholar] [CrossRef]
- Holzman, M.E.; Rivas, R.; Piccolo, M.C. Estimating soil moisture and the relationship with crop yield using surface temperature and vegetation index. Int. J. Appl. Earth Obs. 2014, 28, 181–192. [Google Scholar] [CrossRef]
- Zhang, F.; Zhang, L.W.; Shi, J.J.; Huang, J.F. Soil moisture monitoring based on land surface temperature—vegetation index space derived from MODIS data. Pedosphere 2014, 24, 450–460. [Google Scholar] [CrossRef]
- Chen, J.; Wang, C.Z.; Jiang, H.; Mao, L.X.; Yu, Z.R. Estimating soil moisture using Temperature—Vegetation Dryness Index (TVDI) in the Huanghuai-hai (HHH) plain. Int. J. Remote Sens. 2011, 32, 1165–1177. [Google Scholar] [CrossRef]
- Rahimzadeh-bajgiran, P.; Omasa, K.; Shimizu, Y. Comparative evaluation of the Vegetation Dryness Index (VDI), the Temperature Vegetation Dryness Index (TVDI) and the improved TVDI (iTVDI) for water stress detection in semi-arid regions of Iran. ISPRS J. Photogramm. 2012, 68, 1–12. [Google Scholar] [CrossRef]
- Gao, Z.Q.; Gao, W.; Chang, N.B. Integrating temperature vegetation dryness index (TVDI) and regional water stress index (RWSI) for drought assessment with the aid of LANDSAT TM/ETM+ images. Int. J. Appl. Earth Obs. 2011, 13, 495–503. [Google Scholar] [CrossRef]
- Luan, H.J.; Tian, Q.J.; Yu, T.; Hu, X.L.; Huang, Y.; Du, L.T.; Zhao, L.M.; Wen, X.; Han, J.; Zhang, Z.W.; et al. Modeling continuous scaling of NDVI based on fractal theory. Spectrosc. Spect. Anal. 2013, 33, 1857–1862. (In Chinese) [Google Scholar]
- Sun, L.; Sun, R.; Li, X.; Liang, S.; Zhang, R. Monitoring surface soil moisture status based on remotely sensed surface temperature and vegetation index information. Agr. Forest Meteorol. 2012, 166, 175–187. [Google Scholar] [CrossRef]
- Mallick, K.; Bhattacharya, B.K.; Patel, N.K. Estimating volumetric surface moisture content for cropped soils using a soil wetness index based on surface temperature and NDVI. Agr. Forest Meteorol. 2009, 149, 1327–1342. [Google Scholar] [CrossRef]
- Chander, G.; Markham, B.L.; Helder, D.L. Summary of current radiometric calibration coefficients for Landsat MSS, TM, ETM+, and EO-1 ALI sensors. Remote Sens. Environ. 2009, 113, 893–903. [Google Scholar] [CrossRef]
- French, A.N.; Norman, J.M.; Anderson, M.C. A simple and fast atmospheric correction for spaceborne remote sensing of surface temperature. Remote Sens. Environ. 2003, 87, 326–333. [Google Scholar] [CrossRef]
- Qin, Z.; Karnieli, A.; Berliner, P. A mono-window algorithm for retrieving land surface temperature from Landsat TM data and its application to the Israel-Egypt border region. Int. J. Remote Sens. 2001, 22, 3719–3746. [Google Scholar] [CrossRef]
- Sobrino, J.A.; Jimnéez-muñoz, J.C.; Panolini, L. Land surface temperature retrieval from LANDSAT TM 5. Remote Sens. Environ. 2004, 90, 434–440. [Google Scholar] [CrossRef]
- Xiao, R.B.; Weng, Q.H.; Ouyang, Z.Y.; Li, W.F.; Schienke, E.W.; Zhang, Z.M. Land surface temperature variation and major factors in beijing, China. Photogramm. Eng. Rem. S. 2008, 74, 451–461. [Google Scholar] [CrossRef]
- Wang, F.; Qin, Z.H.; Song, C.Y.; Tu, L.L.; Karnieli, A.; Zhao, S.H. An improved mono-window algorithm for land surface temperature retrieval from landsat 8 thermal infrared sensor data. Remote Sens. 2015, 7, 4268–4289. [Google Scholar] [CrossRef]
- Duan, Y.; Wang, W.; Cai, X.J. Applied analyses on Palmer, SPEI and CI Indices of drought process in Yangtze-Huaihe River Basins during winter of 2010/spring of 2011. Plateau Meteorol. 2013, 32, 1126–1139. (In Chinese) [Google Scholar]
- Pollacco, J.A.P. A generally applicable pedotransfer function that estimates field capacity and permanent wilting point from soil texture and bulk density. Can. J. Soil Sci. 2008, 88, 761–774. [Google Scholar] [CrossRef]
- Paul, K.I.; Polglase, P.J.; O’Connell, A.M.; Carlyle, J.C.; Smethurst, P.J.; Khanna, P.K.; Worledge, D. Soil water under forests (SWUF): A model of water flow and soil water content under a range of forest types. Forest Ecol. Manag. 2003, 182, 195–211. [Google Scholar] [CrossRef]
© 2015 by the authors; licensee MDPI, Basel, Switzerland. This article is an open access article distributed under the terms and conditions of the Creative Commons Attribution license (http://creativecommons.org/licenses/by/4.0/).
Share and Cite
Chen, S.; Wen, Z.; Jiang, H.; Zhao, Q.; Zhang, X.; Chen, Y. Temperature Vegetation Dryness Index Estimation of Soil Moisture under Different Tree Species. Sustainability 2015, 7, 11401-11417. https://doi.org/10.3390/su70911401
Chen S, Wen Z, Jiang H, Zhao Q, Zhang X, Chen Y. Temperature Vegetation Dryness Index Estimation of Soil Moisture under Different Tree Species. Sustainability. 2015; 7(9):11401-11417. https://doi.org/10.3390/su70911401
Chicago/Turabian StyleChen, Shulin, Zuomin Wen, Hong Jiang, Qingjian Zhao, Xiuying Zhang, and Yan Chen. 2015. "Temperature Vegetation Dryness Index Estimation of Soil Moisture under Different Tree Species" Sustainability 7, no. 9: 11401-11417. https://doi.org/10.3390/su70911401