1. Introduction
Walking travel had been steadily declining across U.S. cities during the automobile era. Census journey-to-work data show declining rates of walking and transit use, and as recently as 1990, walking was regarded as a forgotten mode [
1,
2]. Yet urbanists continued to argue that walking is central to the life of cities [
3], and planners struggled to develop effective strategies for incentivizing walking travel. Now, after years of advocacy, painstaking research, and many innovative planning-policy experiments, it appears that much of the U.S. is in the midst of a “walking renaissance”. Once considered a “car capital” of the world, the greater Los Angeles area is transitioning from an auto-centric to a multi-modal metropolis, aided by public transit investments, transit-oriented (re)development policies, downtown revitalization projects, and a renewed interest in alternative, more sustainable transportation including walking, bicycling, and transit use [
4,
5,
6]. Downtown populations are rebounding in L.A. and many other U.S. cities, and even suburban downtowns are transitioning from auto-oriented to pedestrian and transit focused mixed use centers [
7,
8,
9].
Walking is important in cities for reducing automobile use, and promoting public health through increased physical activity [
10,
11,
12,
13,
14,
15]. It is critical not only as a stand-alone mode, but also as the gateway mode to public transit. But retrofitting an expansive auto-oriented region into a multimodal one that facilitates walking travel is challenging. Trends in walking travel as it relates to transit supply and density at the metropolitan scale have been seldom studied and remain poorly understood. Hence, the primary topic of investigation in this study is whether and how demographic changes and transit investments have impacted walking trip shares and rates across a large and diverse metropolitan region. The findings from this research would guide strategic planning and forecasting at the regional level, and provide insights and lessons for other traditionally auto-oriented cities that are seeking to promote more sustainable transportation modes through land use changes and transportation investments. The research is also expected to offer ideas for cities in developing countries to deal with and reverse the current trend of unprecedented increase in auto ownership and use, and improve overall quality of life.
Household travel survey information from the 2001 regional travel survey conducted by the Southern California Association of Governments (SCAG) and the California add-on sample of the 2009 National Household Travel Survey (NHTS) are used to analyze trends in walking travel across 46 Regional Statistical Areas (RSAs) spread over five counties within the greater Los Angeles region. The first part of the analysis describes changes in aggregate walking trip shares and rates (with and without considering access/egress trips to transit as observations) at the RSA level, and at the county level over the 2001–2009 period. The second part of the analysis employs a fixed-effects regressions approach to investigate potential determinants of observed changes in selected walking travel measures. To foreshadow briefly, the results show that virtually every part of the greater Los Angeles metropolitan area experienced increases in walking trip shares and rates; further, these increases were positively associated with population density. Additionally, bus and rail transit investments appear to have significantly contributed to increases in walking travel to and from transit stations.
The rest of the paper is organized as follows: First, a literature review provides an overview of recent studies on walking travel using NHTS data, how transit is related to walking, and how our study addresses existing knowledge gaps. Second, the study area, data, and variables are described. Third, walking trip shares and rates (with and without access/egress trips to transit) are compared across 46 RSAs in the greater Los Angeles area from 2001 to 2009, followed by an examination of changes in walking trip trends across the five counties that comprise the Los Angeles Combined Statistical Area (CSA) as defined by the U.S. Census. Fourth, factors that could explain observed trends in walking travel in the study area are examined using regression analysis. The final section includes a discussion of findings and policy implications.
2. Literature Review
Existing studies on walking travel in the U.S. have been conducted at mainly two levels of geography: the local/neighborhood level and the national/state level. There have been numerous empirical studies examining the association between sociodemographic and land use impacts on neighborhood walking travel [
8,
16,
17,
18,
19,
20]. While there are many factors influencing walking behavior, a large literature has shown that population and employment densities are associated with increased pedestrian travel [
8,
9,
10]. Key sociodemographic factors known to influence walking travel include income and age, although race/ethnicity, education, household status, and immigrant status are also cited factors [
21,
22]. Previous studies have also shown that households with children are negatively associated with walking [
20,
21]. These studies have relied primarily on regional travel surveys in addition to Census data, and employ a cross-sectional design and multivariate analysis to examine how sociodemographic and land use factors influence walking travel. At the opposite end of the spatial scale are comparative studies on walking behavior that examine trends at the national level and across metropolitan areas, which have almost exclusively used national transportation data such as the NHTS and the Census.
Several studies on active transport have relied on travel data from the NHTS, the largest household travel survey conducted in the U.S. based on the number of sampled households [
23,
24,
25]. Most previous studies employ a cross sectional approach, meaning that the data represents travel patterns at one specific point in time [
26]. Pucher and Renne [
27] use the 2001 NHTS to examine travel behavior across sociodemographic groups, and how income and vehicle ownership influence mode choice. More recently, Pucher and his colleagues examine changes in walking and cycling in the U.S. from 2001–2009 using NHTS data [
28]. Their study was one of the few that examined changes in active transport use, albeit at the national level, and they found that walking trip rates increased slightly while cycling trip rates remained largely unchanged.
The literature is also replete with studies examining public transit travel and the role of transit in creating compact, mixed-use communities [
29,
30,
31]. However, previous research has mostly emphasized the land development impacts of transit and the pedestrian accessibility around transit stations, although there are some recent studies examining the association between transit investments and walking travel [
32,
33,
34,
35]. The literature examining walking to transit stations has focused largely on urban design and walkability factors which affect individual travel mode to transit [
36,
37,
38]. These studies typically fall under the umbrella of built environment and walkability studies based on the 4 D’s—density, diversity, design, and destinations [
39,
40]. For example, Cervero found that a greater mixture of land uses in addition to limited parking supply at the station impacted access mode choice to transit stations [
41]. A similar walking access to transit station study by Loutzenheiser showed that higher density, fewer parking spaces, and proximity to retail centers increased walking trips to stations [
37]. More recent studies examining pedestrian access to transit also support the notion that residents in high urban density areas are more likely to walk to transit stations [
42,
43]. Trend studies examining the integration of non-motorized modes and transit are sparse, with one notable exception of a study examining bicycle access to transit stations [
44]. In sum, studies on transit and walking have examined the potential of transit stations to generate walking trips, either directly through increased walking trips to and from transit stations, or indirectly through densification in terms of population and employment growth [
45,
46,
47]. However, nearly all of these studies focus on walking to transit at one time point and at a micro-level (neighborhood) spatial scale.
Based on the review of the literature, the following points can be summarized. First, past U.S. surveys on walking travel have been mostly at the local/neighborhood level or the national or state level using NHTS or Census data, and samples were drawn to represent large geographies beyond the metropolitan area level. However, NHTS add-on surveys for states and metropolitan regions (such as the California add-on used in this study) could be appropriate for analyzing travel at the metropolitan or regional scale [
48]. Second, previous studies on walking travel have been mostly cross-sectional that do not allow for analyzing trends over time. Third, studies on transit have largely focused on their land use impacts rather than the potential for transit to promote more walking travel. There are few studies examining changes in active transport use, especially in terms of access/egress trips, during the 2000s, and virtually none have examined these changes at the regional or metropolitan level. Furthermore, there are fewer studies that explore how demographic changes and transit investments can impact walking travel over time.
This study addresses these gaps by comparing walking trips across sub-regions and analyzing changes in walking, demographics, and transit service within a large and diverse U.S. metropolitan region. This study also uses a more nuanced definition of walking trips by separating walking as a primary mode from walking trips to/from transit stops/stations. Finally, possible causal factors that may be related to walking trips in different parts of the greater Los Angeles region are examined, including household characteristics, population and employment densities, and transit service. These findings would provide a more comprehensive picture of walking travel across the region and help guide future urban development and transportation investments.
3. Data and Methods
3.1. Study Area
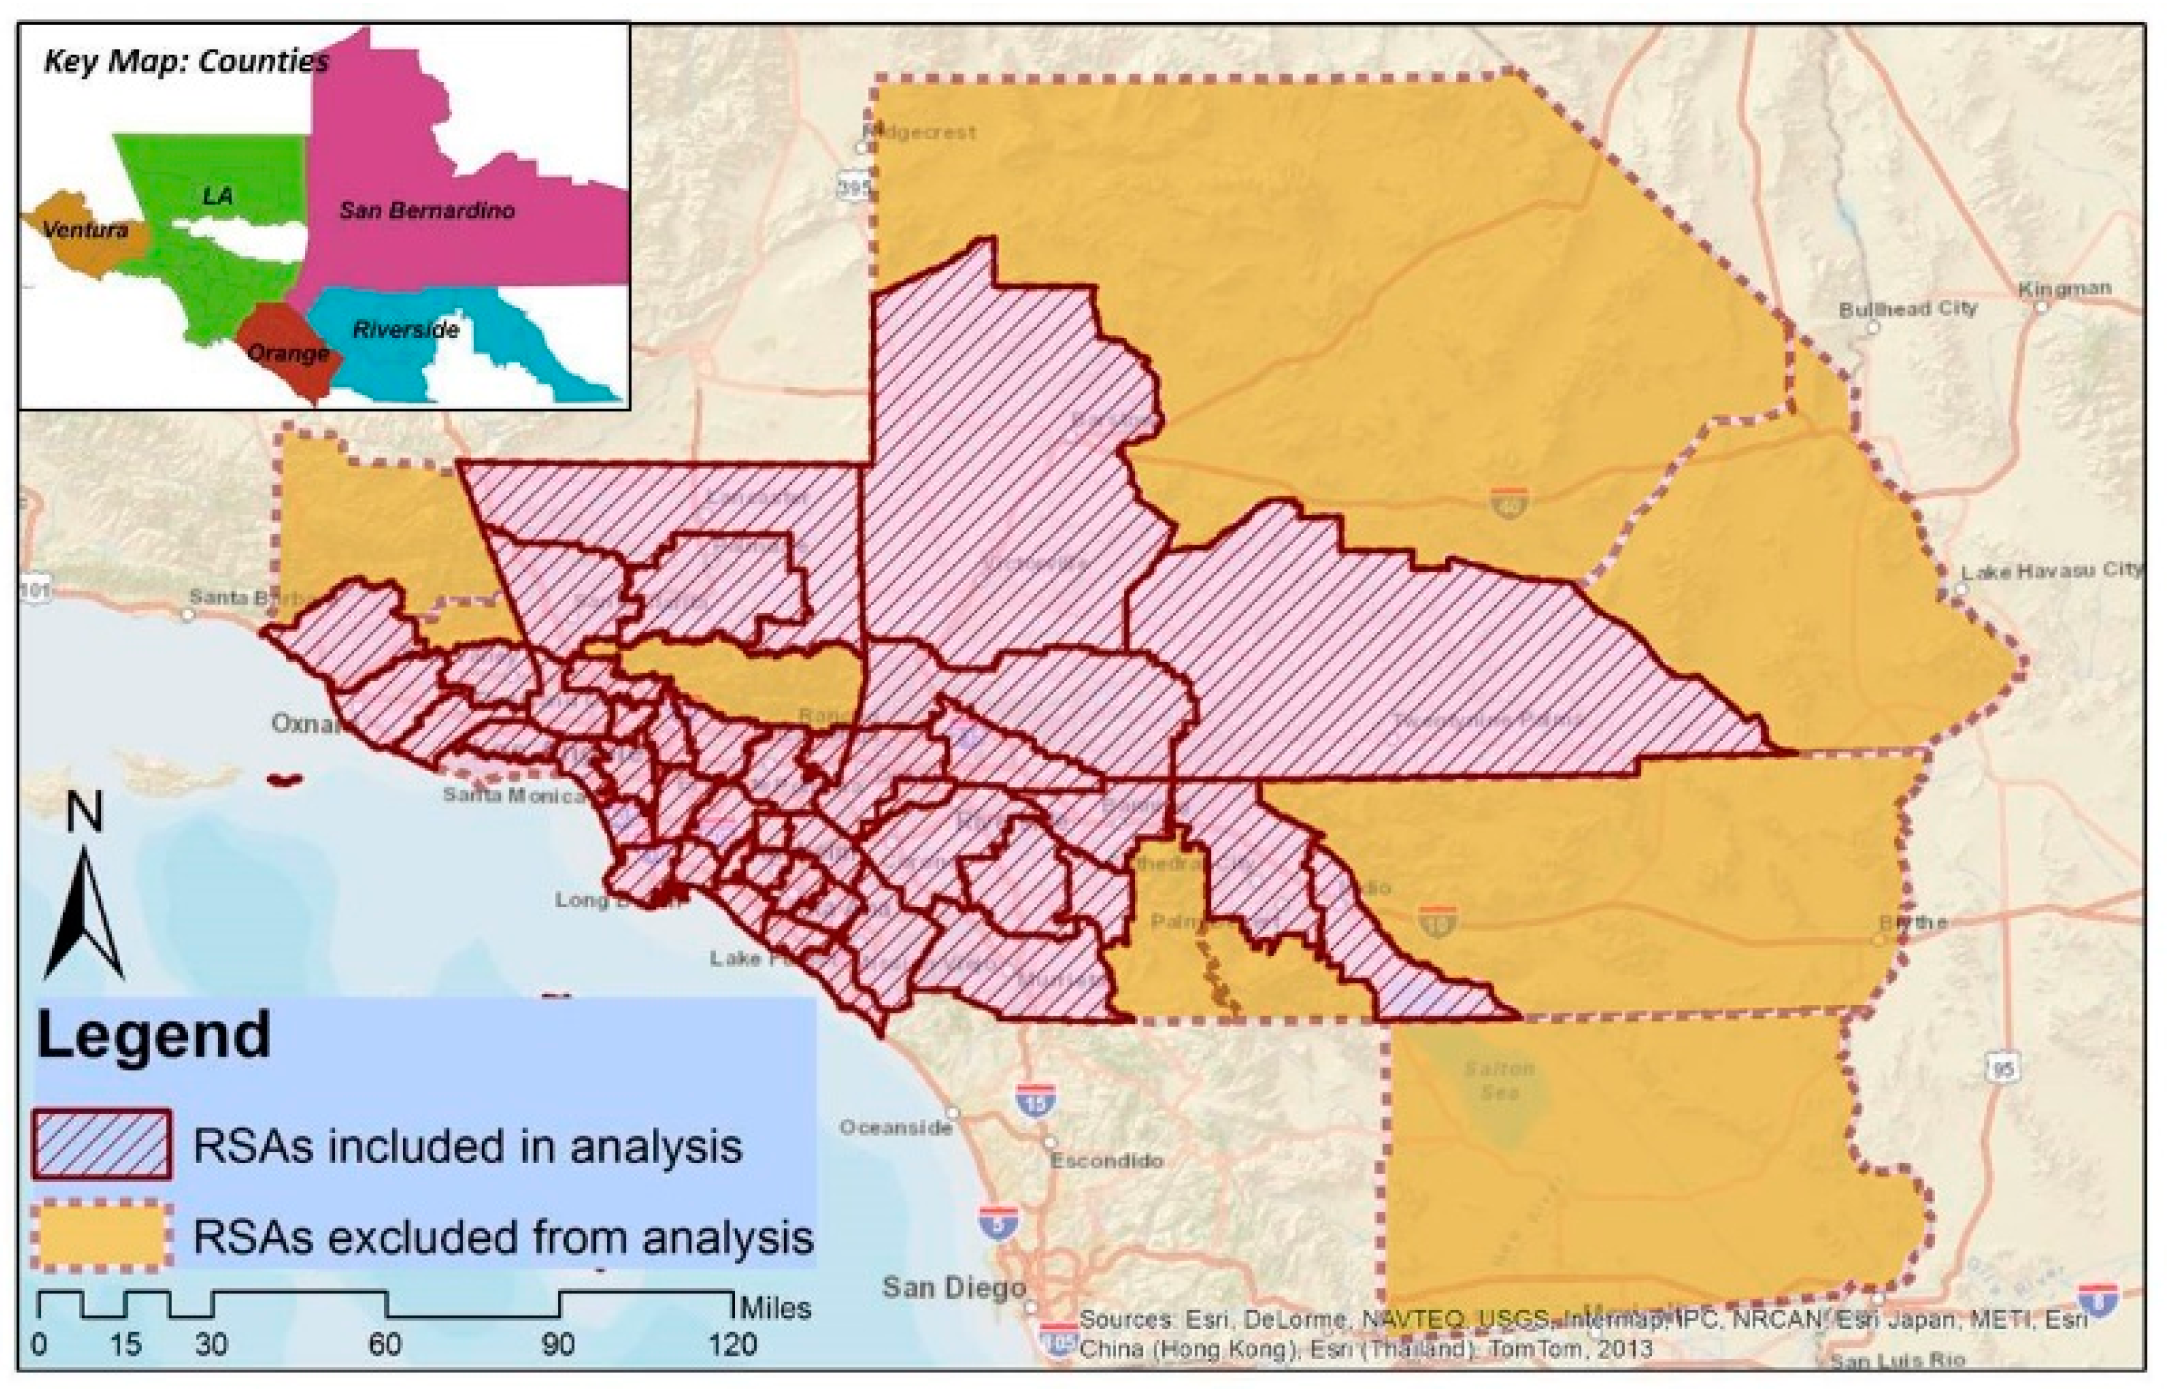
The study area is the greater Los Angeles area, which comprises the Los Angeles CSA. This area includes most of the region governed by SCAG, the nation’s largest metropolitan planning organization whose jurisdiction includes six counties: Los Angeles, Orange, Riverside, San Bernardino, Ventura, and Imperial. However, Imperial County, a sparsely populated rural county in southeastern California, is not part of the Los Angeles CSA, and therefore excluded from this analysis. Nearly all (99 percent) of this region’s 18 million inhabitants reside in the greater Los Angeles area.
The region is divided into 55 RSAs that are used by the regional planning agency for determining socioeconomic development. Each RSA corresponds with specific communities and neighborhoods in the greater Los Angeles and southern California region, and aligns closely with U.S. Census tract boundaries. Some of these RSAs include sparsely populated desert and mountain regions, which have been excluded from this analysis. Hence, the final study area included 46 out of 55 RSAs, comprising most of populated areas of the region (see
Figure 1) [
49]. Since this study is primarily focusing on trends in walking travel across a large metropolitan region, analyzing walking trips at the RSA level allows for comparison of changes across clusters of cities and sub-regions. Note that since geographic aggregation is necessary for the longitudinal panel design framework, and since census tracts are too small to contain sufficient observations from the 2001 or 2009 travel surveys, the RSA seemed to be the most appropriate unit that is also relevant for regional planning.
Figure 1.
Map of study area (46 RSAs).
Figure 1.
Map of study area (46 RSAs).
3.2. Data Collection
This study relies on travel survey data from the SCAG 2001 Post-Census Regional Travel Survey and the California add-on sample of the 2009 NHTS. The SCAG 2001 Survey targeted households in the six counties comprising the SCAG region, and the purpose of the survey was to collect regional travel information that could be used for travel forecasting and to help the regional planning agency make informed decisions about highway and transit improvements [
50]. The primary survey method was random digit dialing telephone interview and the sampling frame consisted of all households and persons in the six county region. In addition to telephone interview questions, household members were asked to complete a travel diary to record detailed travel information for households during a given timeframe (e.g., 24 h). The 2009 NHTS is the largest inventory of daily travel in the U.S., and collected detailed travel data including trip purpose, mode choice, trip duration, trip length, and travel day. This information is used by both policy makers to make transportation decisions and by the research community [
51]. The survey methodology is nearly identical to the SCAG survey, employing a random digit dialing telephone number sample and also included a travel diary section. For this study, we used the California add-on survey of the NHTS, which includes samples from both the national survey and additional samples that was funded by the California Department of Transportation.
We selected the SCAG 2001 and the NHTS 2009 travel surveys because these datasets provided the most detailed information available at the time of the study on main mode walking travel trips (including non-work trips) in the greater Los Angeles region, in addition to information about access/egress trips to transit. While the U.S. Census Bureau also collects information on walking travel, it is strictly limited to commute (work) travel and this study intended to capture a more comprehensive picture of walking travel in the region. Both surveys were also used because they employed a similar sampling frame and survey methodology, and contained identical questions about trip purpose, mode choice, and trip distance and duration in addition to sociodemographic information.
Using these datasets, the aggregate share of total trips by walking (with and without access/egress to public transit) for all participating persons within a given RSA were derived. Questions that pertain to mode choice and transit access and egress trips to obtain walking trip rates were selected. The sample size of the 2001 NHTS was determined to be too small for analyzing walking travel at the RSA level, which is the primary reason for using the SCAG survey. RSA codes, linked to household identifiers, were obtained by agreement with the California Department of Transportation and SCAG, which allowed for the matching of each surveyed household for both travel surveys to a RSA of residence. Walking trips were aggregated in the same manner as the SCAG 2001 data. Survey questionnaires were carefully examined to ensure that questions from the 2009 NHTS corresponded with the questions on the 2001 SCAG survey (see
Appendix).
In addition to data from the 2001 SCAG and 2009 NHTS surveys, these data were merged with 2000 and 2010 U.S. Census data at the census tract level, corresponding with the years of the survey. Population, income and employment data for 2000 and population data for 2010 were derived from the Census. American Community Survey (ACS) 5-year estimates were utilized for income and employment data for 2010 due to lack of data availability. Data on transit stops and stations in the greater Los Angeles area (GIS shapefiles and tabulated data) were obtained with permission from SCAG.
3.3. Variable Selection
Given that our study focuses on the determinants of change in walking travel, our primary outcome variable of interest is individual walking trips. A person trip is defined by both surveys as a trip made by one person in a mode of transportation, which in our case is by walking. We examined both walking trips as a primary mode and walking trips to and from transit stops and stations (access/egress trips). Based on this definition, our dependent variables of interest in this study are:
Walking trip share with and without access/egress trips: This measures the proportion of walking trips, on average, out of total trips made by a randomly selected person within a given RSA at a given year, both with and without considering access/egress trips to transit as valid trips.
Walking trip rate with and without access/egress trips: This measures the number of walking trips per day, on average, made by a randomly selected person within a given RSA at a given year, with and without considering access/egress trips to transit as valid trips.
Given that the 2001 SCAG and 2009 NHTS surveys did not include the same persons, we aggregated the dependent variables at the RSA level to allow a panel comparison over time. Note that a trip, other than an access/egress trip to transit, is defined (both in the 2001 SCAG and the 2009 NHTS surveys) as a physical movement from one activity location to another.
The selection of independent variables was driven by previous research, in addition to data availability and appropriateness at the sub-regional scale. Given the relatively large level of aggregation (RSA), this study did not include disaggregate measures of land use mix or street connectivity, which seem more appropriate for analyzing neighborhood-level walking trips. Therefore, this research primarily focused on capturing changes in population characteristics, employment, and transit availability at the sub-regional level.
Several independent variables were considered for inclusion in our analysis. Due to the limited number of observations (RSAs) and the need to use a parsimonious specification, explained in more detail in the following section, we selected a few key explanatory variables that are known from the literature that are associated with walking travel [
12,
52]. Based on this rationale, the following independent variables were selected for analysis:
population density of the RSA
employment density of the RSA
transit stop density of the RSA [
53]
percent of population under 18 in the RSA
median household income of the RSA (in constant 2010 dollars)
The data for the sociodemographic variables were from the Census and the ACS, and were aggregated at the RSA level. Transit data were obtained from SCAG, and the transit stop density variable was constructed by aggregating bus stops and rail stations by RSA and dividing the number of stops by the land area of each RSA. For this analysis, a transit stop was considered as a scheduled stop on every directional fixed-route bus or rail line, since transit stops were treated as a proxy for transit service. Transit stops from all municipal transit agencies serving the region were included, but stops from paratransit or taxi services that do not have fixed scheduled stops were excluded from the analysis.
3.4. Model Specification
Both descriptive analysis and regression analysis are employed to examine changes in walking trips across the Greater Los Angeles metropolitan area. While the descriptive analysis shows association between the predictor variables and walking trips, they cannot establish the direction of causality in terms of these impacts on walking trips, which is a primary disadvantage of prior empirical studies using a cross sectional analysis. Therefore, the fixed effects regression technique is employed to assess how changes in population, employment, and transit availability between 2001 and 2009 explain changes in the proportion and number of walking trips during this period. The advantage of using fixed effects regression is that time-invariant unobserved variables do not need to be identified in the analysis [
54]. In certain cases, time-invariant variables are omitted in the empirical model because these may not be observed due to the limited data available. However, time-invariant variables measured at the same scale of the fixed effects variables are controlled [
55,
56,
57]. Thus, the fixed effects regression model can specify how changes in time-varying control variables account for the change in the proportion and number of walking trips over time because time-invariant unobserved variables that are fixed over time have been “differenced away” in the analysis [
54].
The dependent variables in this study are the percentage point change in walking trip shares and the change in walking trip rates of RSAs from 2001 to 2009, and the independent variables are the changes in sociodemographic factors and transit availability from 2001 to 2009. In terms of our regression models, we treat RSAs as units of observation (i = RSA), as individual data are not available due to confidentiality and because there is no such panel data available for the Los Angeles region. So each RSA has before data, where t = time (2001), and after data, where t + 1 = time (2009), for the outcome variables of interest (walking trip share and rate) and select explanatory variables (sociodemographic, land use, and transit supply factors). Therefore, we have created a balanced panel that is suitable for longitudinal analysis. We had tested an alternative regression model by pooling observations from both cross sections (i.e., 2001 and 2009 together) and including a time dummy variable. However, due to time invariant omitted variables including unobservable factors and factors that could not be incorporated due to data limitations, we opted for the fixed effects approach which would yield stronger and more reliable results.
Hence, the fixed regression models are expressed below:
Regression for time t (2001): Wi,t = μ1 + βXi,t + ε i,t + ς i
Regression for time t+1 (2009): Wi,t+1 = μ2 + βXi,t+1 + ε i,t+1 + ς i
Fixed effects regression (2001–2009): Wi,t+1 − Wi,t = (μ2 − μ1) + β(Xi,t+1 − Xi,t) + (ε i,t+1 − ε i,t) where t = time (2001), t + 1 = time (2009) i = RSA, W = proportion/rate of walking trips for RSA i, X = a vector of predictor variables (sociodemographic/transit availability), ε = time-varying unobserved effects (error term), ς = time-constant unobserved effects (fixed effect), μ = intercept.
4. Results
4.1. Walking Trip Share in the Greater Los Angeles Area
Summary results of change in walking trip shares from 2001 to 2009 by RSA are shown in
Table 1 (see
Table A1 in
Appendix for details). Walking trip share increased across the vast majority of the greater Los Angeles area, with almost 90 percent of the sampled RSAs reporting increases in the proportion of walking trips. The majority of these increases were statistically significant at the 5 percent level (31 RSAs without access/egress trips, 26 RSAs with access/egress trips) and only two RSAs (one RSA with access/egress trips) significantly decreased in walking trip share [
58]. Seventeen RSAs (19 RSAs with access/egress trips) increased their share of walking trips by more than 5 percent. Across the entire region, walking trip share increased by 4.42 percent (3.17 percent with access/egress trips) from 2001 to 2009, a statistically significant increase.
The RSAs with the highest share of walking trips are located in the highly urbanized central and western areas of the Los Angeles basin. In 2001 and 2009, the Los Angeles central business district (CBD) reported the highest walking trip shares (35.53 percent and 37.18 percent, respectively), followed by Gateway Northwest with over 20 percent. In 2001, only 5 RSAs reported walking trip shares between 10 and 20 percent, and 39 RSAs had less than 10 percent. In 2009, 27 RSAs reported walking trip shares between 10 and 20 percent, and 17 RSAs had less than 10 percent.
In 2001, Los Angeles CBD had the highest share of walking trips (46.74 percent), followed by Gateway Northwest and Mid Los Angeles (greater than 20 percent). Ten other RSAs, mostly in Los Angeles County, reported more than 10 percent. In 2009, Los Angeles CBD reported over 50 percent walking trip share, and three other RSAs (Gateway Northwest, Mid Los Angeles and Santa Monica Bay) exceeded 20 percent walking share. Additionally, 25 other RSAs reported walking trip shares exceeding 10 percent.
Table 1.
Change in walking trip share 2001–2009, by RSA.
Table 1.
Change in walking trip share 2001–2009, by RSA.
| Change in walk trip share (2001–2009) | Without access/egress | With access/egress |
|---|
| No. of RSAs | % of all RSAs | No. of RSAs | % of all RSAs |
|---|
| Increase | 41 | 89.13 | 40 | 86.96 |
| Increase sig. at 5 percent level | 31 | 67.39 | 26 | 56.52 |
| Decrease | 5 | 10.87 | 6 | 13.04 |
| Decrease sig. at 5 percent level | 2 | 4.35 | 1 | 2.17 |
4.2. Walking Trip Rates in the Greater Los Angeles Area
Summary results of walking trip rates (number of walk trips made per person per day, on average) from 2001 to 2009 in the greater Los Angeles area are shown in
Table 2 (see
Table A2 in appendix for details). Walking trip rates increased in virtually all RSAs. Most of these increases were statistically significant at the 5 percent level (42 RSAs without access/egress trips, 41 RSAs with access/egress trips) and no RSA significantly decreased in walking trip rates. Across the entire region, walking trip rates increased by 0.21 walking trips per person per day (0.32 walking trips per person per day with access/egress trips) from 2001 to 2009, a statistically significant increase.
Similar to walking trip shares, RSAs with the highest walking trip rates are concentrated in the central Los Angeles area. In 2001, Los Angeles CBD reported the highest walking trip rate with 1.08 daily walking trips per person, followed by Gateway Northwest (0.68), Mid Los Angeles (0.57), and Glendale/North L.A. (0.53). Fifteen RSAs, mostly located in suburban Los Angeles and Orange counties, reported walking trip rates between 0.25 and 0.50. In 2009, the Los Angeles CBD reported the highest rate of walking trips in the region (1.55 walking trips per person per day). Sixteen other RSAs reported walking trip rates greater than 0.50, and all RSAs (except for one) reported walking trip rates greater than 0.25.
In 2001, Los Angeles CBD reported the highest rate of walking trips (1.79 per person walking trips per day). Other RSAs that reported greater than 0.50 walking trips per person per day include Gateway Northwest, Mid Los Angeles, Glendale/North L.A., Santa Monica Bay, and Greater Santa Ana. In 2009, Los Angeles CBD reported the highest rate in the region (3.27), followed by Mid Los Angeles (1.53), Gateway Northwest (1.33), and Santa Monica Bay (1.04). Twenty-two other RSAs (mostly in Los Angeles and Orange counties) reported walking trip rates greater than 0.50.
Table 2.
Change in walking trip rate 2001–2009, by RSA.
Table 2.
Change in walking trip rate 2001–2009, by RSA.
| Change in walk trip rate (2001–2009) | Without access/egress | With access/egress |
|---|
| No. of RSAs | % of all RSAs | No. of RSAs | % of all RSAs |
|---|
| Increase | 43 | 93.48 | 45 | 97.83 |
| Increase sig. at 5 percent level | 42 | 91.30 | 41 | 89.13 |
| Decrease | 3 | 6.52 | 1 | 2.17 |
| Decrease sig. at 5 percent level | 0 | 0.00 | 0 | 0.00 |
4.3. Analysis of Walking Trips and Predictor Variables by County
Summary results of changes in walking trip shares and rates, in addition to population, employment, and transit density by county in the Los Angeles CSA are shown in
Table 3. Los Angeles County reported the highest proportion of trips taken by walking in both 2001 and 2009; including access/egress trips, nearly 1 out of 5 trips (18.24 percent) in the county were taken on foot in 2009. All counties experienced increases in the share of walking trips, with two counties (Orange and Ventura) exceeding 10 percent walking trip share with access/egress trips. In terms of walking trip rates, Los Angeles County reported the highest number of daily walking trips per person in the region with nearly one daily walking trip per person in 2009, including access/egress trips.
Table 3.
Analysis of key variables (by county).
Table 3.
Analysis of key variables (by county).
| Variable | Los Angeles | Orange | Riverside | San Bernardino | Ventura |
|---|
| Mean (2000-01) | Mean (2009-10) | Mean (2000-01) | Mean (2009-10) | Mean (2000-01) | Mean (2009-10) | Mean (2000-01) | Mean (2009-10) | Mean (2000-01) | Mean (2009-10) |
|---|
| Walk Trip Share | 10.52 | 14.67 | 6.34 | 9.89 | 5.32 | 9.23 | 5.34 | 8.09 | 5.77 | 10.58 |
| Walk Trip Share (with acc/egr) | 13.63 | 18.24 | 7.38 | 11.75 | 5.92 | 9.94 | 6.41 | 8.59 | 6.41 | 11.15 |
| Walk Trip Rate | 0.35 | 0.63 | 0.23 | 0.45 | 0.17 | 0.39 | 0.18 | 0.36 | 0.21 | 0.47 |
| Walk Trip Rate (with acc/egr) | 0.44 | 0.93 | 0.25 | 0.56 | 0.19 | 0.43 | 0.20 | 0.42 | 0.22 | 0.52 |
| Pop. Density (persons per sq. mi) | 6211.35 | 6471.56 | 4661.55 | 5007.02 | 711.47 | 1060.81 | 1084.38 | 1253.69 | 930.09 | 1056.18 |
| Emp. Density (jobs per sq. mi) | 4204.78 | 4309.89 | 2632.76 | 2879.48 | 256.61 | 327.07 | 424.40 | 513.32 | 433.60 | 475.07 |
| Transit. Density (stops per sq. mi) | 54.42 | 131.71 | 11.72 | 27.74 | 1.73 | 4.86 | 2.99 | 4.58 | 1.32 | 5.85 |
| % Pop. Under 18 | 28.15 | 24.52 | 26.52 | 24.03 | 29.95 | 28.29 | 29.66 | 26.98 | 28.20 | 25.20 |
| HH. Income (2010 USD) | 64,605.16 | 63,764.17 | 86,343.40 | 82,704.88 | 53,900.96 | 58,641.52 | 53,215.62 | 52,388.30 | 84,421.18 | 82,111.30 |
The analysis of walking trips by county reveals several key findings. First, counties with higher walking trip shares and rates tend to have higher population, employment, and transit densities. Second, walking trip shares and rates increased substantially from 2001 to 2009, corresponding with increases in transit availability. Third, both population and employment densities have increased in all counties in the Los Angeles CSA. Therefore, changes in population, employment, and transit density across the greater Los Angeles area appear to be related with increases in the share and rate of walking trips.
4.4. Fixed-Effects Regressions
Table 4 shows the fixed-effects regression results for walking trip share and rate without and with access/egress trips. In Model 1 (walking trip share without access/egress trips), the population density variable is significant and positive: RSAs with larger increases in population density during this period generally had larger corresponding increases in the proportion of walking trips. However, the transit density variable is significantly negative: RSAs that had greater transit investment tended to have lower increases in the share of non-transit related walking trips, on average and all else equal. RSAs with greater increases in the proportion of population under 18 also had smaller corresponding increases in walking trip share. Employment density and household income were not significant predictors of walking trip share. In Model 2 (walking trip share with access/egress trips), population density was positive but not statistically significant at the five percent level, and transit density variable lost statistical significance. Therefore, after taking access/egress trips into account, there was no evidence of an association between changes in transit stop density and the share of walking trips. The other variables (employment density, population under 18, and household income) did not show significant changes in signs or magnitude of the coefficients from the previous model.
Model 3 (walking trip rate without access/egress trips) shows a significant and positive population density variable: RSAs that experienced greater increases in population density were associated with greater corresponding increases in non-transit related walking trips. Changes in transit stop density did not appear to be associated with changes in non-transit related walking trip rates. Greater increase in the share of children under 18 was found to be associated with lower corresponding increases in walking trip rates, and employment density and household income were not significant predictors of walking trip rates. After including access/egress trips (Model 4), some important changes in the magnitude and/or direction of two key predictor variables can be observed: population density and transit density. The population density loses statistical significance, suggesting that RSAs that experienced significant increases in population density did not necessarily have significant increases in transit-related walking trips. However, transit density is positive and significant in this model, indicating that RSAs that experienced greater increases in transit stop density were associated with greater increases in the number of walking trips per capita per day including access/egress trips. Therefore, transit positively influences walking trip rates after taking access/egress trips into account. Other variables remained unchanged from the previous model.
Table 4.
Fixed effects regression results for walk trip share and walk trip rate.
Table 4.
Fixed effects regression results for walk trip share and walk trip rate.
| Models for Walk Trip Share | Models for Walk Trip Rate |
|---|
| DV: Walking trips | Model 1: Fixed Effects (without Access/Egress) | Model 2: Fixed Effects (with Access/Egress) | Model 3: Fixed Effects (without Access/Egress) | Model 4: Fixed Effects (with Access/Egress) |
|---|
| Coefficient | t | Coefficient | t | Coefficient | t | Coefficient | t |
|---|
| Population Density | 0.0046466 | 2.25 | 0.0040176 | 1.84 | 0.0001934 | 2.18 | 0.0001549 | 1.55 |
| Employment Density | −0.0010813 | −0.20 | 0.0017347 | 0.31 | 0.0000840 | 0.37 | 0.0002351 | 0.91 |
| Transit Stop Density | −0.0171826 | −2.39 | −0.0073042 | −0.96 | −0.0002828 | −0.92 | 0.0011814 | 3.40 |
| Household Income | −0.0000739 | −0.55 | −0.0000946 | −0.66 | −0.0000011 | −0.19 | −0.0000017 | −0.26 |
| % Population under 18 | −0.9502224 | −3.91 | −0.8756339 | −3.41 | -0.0553600 | −5.31 | −0.0527154 | −4.50 |
| Constant | 24.86742 | 1.34 | 21.2801800 | 1.08 | 0.9654094 | 1.21 | 0.7572864 | 0.85 |
| No. of Observations | 92 | - | 92 | - | 92 | - | 92 | - |
| Overall R-squared | 0.4926 | - | 0.7630 | - | 0.5657 | - | 0.7483 | - |
| Within R-squared | 0.5074 | - | 0.5222 | - | 0.6947 | - | 0.8441 | - |
| Between R-squared | 0.5530 | - | 0.8308 | - | 0.7689 | - | 0.8574 | - |
In sum, changes in population density, transit density, and the proportion of children under 18 were the most significant predictors of changes in walking trips in the greater Los Angeles region from 2001 to 2009. Population density seems to have positively affected the proportion and rate of walking trips, with the exception of walking trip rates with access/egress. Transit stop density is negatively associated with changes in walking trip share without access/egress, meaning that RSAs that had increases in transit stop density did not experience corresponding increases in non-transit walking trip share. However, transit stop density is positively associated with increases in transit-related walking trips. A higher share of children under 18 tends to negatively affect both walking trip share and trip rates, which is consistent with prior literature. Interestingly, employment density does not appear to be a strong predictor of walking trip shares or rates, and household income does not significantly determine walking travel.
5. Discussion
Assessing the results, there is compelling evidence that walking travel has increased in the greater Los Angeles region from 2001 to 2009, in both the share of walking trips and the number of walking trips per person on average (see
Table 5). The results also show a significant increase in walking share after including access and egress trips to transit, with slightly lower percentage point increases. In terms of comparing increases between walking trip shares and walking trip rates, walking trip rates increased more as a percentage of 2001 walking trip rates than walking trip shares. Walking trip rates without access/egress trips increased from 0.30 to 0.51 average trips per person per day (70 percent increase from 2001); including access/egress trips, the walking trip rate increased from 0.35 to 0.68 average trips per person per day (94.2 percent increase from 2001). While walking trip shares may not have increased as dramatically, due to more trips being taken overall in the region, it is clearly evident that L.A. area residents are walking much more in 2009 than they did in 2001.
Additionally, increases in walking trips in the greater Los Angeles region during this period generally corresponded with increases in population, employment, and transit service. The region as a whole gained in population with all counties in the CSA reporting increases (and 42 RSAs out of 46 RSAs reporting population gains). The Los Angeles CSA also grew in the number of jobs as all counties reported increases in employment density. Finally, the L.A. region also added much transit supply during this period, not only in terms of infrastructure but transit service frequency. Additional bus and rail lines, extended hours, and increased service frequency by the Los Angeles County Metropolitan Transportation Authority (Metro) and other regional transit operators largely explain the increase in transit stop density [
59]. However, walking trip shares and rates were generally higher in RSAs with relatively high population, employment, and transit densities, which were mostly in Los Angeles County.
To assess the increase in the supply and use of public transit in the Los Angeles region, we report data from the U.S. Federal Transit Administration’s National Transit Database [
60]. Between 2001 and 2009, total annual revenue vehicle miles of transit service in the Los Angeles-Long Beach-Anaheim urbanized area (all major operators and all modes—bus and rail—combined) increased from 171 to 256 million (compound annual growth rate, or CAGR of over 5 percent); total annual ridership, measured as number of unlinked passenger trips, increased from 571 to 704 million (CAGR = 2.65 percent). The observed increase in revenue service miles is a combined effect of coverage (space and time) expansion, rail investments, and increase in service frequency on average. The ridership increase is most likely underestimated, since improvement in network planning is expected to minimize number of transfers on average. Over the 2001–2009 period, annual revenue service miles of the largest transit operator in the region, Metro, increased from 90 to 122 million (CAGR = 3.88 percent), and ridership increased from 398 to 481 million trips (CAGR = 2.4 percent). Some of the major Metro transit projects that were completed in the study period include the first phase of the Gold light rail line (2003) connecting Downtown Los Angeles with Pasadena, the Orange bus rapid transit line (2005) connecting North Hollywood with Canoga Park/Chatsworth, and over 20 rapid bus projects serving major corridors such as Wilshire Blvd., Vermont Ave., and Santa Monica Blvd [
55]. Our estimates using travel survey data suggest that transit is indeed a growing mode in the study region. Transit’s share of all trips made in the Los Angeles-Riverside-Orange County Consolidated Metropolitan Statistical Area increased by about 0.9 percentage points from 2.47 to 3.35 percent between 2001 and 2009. In sum, these figures appear to support our findings that the increase in walking trips is linked to the increase in transit trips during this time period.
Table 5.
Summary of changes in walk trip share and walk trip rate.
Table 5.
Summary of changes in walk trip share and walk trip rate.
| Measures | 2001 | 2009 | Increases (2001–2009) |
|---|
| Walking Shares (walk trips as fraction of total trips) |
| Without Access/Egress | 8.79% | 13.21% | 4.42% * |
| With Access/Egress | 11.04% | 14.21% | 3.17% * |
| Walking Rates (walk trips per person) |
| Without Access/Egress | 0.30 | 0.51 | 0.21% * |
| With Access/Egress | 0.35 | 0.68 | 0.32% * |
The regression results provide a robust explanation of how changes in population density and transit availability influenced changes in walking trip shares and rates in the greater Los Angeles region during the study period. These results show a positive association between residential density and walking trips as a primary mode, confirming previous studies [
61,
62]. However, the association between population density and walking became weaker after including transit-related walking trips, illustrated by the loss of significance of the population density variable for both walking trip share and trip rate. Transit density, on the other hand, did not appear to have an impact on walking trip share (including access/egress trips) or on non-transit related walking trip rates, although it has a negative impact on walking trip shares without access/egress trips. Increased transit service mainly increased the number of walking trips to and from transit stops and stations, shown by the positive significance of the transit density variable for walking trip rates with access/egress trips. In terms of sociodemographic factors, areas that increased in the proportion of children under 18 had lower increases in walking trips, suggesting that households with children tend to walk less than other households possibly due to increased errand trips by car, in line with prior research [
20]. Finally, employment density did not appear to have a significant impact on walking trips in this study, perhaps due to the relatively lower share of walking trips to work compared to non-work walking travel.
Considering the findings from our regression models, two issues warrant further explanation: (1) a statistically significant negative association between transit stop density and main mode walking trip share (Model 1 in
Table 4); and (2) a statistically significant positive association between transit stop density and walking trip rate including access/egress trips (Model 4 in
Table 4).
The negative coefficient of the transit stop density variable for walking trip share is intriguing but not implausible. Assuming that increases in transit stops are correlated with increases in transit ridership, areas that gained transit stops are also likely to have gained transit trips. Each additional rider is associated with more than one additional transit trip, on average, due to the requirement of transfers between most origins and destinations. Therefore, even if the number of main mode walking trips increase in areas with transit investments, its share may decrease due to the larger denominator of total trips by all modes. However, the number of walking trips to and from transit stops will likely increase from adding transit stops.
The positive association between transit stop density and walking trips that include access/egress trips is consistent with expectation. To better elucidate the link, we conducted an expanded analysis examining the relationship between transit investment, transit trips, and walking trips. The purpose of this analysis is twofold: (1) to better understand the connection between transit and walking in the region; (2) to determine whether transit investments have increased walking by inducing more access/egress trips. Given that parts of the greater Los Angeles region have undergone expansions in transit service between 2001 and 2009, we were generally interested in examining whether transit investments have led to higher walking and transit use in these areas.
To conduct this analysis, we divided census tracts in the greater Los Angeles region into four groups based on two factors: (1) transit stop density during the baseline year (2001), and (2) change in transit stop density between 2001 and 2009. We used two baseline year transit stop density categories: low density (0 to 6 stops per square mile) and high density (more than 6 stops per square mile). Baseline median census tract level transit stop density in the Los Angeles region, excluding tracts with zero transit stops, is 6. We used two categories for transit stop density change: no increase or decrease (2009 density equal to or less than 2001 density), and increase (2009 density greater than 2001 density). This 2 × 2 analysis helps illuminate how change in walking and transit trips vary across transit poor and transit rich areas that have experienced different levels of transit investment between 2001 and 2009.
We analyzed change in trip share across two modes—walking without and with access/egress, and transit. Like walking, transit trips were derived from both the 2001 SCAG and 2009 NHTS surveys, based on the survey questions about mode choice (see
Appendix). Transit trips include modes by bus (e.g., local bus, express bus) as well as rail (e.g., light rail, heavy rail, commuter rail). Modes that are not considered fixed route transit such as paratransit, school bus, and taxi were excluded from our analysis to correspond to our definition of transit stops which includes only fixed schedule bus and rail stops.
Table 6 shows the changes in trip shares for walking trips (without and with access/egress) and transit trips by census tract group. Walking trip share (without access/egress) increased across all four groups from 2001 to 2009. Differences are statistically significant at the 5 percent level. Census tracts that experienced transit density increases had slightly higher walking mode shares (in both 2001 and 2009) than census tracts that did not experience increase in transit stop density. However, transit stop density increases had a greater impact on walking with access/egress trips, shown by the larger percentage point difference in trip shares between “control” (no transit stop density increase) and “treatment” (transit stop density increase) census tracts when compared to walking as a main mode. This shows that the increase in walking trips generated from transit investments is mostly from access/egress trips by foot. Furthermore, walking mode shares (both without and with access/egress) in census tracts with a baseline transit stop density greater than 6 were considerably higher than census tracts lower than 6 transit stops per mile, which confirms expectations and supports previous literature.
Table 6.
Analysis of change in walking and transit trip shares (2001–2009) across census tracts in the greater Los Angeles region.
Table 6.
Analysis of change in walking and transit trip shares (2001–2009) across census tracts in the greater Los Angeles region.
| Baseline transit stop density (2001) | Change in transit stop density (2001–2009) |
|---|
| Decrease or no change | Increase |
|---|
| No. of census tracts | 2001 trip share % (1) | 2009 trip share % (2) | Change in trip share (2)-(1) | No. of census tracts | 2001 trip share % (3) | 2009 trip share % (4) | Change in trip share (4)–(3) |
|---|
| Walk trips |
| 6 or less | 834 | 5.25 | 9.14 | 3.89 * | 1243 | 6.54 | 10.46 | 3.92 * |
| More than 6 | 1040 | 10.23 | 14.20 | 3.96 * | 839 | 10.33 | 14.21 | 3.88 * |
| Total | 1874 | 7.63 | 11.46 | 3.83 * | 2082 | 7.84 | 11.75 | 3.91 * |
| Walk trips (including transit access and egress trips) |
| 6 or less | 834 | 6.33 | 10.26 | 3.93 * | 1243 | 7.70 | 12.77 | 5.07 * |
| More than 6 | 1040 | 14.11 | 19.48 | 5.37 * | 839 | 13.86 | 18.43 | 4.58 * |
| Total | 1874 | 10.05 | 14.50 | 4.45 * | 2082 | 9.81 | 14.72 | 4.91 * |
| Transit trips |
| 6 or less | 834 | 0.72 | 0.60 | −0.13 | 1243 | 0.91 | 1.40 | 0.49 * |
| More than 6 | 1040 | 2.78 | 2.99 | 0.21 | 839 | 2.53 | 2.30 | −0.22 |
| Total | 1874 | 1.71 | 1.70 | −0.01 | 2082 | 1.46 | 1.71 | 0.25 * |
Unlike walking, transit trip share changes differ significantly across the four groups. On average, census tracts without any increase in transit stop density show no statistically significant change in transit mode share from 2001 to 2009. Census tracts with increase in transit stop density show statistically significant increases in transit trip share overall (1.46 percent in 2001 to 1.71 percent in 2009). Transit trip share increases are statistically significant in low density areas that had additional transit service added (0.91 percent in 2001 to 1.40 percent in 2009). Additionally, areas that had higher transit stop densities had much higher transit trip shares than areas with lower transit stop densities.
Overall, the areas of greater Los Angeles that have experienced increases in transit investment from 2001 to 2009 have gained a greater share of walking trips, particularly access/egress trips by walking, as well as increased transit trip share compared to areas that did not benefit from increased transit service. This analysis shows that main mode walking trips, excluding transit-related walking trips, increased across the entire region between 2001 and 2009, regardless of the level of baseline transit stop density and the level of increase in transit service. This suggests no direct association, all else equal, between main mode walking and transit investment, triangulating our findings from the fixed effects regressions.
In sum, the results from this study suggest that adding transit stops alone did not have much impact in generating increased walking trips with the exception of access/egress trips; however, it may be probable that built environment changes associated with population density increases (such as transit-oriented developments) may have induced more pedestrian trips. Of course, increases in transit supply allow and are often commensurate with increases in density, and so the planning implications, discussed below, should avoid reductionist interpretations.
6. Strengths and Limitations
This study has a number of strengths and limitations that should be mentioned. In terms of the strengths, our study provides insights into the factors that may explain the increase in walking travel by examining predictor variables such as changes in transit service, population and employment densities across a large metropolitan region, while previous studies have been largely descriptive and cross sectional. Although we analyze two cross sections at different points in time (2001 and 2009), identical questions were used for both surveys and observations were aggregated at the RSA level, allowing for a longitudinal comparison across RSAs. Second, this study is unique because it examines the role of public transit in generating more walking trips by treating transit access and egress trips separately from walking trips as a primary mode. Finally, the study provides insights on how an automobile-oriented region could transition to a multimodal urban region that embraces sustainable transport, which may generate comparative research in different contextual settings.
In terms of our limitations, this study is based on a case study of walking travel in one U.S. metropolitan region, albeit well-known for its auto-centricity, and therefore our findings may only be generalizable to cities similar to Los Angeles. Due to data limitations and the aggregation of data at the sub-regional level, only a select number of key variables impacting walking travel such as population, employment, and transit service density were included in the model specification, although the fixed effects method allowed the use of a parsimonious specification since it controlled for time invariant factors. Therefore, the fixed effects model captures other explanatory factors that are not explicitly included in the model, which may include traffic density and other unobserved factors that could influence walking mode choice. Additionally, some RSAs reported a low number of walking trips, which reflects a limitation of the survey data and the analysis at the RSA level. Considering the spatial unit of analysis used in this study of regional walking travel, we have not included micro-scale factors that influence walking at the neighborhood level. While investigation of such factors is important from a local urban design perspective, the goal of this study is to provide a broader, more comprehensive picture of walking travel over time in a region that has experienced rapid growth in population, employment, and transit investment.
7. Conclusions and Policy Implications
This study provides compelling evidence that residents of the greater Los Angeles region are taking a greater share of trips by walking relative to other modes; further, they are taking more walking trips per person on average in 2009 compared to 2001. In this traditionally auto-oriented region, the increase in walking trips during the past decade may represent a turning point. Population density appears to be a significant factor influencing walking trips. The results also show that the connection between walking and transit is less clear, with the exception that transit investments have possibly been endogenously associated with ridership, and therefore areas with higher increases in transit stop density have experienced significantly higher increases in transit-related walk trips.
These results have important policy implications for planning at the regional and metropolitan level. Based on the findings, it can be observed that while the region has generally experienced increases in walking trips, some of the highest increases were in suburban RSAs outside of the urbanized parts of Los Angeles County. The increase in walking trips in suburban RSAs in particular could be attributed to a variety of reasons, such as increased residential and commercial densities and improvements to the pedestrian environment. In the South Bay area in particular, which is largely built up, population increases during this period were largely due to infill development. However, this area remains underserved by public transit, evidenced by the lack of transit lines and few reported transit trips according to the South Bay Travel Survey, a sub-regional travel survey conducted from 2005 2007 [
8,
19,
20]. Given that this study is analyzing walking travel at the sub-regional level, additional studies would be needed to scrutinize individual and neighborhood factors impacting walking behavior. However, the findings from this research provide a “big picture” of walking travel across sub-regions in a large metropolitan area, and can help guide MPOs to identify priority areas or corridors that have the greatest potential to benefit from investments in pedestrian and transit infrastructure.
The Los Angeles region is undergoing a spatial transformation as they have embarked on a massive transit expansion program. These projects are often driven by planners and policy makers who embrace the notion that transit generates walking and creates walkable communities. Many consider public transit investment as the magic bullet. However, the evidence suggests that transit has the potential to generate more walking trips through new access/egress trips in the short term within the first two to three years after the opening of a transit line; it can possibly promote overall walking in the longer term (5 to 10 years and beyond), if complemented with coordinated land use policies that improve the walking environment through increased urban densities, mixed land uses, and pedestrian-oriented design. Hence, transit investments in the short term may generate more walking trips to and from transit stations, and in the long term may led to transit-oriented developments that could promote more neighborhood walking trips [
5,
63]. Therefore, transit service needs to be strategically implemented in areas or corridors that have the greatest potential for generating more walking trips, such as older suburban downtowns that have higher population and employment densities than the typical auto-oriented suburb [
8]. Additionally, transit investments tied with high density mixed-use developments could allow density thresholds that are more conducive to pedestrian travel. As walking travel continues to rise in the greater L.A. region, the evidence suggests a role for land use planning and transit service.
Our findings from the Los Angeles region also have important policy implications and lessons for cities outside of the U.S., particularly those in newly developed and rapidly developing countries such as China and India that are currently undergoing unprecedented increases in auto ownership and use, partly due to massive roadway investment and the encouragement of North American suburban development patterns [
64,
65]. The Los Angeles case study provides an illustrative example of how a once auto-centric city can be retrofitted through densification and transit service expansion to facilitate more sustainable transport options, and provides some hope for other developing cities that are confronted with problems related to automobile dependence. Other U.S. cities can learn from the L.A. experience by adopting similar regional planning strategies. While lessons from the U.S. may not be directly applicable to cities in developing countries that are experiencing rapid motorization, our study may provide some guidance on how this trend could be reversed using planning and policy tools.


