
Development of the Social Inventory Database in Thailand Using Input–Output Analysis


Abstract
:1. Introduction
2. Methodology
2.1. LCA Model
2.2. Social Inventory Database Development Based on IO Model
2.2.1. Matrix of Direct Input Coefficient
2.2.2. Matrix of Social Footprint Coefficient
2.2.3. Final Demand Vector
2.2.4. Calculation of Total Social Impacts
2.3. Data Processing

| Measure | Indicators | Unit | Definition | Data Source | Data Year |
|---|---|---|---|---|---|
| Employment | Total employment | Persons-year | Total employment required for the production of goods and services | NSO (2006) [33] | 2005 |
| Gender inequality | Female employment | Persons-year | Total female employment required for the production of goods and services | NSO (2006) [33] | 2005 |
| Working hours | Worked hours | Hours-year | Total number of hours actually worked per year for the production of goods and services. Actual hours worked include regular work hours of full-time, part-time workers, self-employed workers, and exclude time not worked. | BOT (2014) [34] | 2005 |
| Wages and salaries | Income | Million Thai Baht | The compensation by employers to employees. Employees are classified as long-term workers, temporary workers, executives and hired laborers in the agricultural sector, but excluded family workers. | NSO (2006) [35] | 2005 |
| NSO (2007) [36] | 2006 | ||||
| NSO (2007) [37] | 2006 | ||||
| Fatal occupational cases | Fatal cases in workplace | Cases-year | Cases where workers were fatally injured as a result of occupational accidents, and where death occurred within one year of the day of the accident. | SSO (2006) [38] | 2005 |
| Non-fatal occupational cases | Non-fatal cases in workplace | Cases-year | Cases of occupational injury where the workers injured were unable to work temporarily or permanently from the day after the day of the accident. | SSO (2006) [38] | 2005 |
3. Results
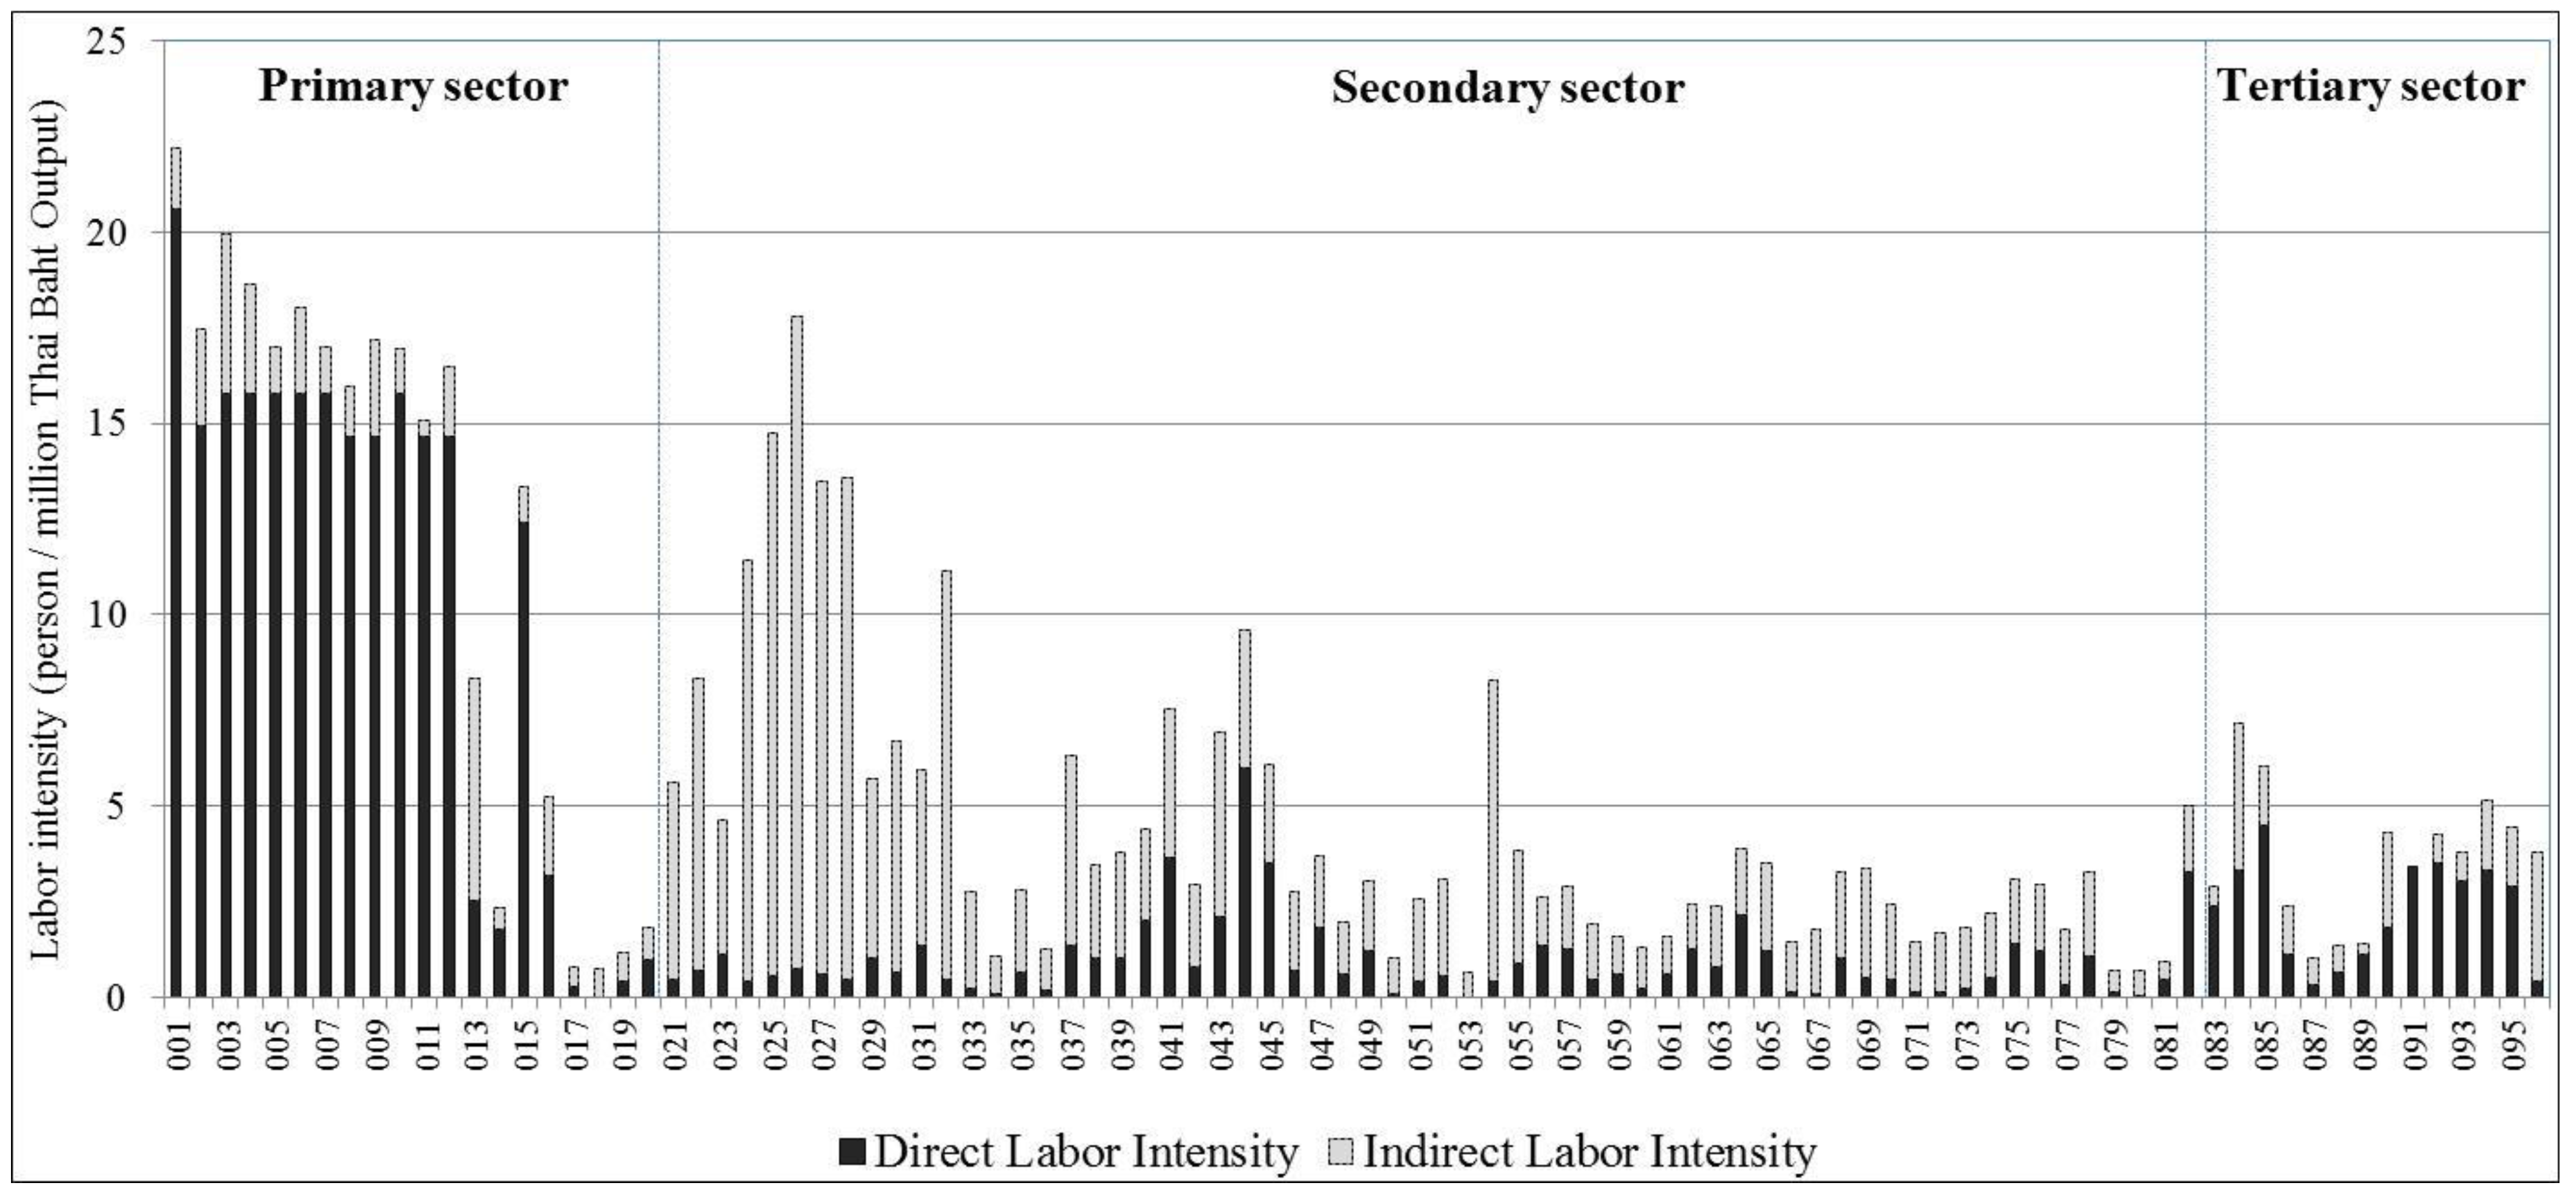
3.1. Employment
3.1.1. Employment Intensity
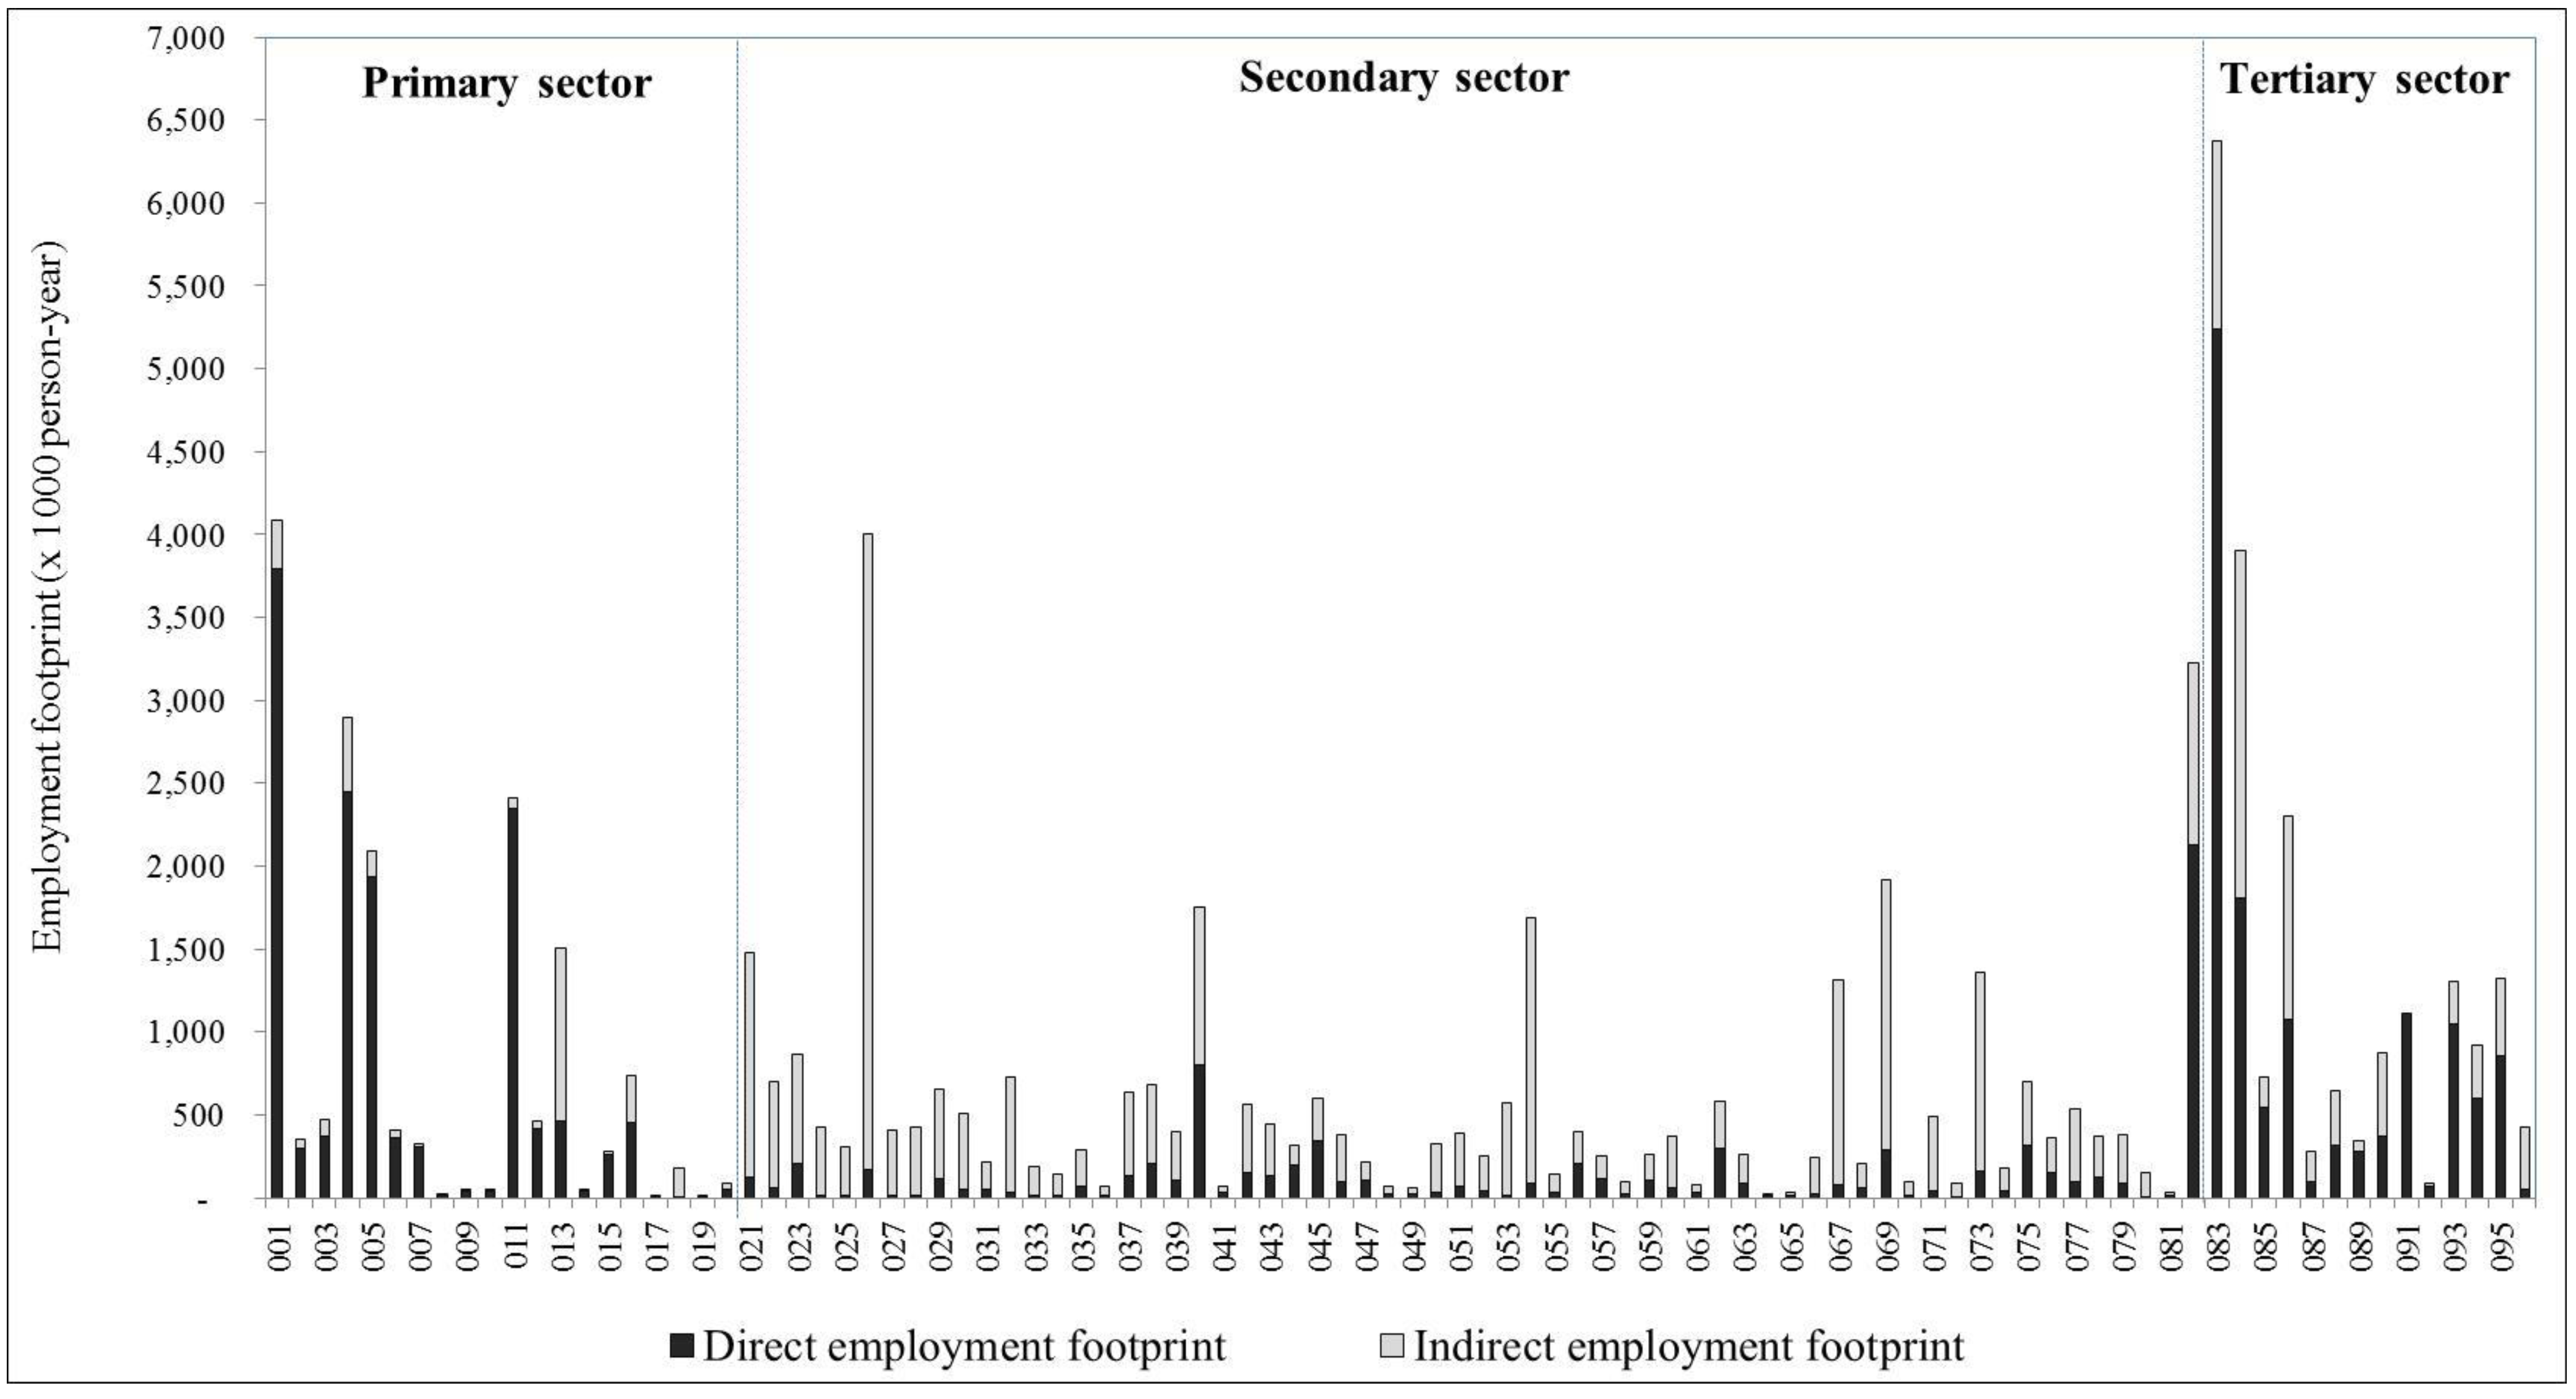
3.1.2. Employment Footprint
3.2. Female Employment
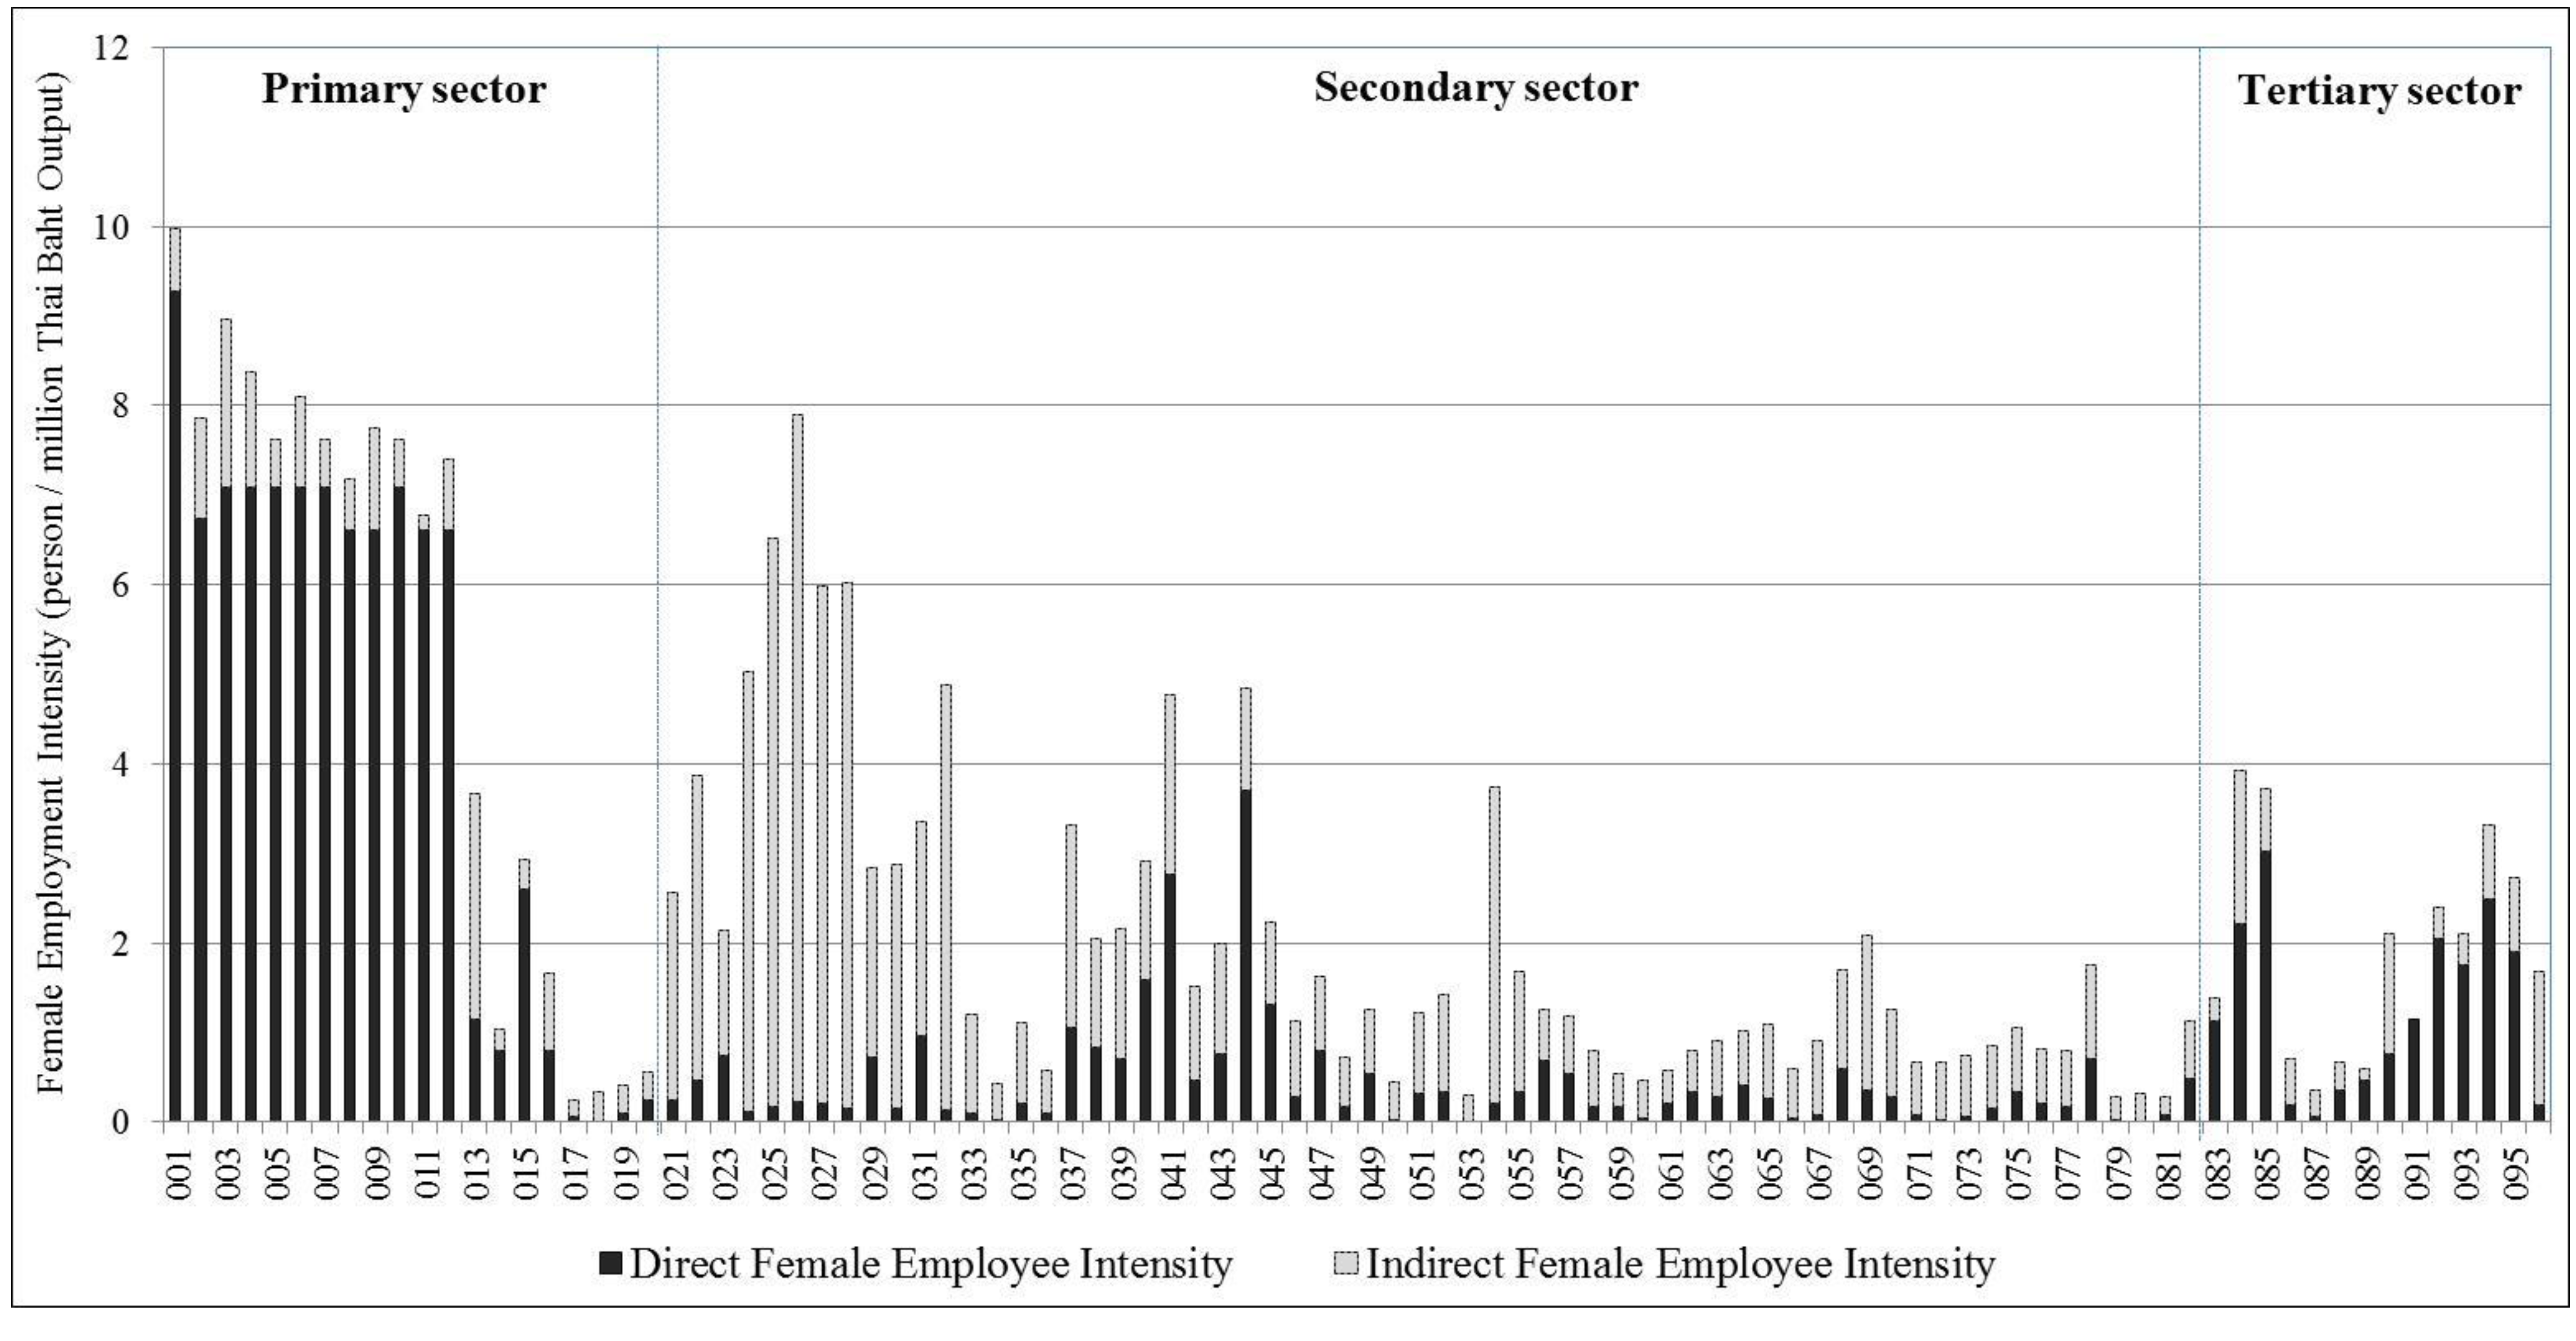
3.2.1. Female Employment Intensity
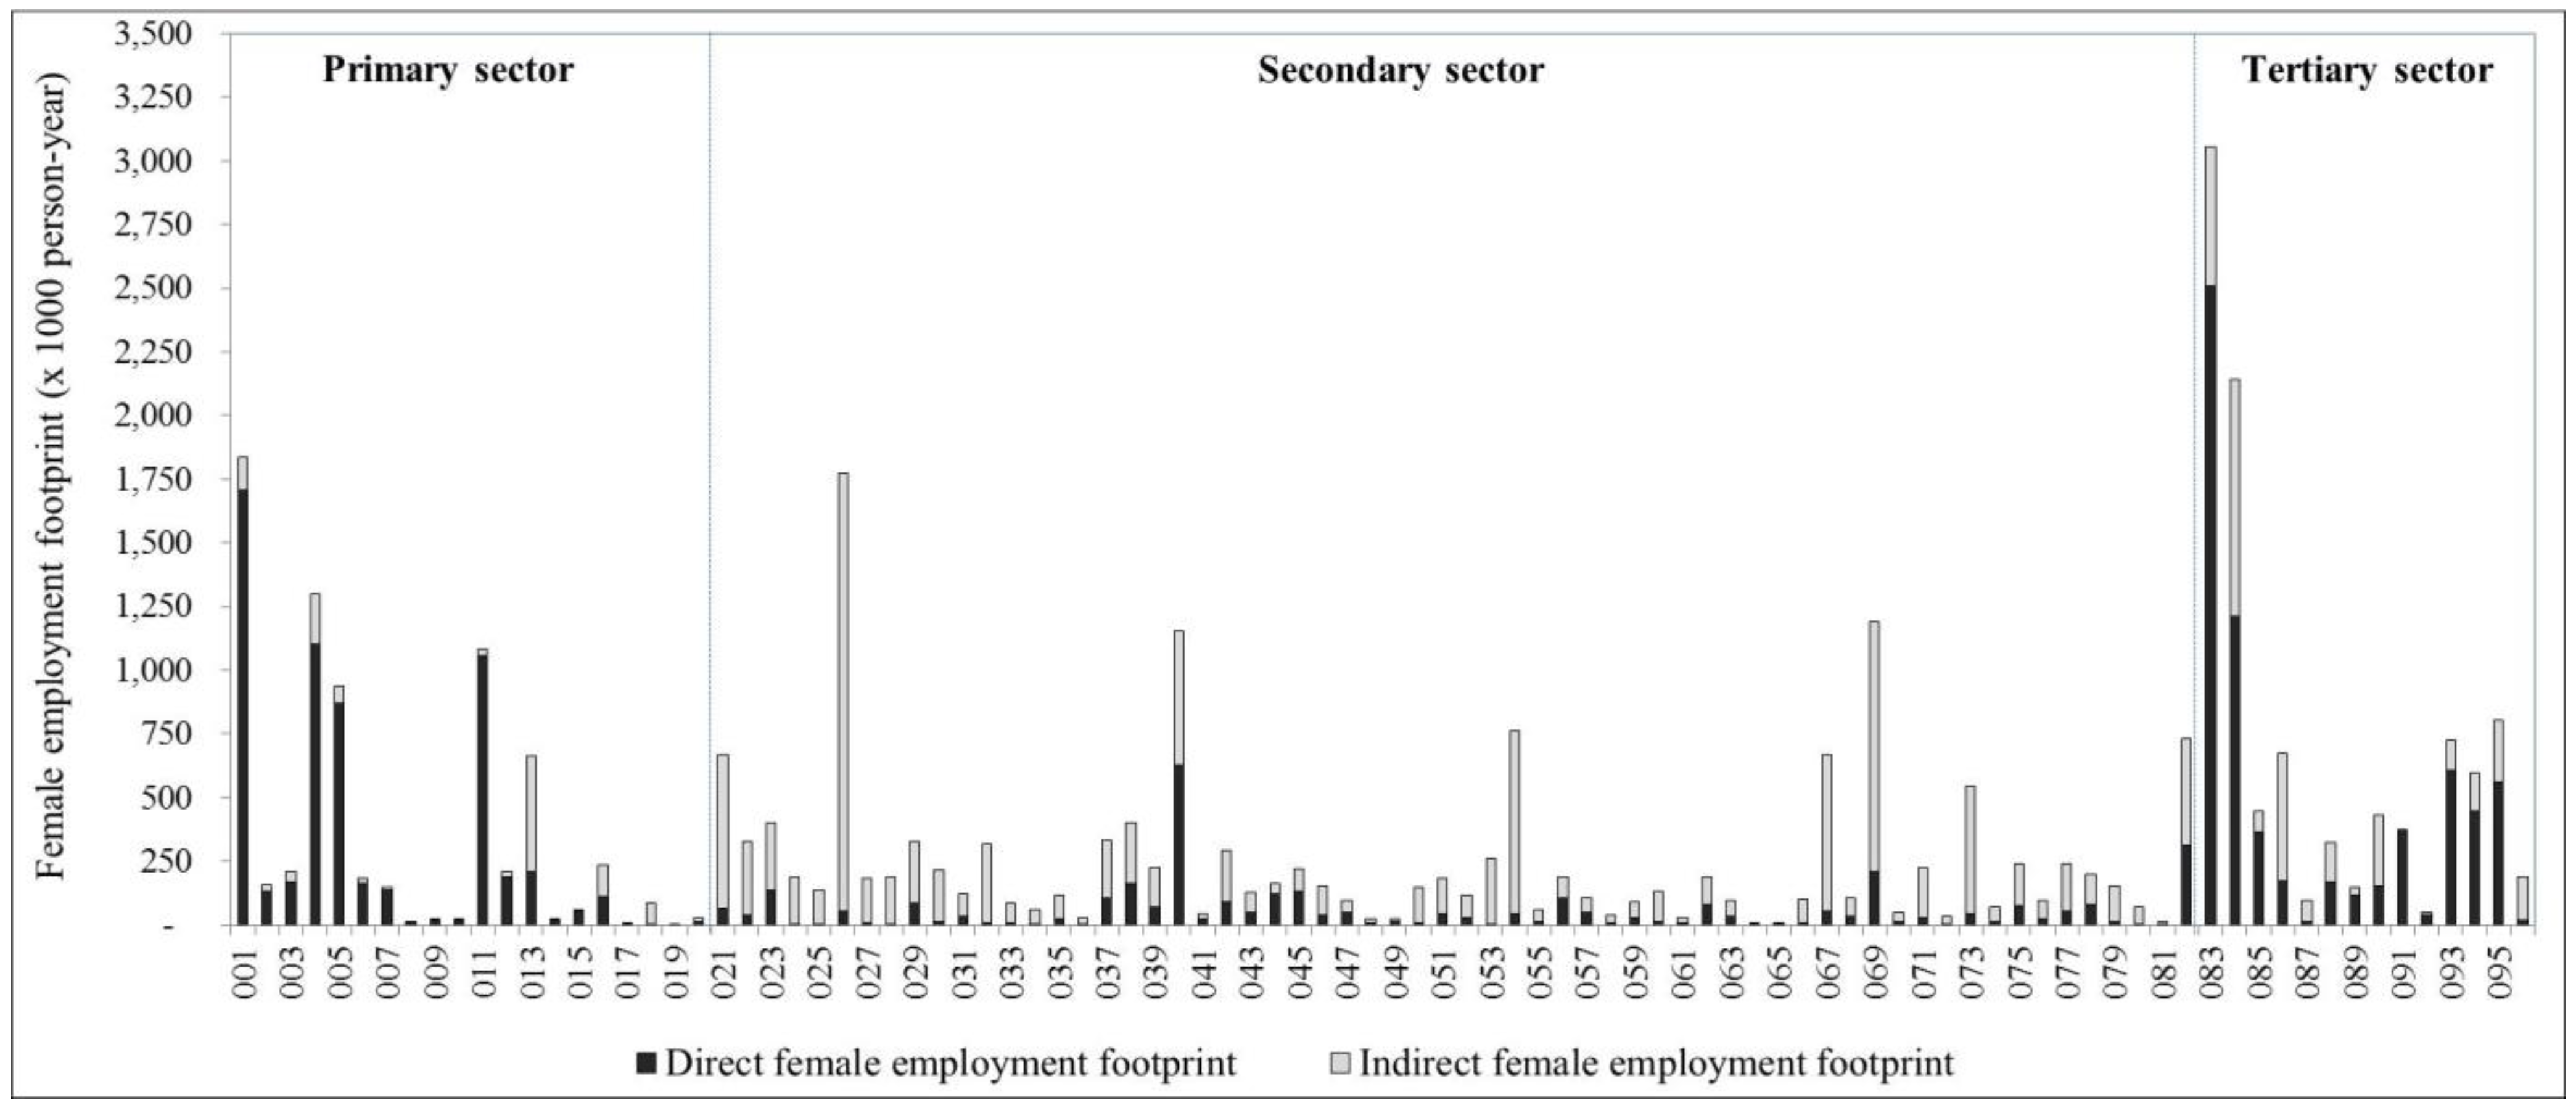
3.2.2. Female Employment Footprint

3.3. Working-Hours
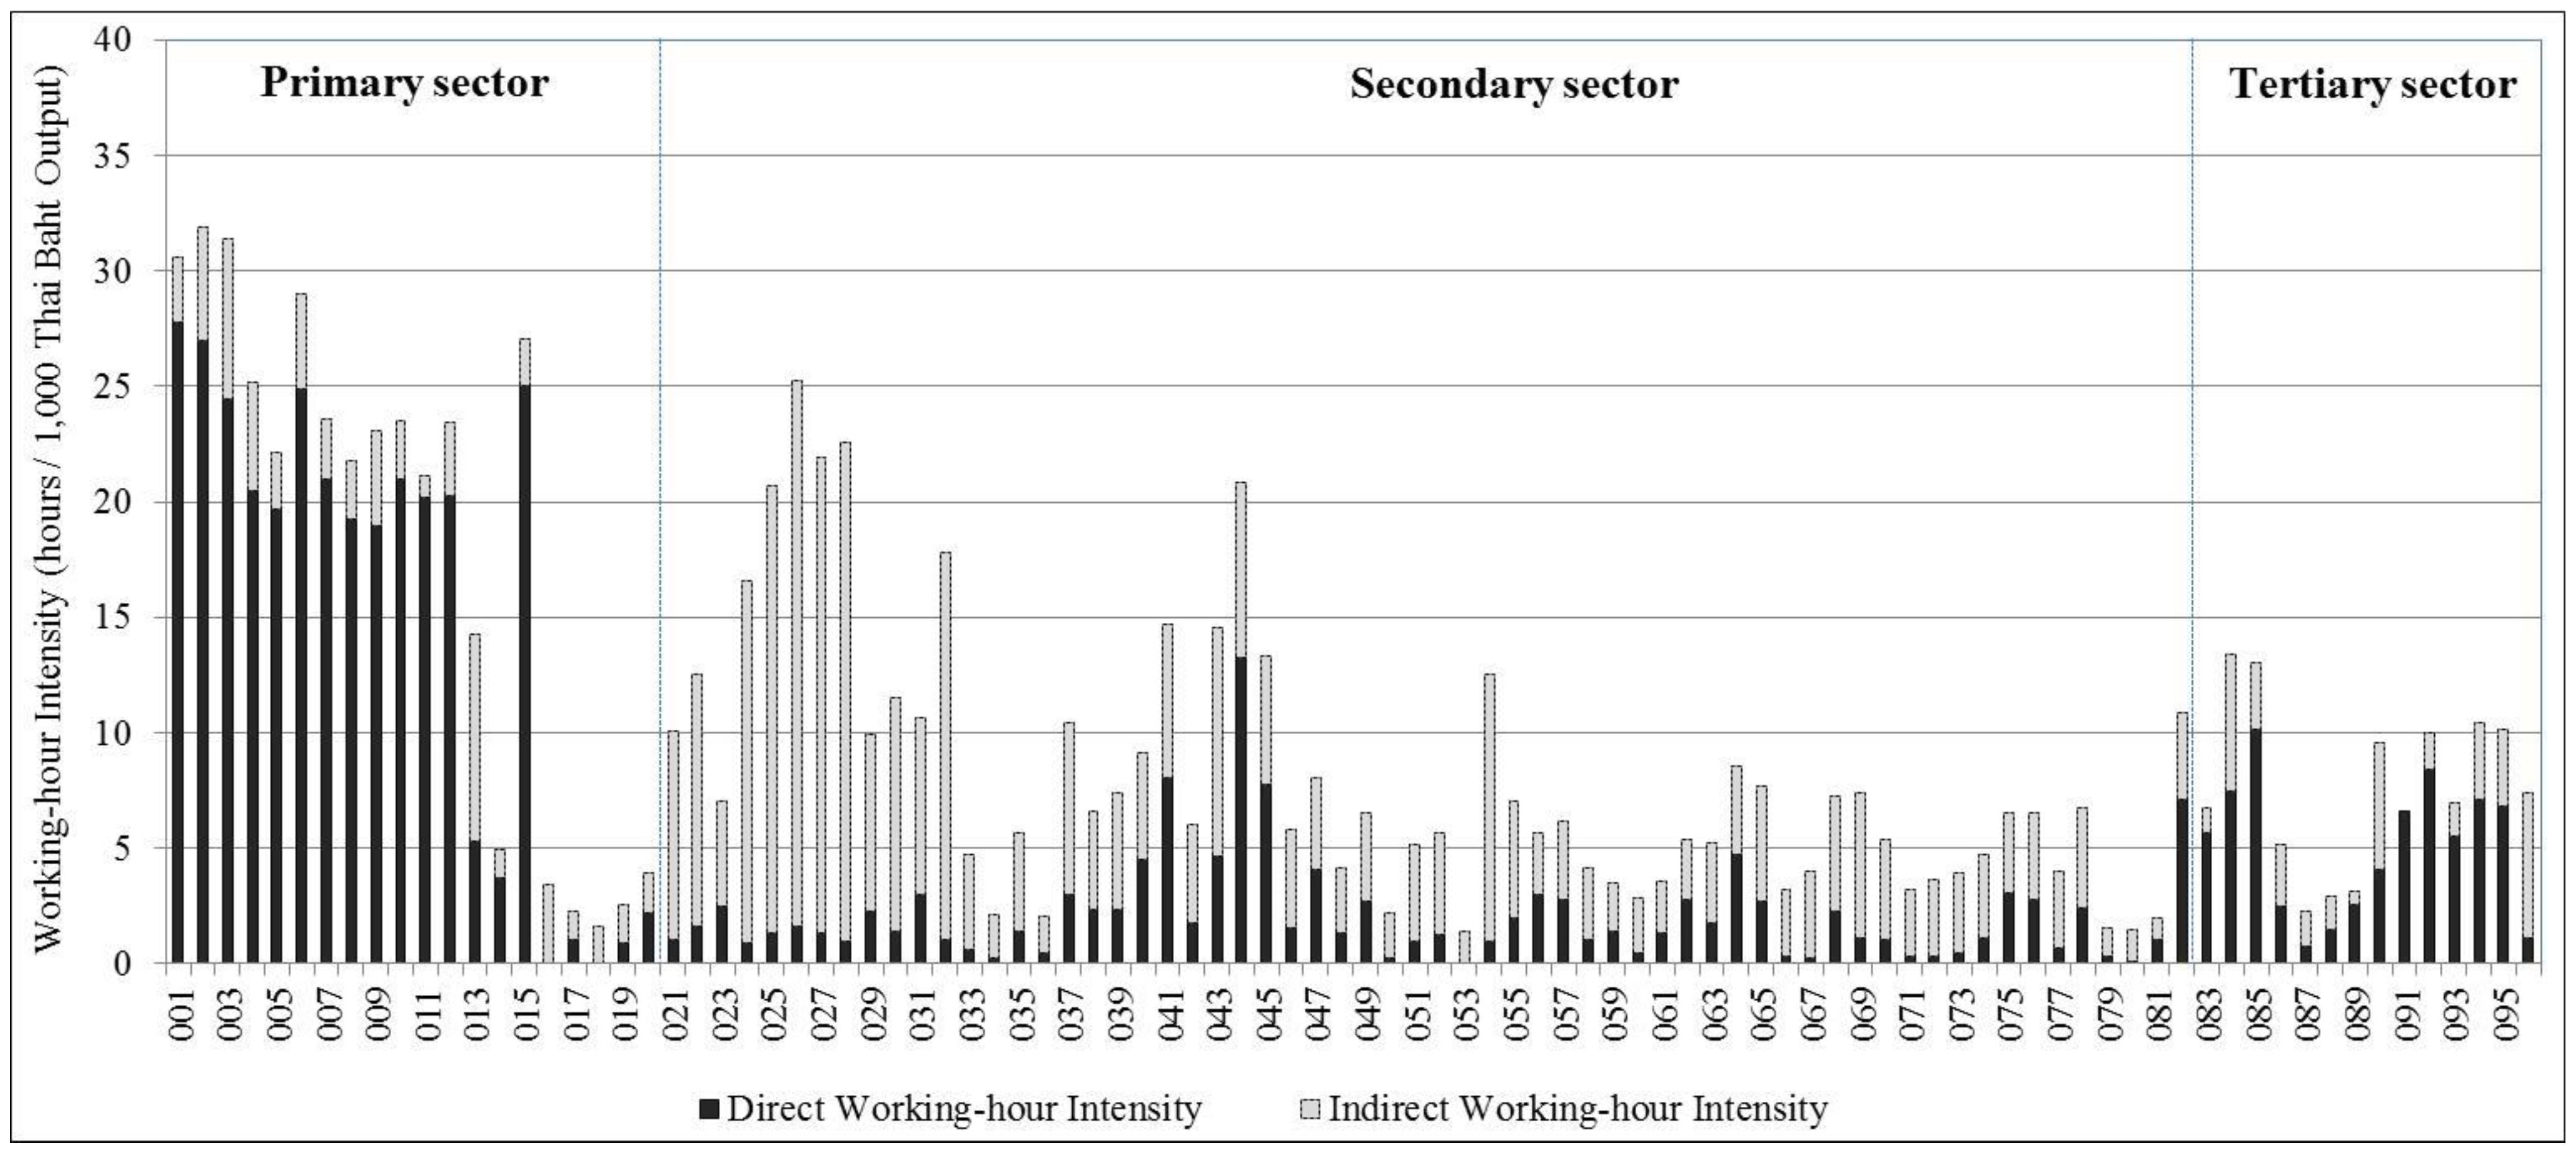
3.3.1. Working Hour Intensity

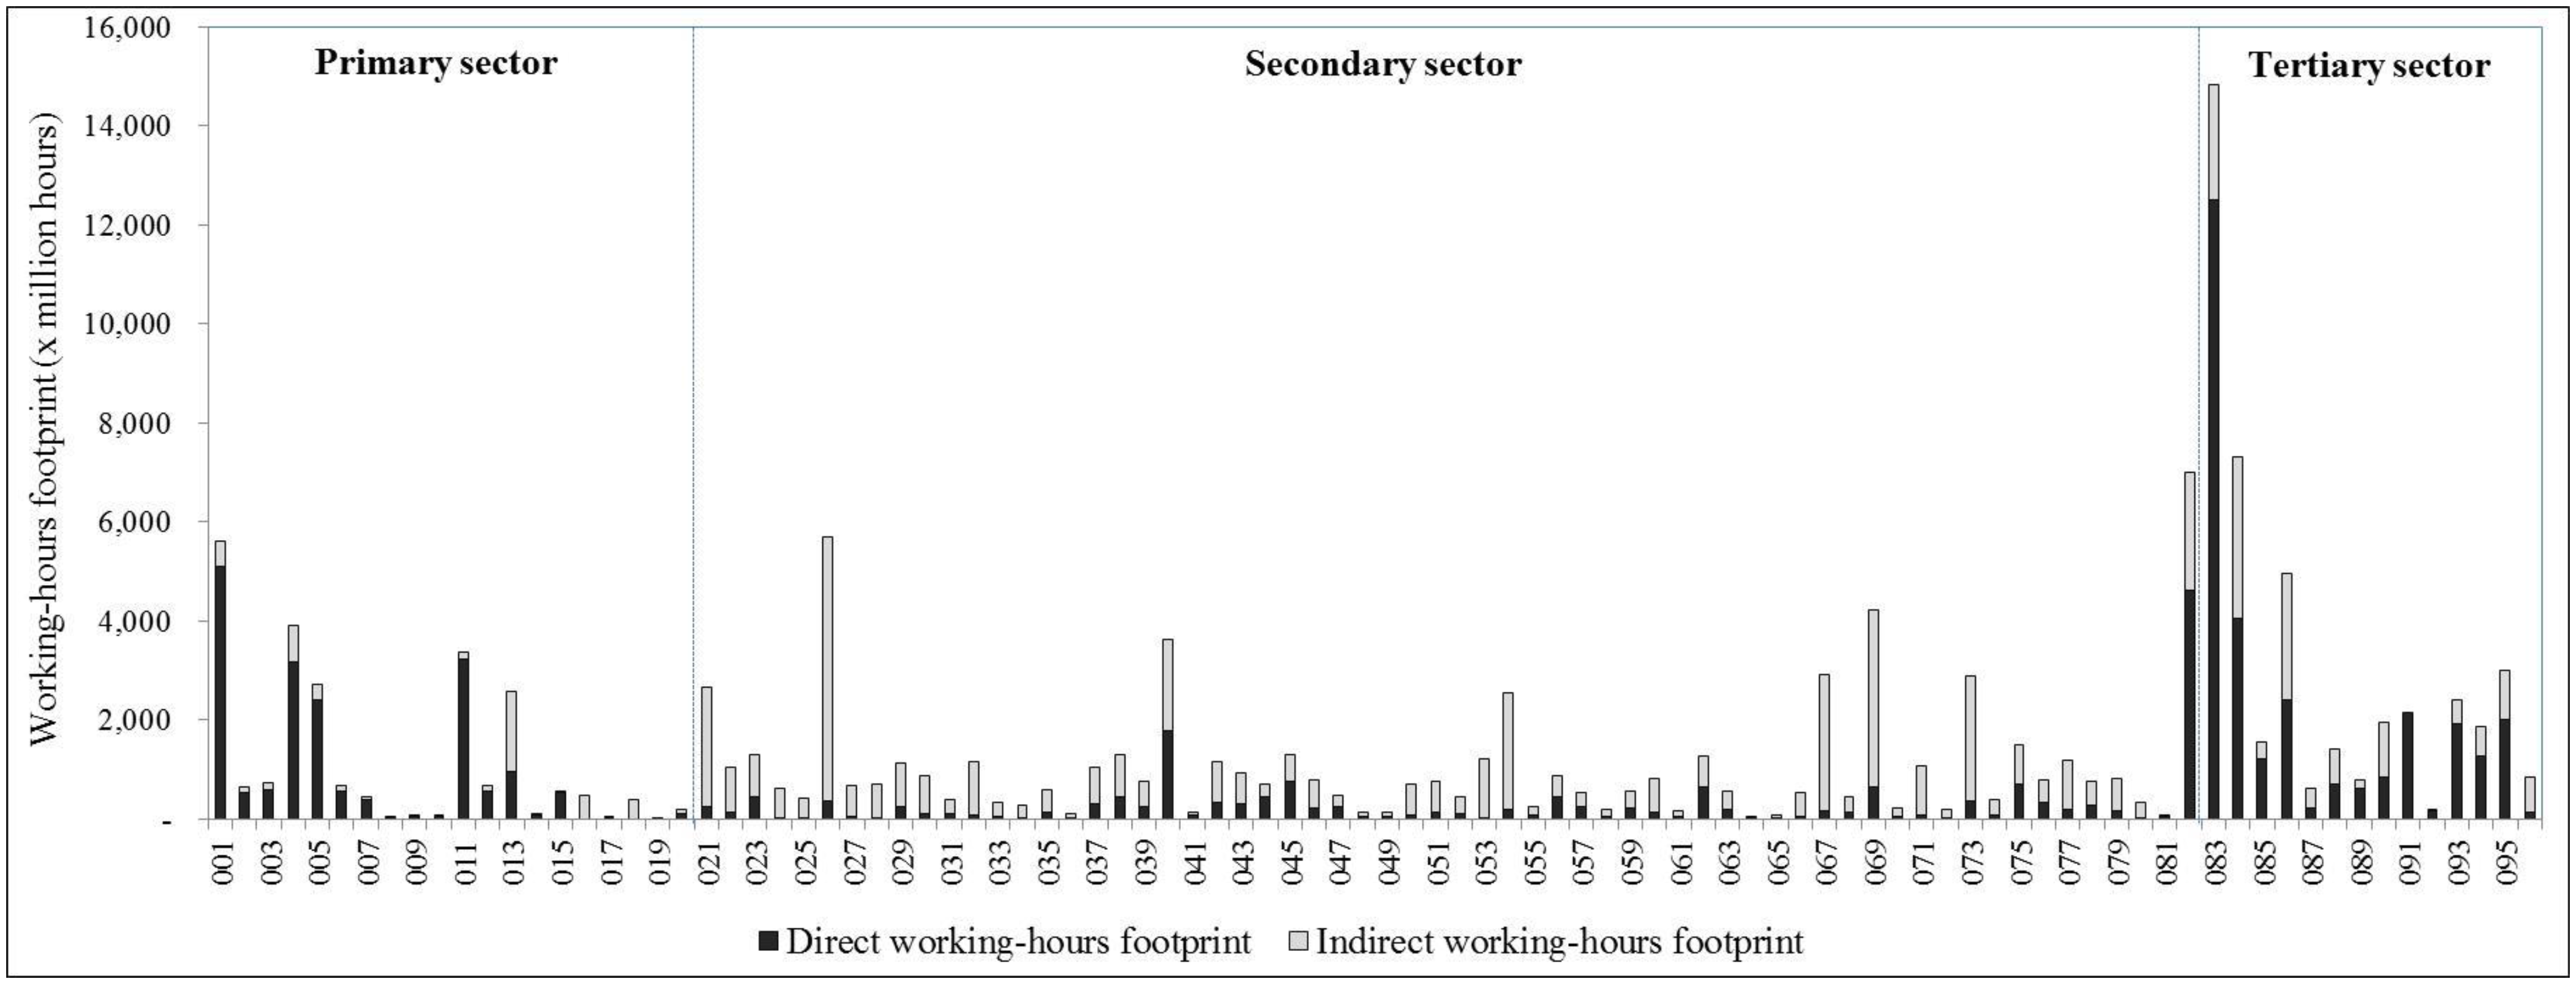
3.3.2. Working Hour Footprint
3.4. Wages
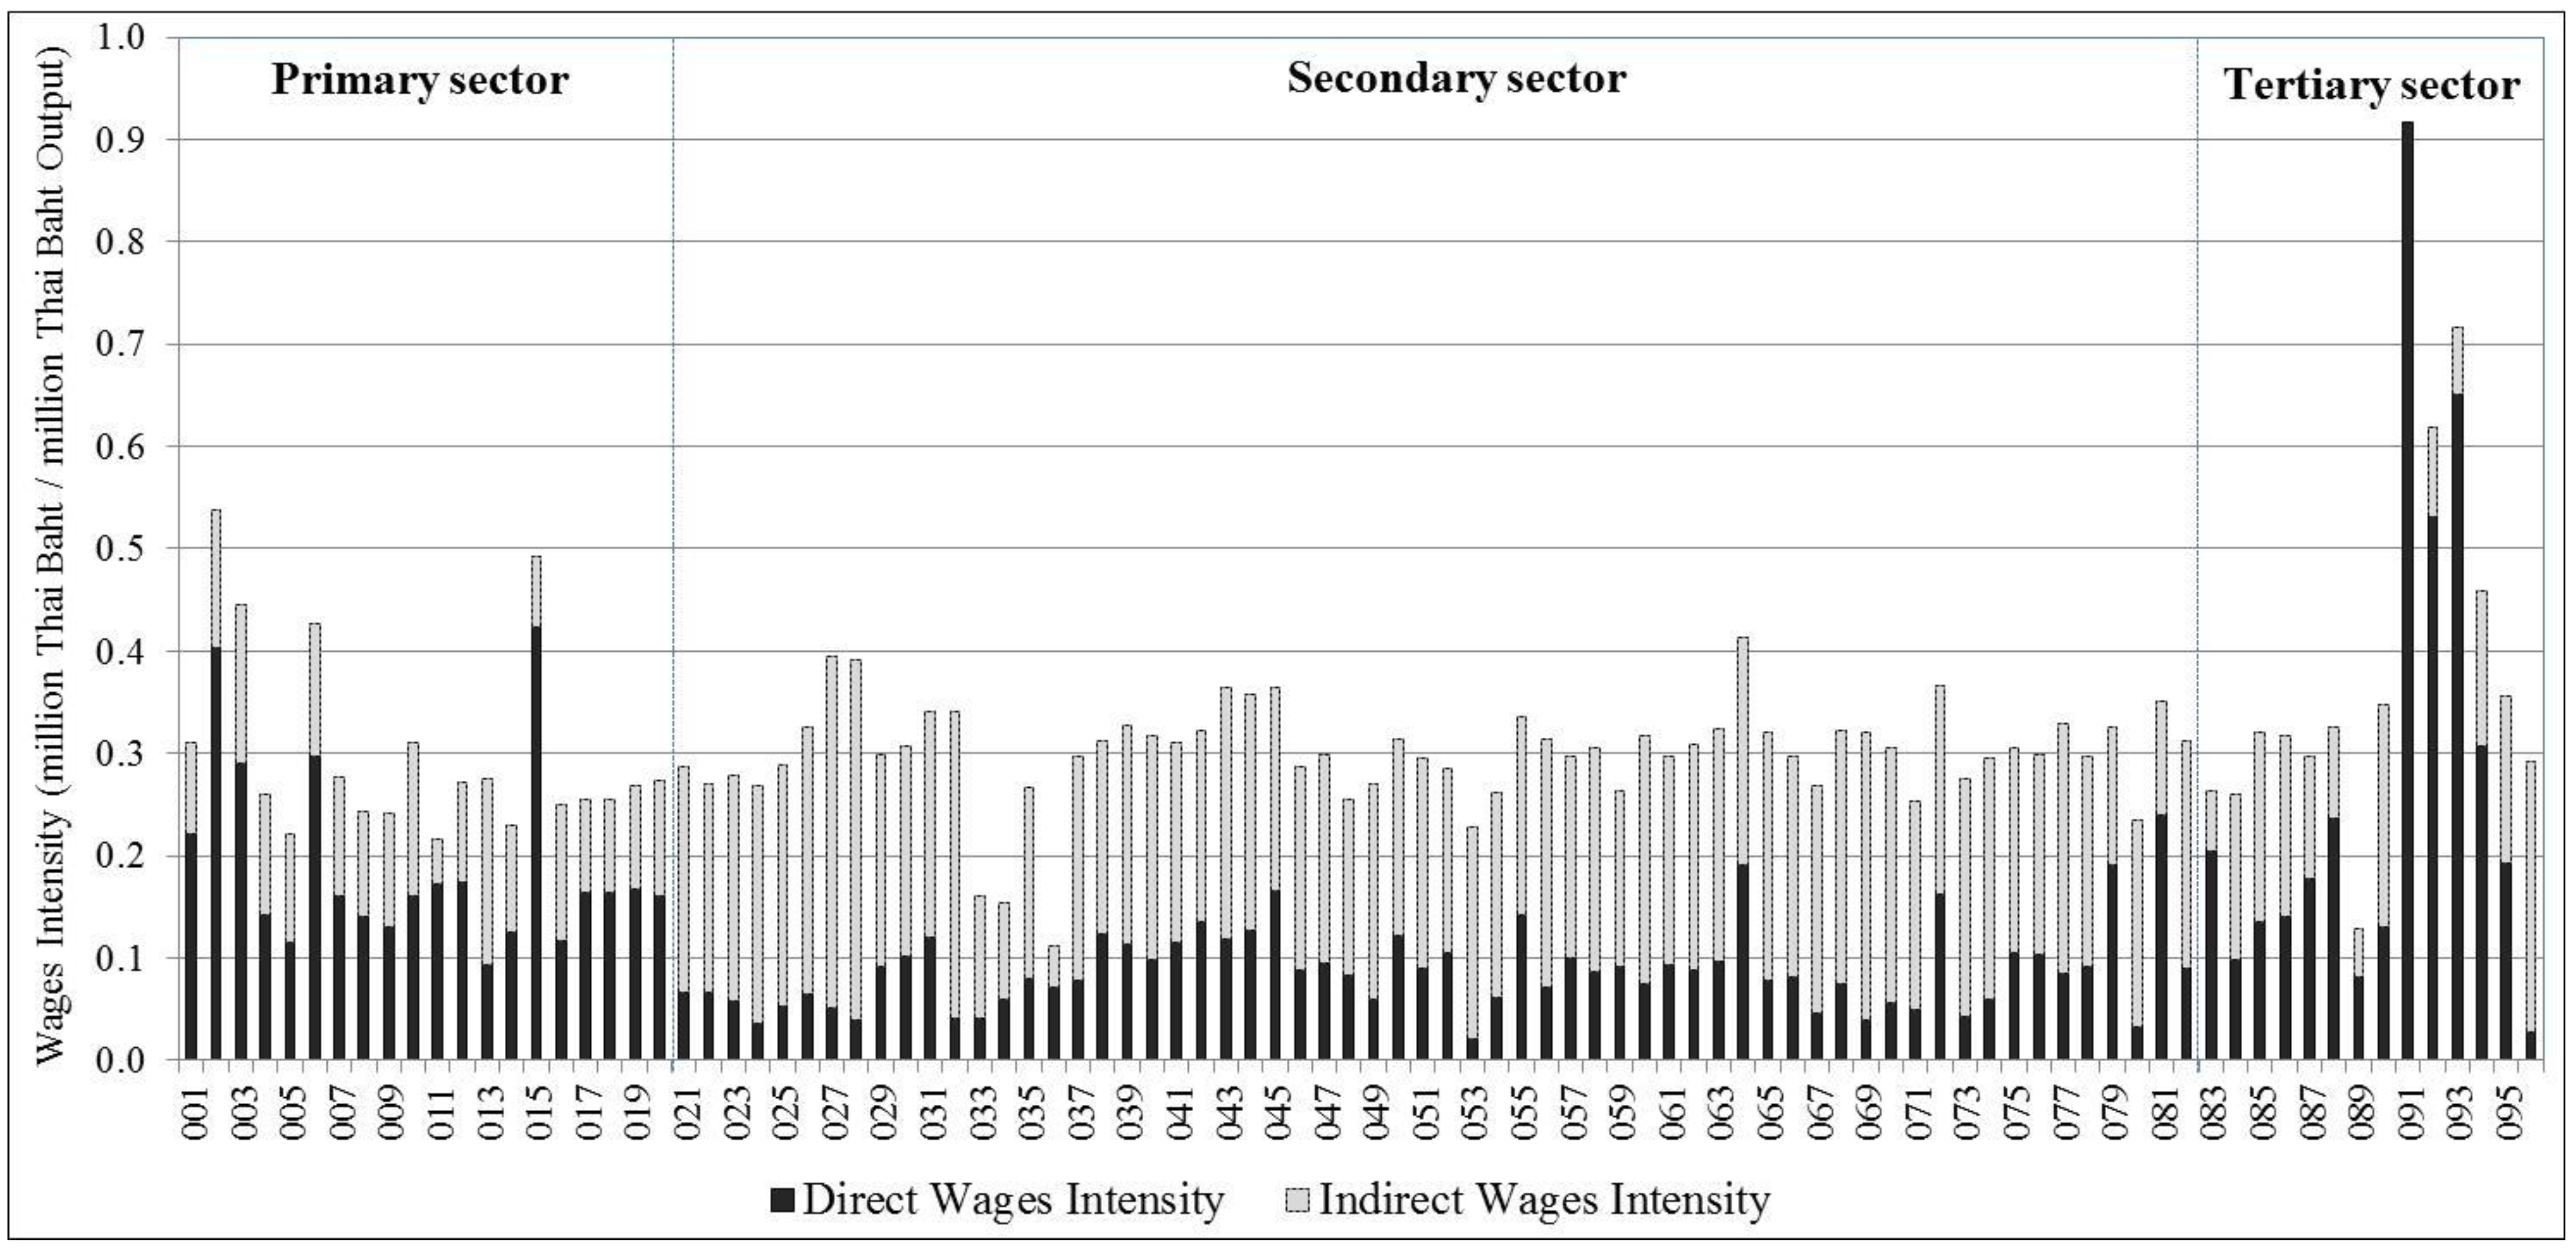
3.4.1. Wages Intensity
3.4.2. Wages Footprint

3.5. Non-Fatal Occupational Injury
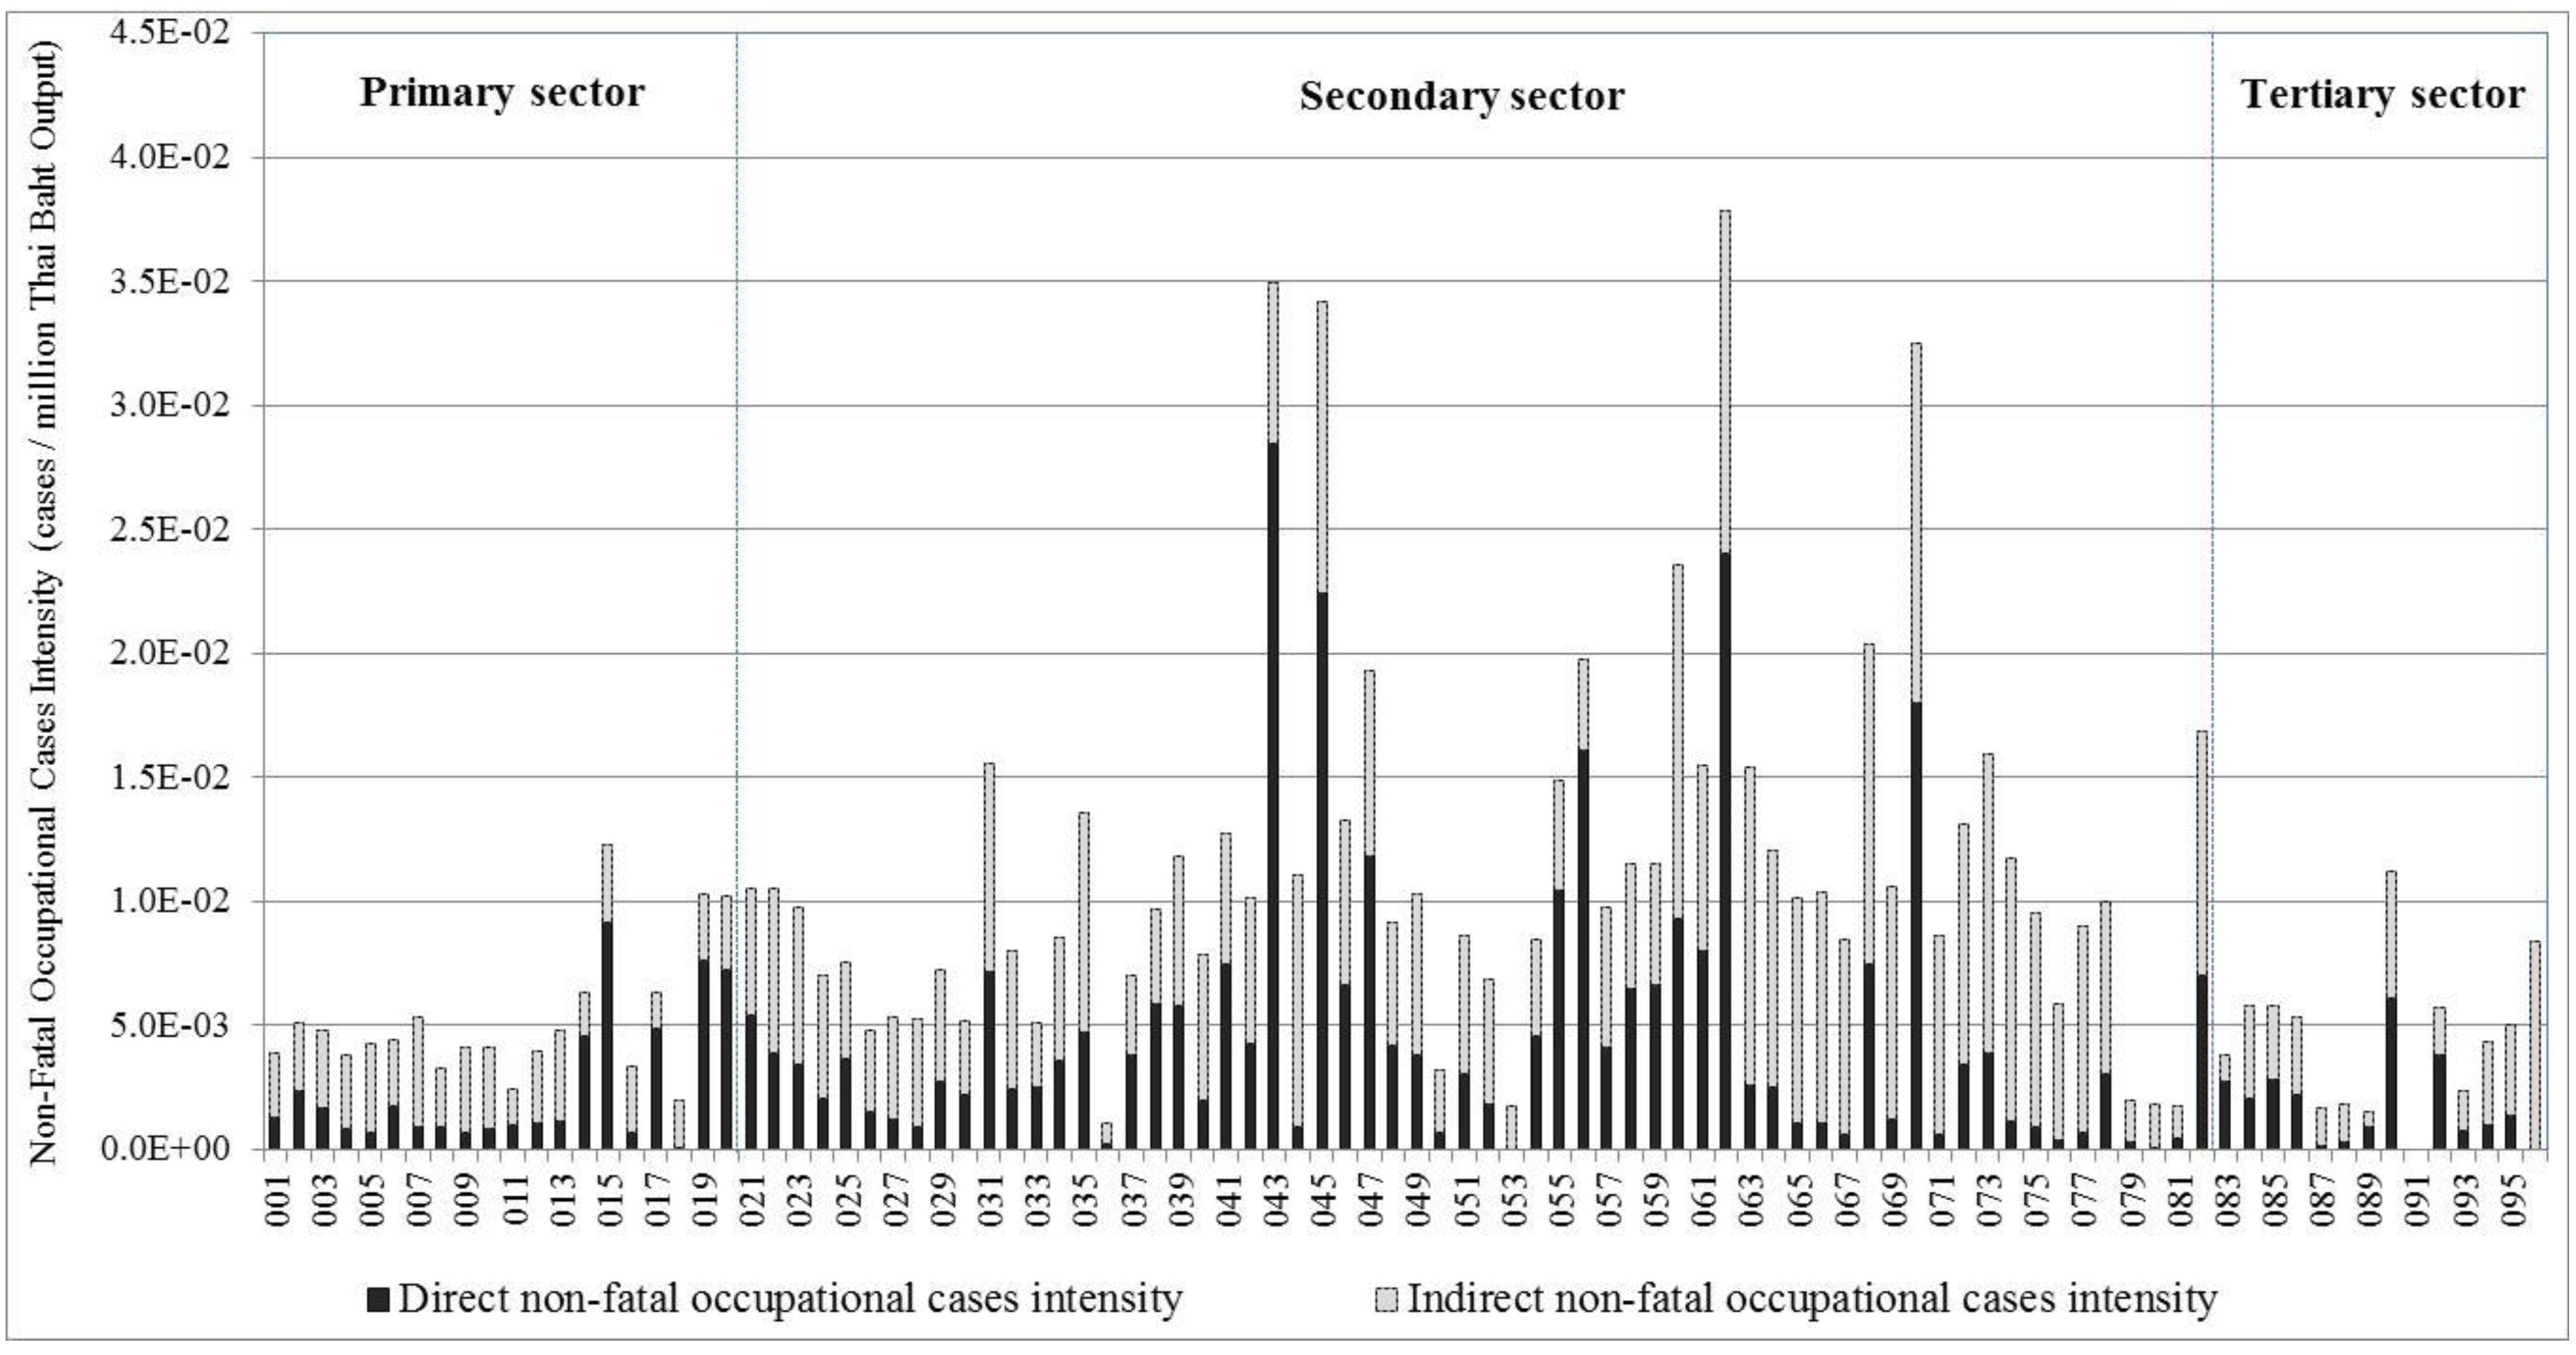
3.5.1. Non-Fatal Occupational Injury Intensity
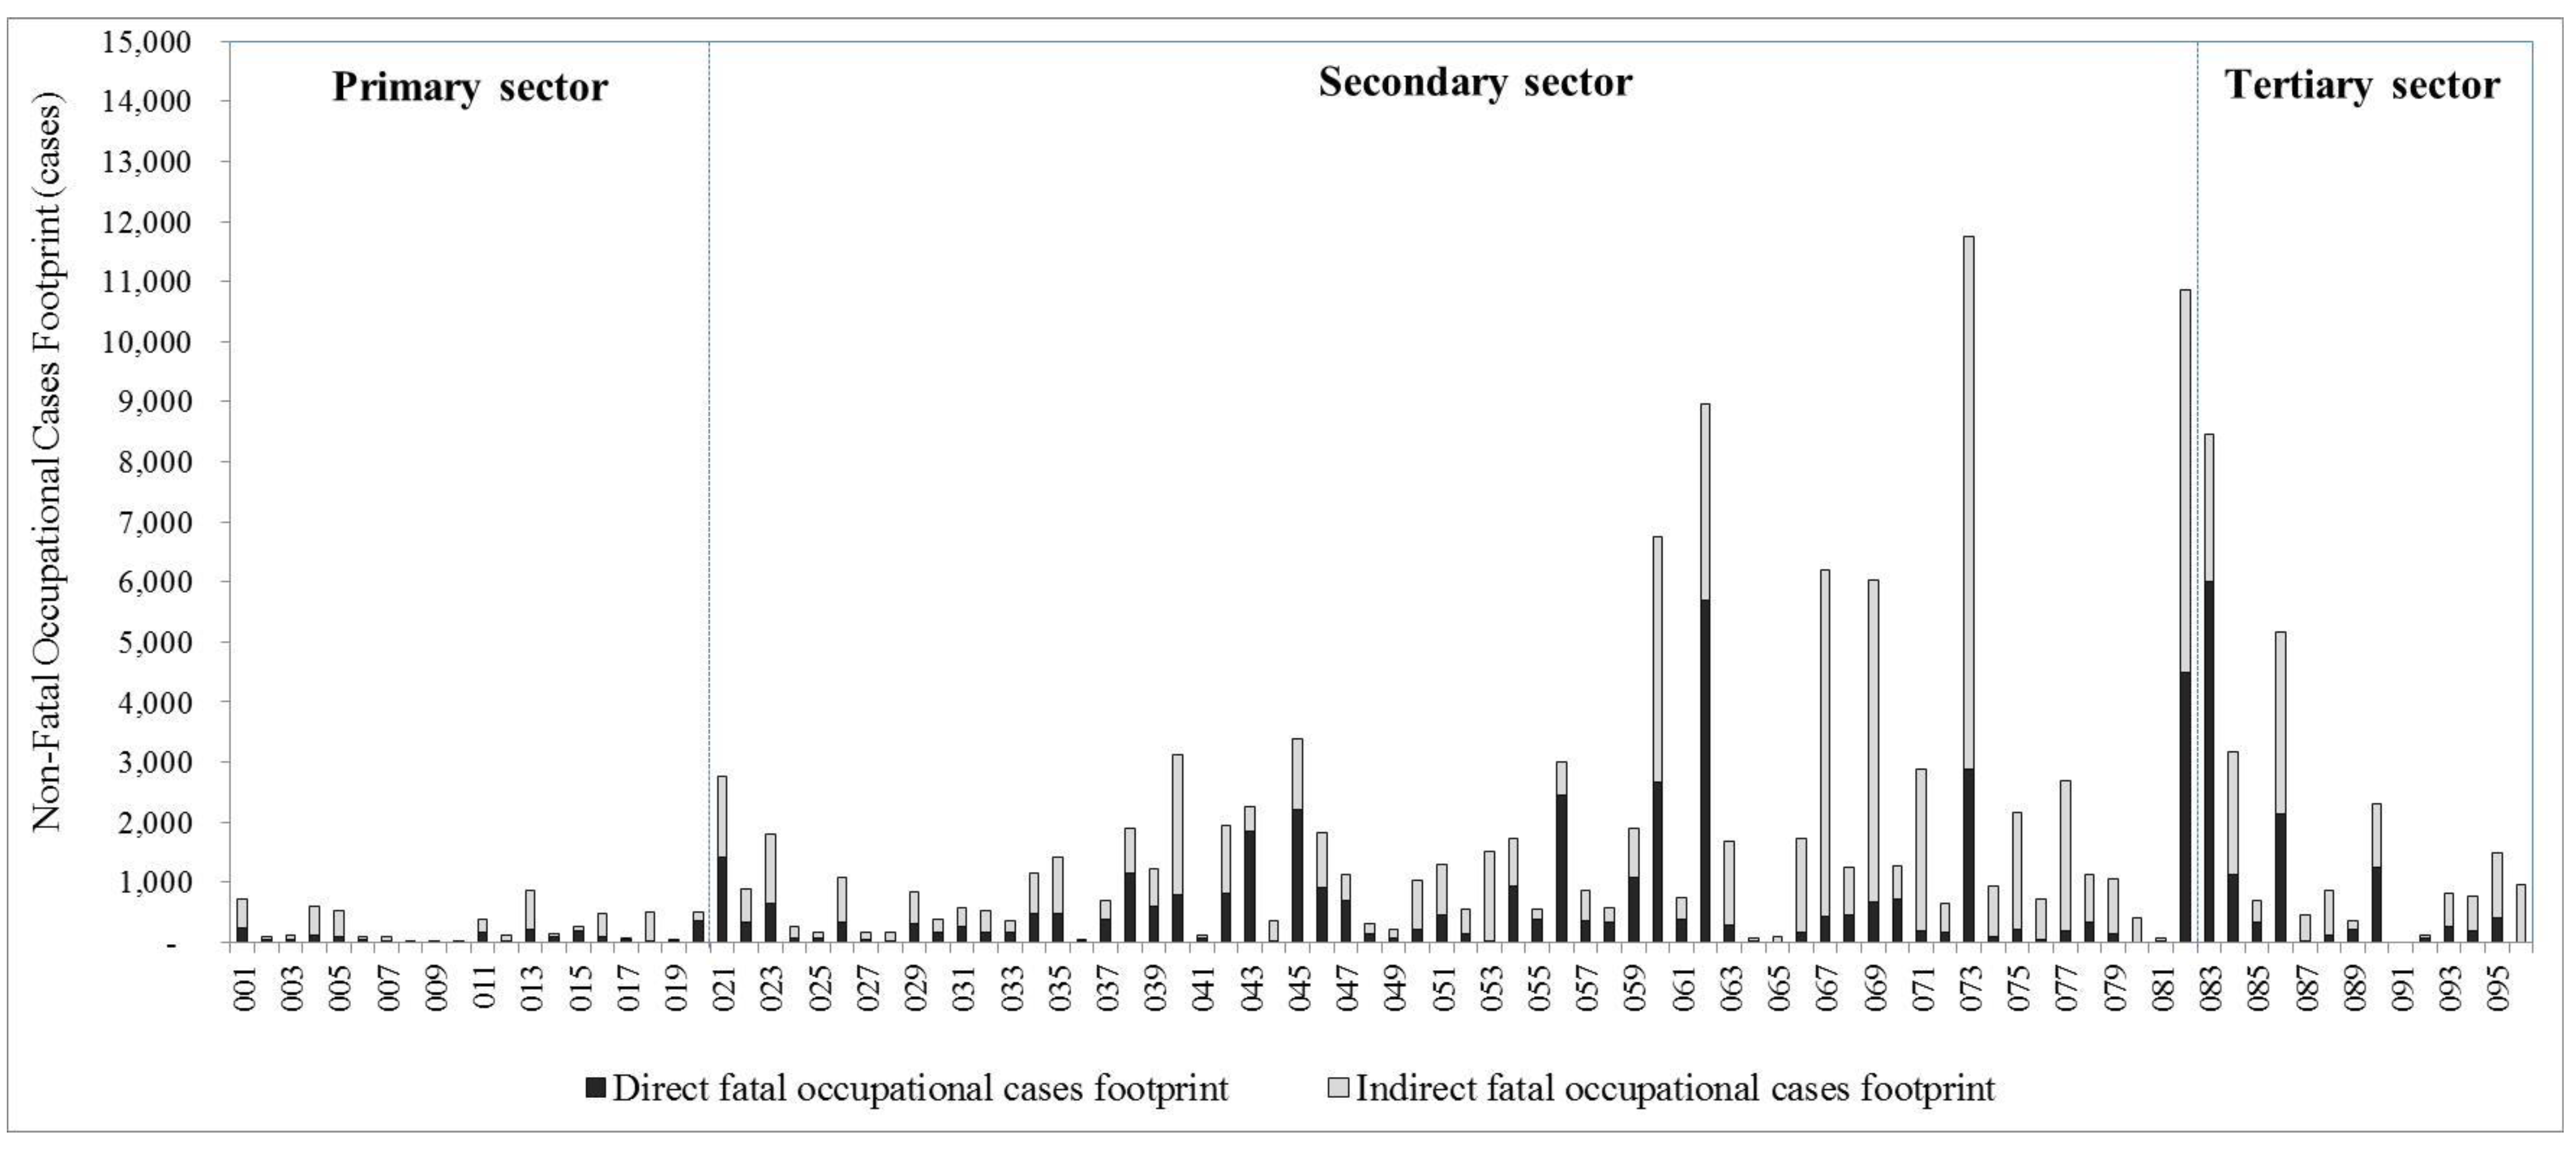
3.5.2. Non-Fatal Occupational Cases Footprint

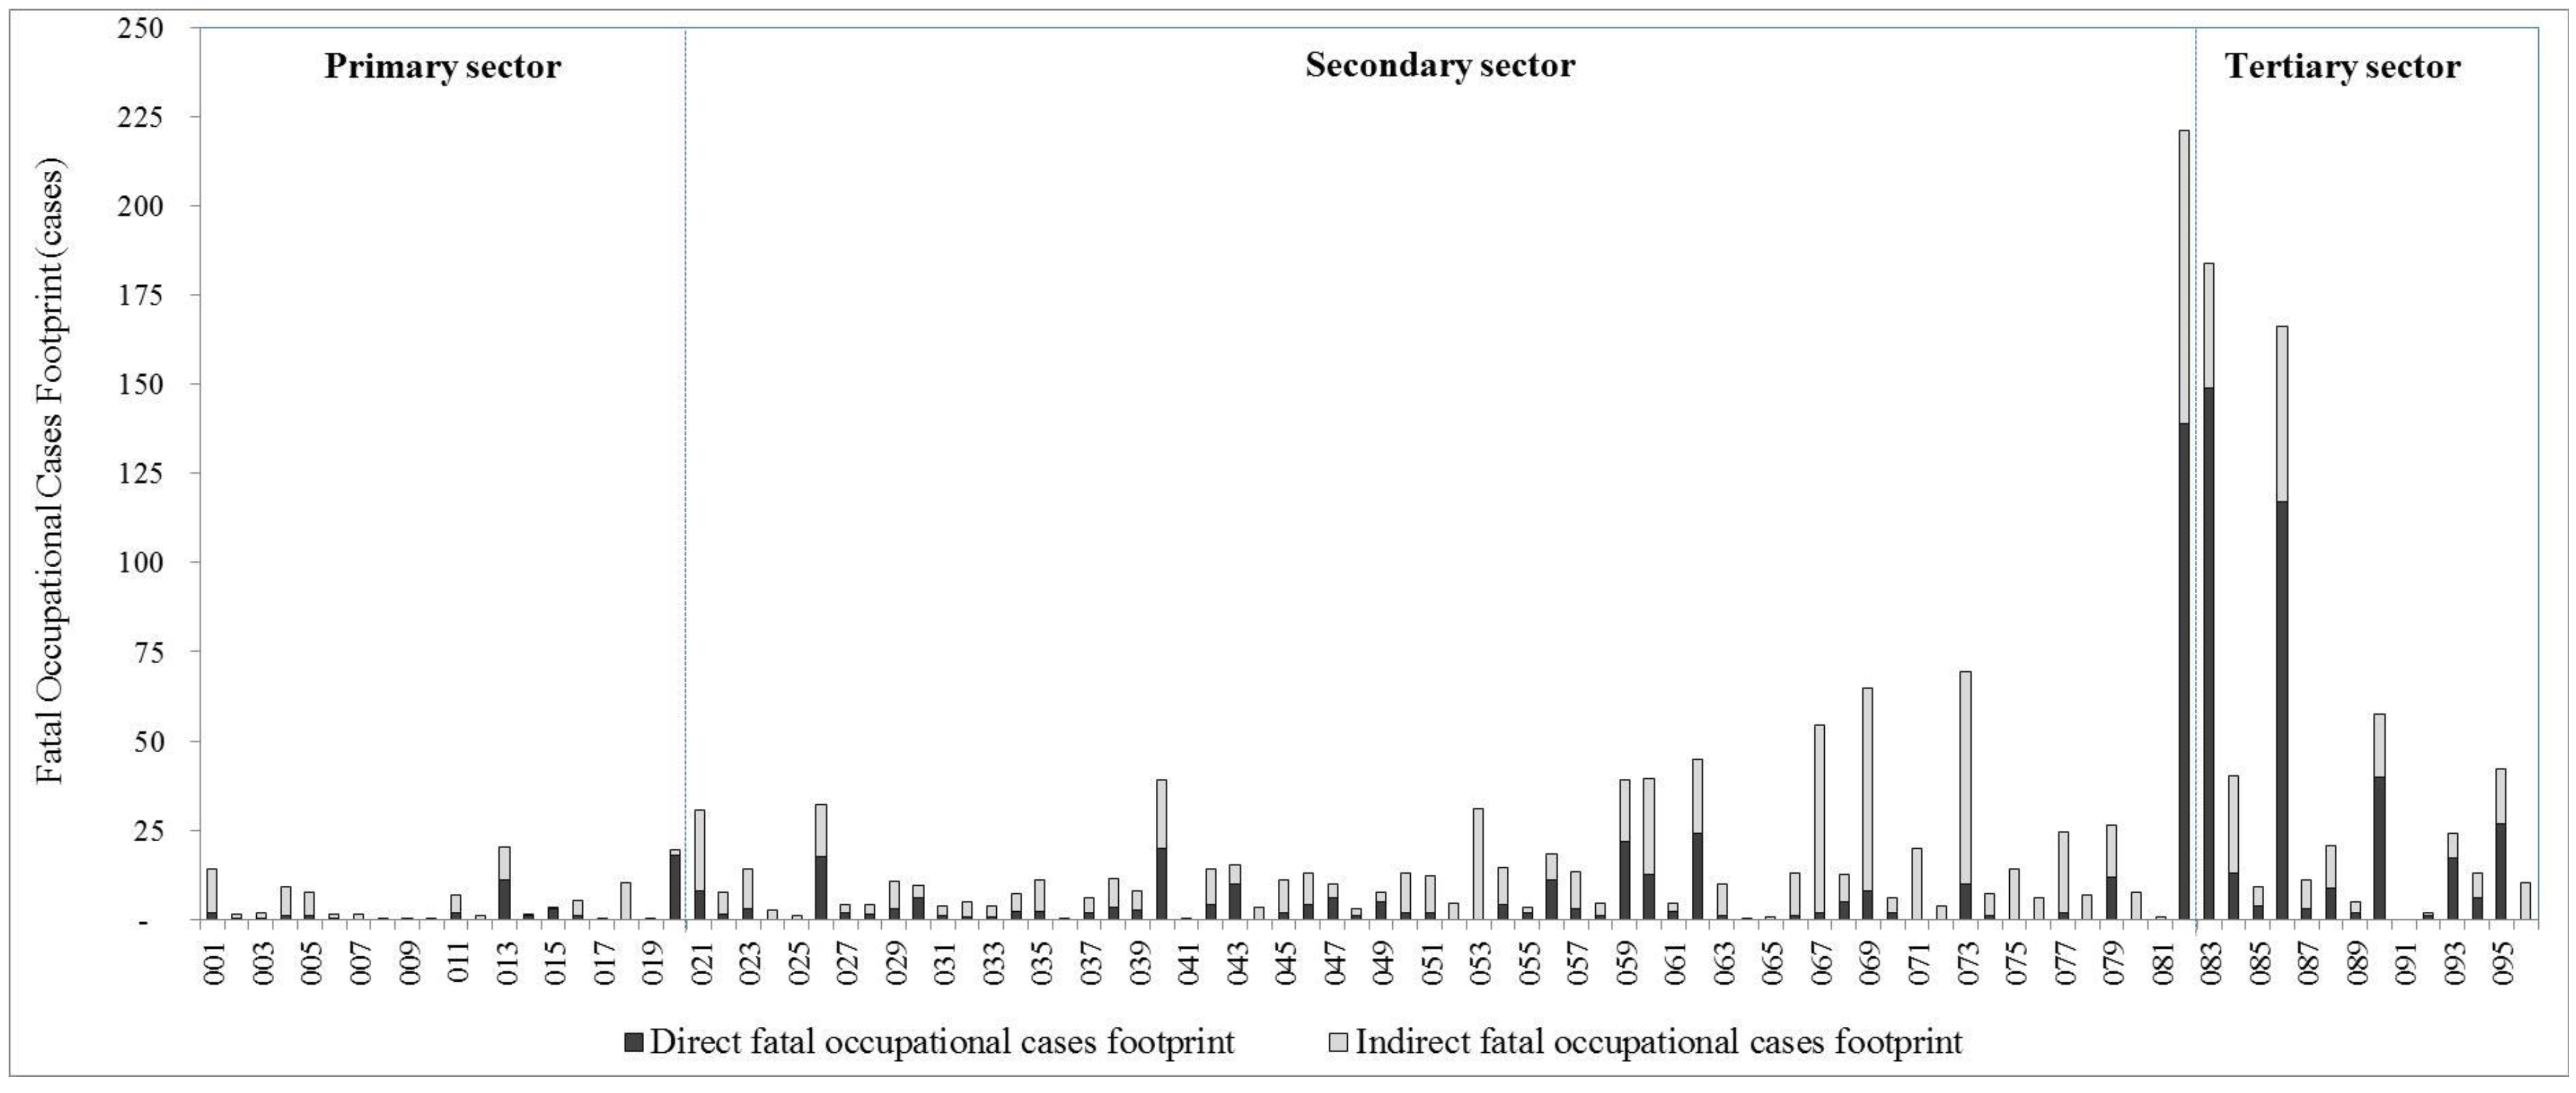
3.6. Fatal Occupational Injury
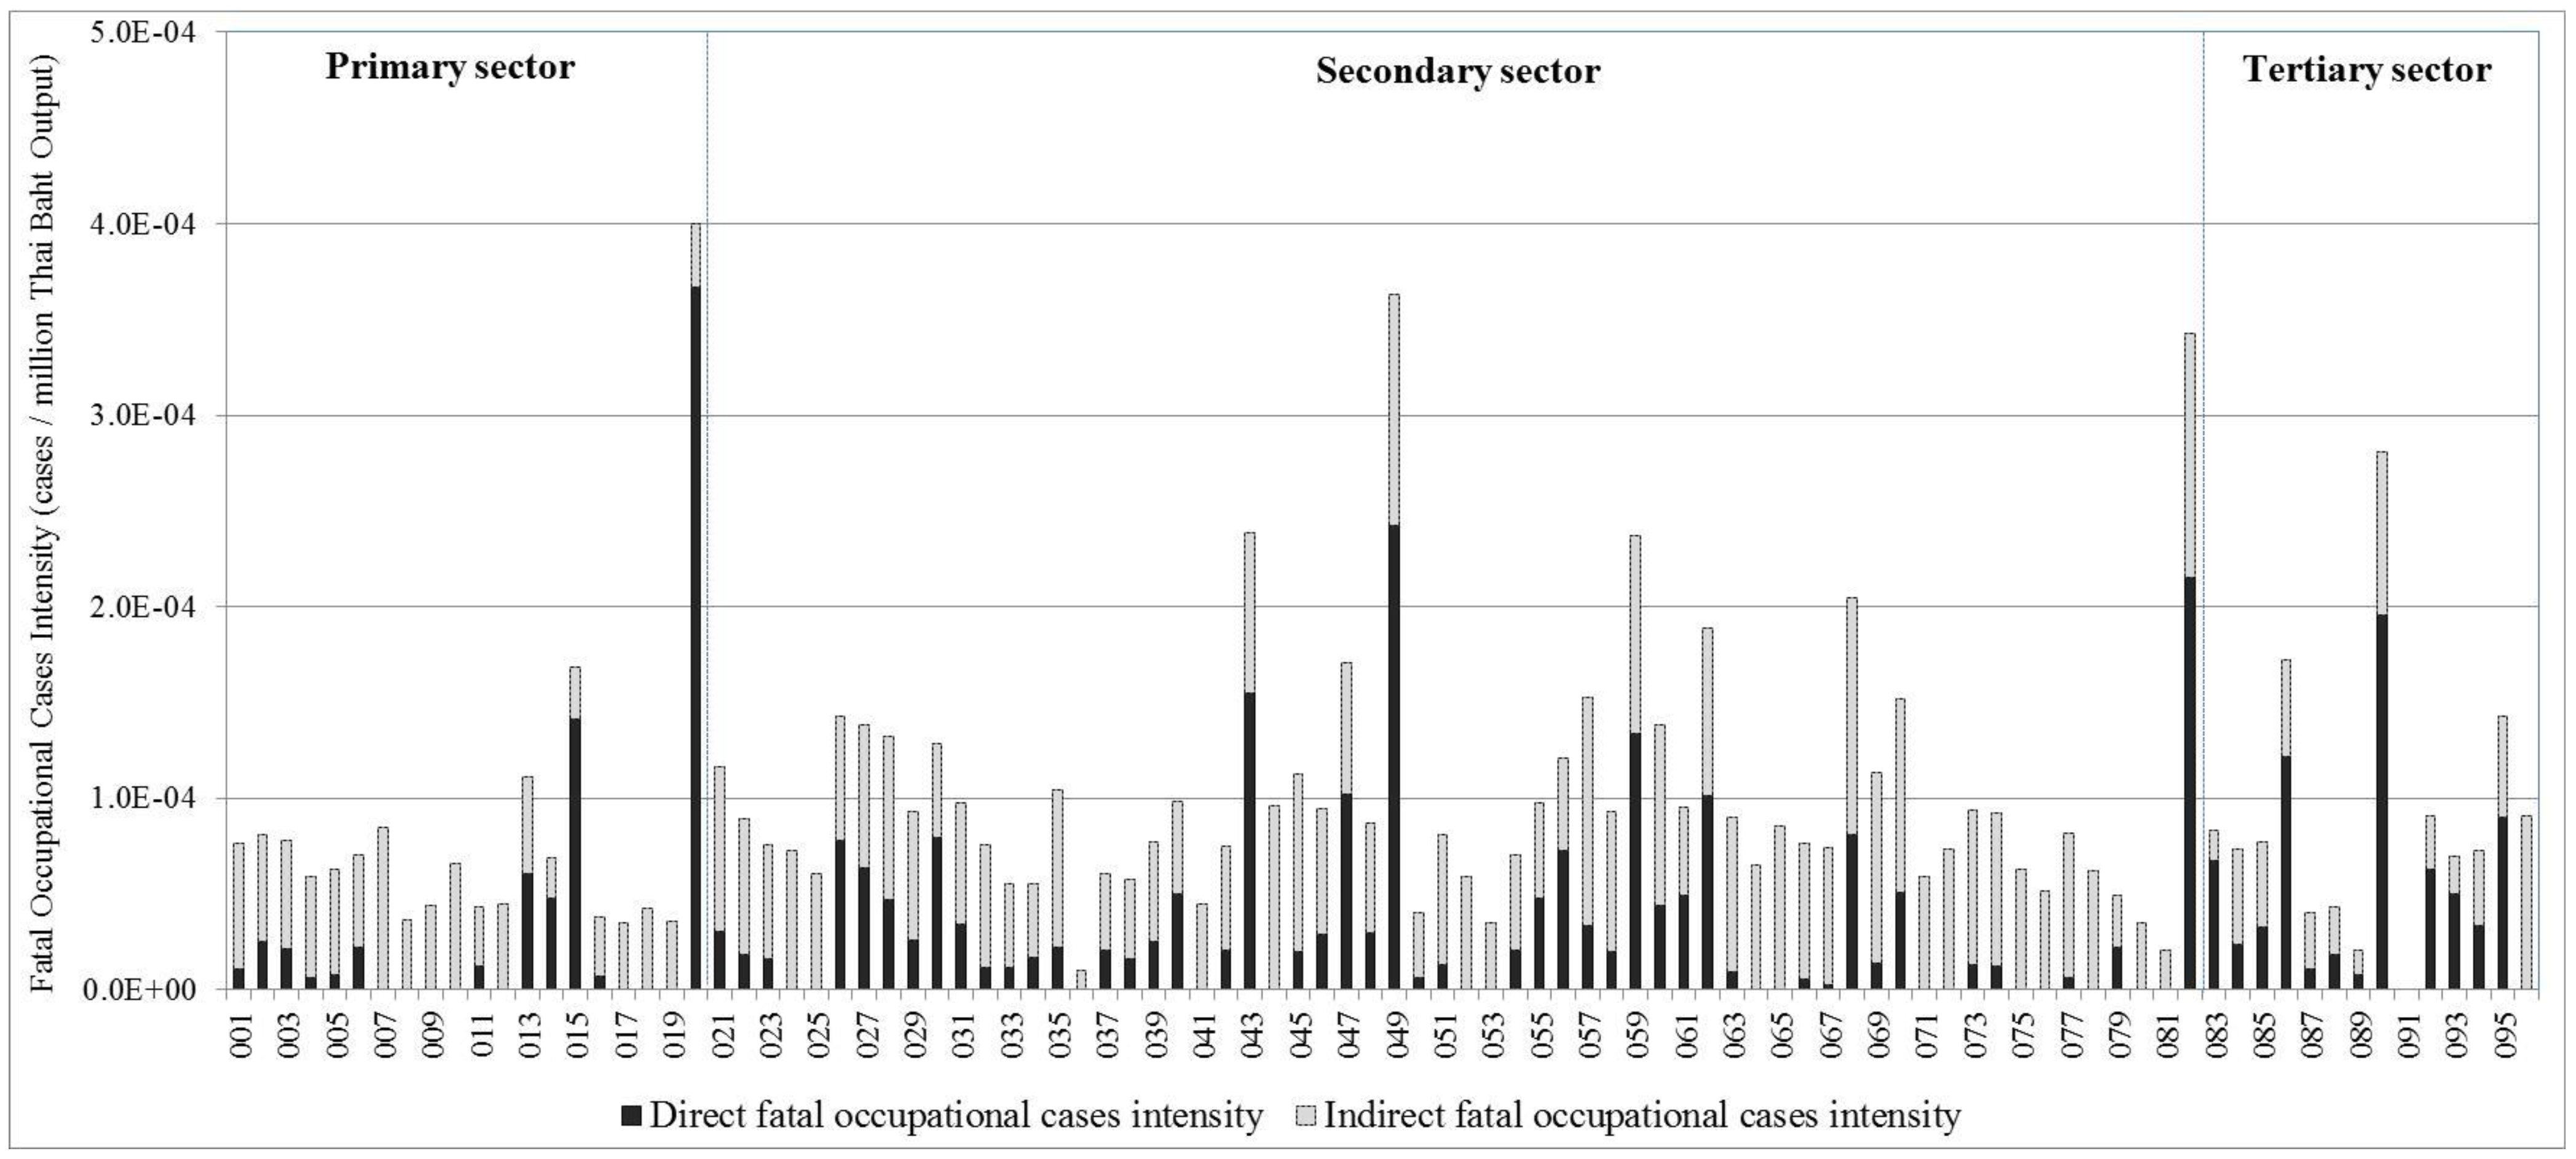
3.6.1. Fatal Occupational Injury Intensity

3.6.2. Fatal Occupational Injury Footprint

3.7. Consumption in Social Footprints
| Issues | Sector | Total Footprint | Domestic Share | Exports Share |
|---|---|---|---|---|
| Total employment footprint (persons-year) | 1. Wholesale and retail trade | 6,373,337 | 86% | 14% |
| 2. Paddy | 4,085,795 | 100% | 0% | |
| 3. Rice milling and grinding of maize | 4,006,438 | 62% | 38% | |
| 4. Restaurant and drinking places | 3,899,616 | 88% | 12% | |
| 5. Construction | 3,228,436 | 100% | 0% | |
| 6. Bean and vegetables | 2,894,725 | 95% | 5% | |
| 7. Rubber | 2,413,161 | 84% | 16% | |
| 8. Transportation | 2,303,101 | 66% | 34% | |
| 9. Fruits | 2,089,589 | 96% | 5% | |
| 10. Radio and television | 1,917,277 | 4% | 96% | |
| Female employment footprint (persons-year) | 1. Wholesale and retail | 3,056,033 | 86% | 14% |
| 2. Restaurant and drinking places | 2,139,324 | 88% | 12% | |
| 3. Paddy | 1,835,384 | 100% | 0% | |
| 4. Rice milling and grinding of maize | 1,776,372 | 62% | 38% | |
| 5. Bean and vegetables | 1,300,323 | 95% | 5% | |
| 6. Radio and television | 1,191,804 | 4% | 96% | |
| 7. Wearing apparels except footwear | 1,153,195 | 67% | 33% | |
| 8. Rubber | 1,084,353 | 84% | 16% | |
| 9. Fruits | 937,153 | 96% | 4% | |
| 10. Rubber products, tires and tubes | 764,558 | 35% | 65% | |
| Worked hours footprint (million hours-year) | 1. Wholesale and retail trade | 14,820 | 86% | 14% |
| 2. Restaurant and drinking places | 7304 | 88% | 12% | |
| 3. Construction | 6997 | 100% | 0% | |
| 4. Rice milling and grinding of maize | 5683 | 62% | 38% | |
| 5. Paddy | 5625 | 100% | 0% | |
| 6. Transportation | 4972 | 66% | 34% | |
| 7. Radio and television | 4223 | 4% | 96% | |
| 8. Bean and vegetables | 3901 | 95% | 5% | |
| 9. Wearing apparels except footwear | 3622 | 67% | 33% | |
| 10. Rubber | 3375 | 84% | 16% | |
| Wages footprint (million Thai Baht) | 1. Wholesale and retail trade | 579,949 | 86% | 14% |
| 2. Transportation | 305,861 | 66% | 34% | |
| 3. Public administration | 298,720 | 100% | 0% | |
| 4. Education and research | 247,547 | 100% | 0% | |
| 5. Motor vehicle | 202,985 | 59% | 41% | |
| 6. Construction | 202,219 | 100% | 0% | |
| 7. Petroleum refineries products | 201,174 | 82% | 18% | |
| 8. Electrical industrial machinery | 197,261 | 18% | 82% | |
| 9. Radio and television | 183,232 | 4% | 96% | |
| 10. Electricity generation | 174,758 | 100% | 0% | |
| Fatal occupational injury footprint (cases-year) | 1. Construction | 221 | 100% | 0% |
| 2. Wholesale and retail trade | 184 | 86% | 14% | |
| 3. Transportation | 166 | 66% | 34% | |
| 4. Motor vehicle | 69 | 59% | 41% | |
| 5. Radio and television | 65 | 4% | 96% | |
| 6. Business services | 57 | 92% | 8% | |
| 7. Electrical industrial machinery | 54 | 18% | 82% | |
| 8. Metal products | 45 | 57% | 43% | |
| 9. Iron and steel | 40 | 76% | 24% | |
| 10. Restaurant and drinking places | 40 | 88% | 12% | |
| Non-fatal occupational injury footprint (cases-year) | 1. Motor Vehicle | 11,745 | 59% | 41% |
| 2. Construction | 10,851 | 100% | 0% | |
| 3. Metal products | 8966 | 57% | 43% | |
| 4. Wholesale and retail trade | 8468 | 86% | 14% | |
| 5. Iron and steel | 6748 | 76% | 24% | |
| 6. Electrical industrial machinery | 6202 | 18% | 82% | |
| 7. Radio and television | 6039 | 4% | 96% | |
| 8. Transportation | 5157 | 66% | 34% | |
| 9. Wooden furniture and fixtures | 3378 | 67% | 33% | |
| 10. Restaurant and drinking places | 3162 | 88% | 12% |
4. Discussion
4.1. Policy Implications
4.2. Supply Chain Implications
4.3. Consumer Implications
4.4. Limitation of This Study
5. Conclusions
Acknowledgments
Author Contributions
Conflicts of Interest
Appendix
| New Code | Aggregated Sectors (96 × 96 Sectors) | Conventional Thai IO Table (180 × 180 Sectors) |
|---|---|---|
| Primary Sectors | ||
| 001 | Paddy | 001 |
| 002 | Maize and cereals | 002, 003 |
| 003 | Cassava | 004 |
| 004 | Beans, vegetables, and other root crops | 005,006, 007 |
| 005 | Fruits and coconut | 008, 010 |
| 006 | Sugarcane | 009 |
| 007 | Oil palm | 011 |
| 008 | Textile crops | 012, 013 |
| 009 | Tobacco | 014 |
| 010 | Coffee and tea | 015 |
| 011 | Rubber | 016 |
| 012 | Other agricultural products | 017 |
| 013 | Livestock | 018–023 |
| 014 | Agricultural services | 024 |
| 015 | Forestry | 025–027 |
| 016 | Fishery | 028–029 |
| 017 | Coal and lignite | 030 |
| 018 | Petroleum and natural gas | 031 |
| 019 | Metal ore mining | 032–035 |
| 020 | Non-metal ore mining | 036–041 |
| Secondary Sectors | ||
| 021 | Slaughtering, meat canned, and dairy products | 042–044 |
| 022 | Canning of fruits and vegetables | 045 |
| 023 | Canning preserving of fish | 046 |
| 024 | Coconut and palm oil | 047 |
| 025 | Other vegetable and animal oils | 048 |
| 026 | Rice milling and grinding of maize | 049, 051 |
| 027 | Tapioca milling | 050 |
| 028 | Flour and other grain milling | 052 |
| 029 | Other food products | 053, 054, 056, 057, 058, 060 |
| 030 | Sugar | 055 |
| 031 | Coffee and tea processing | 059 |
| 032 | Animal feed | 061 |
| 033 | Distilling blending spirits | 062 |
| 034 | Breweries | 063 |
| 035 | Soft drinks | 064 |
| 036 | Tobacco processing and products | 065, 066 |
| 037 | Spinning | 067 |
| 038 | Textile weaving, bleaching and finishing | 068, 069 |
| 039 | Made-up textile goods and knitting | 070, 071 |
| 040 | Wearing apparels except footwear | 072 |
| 041 | Carpets, rugs, cordage rope, and twine products | 073, 074 |
| 042 | Leather products and footwear | 075, 076, 077 |
| 043 | Saws mills | 078 |
| 044 | Wood and cork products | 079 |
| 045 | Furniture and fixtures wood | 080 |
| 046 | Pulp and paper products | 081, 082 |
| 047 | Printing and publishing | 083 |
| 048 | Basic industrial chemicals | 084 |
| 049 | Fertilizer and pesticides | 085 |
| 050 | Synthetic resins and plastics | 086 |
| 051 | Other chemical products | 087, 089, 090, 091, 092 |
| 052 | Drugs and medicines | 088 |
| 053 | Petroleum refineries products | 093, 094 |
| 054 | Rubber sheets, block rubber, tires, and tubes | 095, 096 |
| 055 | Other rubber products | 097 |
| 056 | Plastic wares | 098 |
| 057 | Ceramics and clay products | 099, 101, 104 |
| 058 | Glass and glass products | 100 |
| 059 | Cement and concrete products | 102, 103 |
| 060 | Iron and steel products | 105, 106 |
| 061 | Non-ferrous metal | 107 |
| 062 | Fabricated metal products | 108, 109, 110, 111 |
| 063 | Engines and turbines | 112 |
| 064 | Agricultural machinery | 113 |
| 065 | Wood and metal working machinery | 114 |
| 066 | Special industrial machinery | 115 |
| 067 | Office and household machinery | 116 |
| 068 | Electrical industrial machinery | 117 |
| 069 | Radio and television | 118 |
| 070 | Household electrical appliances | 119 |
| 071 | Wire, cable, battery, and other electrical apparatuses | 120, 121, 122 |
| 072 | Ship building | 123 |
| 073 | Motor vehicle | 125 |
| 074 | Motorcycle, bicycle and other carriages | 126 |
| 075 | Railway equipment, repairing of motor vehicle, and aircraft | 124, 127, 128 |
| 076 | Precision products | 129, 130, 131 |
| 077 | Jewelry and related articles | 132 |
| 078 | Other manufacturing goods | 133, 134 |
| 079 | Electricity | 135 |
| 080 | Pipeline | 136 |
| 081 | Water supply system | 137 |
| 082 | Construction | 138–144 |
| Tertiary Sectors | ||
| 083 | Wholesale and retail trade | 145, 146 |
| 084 | Restaurant and drinking place | 147 |
| 085 | Hotel and lodging place | 148 |
| 086 | Transportation | 149–158 |
| 087 | Post and telecommunication | 159 |
| 088 | Financial services | 160–162 |
| 089 | Real-estate | 163 |
| 090 | Business service | 164 |
| 091 | Public administration | 165 |
| 092 | Sanitary and similar services | 166 |
| 093 | Education and research | 167, 168 |
| 094 | Hospital | 169 |
| 095 | Other services | 170–178 |
| 096 | Unclassified | 180 |
References
- NESDB. GROSS DOMESTIC PRODUCT: Q4/2014; Office of the National Economic and Social Development Board (NESDB): Bangkok, Thailand, 2015.
- Deutz, P.; Ioppolo, G. From theory to practice: Enhancing the potential policy impact of industrial ecology. Sustainability 2015, 7, 2259–2273. [Google Scholar] [CrossRef]
- Cappelletti, G.M.; Ioppolo, G.; Nicoletti, G.M.; Russo, C. Energy requirement of extra virgin olive oil production. Sustainability 2014, 6, 4966–4974. [Google Scholar] [CrossRef]
- Ioppolo, G.; Cucurachi, S.; Salomone, R.; Saija, G.; Ciraolo, L. Industrial Ecology and Environmental Lean Management: Lights and Shadows. Sustainability 2014, 6, 6362–6376. [Google Scholar] [CrossRef]
- UNEP (United Nations Environment Programme). Guidelines for Social Life Cycle Assessment of Products; UNEP (United Nations Environment Programme): Druk in de weer, Belgium, 2009; Available online: http://www.unep.fr/shared/publications/pdf/DTIx1164xPA-guidelines_sLCA.pdf (accessed on 1 May 2014).
- Dreyer, L.C.; Hauschild, M.Z.; Schierbeck, J. A framework for social life cycle impact assessment. Int. J. Life Cycle Assess. 2006, 11, 88–97. [Google Scholar] [CrossRef]
- Dreyer, L.C. Inclusion of Social Aspects in Life Cycle Assessment of Products—Development of a Methodology for Social Life Cycle Assessment. Ph.D. Thesis, Department of Management Engineering, Technical University of Denmark, Kongens Lyngby, Denmark, 2009. [Google Scholar]
- Benoit-Norris, C.; Cavan, D.A.; Norris, G. Identifying social impacts in product supply chains: Overview and application of the social hotspot database. Sustainability 2012, 4, 1946–1965. [Google Scholar] [CrossRef]
- Macombe, C.; Leskinen, P.; Feschet, P.; Antikainen, R. Social life cycle assessment of biodiesel production at three levels: A literature review and development needs. J. Clean. Prod. 2013, 52, 205–216. [Google Scholar] [CrossRef]
- Hutchins, M.J.; Robinson, S.L.; Dornfeld, D. Understanding life cycle social impacts in manufacturing: A processed-based approach. J. Manuf. Syst. 2013, 32, 536–542. [Google Scholar] [CrossRef]
- Martínez-Blanco, J.; Lehmann, A.; Muñoz, P.; Antón, A.; Traverso, M.; Rieradevall, J.; Finkbeiner, M. Application challenges for the social LCA of fertilizers within Life Cycle Sustainability Assessment. J. Clean. Prod. 2014, 69, 34–48. [Google Scholar] [CrossRef]
- Garrett-Peltier, H. The Employment Impacts of Economy-Wide Investments in Renewable Energy and Energy Efficiency. Ph.D. Thesis, University of Massachusetts Amherst, Amherst, MA, USA, 2010. [Google Scholar]
- Martínez, S.H.; van Eijck, J.; da Cunha, M.P.; Guilhoto, J.; Walter, A.; Faaij, A. Analysis of socio-economic impacts of sustainable sugarcane–ethanol production by means of inter-regional Input-Output analysis: Demonstrated for Northeast Brazil. Renew. Sustain. Energy Rev. 2013, 28, 290–316. [Google Scholar]
- Chen, T.P.; Chang, T.; Chiau, W.; Shih, Y. Social economic assessment of coastal area industrial development: An application of input-output model to oyster farming in Taiwan. Ocean Coast. Manag. 2013, 73, 153–159. [Google Scholar] [CrossRef]
- Tang, X.; Zhang, B.; Wei, X. Employment impacts of petroleum industry in China: an input-output analysis. Int. J. Glob. Energy Issues 2013, 36, 116–129. [Google Scholar] [CrossRef]
- Lee, M.K.; Yoo, S.H. The role of the capture fisheries and aquaculture sectors in the Korean national economy: An input-output analysis. Mar. Policy 2014, 44, 448–456. [Google Scholar] [CrossRef]
- Ferrão, P.; Ribeiro, P.; Rodrigues, J.; Marquesa, A.; Preto, M.; Amaral, M.; Domingosa, T.; Lopes, A.; Costa, I. Environmental, economic and social costs and benefits of a packaging waste management system: A Portuguese case study. Resour. Conserv. Recycl. 2014, 85, 67–78. [Google Scholar] [CrossRef]
- McBain, D.; Alsamawi, A. Quantitative accounting for social economic indicators. Nat. Resour. Forum 2014, 38, 193–202. [Google Scholar] [CrossRef]
- Malik, A.; Lenzen, M.; Geschke, A. Triple bottom line study of a lignocellulosic biofuel industry. GCB Bioenergy 2015. [Google Scholar] [CrossRef]
- Yang, Y.; Zhang, B.; Cheng, J.; Pu, S. Socio-economic impacts of algae-derived biodiesel industrial development in China: An input–output analysis. Algal Res. 2015, 9, 74–81. [Google Scholar] [CrossRef]
- Kucukvar, M.; Egilmez, G.; Tatari, O. Sustainability assessment of U.S. final consumption and investments: triple-bottom-line input–output analysis. J. Clean. Prod. 2014, 81, 234–243. [Google Scholar] [CrossRef]
- Alsamawi, A.; Murray, J.; Lenzen, M. The employment footprints of nations. J. Ind. Ecol. 2014, 18, 59–70. [Google Scholar] [CrossRef]
- Chang, Y.; Ries, R.J.; Wang, Y. The quantification of the embodied impacts of construction projects on energy, environment, and society based on I–O LCA. Energ. Policy 2011, 39, 6321–6330. [Google Scholar] [CrossRef]
- Onat, N.C.; Kucukvar, M.; Tatari, O. Integrating triple bottom line input-output analysis into life cycle sustainability assessment framework: the case for US buildings. Int. J. Life Cycle Assess. 2014, 19, 1488–1505. [Google Scholar] [CrossRef]
- Simas, M.S.; Golsteijn, L.; Huijbregts, M.A.J.; Wood, R.; Hertwich, E.G. The “Bad Labor” Footprint: Quantifying the Social Impacts of Globalization. Sustainability 2014, 6, 7514–7540. [Google Scholar] [CrossRef] [Green Version]
- Gómez-Paredes, J.; Yamasue, E.; Okumura, H.; Ishihara, K.N. The labour footprint: A framework to assess labour in a complex economy. Econ. Syst. Res. 2015, 27, 1–25. [Google Scholar] [CrossRef]
- Ministry of Labour. National Profile on Occupational Safety and Health of Thailand 2012; Occupational and Health Bureau, Department of Labour Protection and Welfare, Ministry of Labour: Bangkok, Thailand, 2012.
- ISO. ISO 14040: Environmental Management—Life Cycle Assessment—Principals and Framework; International Organization for Standardization: Geneva, Switzerland, 2006. [Google Scholar]
- Leontief, W.W. Input–Output Economics, 2nd ed.; Oxford University Press: New York, NY, USA, 1986. [Google Scholar]
- Hendrickson, C.; Horvath, A.; Joshi, S.; Lave, L. Economic input–output models for environmental life-cycle assessment. Environ. Sci. Technol. 1998, 32, 184A–191A. [Google Scholar] [CrossRef]
- Bilec, M.; Ries, R.; Matthew, H.S. Hybrid life cycle assessment model for construction processes: methodology, model, results, and comparisons. J. Infrastruct. Syst. 2010, 16, 199–205. [Google Scholar] [CrossRef]
- NESDB. The 2005 IO Table of Thailand; Office of the National Economic and Social Development Board (NESDB): Bangkok, Thailand, 2014. Available online: http://www.nesdb.go.th/Default.aspx?tabid=97 (accessed on 1 May 2014).
- NSO (National Statistical Office). The 2006 Business Trade and Service Survey of Thailand; Ministry of Information and Communication Technology: Bangkok, Thailand, 2006.
- BOT (Bank of Thailand). Number of Employment Classified by Working-Hour Per Week for Each Economic Sector in 2005–2010; Bank of Thailand: Bangkok, Thailand, 2014; Available online: (accessed on 9 September 2014).
- NSO (National Statistical Office). Labor Force Survey in 2006 (in Thai); Ministry of Information and Communication Technology: Bangkok, Thailand, 2006.
- NSO (National Statistical Office). The 2007 Industrial Census Whole Kingdom (in Thai); Ministry of Information and Communication Technology: Bangkok, Thailand, 2007.
- NSO (National Statistical Office). Statistical Yearbook Thailand 2006 (in Thai); Ministry of Information and Communication Technology: Bangkok, Thailand, 2007.
- SSO (Thailand’s Social Security Office). Occupational Accidents and Fatality Cases; Ministry of Labour: Bangkok, Thailand, 2006.
- NSO (National Statistical Office). Informal Labor Survey 2005 (in Thai); Ministry of Information and Communication Technology: Bangkok, Thailand, 2005.
- Xu, M.; Williams, E.; Allenby, B. Assessing environmental impacts embodied in manufacturing and labor input for China–U.S. trade. Environ. Sci. Technol. 2010, 44, 567–573. [Google Scholar] [CrossRef] [PubMed]
- SSO (Thailand’s Social Security Office). The Social Security Office: Annual Report 2010; Ministry of Labour: Bangkok, Thailand, 2010.
- Gonzalez-Delgado, M.; Gómez-Dantés, H.; Fernández-Niño, J.A.; Robles, E.; Borja, V.H.; Aguilar, M. Factors associated with fatal occupational accidents among Mexican workers: A national analysis. PLoS ONE 2015, 10, 1–19. [Google Scholar] [CrossRef] [PubMed]
- Waehrer, G.; Leigh, J.P.; Miller, T.R. Costs of occupational injury and illness within the health services sector. Int. J. Health Serv. 2005, 35, 343–359. [Google Scholar] [CrossRef] [PubMed]
- Kifle, M.; Engdaw, D.; Alemu, K.; Sharma, H.R.; Amsalu, S.; Feleke, A.; Worku, W. Work related injuries and associated risk factors among iron and steel industries workers in Addis Ababa, Ethiopia. Saf. Sci. 2014, 63, 211–216. [Google Scholar] [CrossRef]
© 2015 by the authors; licensee MDPI, Basel, Switzerland. This article is an open access article distributed under the terms and conditions of the Creative Commons Attribution license (http://creativecommons.org/licenses/by/4.0/).
Share and Cite
Papong, S.; Itsubo, N.; Malakul, P.; Shukuya, M. Development of the Social Inventory Database in Thailand Using Input–Output Analysis. Sustainability 2015, 7, 7684-7713. https://doi.org/10.3390/su7067684
Papong S, Itsubo N, Malakul P, Shukuya M. Development of the Social Inventory Database in Thailand Using Input–Output Analysis. Sustainability. 2015; 7(6):7684-7713. https://doi.org/10.3390/su7067684
Chicago/Turabian StylePapong, Seksan, Norihiro Itsubo, Pomthong Malakul, and Masanori Shukuya. 2015. "Development of the Social Inventory Database in Thailand Using Input–Output Analysis" Sustainability 7, no. 6: 7684-7713. https://doi.org/10.3390/su7067684