
Preventive Indicators for Creating Brownfields

Abstract
:1. Introduction
2. Experimental Model

| Economic | Social |
|
|
| Urban | Natural |
|
|
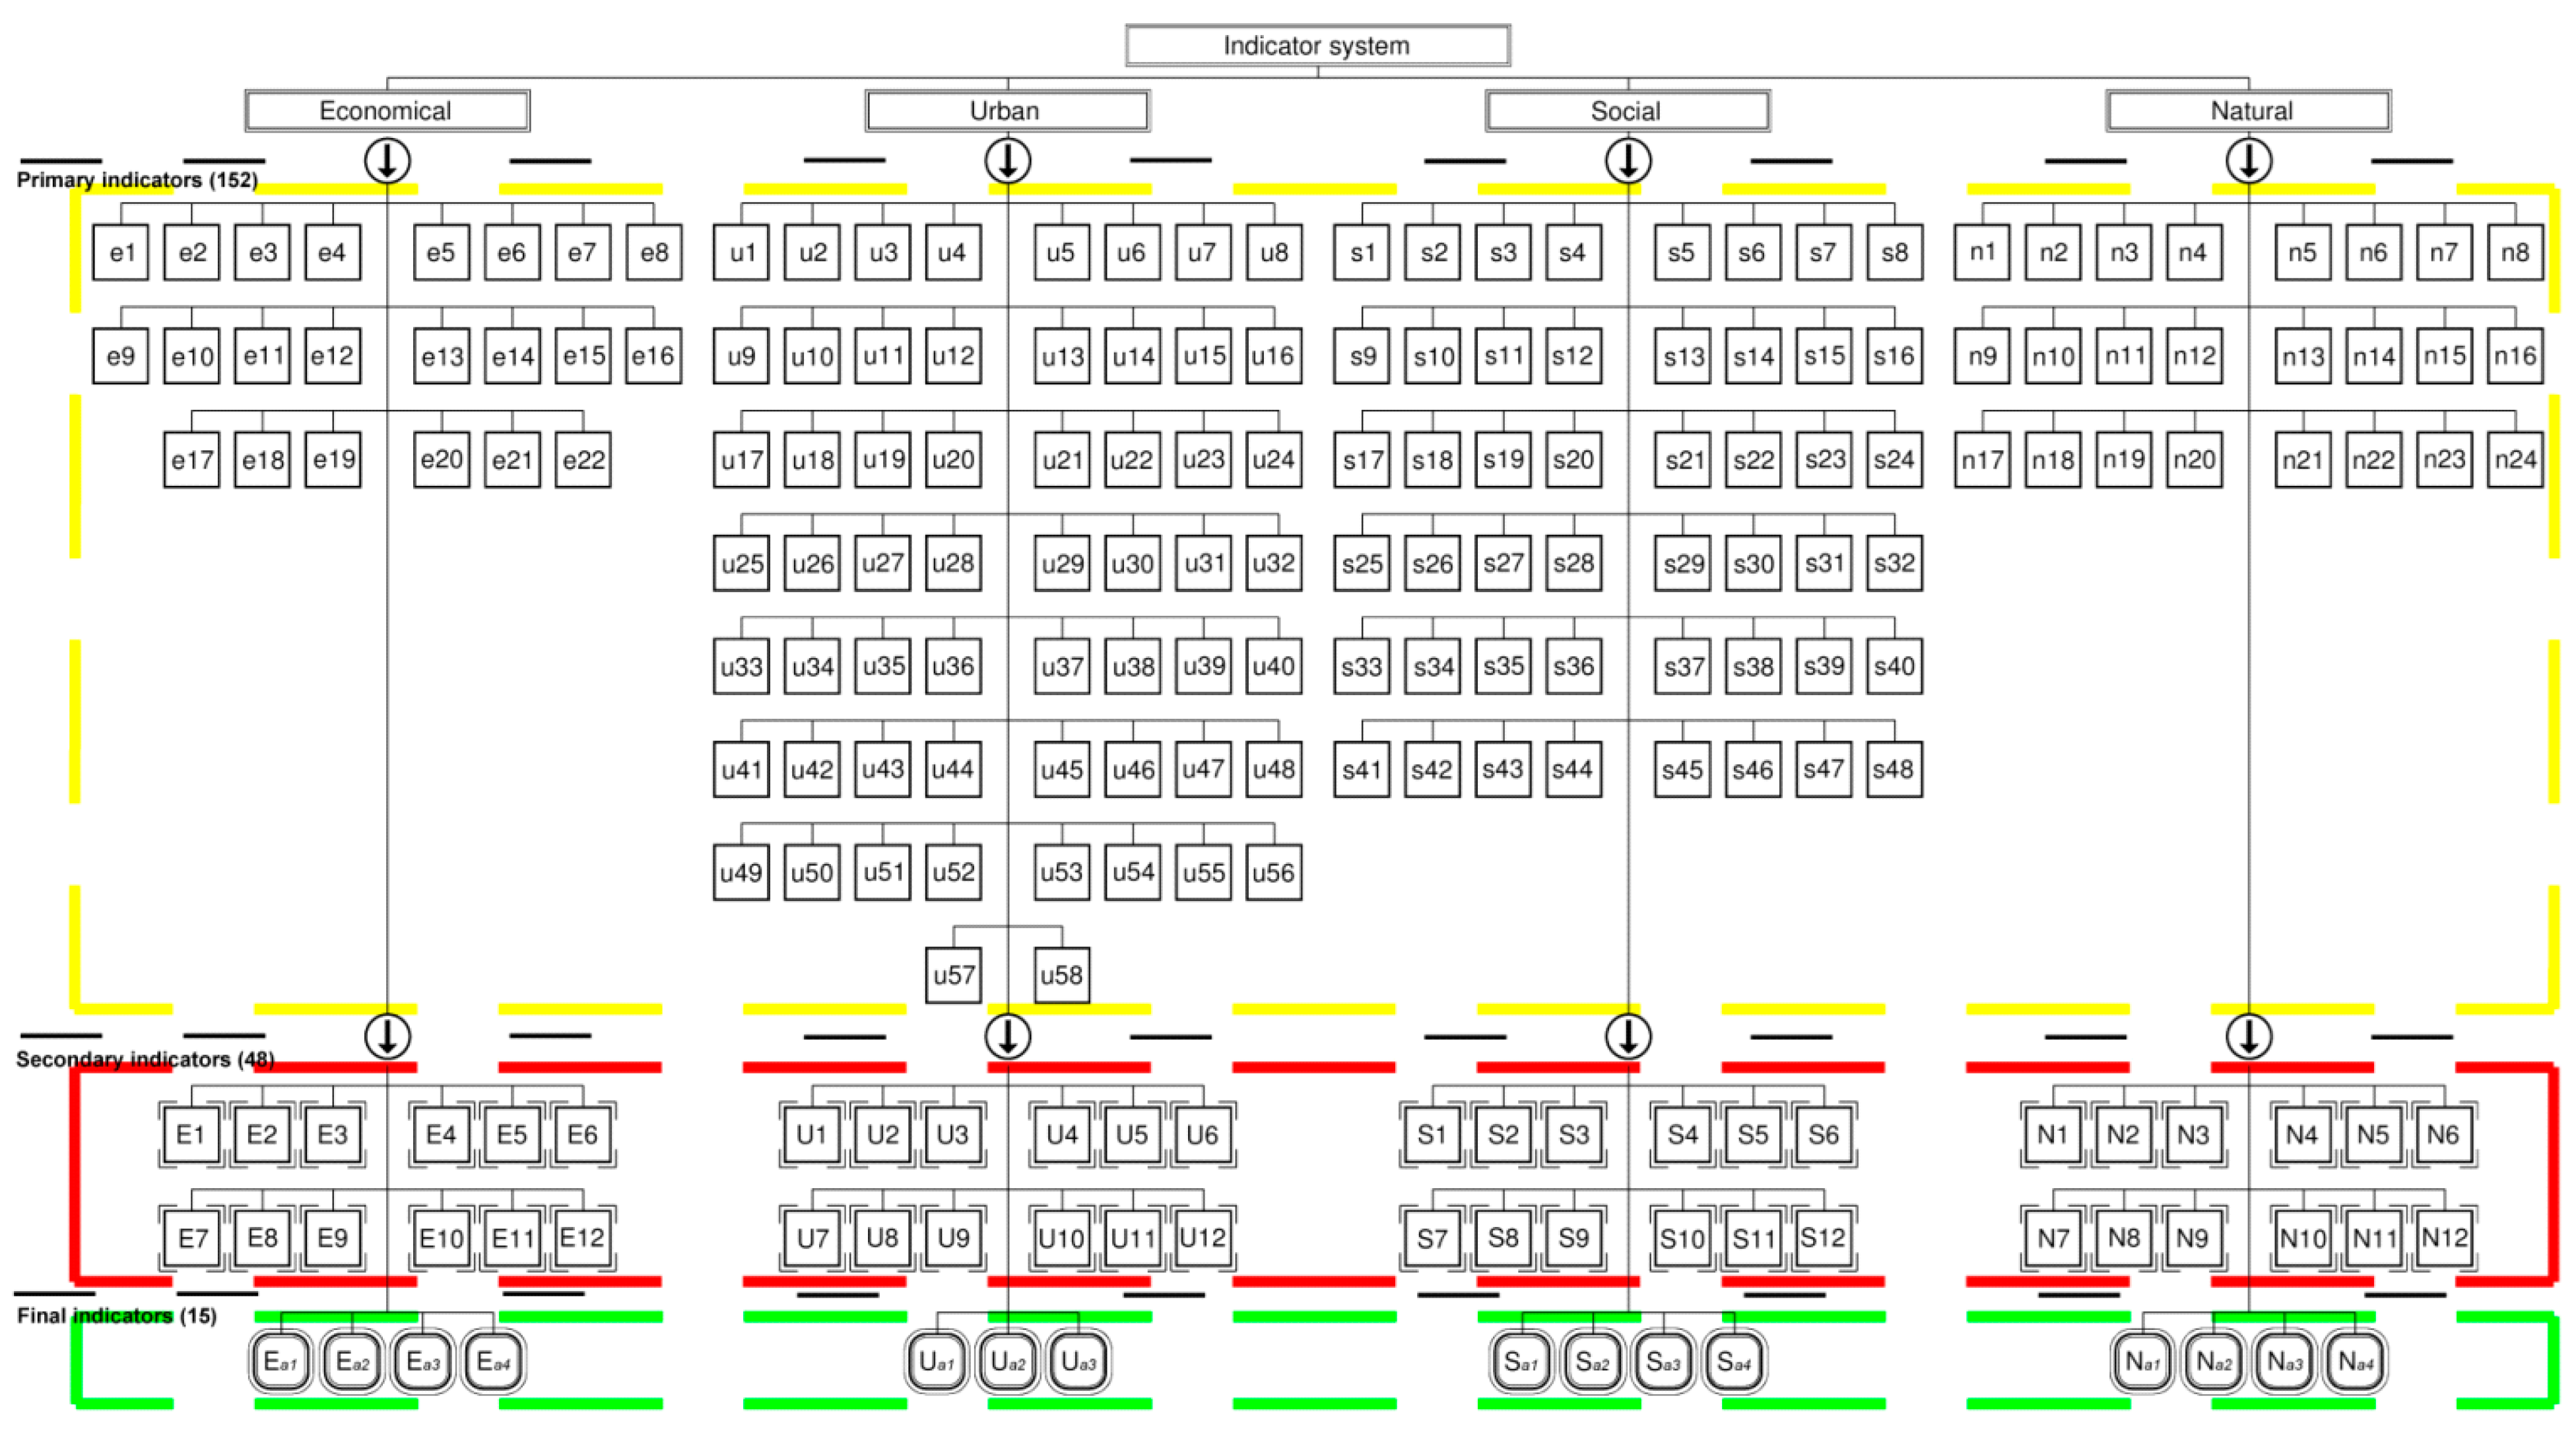
- Primary indicators were identified by reveiwing scientific literature (152 indicators in the yellow area of Figure 1).
- Secondary indicators act as the subset of primary indicators that eliminates duplicate indicators, according to their impact, meaning and sources (48 indicators in the red area of Figure 1).
- Final indicators were selected by expert ranking and applying the Multiple criteria decision making (MCDM) method (15 indicators in the green area of Figure 1).
3. Results and Discussion
3.1. Application of the Method for Expert Ranking
| Expert Code, i = 1,2,...,n | Indicator and the Values of Its Significance j = 1,2,···,m | |||||||||||
|---|---|---|---|---|---|---|---|---|---|---|---|---|
| X1 | X2 | X3 | X4 | X5 | X6 | X7 | X8 | X9 | X10 | X11 | X12 | |
| E1 | 3 | 9 | 2 | 1 | 4 | 5 | 9 | 10 | 7 | 5 | 6 | 8 |
| E2 | 3 | 4 | 5 | 3 | 4 | 5 | 5 | 4 | 4 | 6 | 5 | 7 |
| E3 | 8 | 5 | 2 | 1 | 4 | 3 | 4 | 10 | 9 | 6 | 5 | 8 |
| E4 | 3 | 5 | 3 | 1 | 1 | 2 | 4 | 8 | 10 | 8 | 5 | 2 |
| E5 | 5 | 5 | 7 | 1 | 1 | 1 | 3 | 8 | 1 | 8 | 3 | 6 |
| E6 | 2 | 9 | 5 | 3 | 1 | 4 | 6 | 8 | 0 | 3 | 0 | 10 |
| E7 | 8 | 7 | 8 | 7 | 7 | 8 | 8 | 9 | 8 | 8 | 6 | 7 |
| E8 | 5 | 8 | 4 | 5 | 7 | 6 | 10 | 10 | 0 | 5 | 5 | 9 |
| E9 | 9 | 8 | 5 | 7 | 10 | 7 | 10 | 9 | 6 | 6 | 4 | 8 |
| E10 | 7 | 9 | 9 | 7 | 8 | 8 | 9 | 9 | 8 | 7 | 6 | 9 |
| Total number of points | 53 | 69 | 50 | 36 | 47 | 49 | 68 | 85 | 53 | 62 | 45 | 74 |
3.2. Calculations Substantiating the Agreement Considering Evaluators’ Opinion
| Expert code, i = 1,2,...,n | Indicator and the rank of its significance, j = 1,2,···,m | |||||||||||
|---|---|---|---|---|---|---|---|---|---|---|---|---|
| X1 | X2 | X3 | X4 | X5 | X6 | X7 | X8 | X9 | X10 | X11 | X12 | |
| E1 | 10 | 4 | 11 | 12 | 9 | 8 | 4 | 3 | 6 | 8 | 7 | 5 |
| E2 | 10 | 9 | 8 | 10 | 9 | 8 | 8 | 9 | 9 | 7 | 8 | 6 |
| E3 | 5 | 8 | 11 | 12 | 9 | 10 | 9 | 3 | 4 | 7 | 8 | 5 |
| E4 | 10 | 8 | 10 | 12 | 12 | 11 | 9 | 5 | 3 | 5 | 8 | 11 |
| E5 | 8 | 8 | 6 | 12 | 12 | 12 | 10 | 5 | 12 | 5 | 10 | 7 |
| E6 | 11 | 4 | 8 | 10 | 12 | 9 | 7 | 4 | 13 | 10 | 13 | 3 |
| E7 | 5 | 6 | 5 | 6 | 6 | 5 | 5 | 4 | 5 | 5 | 7 | 6 |
| E8 | 8 | 5 | 9 | 8 | 6 | 7 | 3 | 3 | 13 | 8 | 8 | 4 |
| E9 | 4 | 5 | 8 | 6 | 3 | 6 | 3 | 4 | 7 | 7 | 9 | 5 |
| E10 | 6 | 4 | 4 | 6 | 5 | 5 | 4 | 4 | 5 | 6 | 7 | 4 |
| Sum of ranks | 77 | 61 | 80 | 94 | 83 | 81 | 62 | 44 | 77 | 68 | 85 | 56 |
| Average rank | 7.7 | 6.1 | 8.0 | 9.4 | 8.3 | 8.1 | 6.2 | 4.4 | 7.7 | 6.8 | 8.5 | 5.6 |
| 12 | −4 | 15 | 29 | 18 | 16 | −3 | −21 | 12 | 3 | 20 | −9 | |
| 144 | 16 | 225 | 841 | 324 | 256 | 9 | 441 | 144 | 9 | 400 | 81 | |
| Economic Indicators | Social Indicators | Building and Infrastructure Indicators | Natural Indicators | |
|---|---|---|---|---|
| S | 2890 | 2851 | 3808 | 2558 |
| W | 0.202098 | 0.199371 | 0.266294 | 0.178881 |
| χ2 | 22.23077 | 21.93077 | 29.29231 | 19.67692 |
| 19.6751 | ||||
| Evaluation of the compliance of the expert ranking agreement to condition | ||||
| Yes | Yes | Yes | Yes | |
| Indicator, j = 1,2,···,m | |||||||||||||
|---|---|---|---|---|---|---|---|---|---|---|---|---|---|
| X1 | X2 | X3 | X4 | X5 | X6 | X7 | X8 | X9 | X10 | X11 | X12 | Sum | |
| Economic indicators | |||||||||||||
| 0.089 | 0.070 | 0.092 | 0.108 | 0.096 | 0.093 | 0.071 | 0.051 | 0.089 | 0.078 | 0.098 | 0.065 | =1 | |
| 0.911 | 0.930 | 0.908 | 0.892 | 0.904 | 0.907 | 0.929 | 0.949 | 0.911 | 0.922 | 0.902 | 0.935 | ||
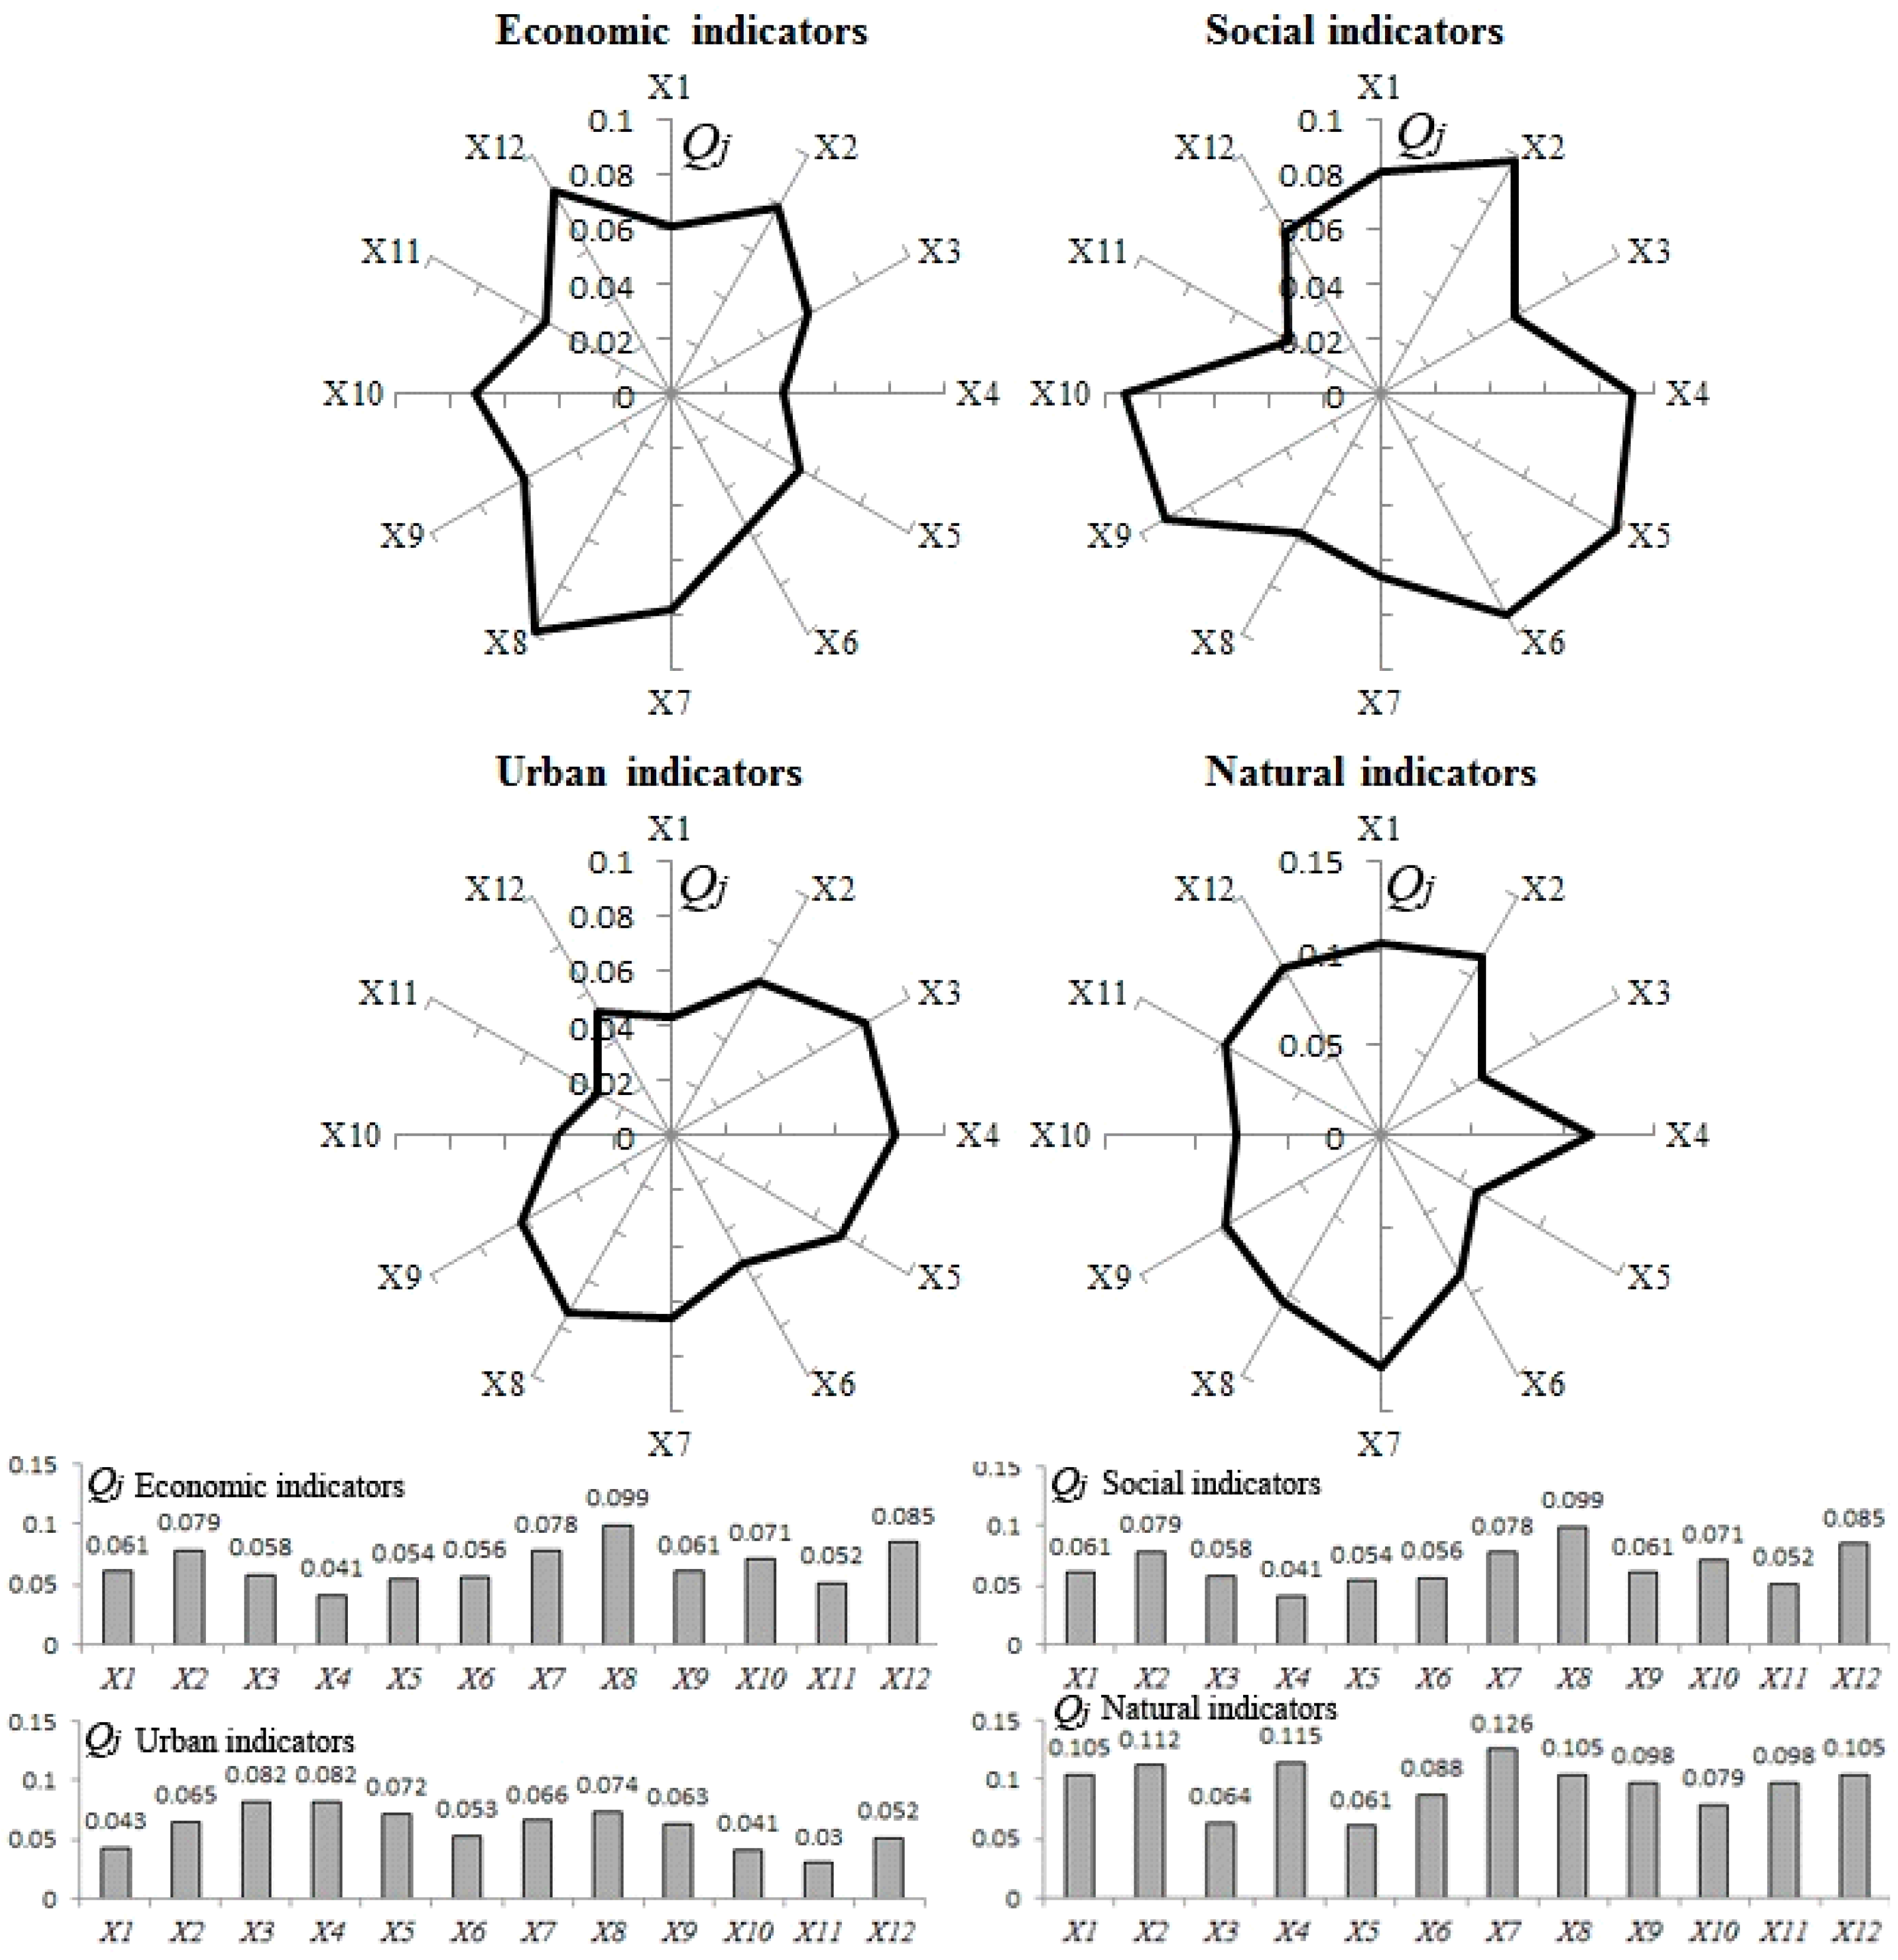
| 0.061 | 0.079 | 0.058 | 0.041 | 0.054 | 0.056 | 0.078 | 0.099 | 0.061 | 0.071 | 0.052 | 0.085 | =1 | |
| Hierarchy | 7 | 3 | 8 | 12 | 10 | 9 | 4 | 1 | 6 | 5 | 11 | 2 | |
| Social indicators | |||||||||||||
| 0.081 | 0.063 | 0.104 | 0.069 | 0.062 | 0.068 | 0.095 | 0.103 | 0.071 | 0.068 | 0.123 | 0.093 | =1 | |
| 0.919 | 0.937 | 0.896 | 0.931 | 0.938 | 0.932 | 0.905 | 0.897 | 0.929 | 0.932 | 0.877 | 0.907 | ||
| 0.081 | 0.098 | 0.057 | 0.092 | 0.099 | 0.093 | 0.066 | 0.058 | 0.090 | 0.093 | 0.038 | 0.068 | =1 | |
| Hierarchy | 6_7 | 2 | 11 | 5 | 1 | 3_4 | 9 | 10 | 6_7 | 3_4 | 12 | 8 | |
| Urban indicators | |||||||||||||
| 0.100 | 0.078 | 0.062 | 0.062 | 0.072 | 0.091 | 0.077 | 0.070 | 0.081 | 0.103 | 0.114 | 0.092 | =1 | |
| 0.900 | 0.922 | 0.938 | 0.938 | 0.928 | 0.909 | 0.923 | 0.930 | 0.919 | 0.897 | 0.886 | 0.908 | ||
| 0.043 | 0.065 | 0.082 | 0.082 | 0.072 | 0.053 | 0.066 | 0.074 | 0.063 | 0.041 | 0.030 | 0.052 | =1 | |
| Hierarchy | 10 | 6 | 1_2 | 1_2 | 4 | 8 | 5 | 3 | 7 | 11 | 12 | 9 | |
| Natural indicators | |||||||||||||
| 0.075 | 0.068 | 0.116 | 0.065 | 0.119 | 0.091 | 0.054 | 0.075 | 0.081 | 0.101 | 0.081 | 0.075 | =1 | |
| 0.925 | 0.932 | 0.884 | 0.935 | 0.881 | 0.909 | 0.946 | 0.925 | 0.919 | 0.899 | 0.919 | 0.925 | ||
| 0.105 | 0.112 | 0.064 | 0.115 | 0.061 | 0.088 | 0.126 | 0.105 | 0.098 | 0.079 | 0.098 | 0.105 | =1 | |
| Hierarchy | 6 | 3 | 11 | 2 | 12 | 9 | 1 | 4_5 | 7_8 | 10 | 7_8 | 4_5 | |
4. Conclusions
- The significance of the 48 indicators for brownfields selected, based on the analysis of the scientific literature, has been ranked by 10 competent experts in the economic, social, building and infrastructure, and natural groups of a city setting. Ranking has been made with reference to a 10-point-system.
- Calculations have been conducted to verify the agreement among expert (evaluator) rankings, which enabled the authors to state that all expert ranks are in complete agreement. Further calculations have allowed estimating the value of significance, considering each indicator from a separate setting of the city. On these grounds, the authors have established the hierarchy of the indicators in each group.
- When the hierarchy of the indicators regarding economic, social, building and infrastructure, and natural groups of city setting were established, the authors selected the 20 most significant preventive indicators for brownfields.
- The following most significant indicators in each group have been identified. The lists of the indicators specified for each group are represented in Table 6.
- The established system for the indicators may be applied in practice as a basis for monitoring data on the indicators and surveillance of their change in the avoidance of the newly built-up or regenerated territories to not become brownfield land. With management intervention, the problem of brownfields could be limited by identifying and predicting the potential of a territory becoming a brownfield.
| Economic Indicators | Social Indicators |
|
|
| Urban indicators | Natural indicators |
|
|
Acknowledgments
Author Contributions
Conflicts of Interest
References
- Urbonaitė, I. Apleistų teritorijų reikšmė formuojant miesto rekreacijos sistemą. Science 2012, 4, 97–105. (In Lithuanian) [Google Scholar]
- Adam, F.; Kristan, P.; Tomašič, M. Varieties of capitalism in Eastern Europe (with special emphasis on Estonia and Slovenia). Communist Post-Communist Stud. 2009, 42, 65–81. [Google Scholar] [CrossRef]
- Matulevičius, K.; Šliogerienė, J. Industrinių teritorijų konversija: užsienio šalių praktika, iš Statyba. In Proceedings of the 14th Conference of Junior Researchers—“Science—Future for Lithuania”, Vilnius, Lithuania, 22–24 March 2011. (In Lithuanian)
- Del Sasso, P.; Caliandro, L.P. The role of historical agroindustrial buildings in the study of rural territory. Landsc. Urban Plan. 2010, 96, 146–162. [Google Scholar]
- TIMBRE (2012): Tailored Improvement of Brownfield Regeneration in Europe. Available online: http://www.timbre-project.eu/ (accessed on 25 May 2015).
- European Commission. Science for Environment Policy. Brownfield Regeneration. 2013. Available online: http://ec.europa.eu/environment/integration/research/newsalert/pdf/39si_en.pdf (accessed on 25 May 2015).
- Sassi, E.; Vismara, F.; Cavadini, N.O.; Acebillo, J. Industrial areas. A survey, analysis and appraisal of the potential for conversion of disused industrial areas in Ticino. Theor. Empir. Res. Urban Manag. 2009, 2, 95–104. [Google Scholar]
- Moldoveanu, M.; Franc, V.I. Urban regeneration and more opportunities for artistic expression and cultural consumption. Procedia Econ. Finance 2013, 8, 490–496. [Google Scholar] [CrossRef]
- Ferber, U. Brownfield Integrated Governance—BRING. Baseline Study—Development Phase. Available online: http://urbact.eu/sites/default/files/import/Projects/Bring_up/outputs_media/BRING-Baselinestudy_final_01.pdf (accessed on 25 May 2015).
- Ramsden, P. Workshop Re-using Brownfield Sites and Buildings. In Presented at the Regions for Economic Change Workshop in Brussels, Belgium, 21 May 2010.
- Schädler, S.; Morio, M.; Bartke, S.; Rohr-Zänker, R.; Finkel, M. Designing sustainable and economically attractive brownfield revitalization options using an integrated assessment model. J. Environ. Manag. 2011, 92, 827–837. [Google Scholar] [CrossRef]
- Rafson, J.H. Brownfields: Redeveloping Environmentally Distressed Properties; McGraw-Hill: New York, NY, USA, 1999; ISBN 9780070527683. [Google Scholar]
- Carlon, C.; Critto, A.; Ramieri, E.; Marcomini, A. DESYRE: Decision support system for the rehabilitation of contaminated megacities. Integr. Environ. Assess. Manag. 2007, 3, 211–222. [Google Scholar] [CrossRef] [PubMed]
- De Sousa, C.A. Brownfields Redevelopment and the Quest for Sustainability; Current Issues in Urban and Regional Studies Series; Elsevier: London, UK, 2008; Volume 3. [Google Scholar]
- Dixon, T.; Raco, M.; Catney, P.; Lerner, D.N. Sustainable Brownfield Regeneration: Liveable Places from Problem Spaces; Blackwells: Oxford, UK, 2007. [Google Scholar]
- Frantal, B.; Greer-Wootten, B.; Klusaček, P.; Krejči, T.; Kunc, J.; Martinat, S. Exploring spatial pattern of urban brownfields regeneration: The case of Brno, Czech Republic. Cities 2014, 44, 9–18. [Google Scholar] [CrossRef]
- ESPON FOCI. Future Orientations for Cities. Available online: http://www.espon.eu/export/sites/default/Documents/Projects/AppliedResearch/FOCI/FOCI_RevisedDraftFinalReport_corrected_20101011.pdf (accessed on 25 May 2015).
- The Built Environment and Remediation of Brownfields. Available online: www.balticuniv.uu.se/index.php/component/docman/doc_download/222-rebuilding-the-city (accessed on 25 May 2015).
- Alexandrescu, F.; Martinát, S.; Klusáček, P.; Bartke, S. The path from passivity toward entrepreneurship public sector actors in brownfield regeneration processes in Central and Eastern Europe. Organ. Environ. 2014, 27, 181–201. [Google Scholar] [CrossRef]
- Engelke, D. Sustainable Land Use Management and Integrated Brownfield Development; Karlsruhe Institute of Technology (KIT): Karlsruhe, Germany, 2010. [Google Scholar]
- Marinescu, E.I.; Avran, S. Evaluation of urban fragmentation in Craiova city, Romania. Procedia Environ. Sci. 2011, 14, 207–215. [Google Scholar] [CrossRef]
- Brownfield Definition. Available online: http://www.cabernet.org.uk/index.asp?c=1134 (accessed on 25 May 2015).
- CEEP. Brownfields: From Redevelopment to Revitalization. Available online: http://ceep.udel.edu/?s=Brownfields%3A+From+Redevelopment+to+Revitalization (accessed on 25 May 2015).
- CTLS. Reversing Urban Sprawl: A Reclaimability Index Approach for Reviving Downtown Brownfields. 2011. Available online: http://www.ctls.uconn.edu/research/completed-projects (accessed on 25 May 2015).
- EPA’s Smart Growth Index in 20 Pilot Communities (2003): Using GIS Sketch Modelling to Advance Smart Growth. Available online: http://www2.epa.gov/smart-growth/smart-growth-index (accessed on 25 May 2015).
- Holistic Management of Brownfield Regeneration (HOMBRE). Early Indicators for Brownfield origination. 7th EC Framework Programme. 2013. Available online: http://www.zerobrownfields.eu/ (accessed on 25 May 2015).
- Wilson, M. The Park is Elevated. Its Crime Rate is Anything But. The New York Times, 11 June 2011. [Google Scholar]
- Podvezko, V. Ekspertų įverčių suderinamumas. Ūkio Technologinis ir Ekonominis Vystymas 2005, 9, 101–107. (In Lithuanian) [Google Scholar]
- Zavadskas, E.K. Resursų Taupymo Sprendimų Statyboje Kompleksinis Įvertinimas ir Parinkimas; Mokslas: Vilnius, Lithuania, 1987; p. 212. (In Lithuanian) [Google Scholar]
- Čekanavičius, V.; Murauskas, G. Statistika ir Jos Taikymai; TEV: Vilnius, Lithuania, 2004; Volulme II, p. 271. [Google Scholar]
- Кендэл, M. Ранговые Корреляции, Пер. с англ (Rank Correlations, Translated from English); Statistics: Moscow, Russia, 1975; p. 216. (In Russian) [Google Scholar]
- Eвланов, Л.Г. Теория и Практика Принятия Решений (Theory and Practice of Decision-Making); Экономика: Moscow, Russia, 1984; p. 175. (In Russian) [Google Scholar]
- Кремер, Н., Н. Теория вероятностей и математическая статистика (Theory of probability and Mathematical Statistics); Unity: Moscow, Russia, 2004; p. 573. (In Russian) [Google Scholar]
- Sivilevičius, H. Kelių Dangos Tiesimo ir Jų Priežiūros Technologijos; Technika: Vilnius, Lithuania, 2012. (In Lithuanian) [Google Scholar]
© 2015 by the authors; licensee MDPI, Basel, Switzerland. This article is an open access article distributed under the terms and conditions of the Creative Commons Attribution license (http://creativecommons.org/licenses/by/4.0/).
Share and Cite
Burinskienė, M.; Lazauskaitė, D.; Bielinskas, V. Preventive Indicators for Creating Brownfields. Sustainability 2015, 7, 6706-6720. https://doi.org/10.3390/su7066706
Burinskienė M, Lazauskaitė D, Bielinskas V. Preventive Indicators for Creating Brownfields. Sustainability. 2015; 7(6):6706-6720. https://doi.org/10.3390/su7066706
Chicago/Turabian StyleBurinskienė, Marija, Dovilė Lazauskaitė, and Vytautas Bielinskas. 2015. "Preventive Indicators for Creating Brownfields" Sustainability 7, no. 6: 6706-6720. https://doi.org/10.3390/su7066706
APA StyleBurinskienė, M., Lazauskaitė, D., & Bielinskas, V. (2015). Preventive Indicators for Creating Brownfields. Sustainability, 7(6), 6706-6720. https://doi.org/10.3390/su7066706