3.1. Application of the Method for Expert Ranking
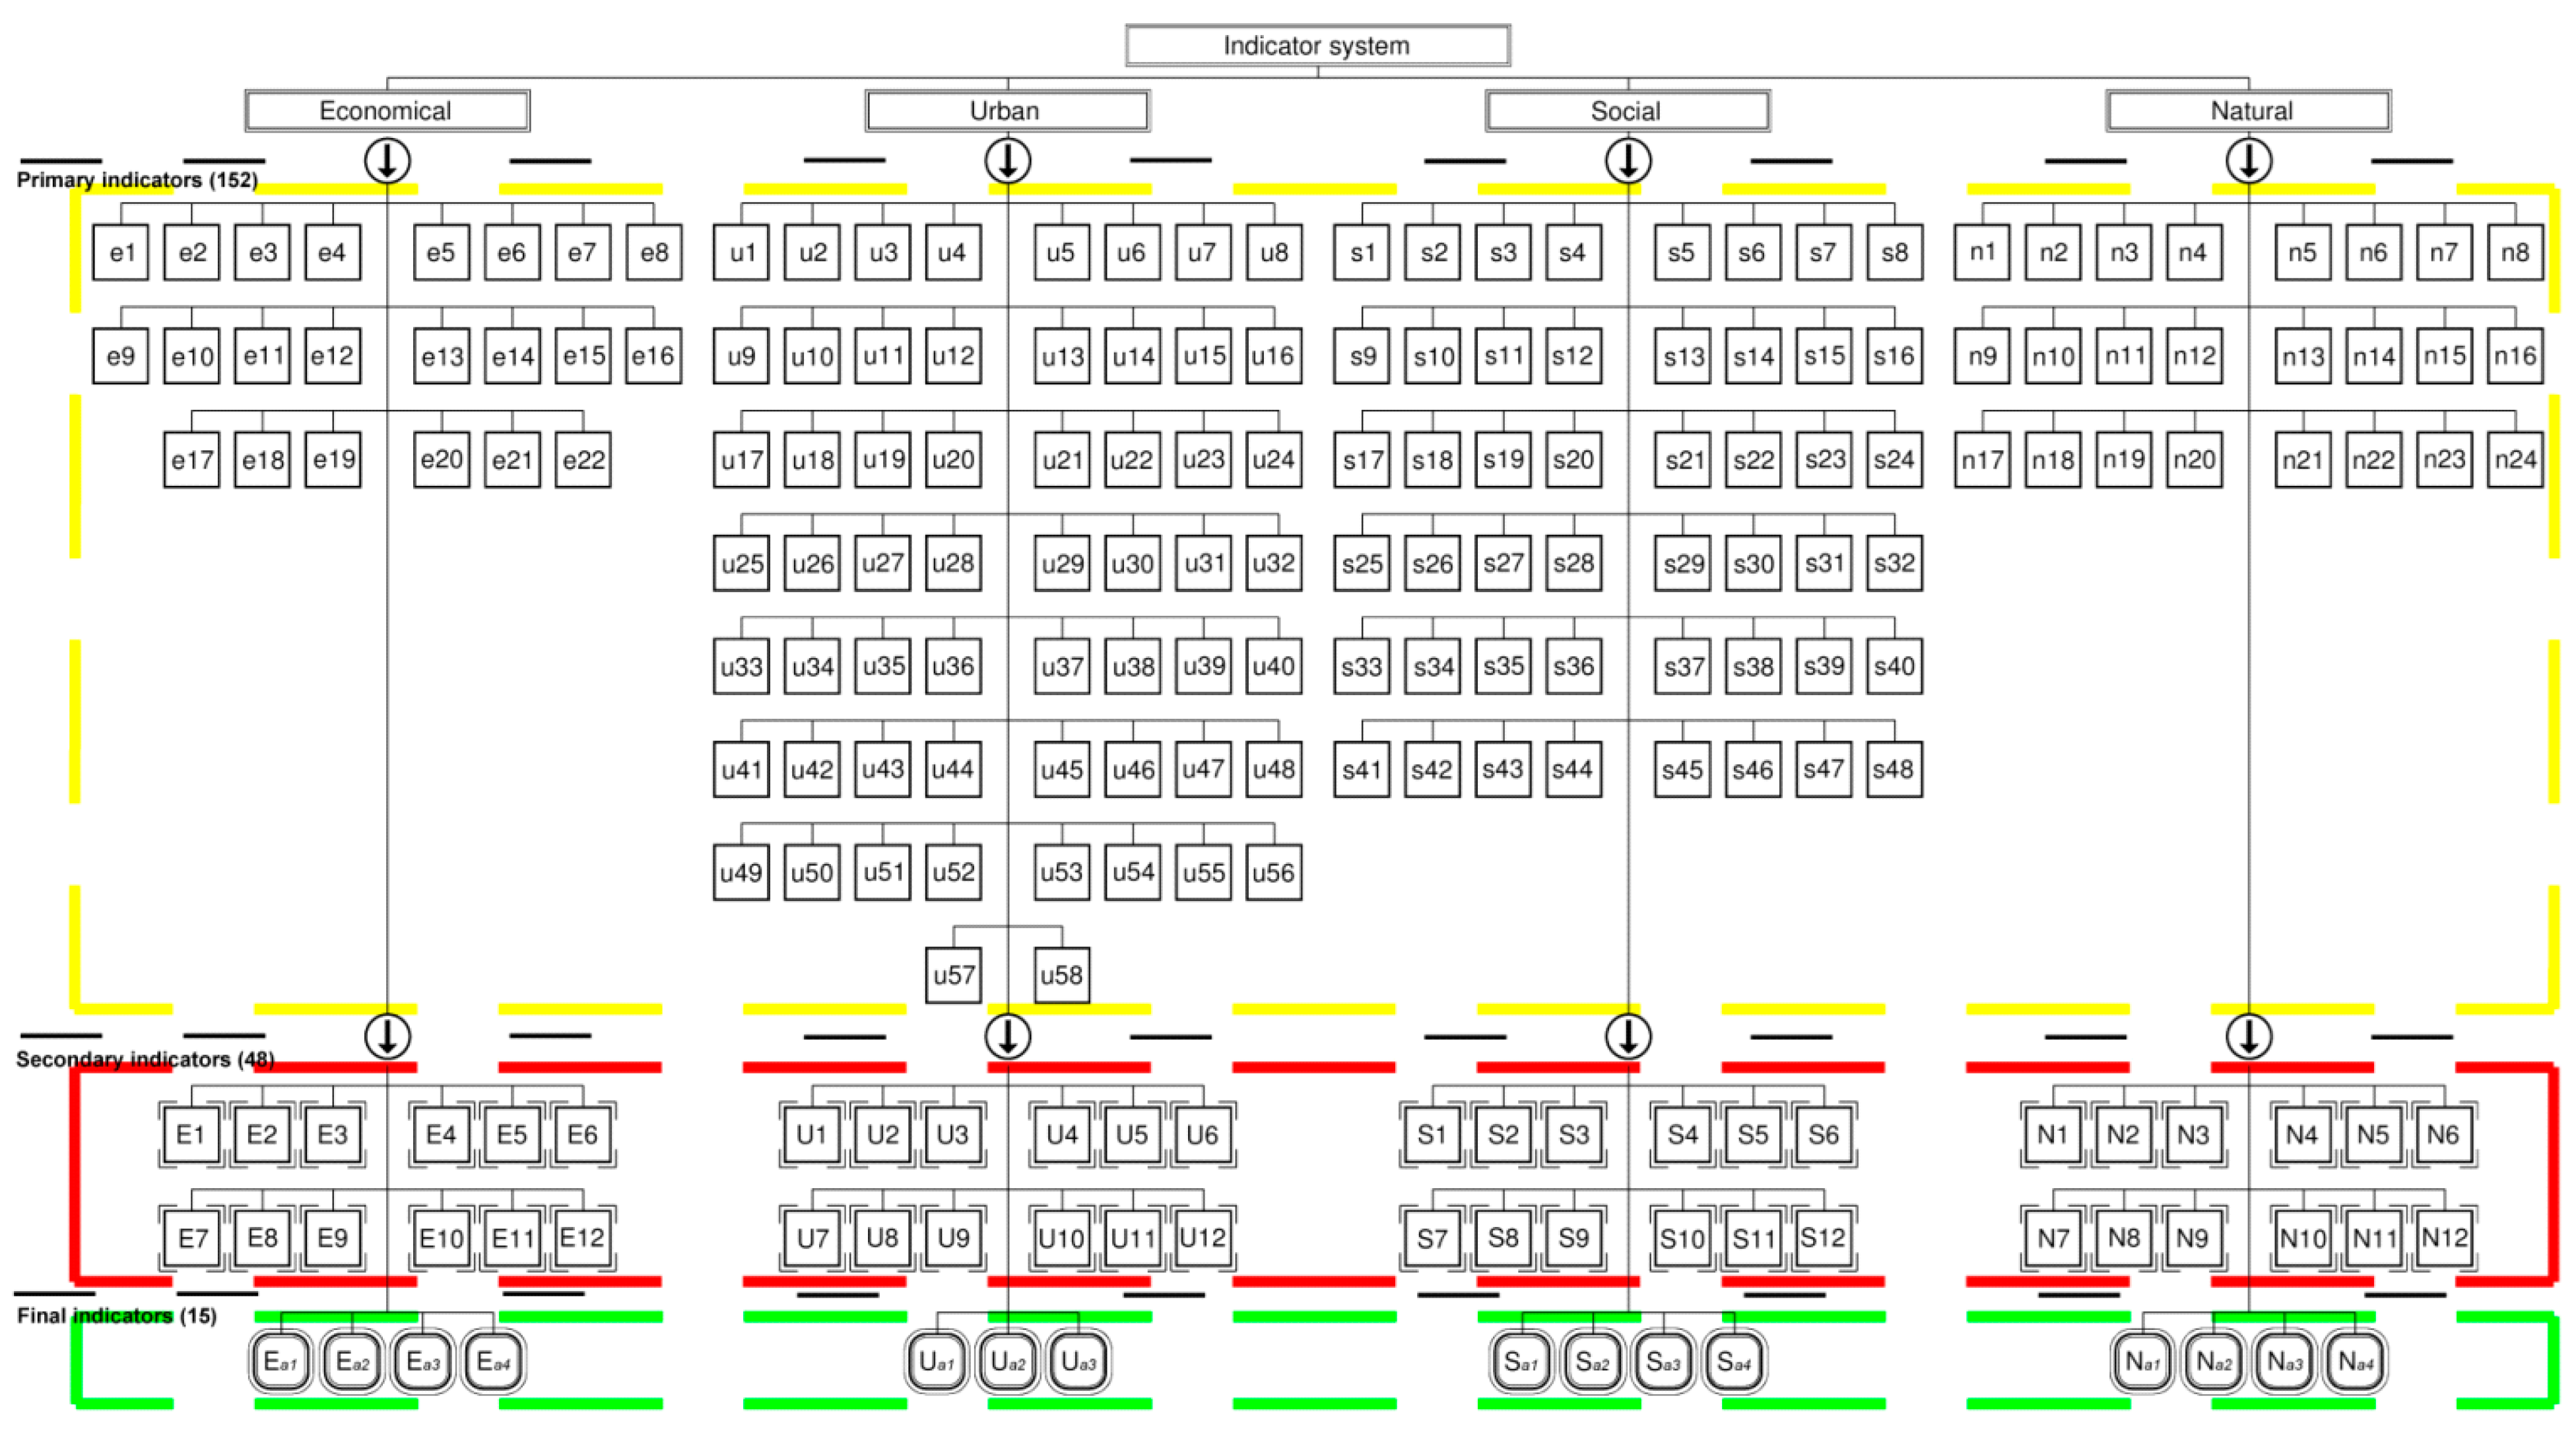
The essence of expert ranking in this study lies in the 20 most significant preventive indicators for brownfields selected based on expert questionnaires and 48 general indicators falling into four groups (12 in each) (j = 1,2,…,m, where m = 12).
Expert ranking provisions are described below and have been set to address a questionnaire to a particular expert (): the expert should hold a university/higher education degree, be employed and have at least 5 years experience working in the fields of territorial planning as well as social, economic, environmental protection and design. Questionnaires were presented to municipal territory planners (as recommended in HOMBRE (2013) project), experts in municipality investments and social care, practitioners who prepared documents on territorial planning (architectural, social, economic, natural, engineering and communication infrastructure projects), representatives of non-profit organizations solving the general problems of municipality, designers-engineers as well as experienced specialists holding certificates in environmental protection and able to work out documents necessary for planned economic activity. Ten experts completed questionnaires to rank preventive indicators falling into each group (i = 1,2,...,n, where n = 10) according to their field of activity.
To follow the procedure for expert ranking based on their work experience, the experts were asked to rank the grouped indicators () presented in the questionnaire prepared by the researchers. They were requested to point out the most significant indicators from the point of view of monitoring and change in time in order to warn about a high probability of this territory becoming a brownfield or abandoned territorial unit. The indicators of each group (economic, social, building and infrastructure, natural) were ranked by quantitative significance values, i.e., points () on a 10-point scale. The highest number of points (10) was given to the most significant indicator from the point of view of an expert (in terms of prediction) warning that a territory could become a brownfield in the future. The lowest number of points (0) was attributed to the least significant indicator of the group. Such expert ranking shows the priority given by the experts to the indicators of separate groups, and the significance weight of the indicators will be determined based on the obtained ranking. Then, the 20 most significant preventive indicators for brownfields will be distinguished.
The weights of significance given to the indicators of each expert group, based on the completed questionnaires and returned by the experts are shown in
Table 2. For futher calculations total numbers of points were used.
Table 2.
The values (points) of significance given by the experts to the preventive indicators in the economic group of brownfields.
Table 2.
The values (points) of significance given by the experts to the preventive indicators in the economic group of brownfields.
| Expert Code, i = 1,2,...,n | Indicator and the Values of Its Significance j = 1,2,···,m |
|---|
| X1 | X2 | X3 | X4 | X5 | X6 | X7 | X8 | X9 | X10 | X11 | X12 |
|---|
| E1 | 3 | 9 | 2 | 1 | 4 | 5 | 9 | 10 | 7 | 5 | 6 | 8 |
| E2 | 3 | 4 | 5 | 3 | 4 | 5 | 5 | 4 | 4 | 6 | 5 | 7 |
| E3 | 8 | 5 | 2 | 1 | 4 | 3 | 4 | 10 | 9 | 6 | 5 | 8 |
| E4 | 3 | 5 | 3 | 1 | 1 | 2 | 4 | 8 | 10 | 8 | 5 | 2 |
| E5 | 5 | 5 | 7 | 1 | 1 | 1 | 3 | 8 | 1 | 8 | 3 | 6 |
| E6 | 2 | 9 | 5 | 3 | 1 | 4 | 6 | 8 | 0 | 3 | 0 | 10 |
| E7 | 8 | 7 | 8 | 7 | 7 | 8 | 8 | 9 | 8 | 8 | 6 | 7 |
| E8 | 5 | 8 | 4 | 5 | 7 | 6 | 10 | 10 | 0 | 5 | 5 | 9 |
| E9 | 9 | 8 | 5 | 7 | 10 | 7 | 10 | 9 | 6 | 6 | 4 | 8 |
| E10 | 7 | 9 | 9 | 7 | 8 | 8 | 9 | 9 | 8 | 7 | 6 | 9 |
| Total number of points | 53 | 69 | 50 | 36 | 47 | 49 | 68 | 85 | 53 | 62 | 45 | 74 |
When the data obtained from the expert survey are input, calculations are made to substantiate the agreement among evaluators’ opinion.
3.2. Calculations Substantiating the Agreement Considering Evaluators’ Opinion
If the number of evaluators is higher than two, the level of the agreement between the experts of the group is expressed by the coefficient of concordance [
30,
31]. The calculated sum of all values of ranks’ standard deviation shows if an expert’s ranking significantly differs from the total average ranking. Therefore, the dependence of ranking may be expressed by the expert-ranking coefficient of concordance showing the degree of the similarity of individual ranking. The values of the coefficient of concordance,
W, vary within the range from 0 to 1 (in case of the agreement of all ranks, the coefficient of concordance is equal to 1). The higher is the coefficient of concordance, the stronger is the correlation of variables.
To calculate the coefficient of concordance, the expert ranking of the indicators has been applied [
28]. The indicators are ranked as follows: the most significant indicator is given the rank of 1, the second most significant indicator is given a rank higher than 1,
etc. until the last significant indicator is given number
m,
i.e., the number equal to the number of the indicators in the group. If the significance of several indicators, according to the expert opinion, is the same, then, both indicators are given the same rank. The values of significance (in points,
i.e.,
Bij) presented in
Table 2 and provided by the experts are converted to ranks (
). Ranking shows a hierarchy, and each rank indicates the level of significance in the hierarchy system. Equation (1) is employed for converting points to ranks:
where
Bij is the value of significance (point) given by expert
i (
i = 1,2,…,
n) to indicator
j (
j = 1,2,…,
m);
n is the number of experts; and
m is the number of indicators. The values of significance given by each expert to the indicator of the economic group are converted into ranks and presented in
Table 3.
Table 3.
Expert ranks in the group of economic indicators and their use for calculation purposes.
Table 3.
Expert ranks in the group of economic indicators and their use for calculation purposes.
| Expert code, i = 1,2,...,n | Indicator and the rank of its significance, j = 1,2,···,m |
|---|
| X1 | X2 | X3 | X4 | X5 | X6 | X7 | X8 | X9 | X10 | X11 | X12 |
|---|
| E1 | 10 | 4 | 11 | 12 | 9 | 8 | 4 | 3 | 6 | 8 | 7 | 5 |
| E2 | 10 | 9 | 8 | 10 | 9 | 8 | 8 | 9 | 9 | 7 | 8 | 6 |
| E3 | 5 | 8 | 11 | 12 | 9 | 10 | 9 | 3 | 4 | 7 | 8 | 5 |
| E4 | 10 | 8 | 10 | 12 | 12 | 11 | 9 | 5 | 3 | 5 | 8 | 11 |
| E5 | 8 | 8 | 6 | 12 | 12 | 12 | 10 | 5 | 12 | 5 | 10 | 7 |
| E6 | 11 | 4 | 8 | 10 | 12 | 9 | 7 | 4 | 13 | 10 | 13 | 3 |
| E7 | 5 | 6 | 5 | 6 | 6 | 5 | 5 | 4 | 5 | 5 | 7 | 6 |
| E8 | 8 | 5 | 9 | 8 | 6 | 7 | 3 | 3 | 13 | 8 | 8 | 4 |
| E9 | 4 | 5 | 8 | 6 | 3 | 6 | 3 | 4 | 7 | 7 | 9 | 5 |
| E10 | 6 | 4 | 4 | 6 | 5 | 5 | 4 | 4 | 5 | 6 | 7 | 4 |
| Sum of ranks | 77 | 61 | 80 | 94 | 83 | 81 | 62 | 44 | 77 | 68 | 85 | 56 |
| Average rank | 7.7 | 6.1 | 8.0 | 9.4 | 8.3 | 8.1 | 6.2 | 4.4 | 7.7 | 6.8 | 8.5 | 5.6 |
| 12 | −4 | 15 | 29 | 18 | 16 | −3 | −21 | 12 | 3 | 20 | −9 |
| 144 | 16 | 225 | 841 | 324 | 256 | 9 | 441 | 144 | 9 | 400 | 81 |
The agreement among expert ranking is determined by calculating Kendall’s coefficient of concordance W.
Kendall’s coefficient of concordance is related to the sum of the ranks of each indicator from the point of view of all experts [
31]. The average rank of each indicator is calculated according to Equation (2):
where
is a rank given by expert
i to indicator
j, and
n is the number of experts.
The sum of the ranks of each indicator, from the point of view of all experts, is calculated according to Equation (3):
A standard deviation from
values more accurately defines and shows correlation with Kendall’s coefficient of concordance. The latter deviation is calculated according to Equation (4):
The total mean is calculated according to Equation (5):
The coefficient of concordance is calculated by Equation (6) [
29,
32,
33]:
Suppose that the number of indicators is
m > 7 (in our case 12 > 7); then, the significance of the coefficient of concordance may be calculated by Pearson criterion
[
31]:
A random value is distributed according to
distribution when the degree of freedom is
. The accepted significance level
is 0.05 (in practice, value
is frequently used), and critical value
is calculated according to
distribution table. The estimated
shows that all evaluators are in complete agreement (see
Table 4).
Table 4.
Calculation results of the expert ranking agreement in the groups of economic, social, building and infrastructure, and natural settings.
Table 4.
Calculation results of the expert ranking agreement in the groups of economic, social, building and infrastructure, and natural settings.
| | Economic Indicators | Social Indicators | Building and Infrastructure Indicators | Natural Indicators |
|---|
| S | 2890 | 2851 | 3808 | 2558 |
| W | 0.202098 | 0.199371 | 0.266294 | 0.178881 |
| χ2 | 22.23077 | 21.93077 | 29.29231 | 19.67692 |
| 19.6751 |
| | Evaluation of the compliance of the expert ranking agreement to condition |
| Yes | Yes | Yes | Yes |
The calculation results enable stating that the expert ranking of all indicators in economic, social, building and infrastructure as well as natural settings is in complete agreement.
In practice, for making certain calculations, it is more convenient to apply to the indicators of similar significance the best value, of which is the highest value [
29]. Significance indicators are estimated calculating
value according to Equation (8):
When ranks have been normalized, the most significant indicator is the one that has the least estimated value. The final values are determined considering each indicator by calculating the reciprocal, , and then by estimating the value of significance taking into account each indicator. The sum of the calculated significance of indicators is equal to 1.
Reciprocal,
, is calculated according to Equation (9), and significance indicator,
, of each indicator is calculated according to Equation (10) [
34]. Significance indicator,
, will enable researchers to prove the significance of the indicators by comparing them as well as to identify how many times one indicator is more significant than the other, which allows selecting the most significant indicators from a group of indicators and making a list of the 20 most significant indicators.
where
m is the number of the indicators showing the characteristics of brownfield creation;
is the average rank of indicator
j, calculated according to Equation (2). The values of indicators for determining the hierarchy in each settings are represented in
Table 5.
Table 5.
The values of the indicators for determining the hierarchy in economic, social, urban and natural settings.
Table 5.
The values of the indicators for determining the hierarchy in economic, social, urban and natural settings.
| | Indicator, j = 1,2,···,m |
|---|
| | X1 | X2 | X3 | X4 | X5 | X6 | X7 | X8 | X9 | X10 | X11 | X12 | Sum |
|---|
| | Economic indicators |
| 0.089 | 0.070 | 0.092 | 0.108 | 0.096 | 0.093 | 0.071 | 0.051 | 0.089 | 0.078 | 0.098 | 0.065 | =1 |
| 0.911 | 0.930 | 0.908 | 0.892 | 0.904 | 0.907 | 0.929 | 0.949 | 0.911 | 0.922 | 0.902 | 0.935 | |
| 0.061 | 0.079 | 0.058 | 0.041 | 0.054 | 0.056 | 0.078 | 0.099 | 0.061 | 0.071 | 0.052 | 0.085 | =1 |
| Hierarchy | 7 | 3 | 8 | 12 | 10 | 9 | 4 | 1 | 6 | 5 | 11 | 2 | |
| | Social indicators |
| 0.081 | 0.063 | 0.104 | 0.069 | 0.062 | 0.068 | 0.095 | 0.103 | 0.071 | 0.068 | 0.123 | 0.093 | =1 |
| 0.919 | 0.937 | 0.896 | 0.931 | 0.938 | 0.932 | 0.905 | 0.897 | 0.929 | 0.932 | 0.877 | 0.907 | |
| 0.081 | 0.098 | 0.057 | 0.092 | 0.099 | 0.093 | 0.066 | 0.058 | 0.090 | 0.093 | 0.038 | 0.068 | =1 |
| Hierarchy | 6_7 | 2 | 11 | 5 | 1 | 3_4 | 9 | 10 | 6_7 | 3_4 | 12 | 8 | |
| | Urban indicators |
| 0.100 | 0.078 | 0.062 | 0.062 | 0.072 | 0.091 | 0.077 | 0.070 | 0.081 | 0.103 | 0.114 | 0.092 | =1 |
| 0.900 | 0.922 | 0.938 | 0.938 | 0.928 | 0.909 | 0.923 | 0.930 | 0.919 | 0.897 | 0.886 | 0.908 | |
| 0.043 | 0.065 | 0.082 | 0.082 | 0.072 | 0.053 | 0.066 | 0.074 | 0.063 | 0.041 | 0.030 | 0.052 | =1 |
| Hierarchy | 10 | 6 | 1_2 | 1_2 | 4 | 8 | 5 | 3 | 7 | 11 | 12 | 9 | |
| | Natural indicators |
| 0.075 | 0.068 | 0.116 | 0.065 | 0.119 | 0.091 | 0.054 | 0.075 | 0.081 | 0.101 | 0.081 | 0.075 | =1 |
| 0.925 | 0.932 | 0.884 | 0.935 | 0.881 | 0.909 | 0.946 | 0.925 | 0.919 | 0.899 | 0.919 | 0.925 | |
| 0.105 | 0.112 | 0.064 | 0.115 | 0.061 | 0.088 | 0.126 | 0.105 | 0.098 | 0.079 | 0.098 | 0.105 | =1 |
| Hierarchy | 6 | 3 | 11 | 2 | 12 | 9 | 1 | 4_5 | 7_8 | 10 | 7_8 | 4_5 | |
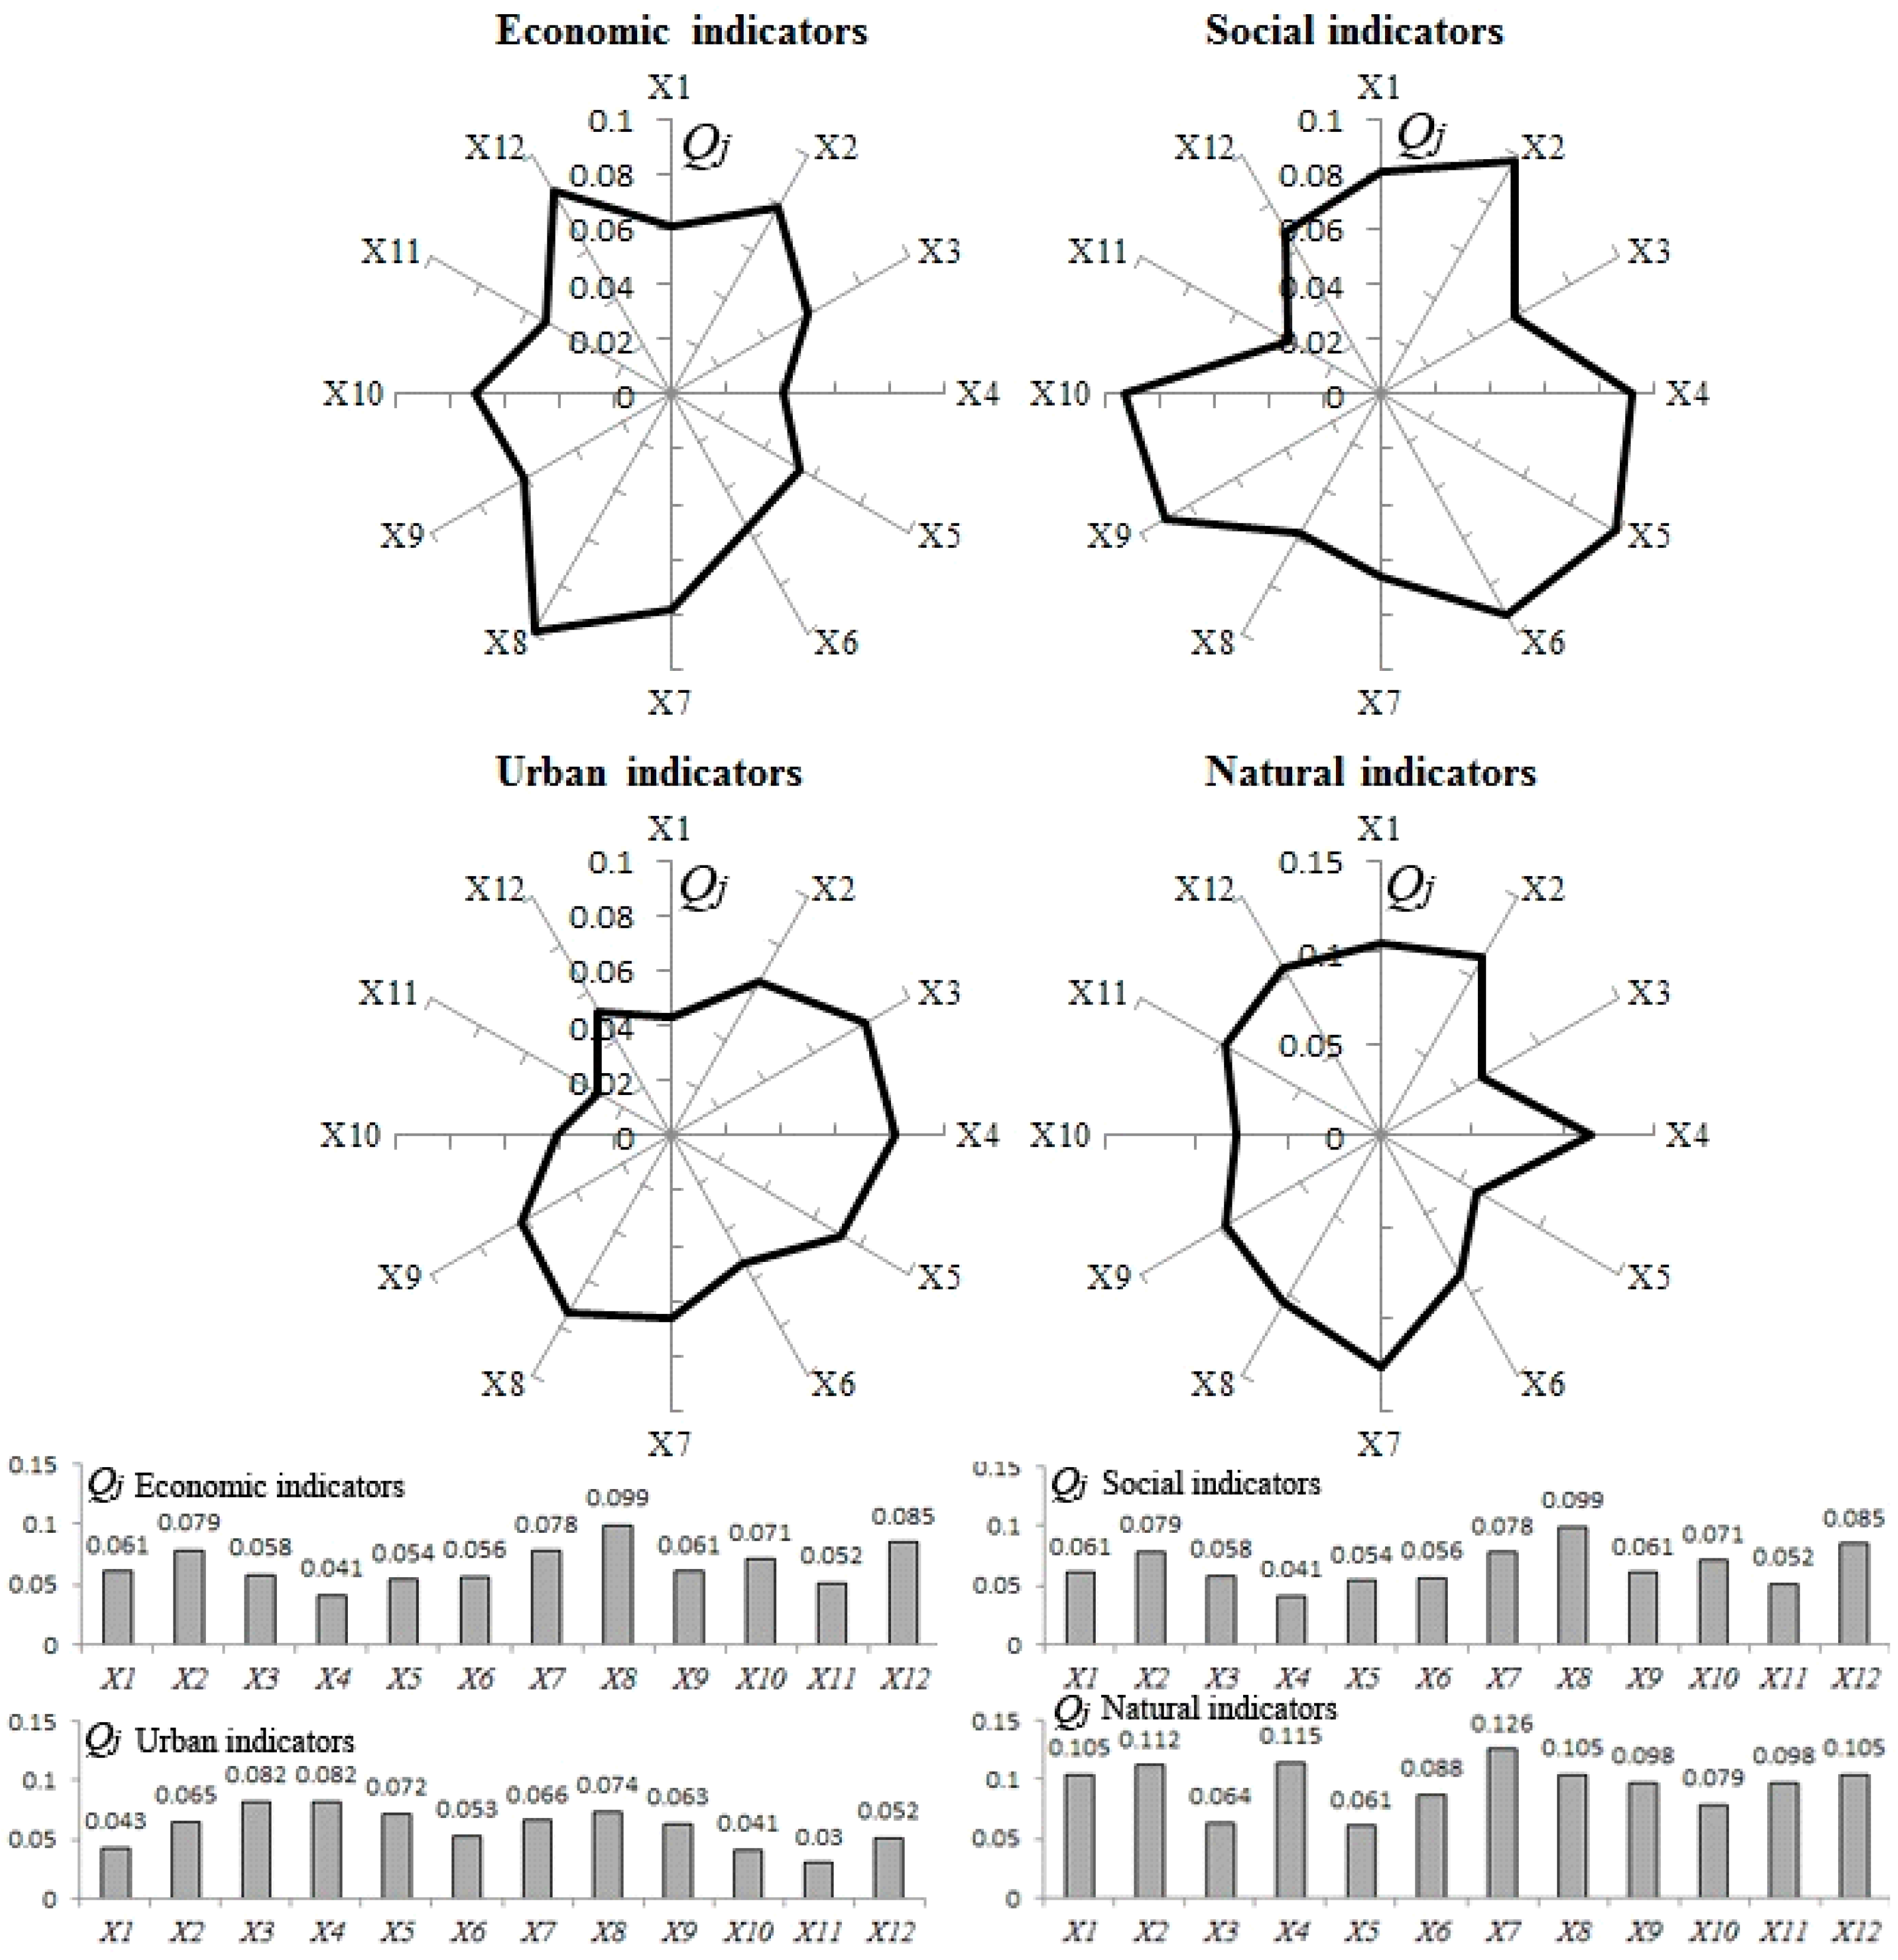
The graphical view of the evaluated indicators using the MCDM method is represented in
Figure 2.
The results of the calculations allow identifying the most significant indicator for the issues of brownfield territories featured by the common properties of economy, ecology and social and urban environment in the context of Vilnius City as well as with regard to other countries formerly occupied by the Soviet Union.
Figure 2.
The calculated values of significance, considering each indicator in the secondary group of indicators. Schematic (at the top) and comparative (at the bottom) representation.
Figure 2.
The calculated values of significance, considering each indicator in the secondary group of indicators. Schematic (at the top) and comparative (at the bottom) representation.


