
The Relationship between Urbanization, Economic Growth and Energy Consumption in China: An Econometric Perspective Analysis

Abstract
:1. Introduction
2. Methodology and Data
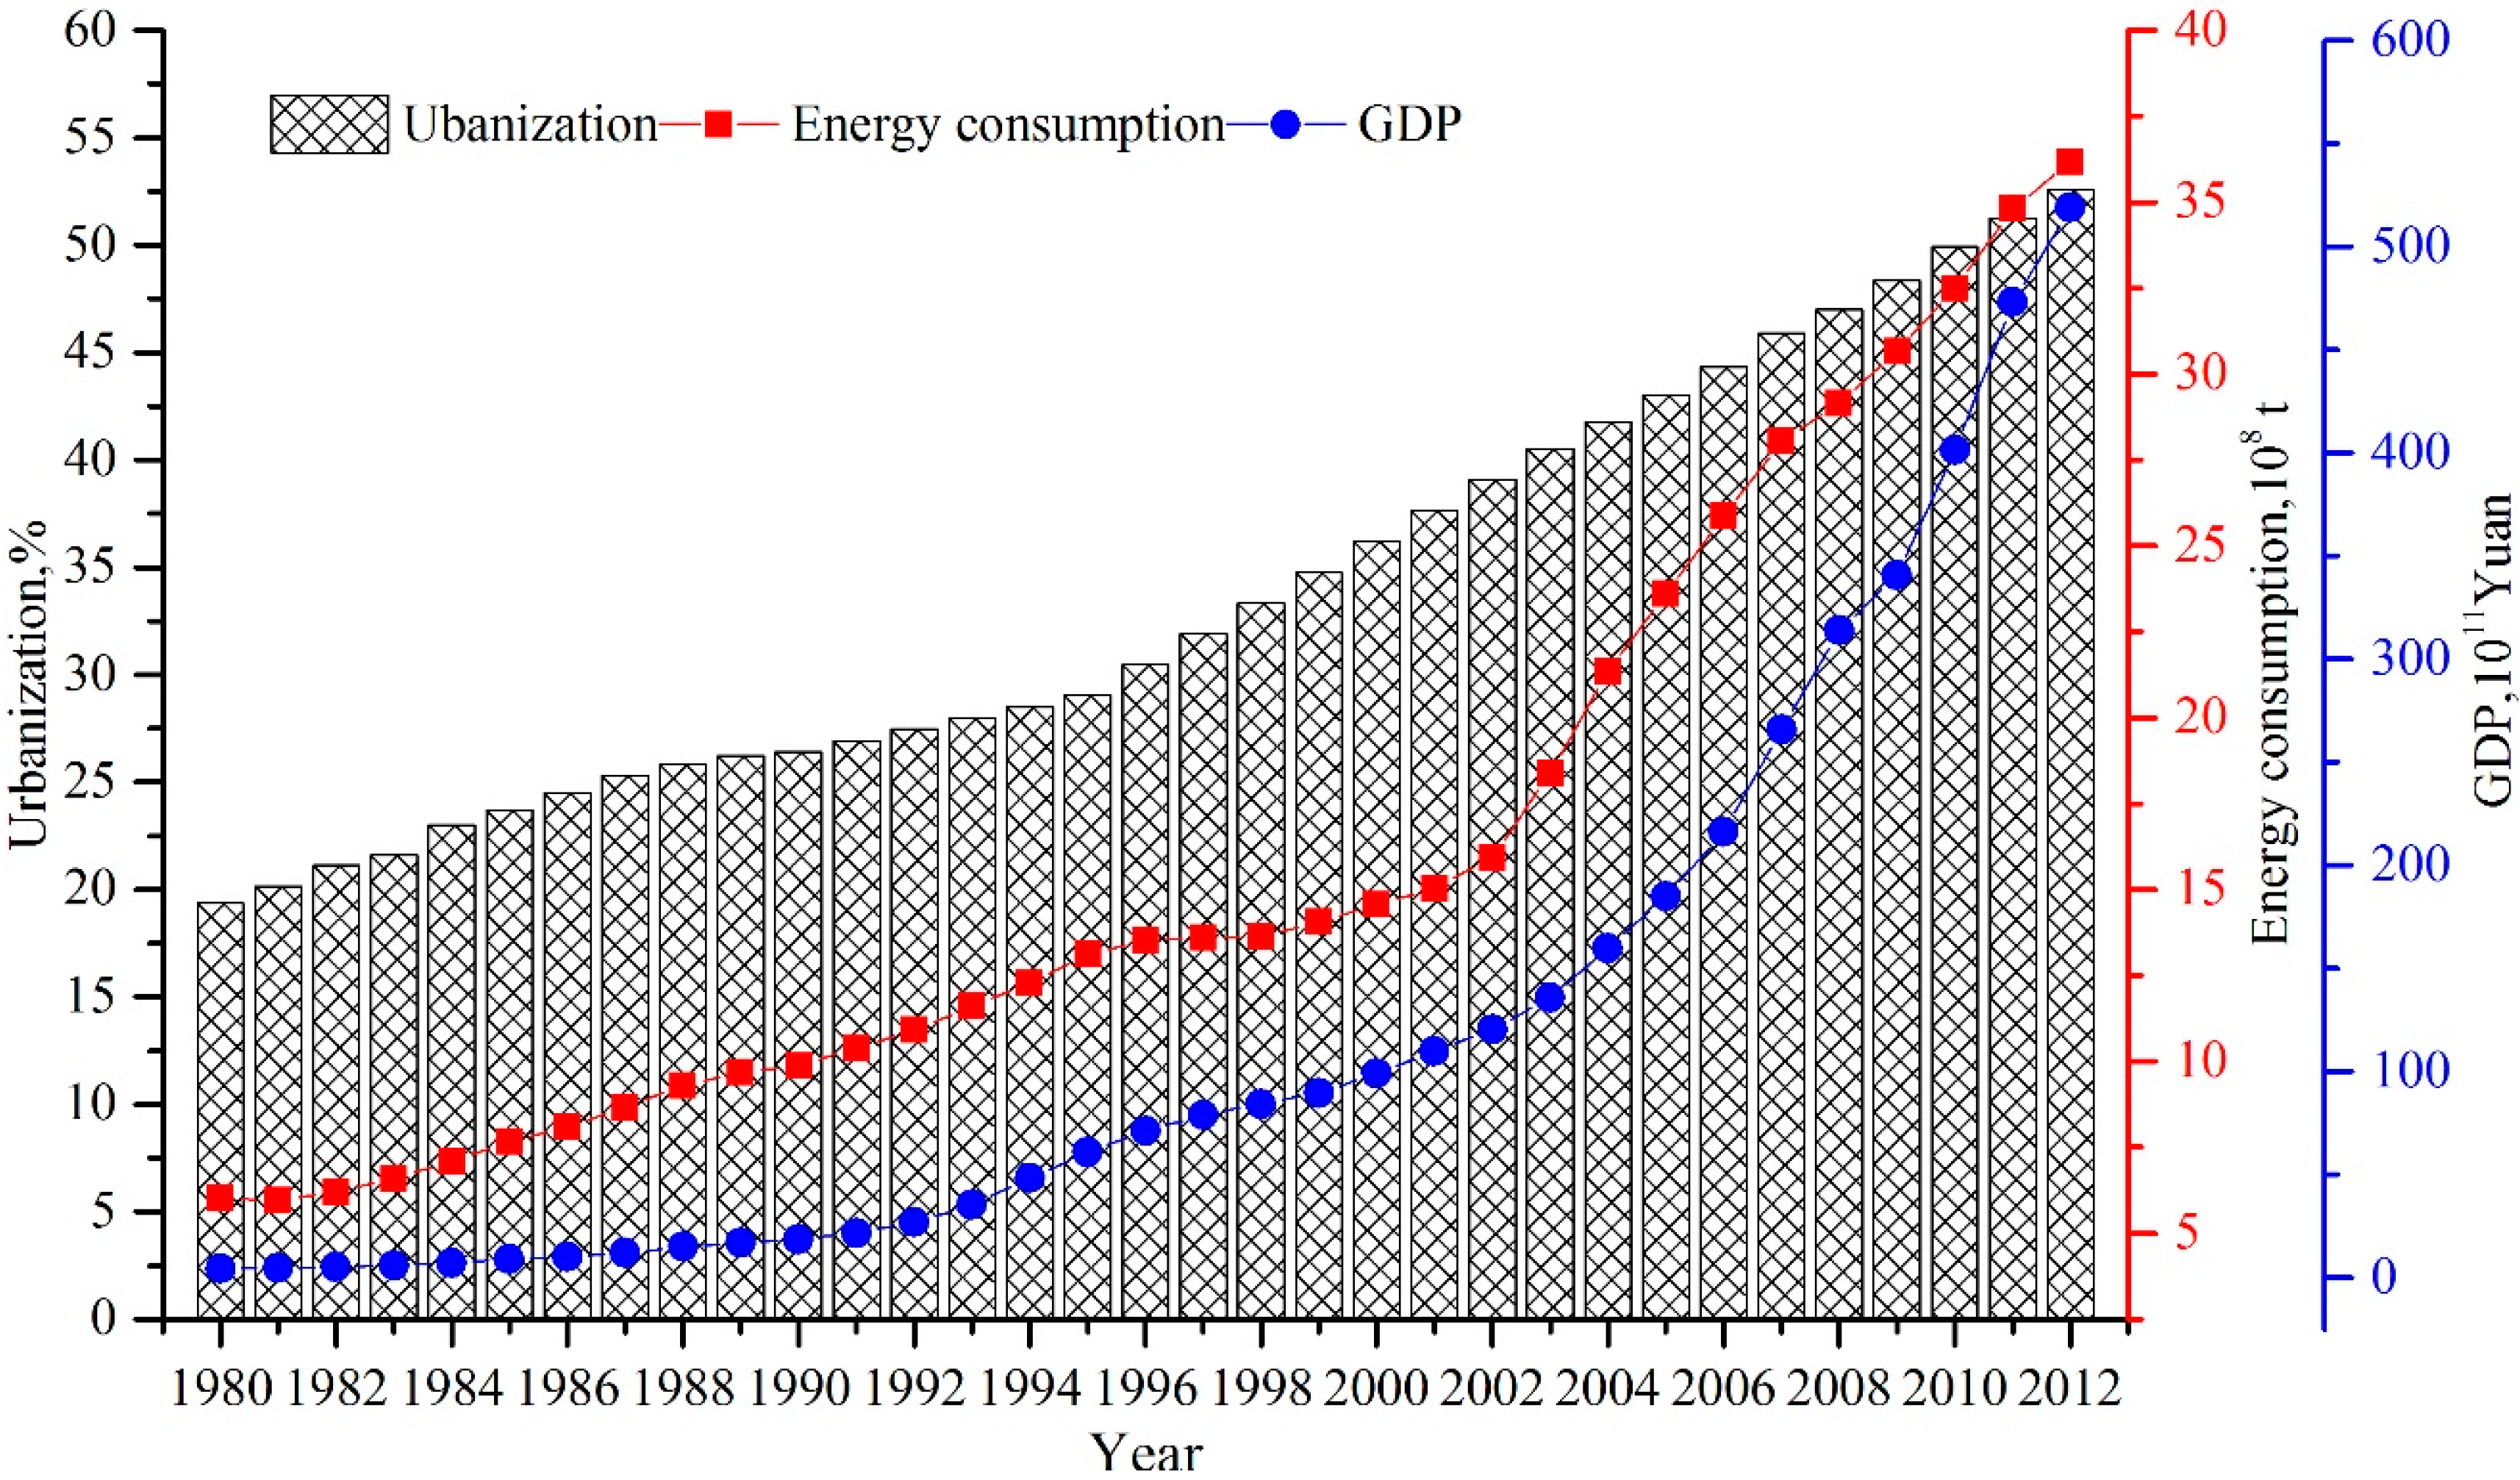
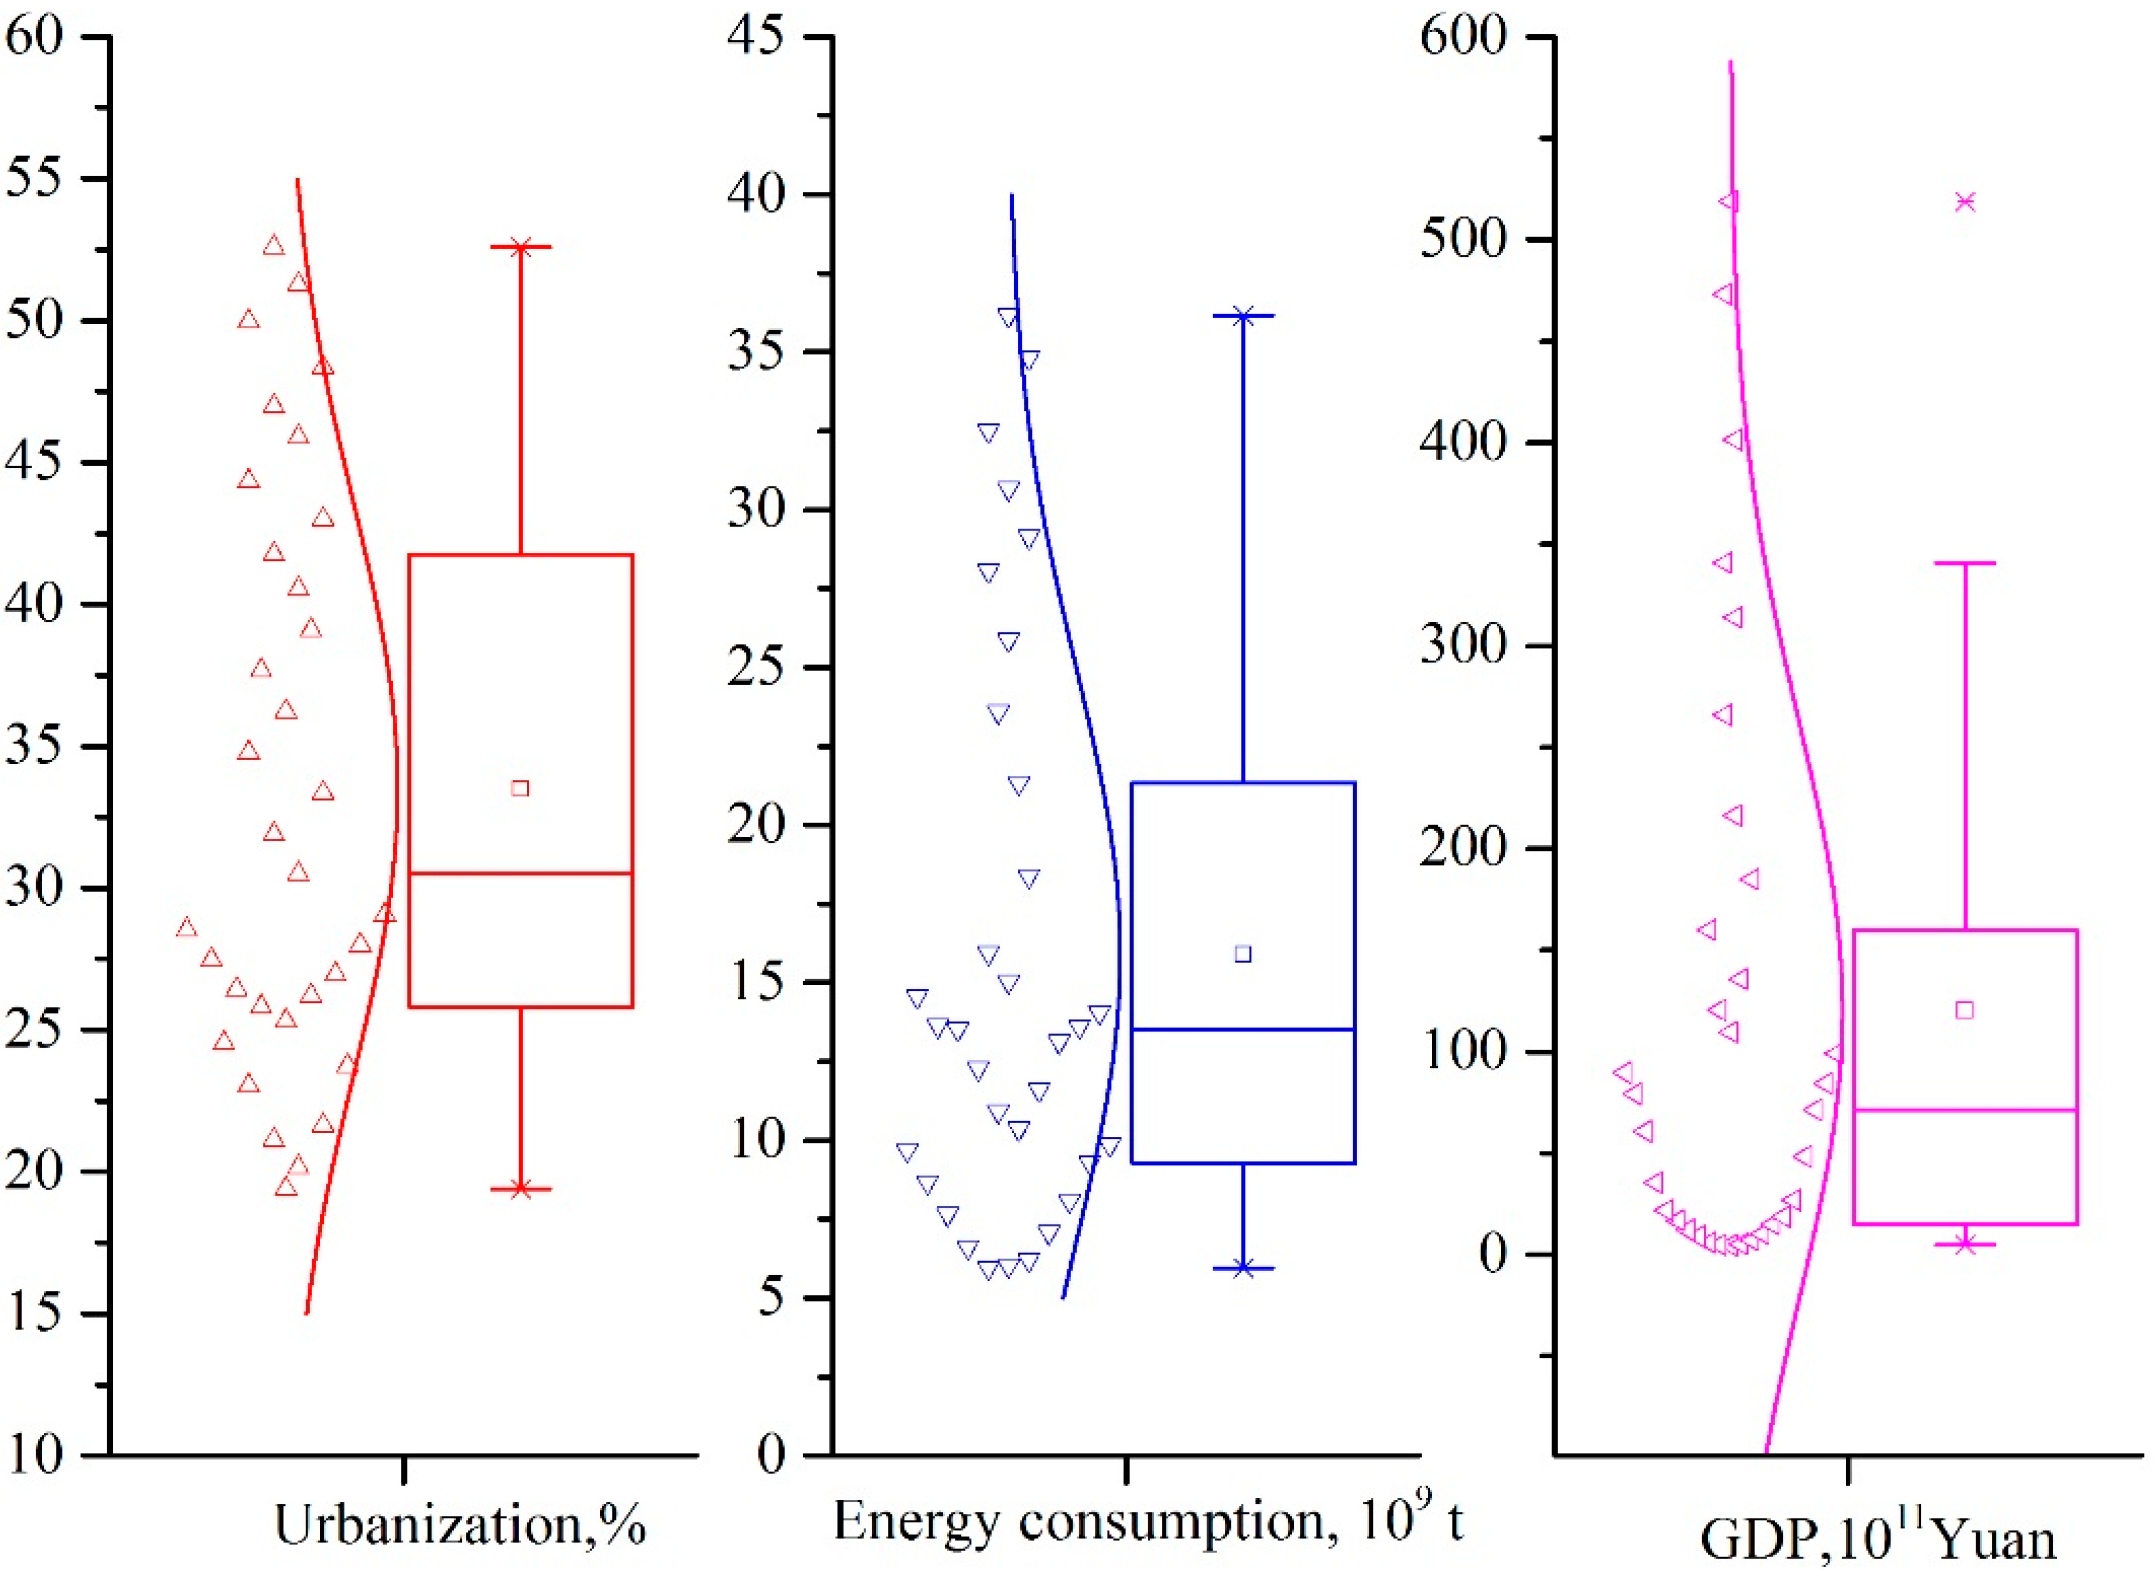
2.1. Data Source and Pre-Analysis

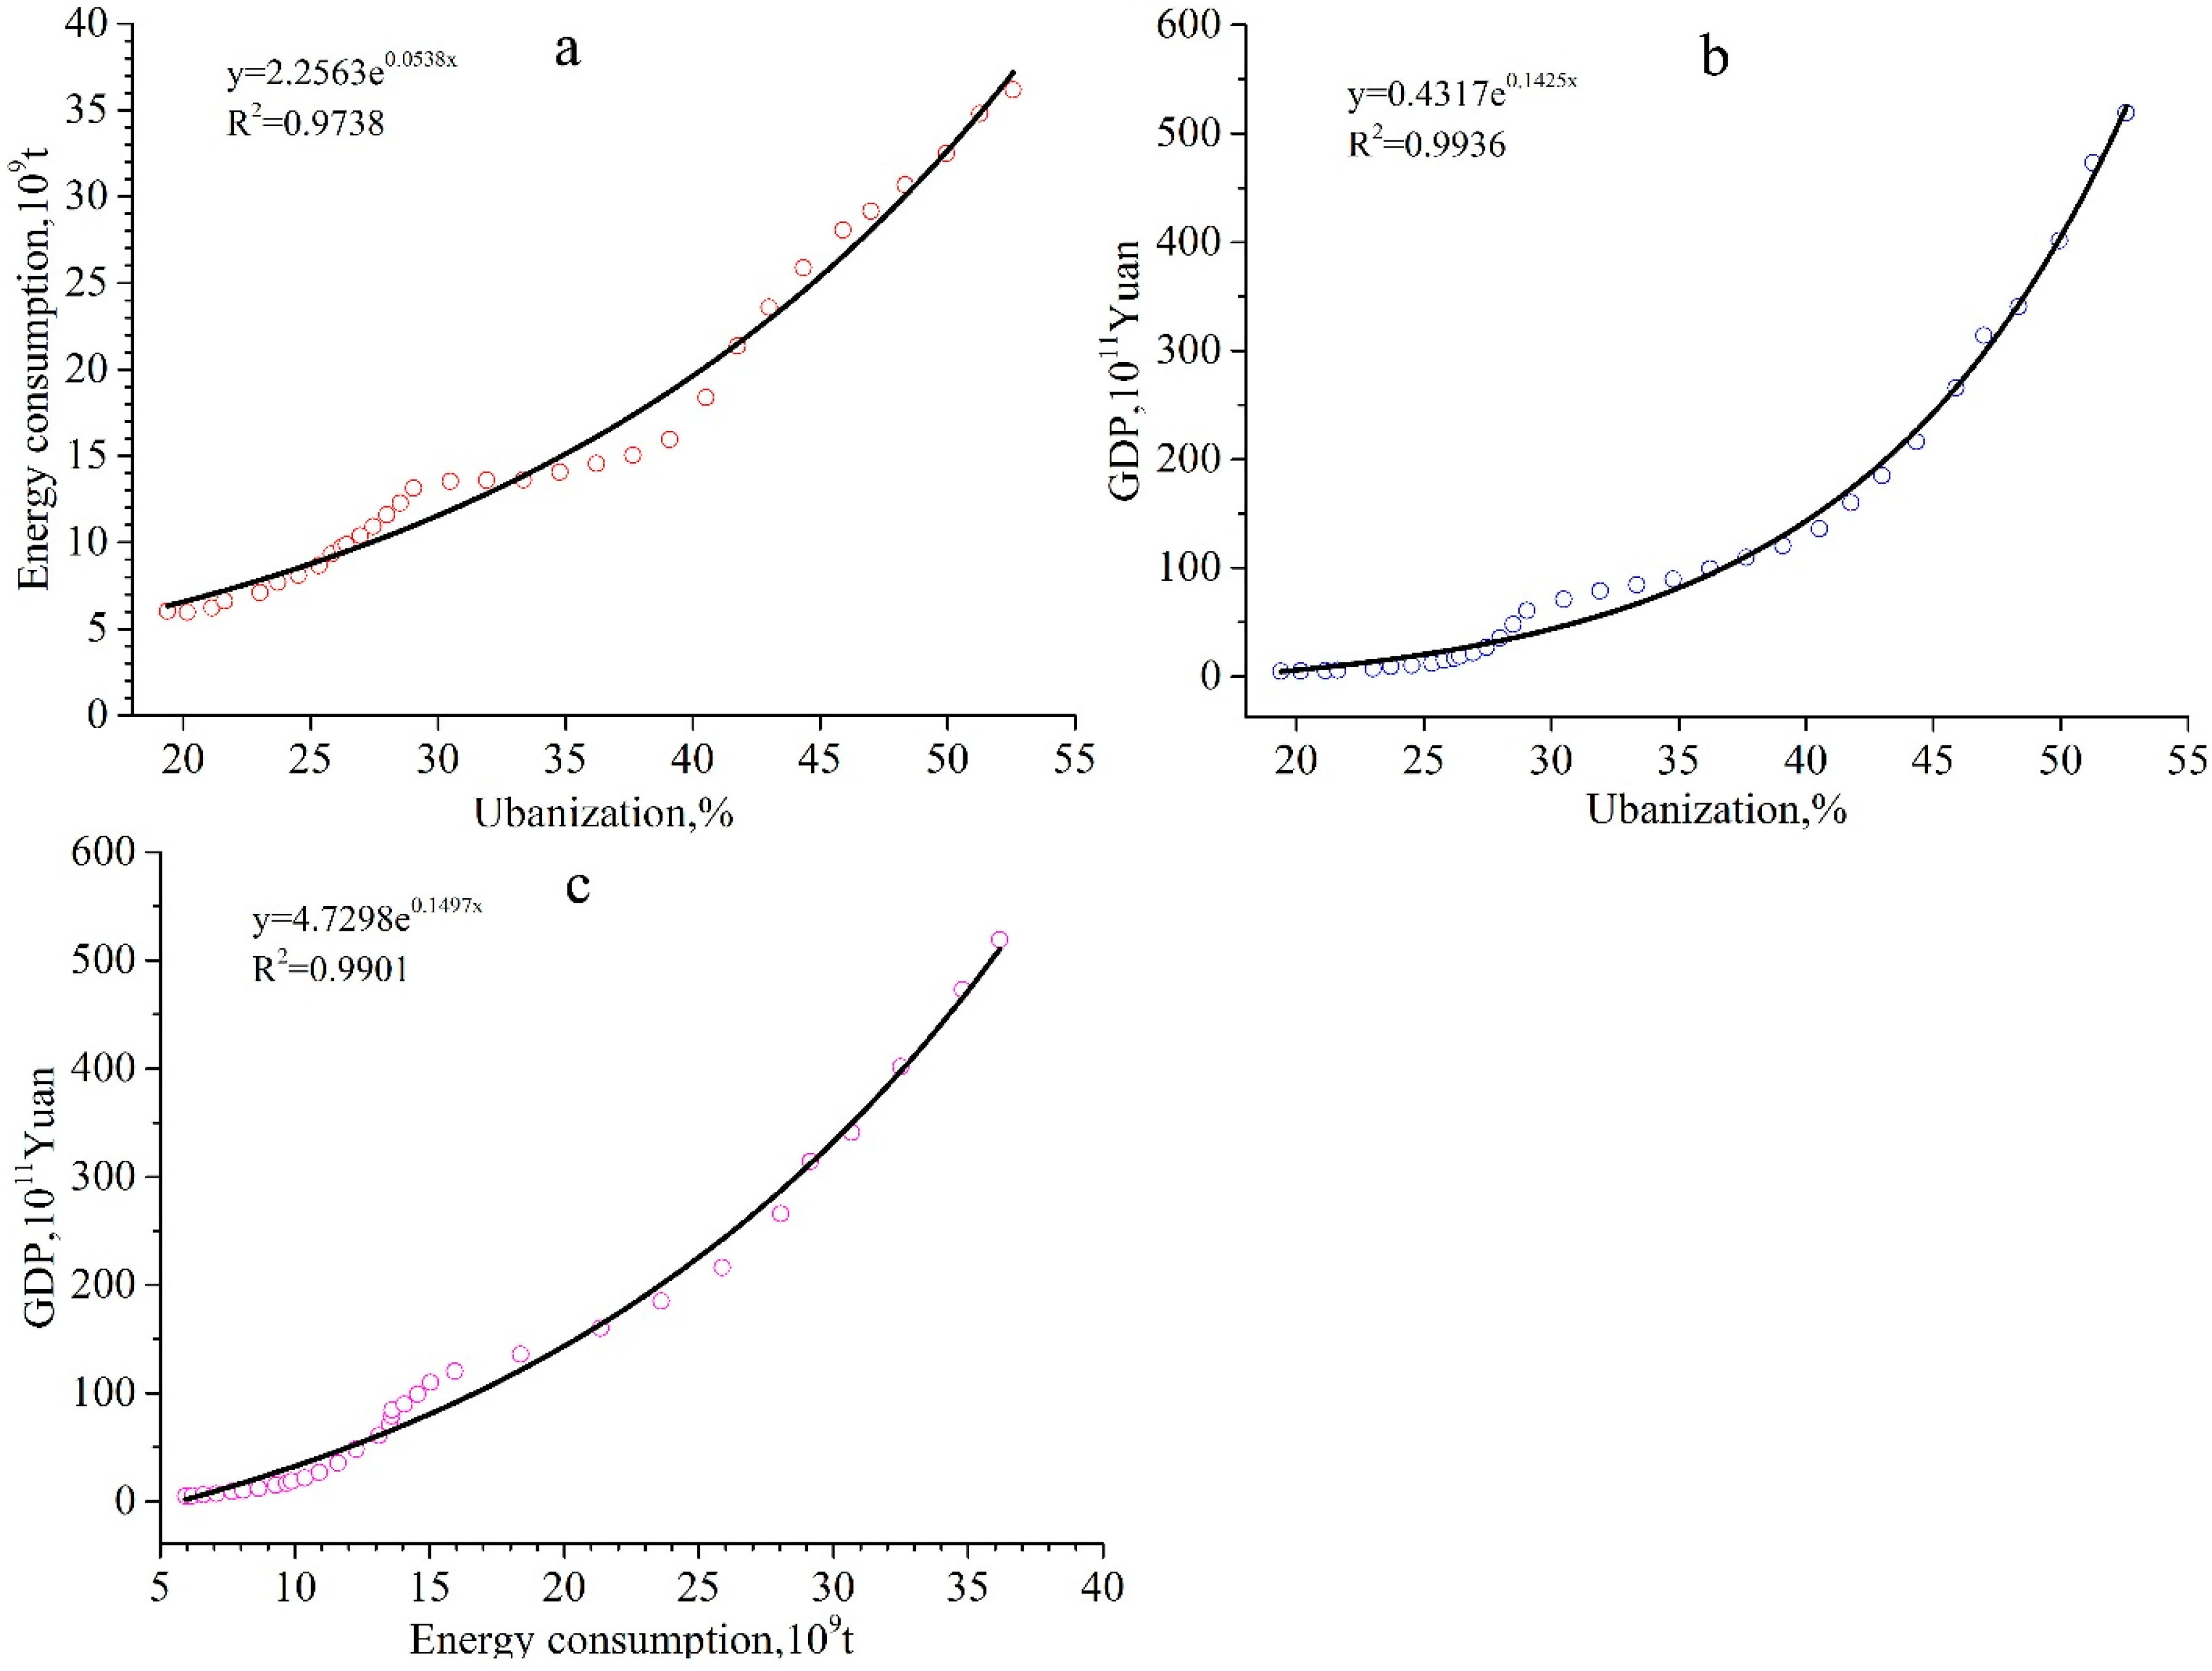

2.2. Conceptual Framework

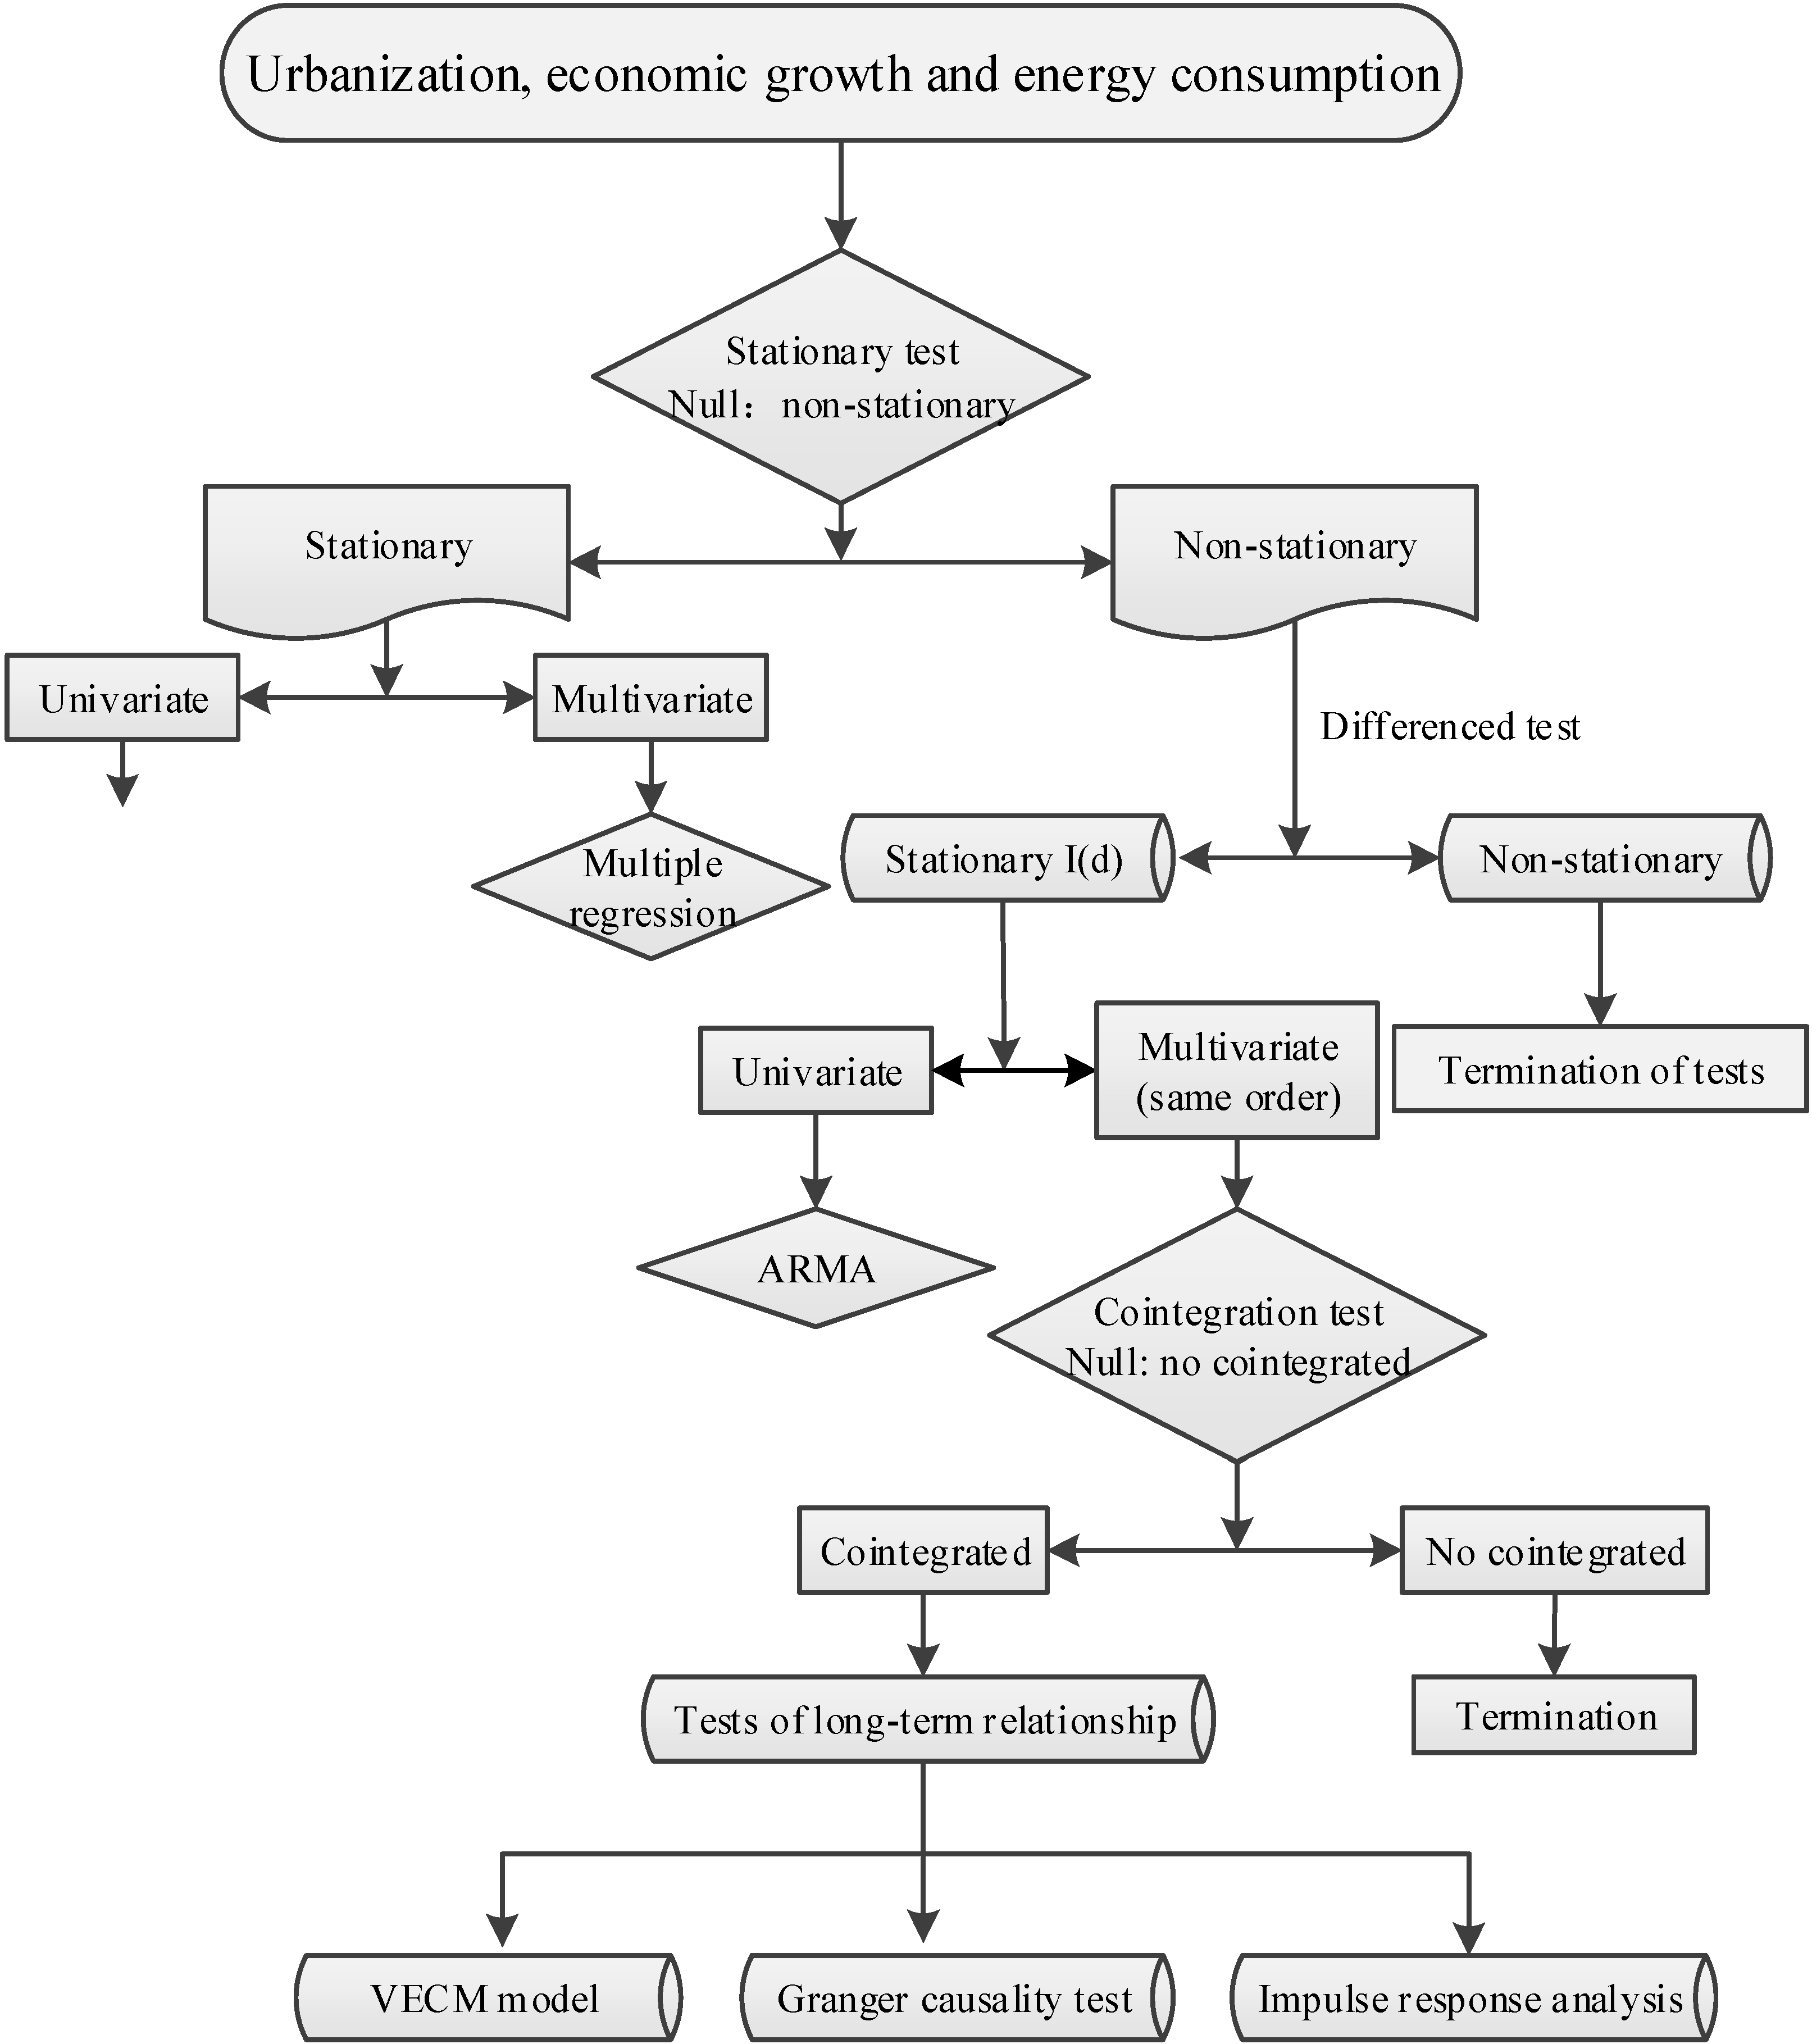
2.3. Econometric Methodology
2.3.1. Unit Root Test
2.3.2. Cointegration Test
2.3.3. Vector Error Correction Model
2.3.4. Impulse Response Analysis
2.3.5. Granger Causality Test
3. Results and Discussion
3.1. Results of Unit Root Tests
3.2. Results of Cointegration Test

| TURBAN | ΔTURBAN | EC | ΔEC | GDP | ΔGDP | |||||||
|---|---|---|---|---|---|---|---|---|---|---|---|---|
| Intercept | Intercept and trend | Intercept | Intercept and trend | Intercept | Intercept and trend | Intercept | Intercept and trend | Intercept | Intercept and trend | Intercept | Intercept and trend | |
| DF-GLS | 0.256 | −1.048 | −2.522 ** | −3.786 *** | −0.472 | −2.418 | −2.095 ** | −3.073 * | 0.282 | −2.717 | −2.034 ** | −3.634 ** |
| ADF | 2.761 | 2.919 | −2.656 * | −3.860 ** | 0.627 | −2.235 | −2.930 ** | −3.046 * | 3.167 | 3.124 | −2.731 * | −3.431 * |
| PP | 8.000 | 1.657 | −3.163 ** | −3.706 ** | 0.922 | −1.558 | −3.319 *** | −3.148 ** | 13.123 | 5.368 | −0.673 | −3.665 * |
| Series | ADF Test | Critical Value (1% Significant Level) | Critical Value (5% Significant Level) | Critical Value (10% Significant Level) | Stationary/Non-Stationary |
|---|---|---|---|---|---|
| et | −3.643245 | −3.661661 | −2.960411 | −2.619160 | Stationary ** |
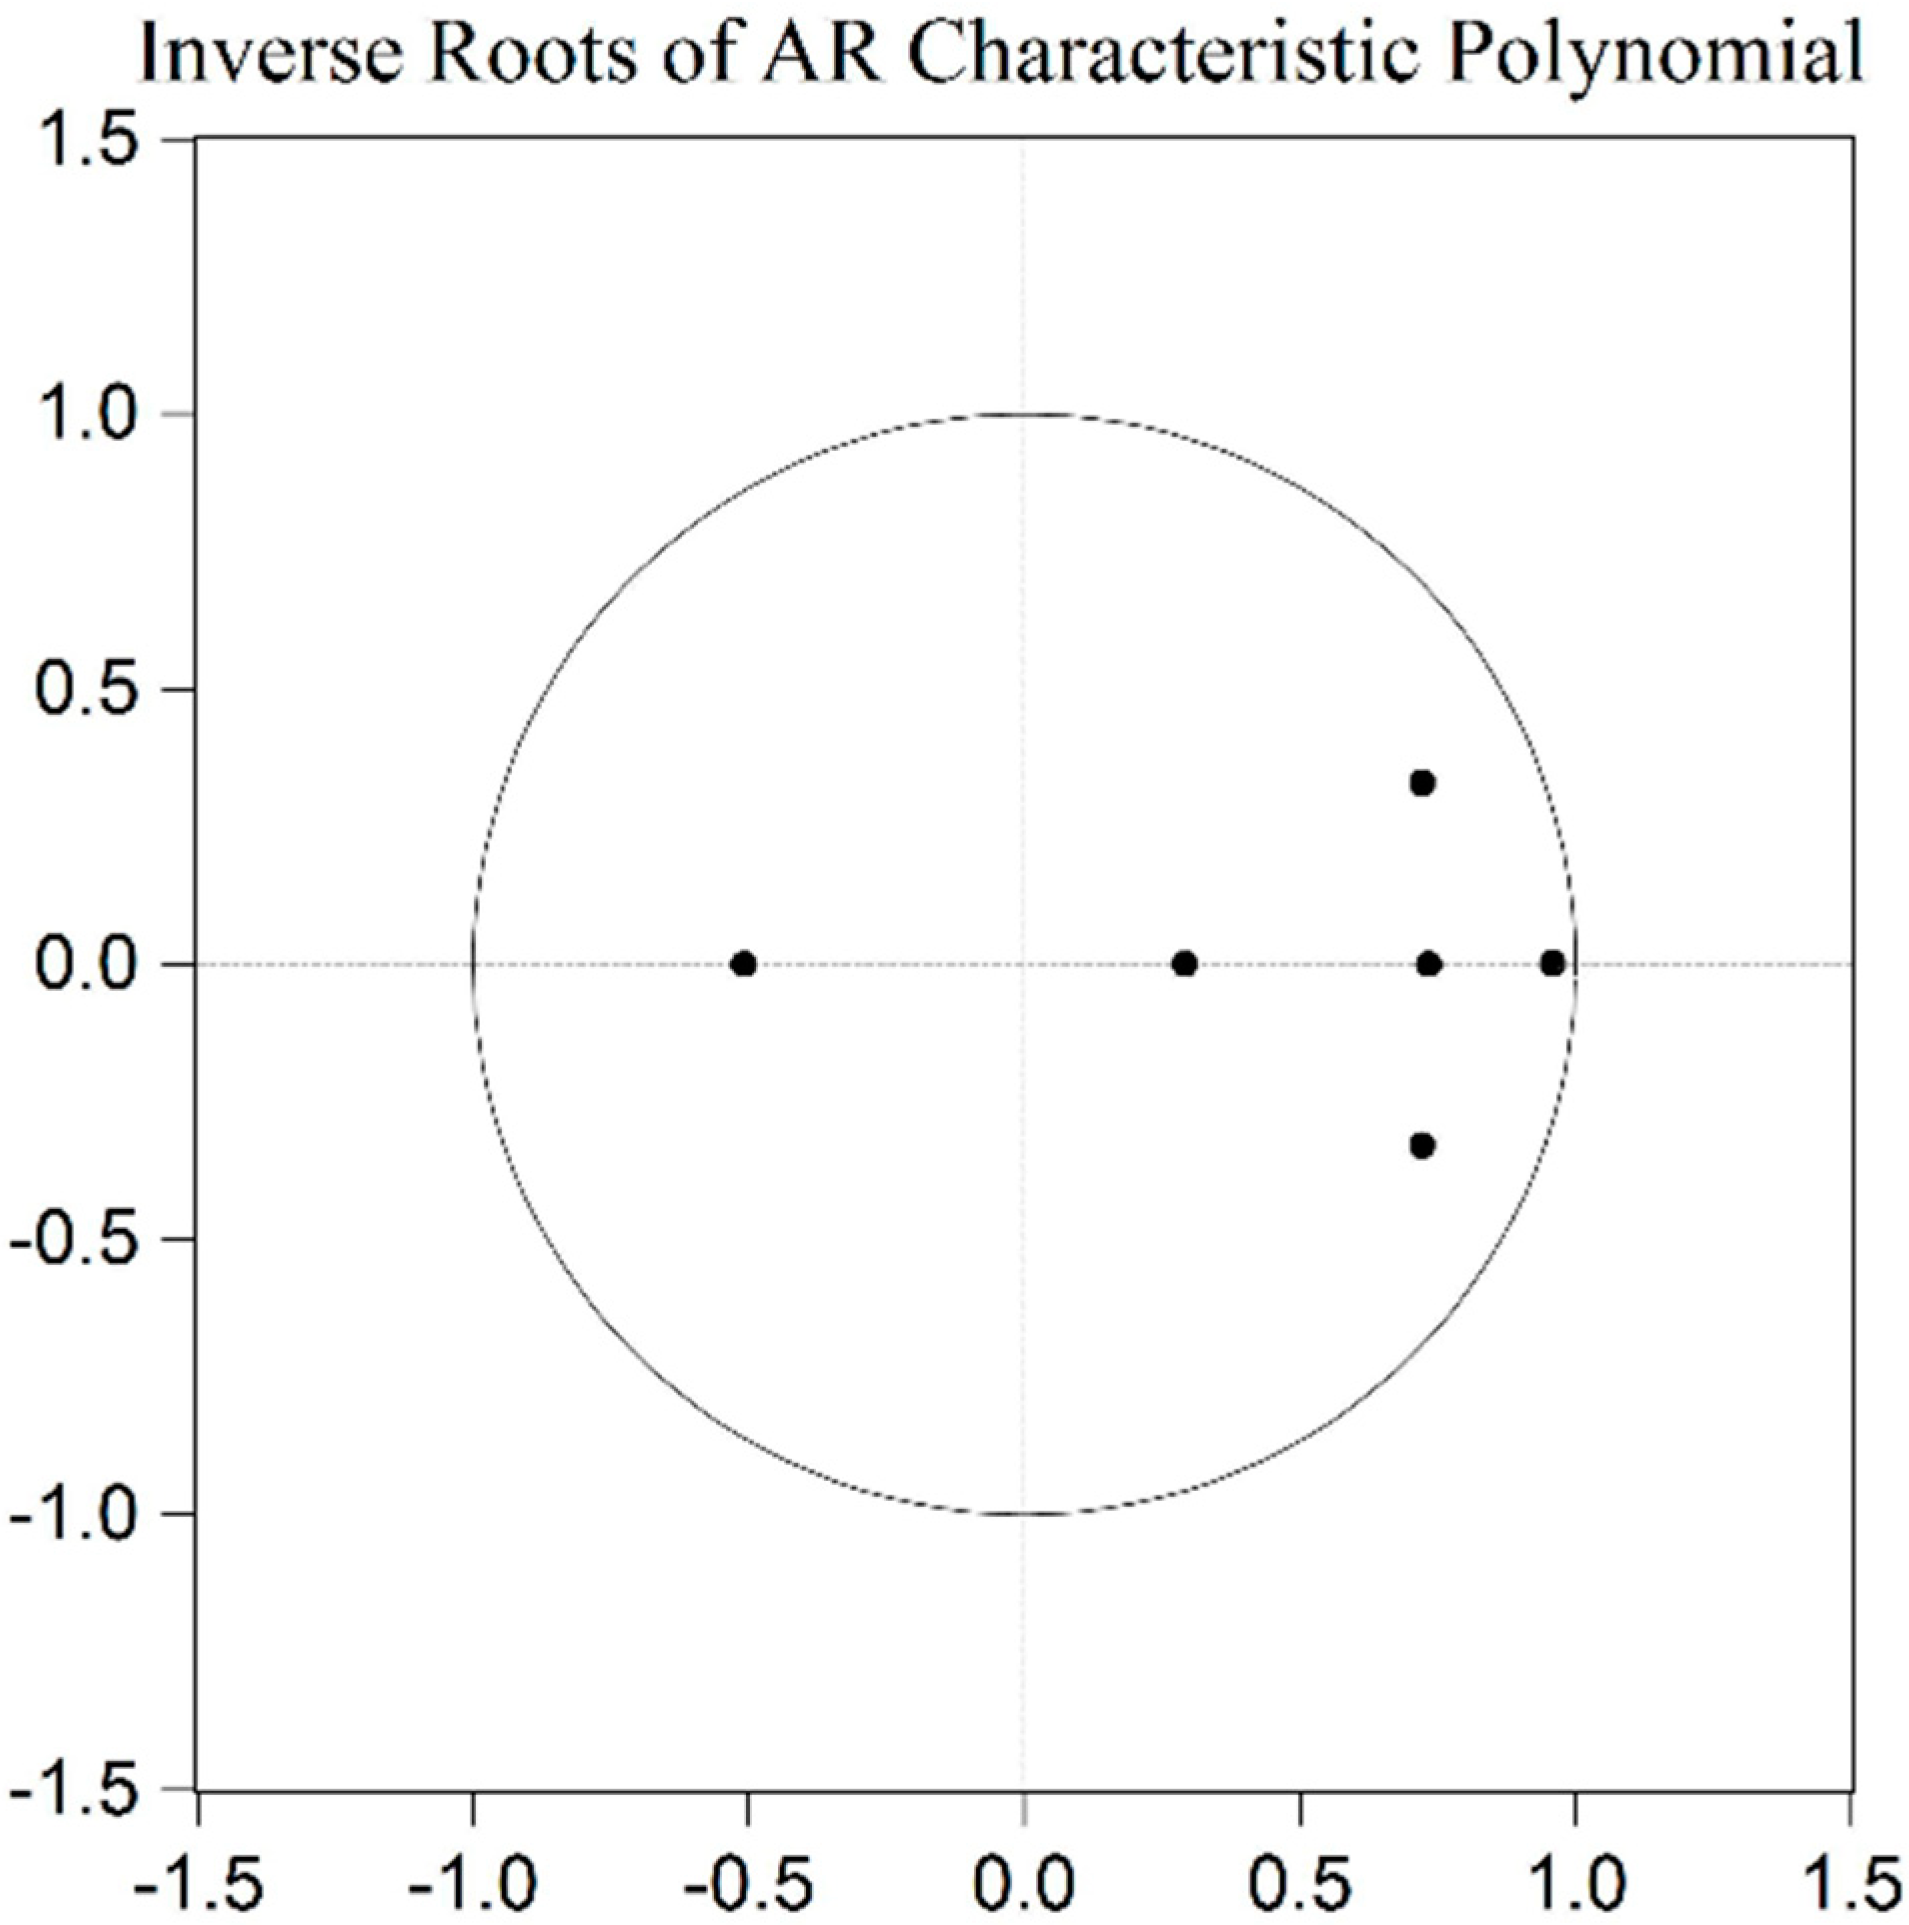
3.3. Vector Error Correction Analysis
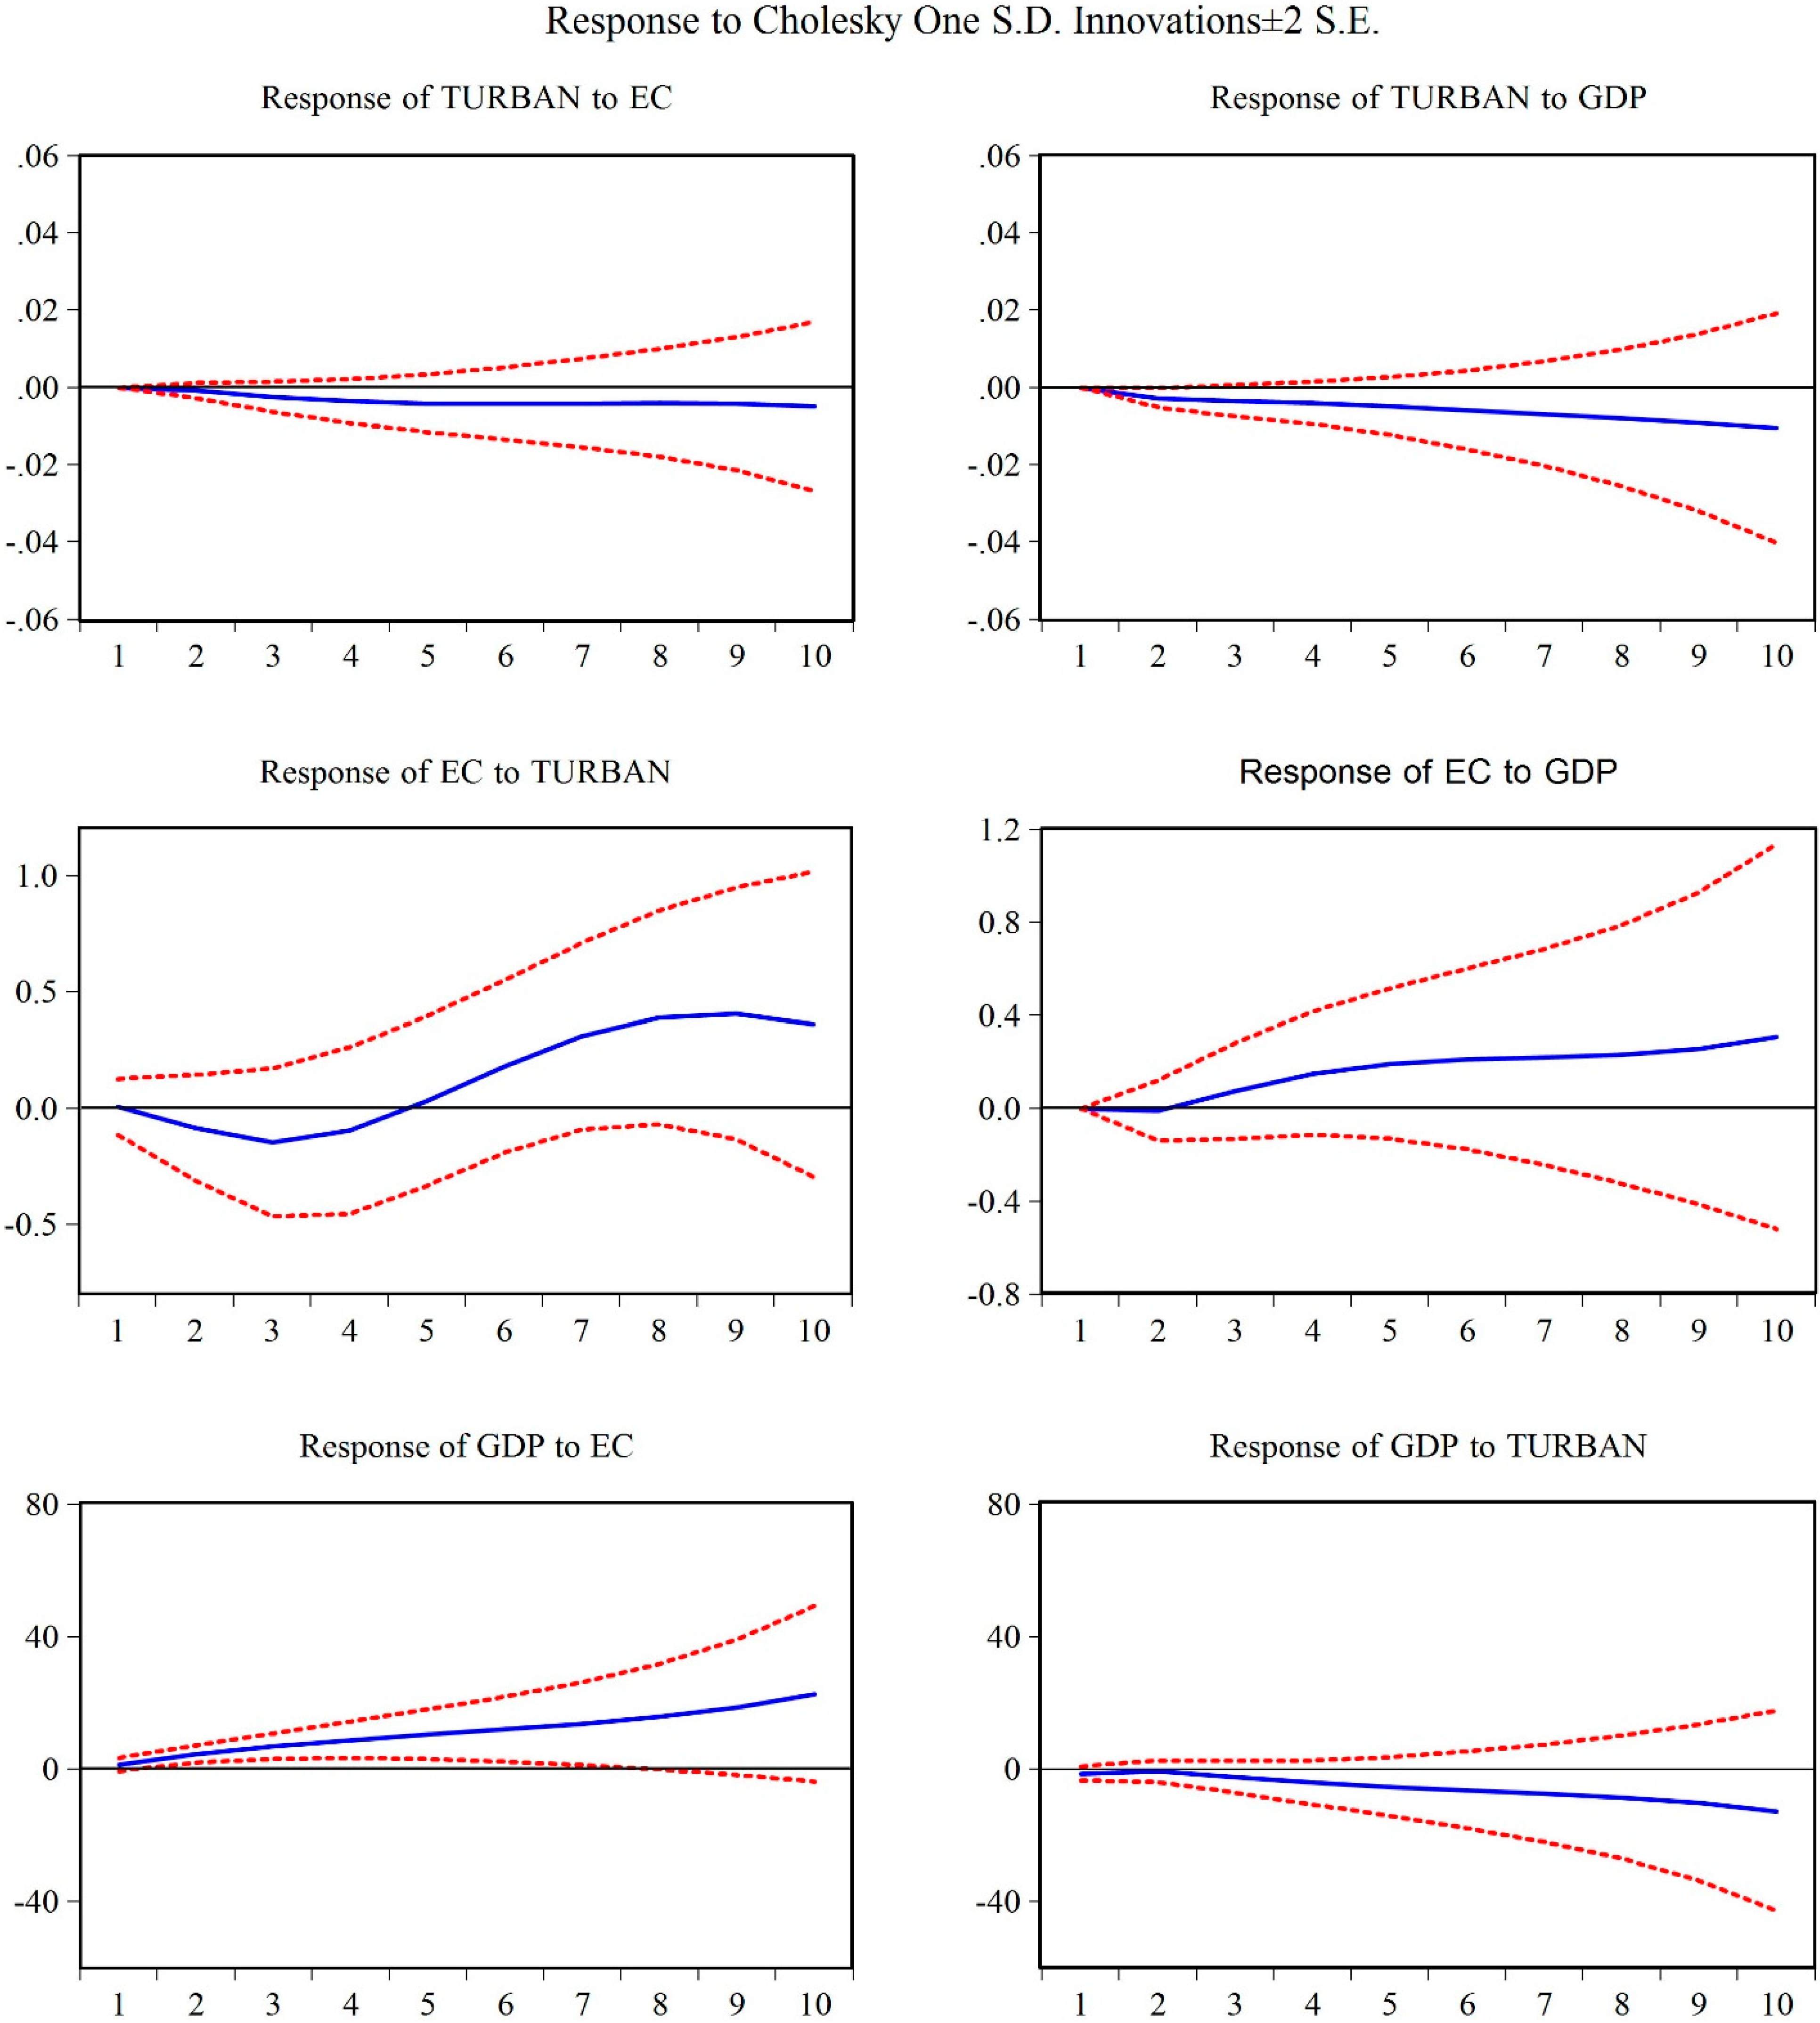
3.4. Impulse Response Analysis
3.5. Granger Causality Test
| Null Hypothesis | Lag Lengths | ||||
|---|---|---|---|---|---|
| 2 | 3 | 4 | 5 | ||
| TURBAN does not cause EC | F-statistic | 9.08466 | 4.92880 | 3.83256 | 1.64663 |
| Probability | 0.0011 | 0.0091 | 0.0190 | 0.02046 | |
| EC does not cause TURBAN | F-statistic | 0.90827 | 0.48311 | 0.69286 | 2.58952 |
| Probability | 0.4161 | 0.6974 | 0.6060 | 0.1671 | |
| GDP does not cause TURBAN | F-statistic | 3.68992 | 3.42977 | 2.42638 | 2.21213 |
| Probability | 0.0394 | 0.0347 | 0.0836 | 0.01038 | |
| TURBAN does not cause GDP | F-statistic | 0.02704 | 4.77540 | 4.16935 | 0.89111 |
| Probability | 0.9734 | 0.1104 | 0.1137 | 0.5099 | |
| EC does not cause GDP | F-statistic | 3.26069 | 2.61413 | 10.4085 | 3.53027 |
| Probability | 0.0552 | 0.0767 | 0.0001 | 0.0243 | |
| GDP does not cause EC | F-statistic | 4.23487 | 1.28459 | 1.75253 | 1.58002 |
| Probability | 0.0261 | 0.03044 | 0.01802 | 0.02219 | |
4. Conclusions and Policy Implications
Acknowledgments
Author Contributions
Conflicts of Interest
References
- Lu, S.S.; Guan, X.L.; He, C.; Zhang, J.L. Spatio-temporal patterns and policy implications of urban land expansion in metropolitan areas: A case study of Wuhan urban agglomeration, central China. Sustainability 2014, 6, 4723–4748. [Google Scholar] [CrossRef]
- Wang, S.J.; Fang, C.L.; Guan, X.L.; Pang, B.; Ma, H.T. Urbanization, energy consumption, and CO2 emissions in China: A panel data analysis of China’s province. Appl. Energy 2014, 136, 738–749. [Google Scholar] [CrossRef]
- National Bureau of Statistics of China. CSB (China Statistical Yearbook); Chinese Statistics Press: Beijing, China, 2013; pp. 389–392. (In Chinese) [Google Scholar]
- Liu, S.W.; Zhang, P.Y.; Jiang, X.L. Measuring sustainable urbanization in China: A case study of the coastal Liaoning area. Sustain. Sci. 2013, 8, 585–594. [Google Scholar] [CrossRef]
- Liu, Y.B. Exploring the Relationship between Urbanization and Energy Consumption in China Using ARDL (Autoregressive Distributed Lag) and FDM (Factor Decomposition Model). Energy 2009, 34, 1846–1854. [Google Scholar] [CrossRef]
- Al-mulali, U. Factors affecting CO2 emission in the Middle East: A panel data analysis. Energy 2012, 44, 564–569. [Google Scholar] [CrossRef]
- Wang, Q. Effects of urbanization on energy consumption in China. Energy Policy 2014, 65, 332–339. [Google Scholar] [CrossRef]
- Schuetze, T.; Lee, J.-W.; Lee, T.-G. Sustainable urban (re-)development with building integrated energy, water and waste systems. Sustainability 2013, 5, 1114–1127. [Google Scholar] [CrossRef]
- Ikkatai, S.; Ishikawa, D.; Ohori, S.; Sasaki, K. Motivation of Japanese companies to take environmental action to reduce their greenhouse gas emissions: An econometric analysis. Sustain. Sci. 2008, 3, 145–154. [Google Scholar] [CrossRef]
- Wang, S.J.; Fang, C.L.; Ma, H.T.; Wang, Y.; Qin, J. Spatial differences and multi-mechanism of carbon footprint based on GWR model in provincial China. J. Geogr. Sci. 2014, 24, 804–822. [Google Scholar]
- Wang, S.J.; Fang, C.L.; Wang, Y.; Huang, Y.B.; Ma, H.T. Quantifying the relationship between urban development intensity and carbon dioxide emissions using a panel data analysis. Ecol. Indic. 2014, 49, 121–131. [Google Scholar] [CrossRef]
- Liu, Y.; Xiao, H.W.; Precious, Z.; Lv, Y.K. Carbon emissions in China: A spatial econometric analysis at the regional level. Sustainability 2014, 6, 6005–6023. [Google Scholar] [CrossRef]
- Liu, Z.; Guan, D.B.; Crawford-Brown, D.; Zhang, Q.; Liu, J.G. A low-carbon road map for China. Nature 2013, 500, 143–145. [Google Scholar] [CrossRef] [PubMed]
- Wang, Z.H.; Yin, F.C.; Zhang, Y.X.; Zhang, X. An empirical research on the influencing factors of regional CO2 emissions: Evidence from Beijing city, China. Appl. Energy 2012, 100, 277–284. [Google Scholar] [CrossRef]
- Jones, D.W. Urbanization and energy use in economic development. Energy J. 1989, 10, 29–44. [Google Scholar] [CrossRef]
- Jones, D.W. How urbanization affects energy use in developing countries. Energy Policy 1991, 19, 621–630. [Google Scholar] [CrossRef]
- Dahl, C.; Erdogan, M. Oil demand in the developing world: Lessons from the 1980s applied to the 1990s. Energy J. 1994, 15, 69–78. [Google Scholar] [CrossRef]
- Parikh, V.; Shukla, J. Urbanization, energy use and greenhouse effects in economic development: Results from across-national study of developing countries. Glob. Environ. Chang. 1995, 5, 87–103. [Google Scholar] [CrossRef]
- Parshall, L.; Gurney, K.; Hammer, S.A.; Mendoza, D.; Zhou, Y.Y.; Geethakumar, S. Modeling energy consumption and CO2 emissions at the urban scale: Methodological challenges and insights from the United States. Energy Policy 2010, 38, 4765–4782. [Google Scholar] [CrossRef]
- Salim, R.A.; Shafiei, S. Urbanization and renewable and non-renewable energy consumption in OECD countries: An empirical analysis. Econ. Model. 2014, 38, 581–591. [Google Scholar] [CrossRef]
- Lenzen, M.; Wier, M.; Cohen, C.; Hayami, H.; Pachauri, S.; Schaeffer, R. A comparative multivariate analysis of household energy requirements in Australia, Brazil, Denmark, India and Japan. Energy 2006, 31, 181–207. [Google Scholar] [CrossRef]
- Liddle, B. The energy, economic growth, urbanization nexus across development: Evidence from heterogeneous panel estimates robust to cross-sectional dependence. Energy J. 2013, 34, 223–244. [Google Scholar] [CrossRef]
- Liddle, B.; Messinis, G. Which comes first—Urbanization or economic growth? Evidence from heterogeneous panel causality tests. Appl. Econ. Lett. 2015, 22, 349–355. [Google Scholar] [CrossRef]
- Ghosh, S.; Kanjilal, K. Long-term equilibrium relationship between urbanization, energy consumption and economic activity: Empirical evidence from India. Energy 2014, 66, 324–331. [Google Scholar] [CrossRef]
- Liddle, B.; Lung, S. Might electricity consumption cause urbanization instead? Evidence from heterogeneous panel long-run causality tests. Glob. Environ. Chang. 2014, 24, 42–51. [Google Scholar] [CrossRef] [Green Version]
- Kasman, A.; Duman, Y.S. CO2 emissions, economic growth, energy consumption, trade and urbanization in new EU member and candidate countries: A panel data analysis. Econ. Model. 2015, 44, 97–103. [Google Scholar] [CrossRef]
- Poumanyvong, P.; Kaneko, S. Does urbanization lead to less energy use and lower CO2 emissions? A cross-country analysis. Ecol. Econ. 2010, 70, 434–444. [Google Scholar] [CrossRef]
- Shahbaz, M.; Lean, H.H. Does financial development increase energy consumption? The role of industrialization and urbanization in Tunisia. Energy Policy 2012, 40, 473–479. [Google Scholar] [CrossRef] [Green Version]
- Al-mulali, U.; Fereidouni, H.G.; Lee, J.Y.M.; Sab, C.N.B.C. Exploring the relationship between urbanization, energy consumption, and CO2 emission in MENA countries. Renew. Sustain. Energy Rev. 2013, 23, 107–112. [Google Scholar] [CrossRef]
- Shahbaz, M.; Sbia, R.; Hamdi, H.; Ozturk, I. Economic growth, electricity consumption, urbanization and environmental degradation relationship in United Arab Emirates. Ecol. Indic. 2014, 45, 622–631. [Google Scholar] [CrossRef]
- Liu, Y.B. An Analysis of dynamic econometric relationship between development of urbanization and growth of energy consumption in China. J. Financ. Econ. 2007, 33, 72–81. (In Chinese) [Google Scholar]
- Zeng, S.; Zheng, X.G.; Rao, C.X. Analysis of the correlative relationships between energy consumption structure and economic growth in China. Soft Sci. 2009, 23, 65–68. (In Chinese) [Google Scholar]
- Du, J.L.; Li, Z.S.; Zhang, Z.Z.; Zhang, Y.L. Analysis on correlation of the increase of GDP and energy consumption in China based on empirical mode decomposition method. Prog. Geogr. 2009, 28, 119–124. (In Chinese) [Google Scholar]
- Xue, B.; Geng, Y.; Müller, K.; Lu, C.P.; Ren, W.X. Understanding the causality between carbon dioxide emission, fossil energy consumption and economic growth in developed countries: An empirical study. Sustainability 2014, 6, 1037–1045. [Google Scholar] [CrossRef]
- Wu, H.; Gu, S.Z.; Guan, X.L.; Lu, S.S. Analysis on relationship between carbon emissions from fossil energy consumption and economic growth in China. J. Nat. Resour. 2013, 28, 381–390. (In Chinese) [Google Scholar]
- Liu, Y.B.; Xie, Y.C. Asymmetric adjustment of the dynamic relationship between energy intensity and urbanization in China. Energy Econ. 2013, 36, 43–54. [Google Scholar] [CrossRef]
- Hsiao, C. Analysis of Panel Data; Cambridge University Press: Cambridge, UK, 2003; pp. 39–41. [Google Scholar]
- Li, Z.N.; Pan, W.Q. Econometrics; High Education Press: Beijing, China, 2010; pp. 76–77. [Google Scholar]
- Feng, T.W.; Sun, L.Y.; Zhang, Y. The relationship between energy consumption structure, economic structure and energy intensity in China. Energy Policy 2009, 37, 5475–5483. [Google Scholar] [CrossRef]
- Dickey, D.; Fuller, W. Distribution of the estimator for autoregressive time series with a unit root. J. Am. Stat. Assoc. 1979, 74, 427–431. [Google Scholar]
- Elliott, G.; Rothenberg, T.; Stock, J. Efficient tests for an autoregressive unit root. Econometrica 1996, 64, 813–836. [Google Scholar] [CrossRef]
- Phillips, P.; Perron, P. Testing for a unit root in time series regression. Biom. J. 1988, 75, 335–346. [Google Scholar]
- Engle, R.F.; Granger, C.W.J. Cointegration and error correction: Representation, estimation, and testing. Econometrica 1987, 55, 251–276. [Google Scholar] [CrossRef]
- Ou, J.P.; Liu, X.P.; Li, X.; Chen, Y.M. Quantifying the relationship between urban forms and carbon emissions using panel data analysis. Landsc. Ecol. 2013, 28, 1889–1907. [Google Scholar] [CrossRef]
- Wang, Q.W.; Zhou, P.; Shen, N.; Wang, S.S. Measuring carbon dioxide emission performance in Chinese provinces: A parametric approach. Renew. Sustain. Energy Rev. 2013, 21, 324–330. [Google Scholar] [CrossRef]
- Chen, M.X.; Huang, Y.B.; Tang, Z.P.; Lu, D.D.; Liu, H.; Ma, L. The provincial pattern of the relationship between urbanization and economic development in China. J. Geogr. Sci. 2014, 24, 33–45. [Google Scholar] [CrossRef]
© 2015 by the authors; licensee MDPI, Basel, Switzerland. This article is an open access article distributed under the terms and conditions of the Creative Commons Attribution license (http://creativecommons.org/licenses/by/4.0/).
Share and Cite
Zhao, Y.; Wang, S. The Relationship between Urbanization, Economic Growth and Energy Consumption in China: An Econometric Perspective Analysis. Sustainability 2015, 7, 5609-5627. https://doi.org/10.3390/su7055609
Zhao Y, Wang S. The Relationship between Urbanization, Economic Growth and Energy Consumption in China: An Econometric Perspective Analysis. Sustainability. 2015; 7(5):5609-5627. https://doi.org/10.3390/su7055609
Chicago/Turabian StyleZhao, Yabo, and Shaojian Wang. 2015. "The Relationship between Urbanization, Economic Growth and Energy Consumption in China: An Econometric Perspective Analysis" Sustainability 7, no. 5: 5609-5627. https://doi.org/10.3390/su7055609