
Cyclic Testing for Structural Detail Improvement of CFT Column-Foundation Connections

Abstract
:1. Introduction
2. Experimental Section
2.1. Design and Details of Specimens

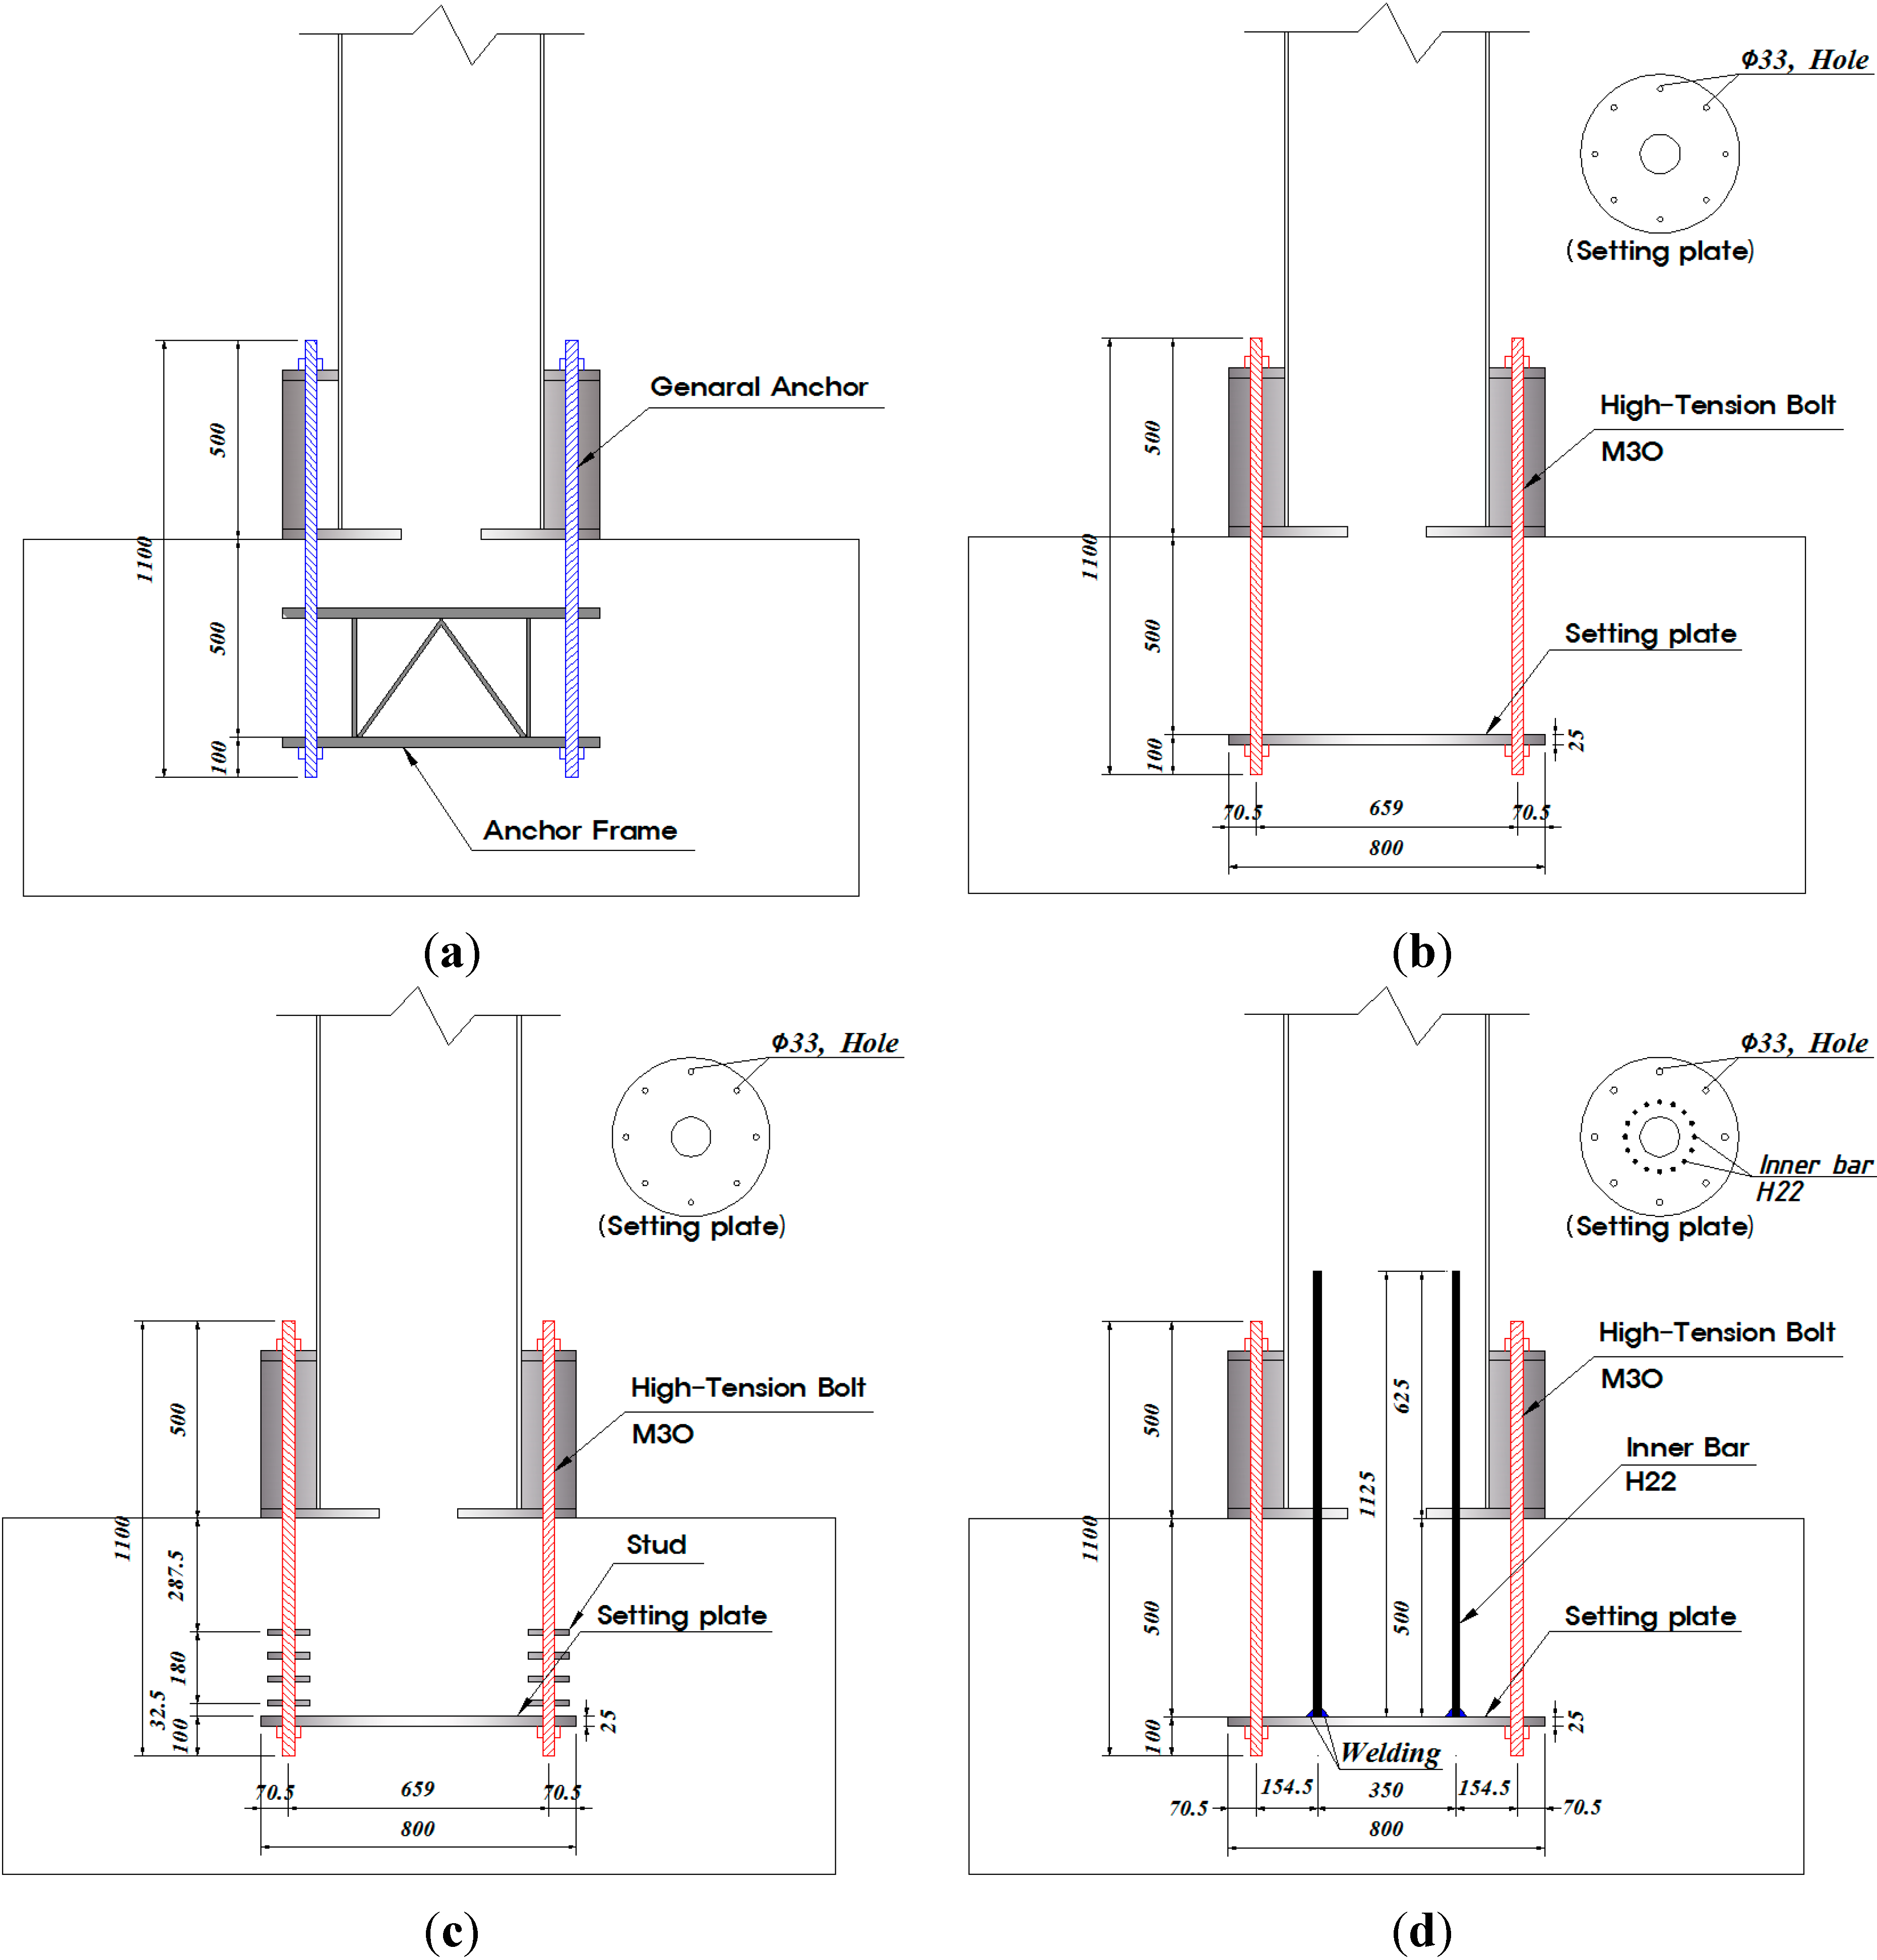
| Specimens | Parameters | Details |
|---|---|---|
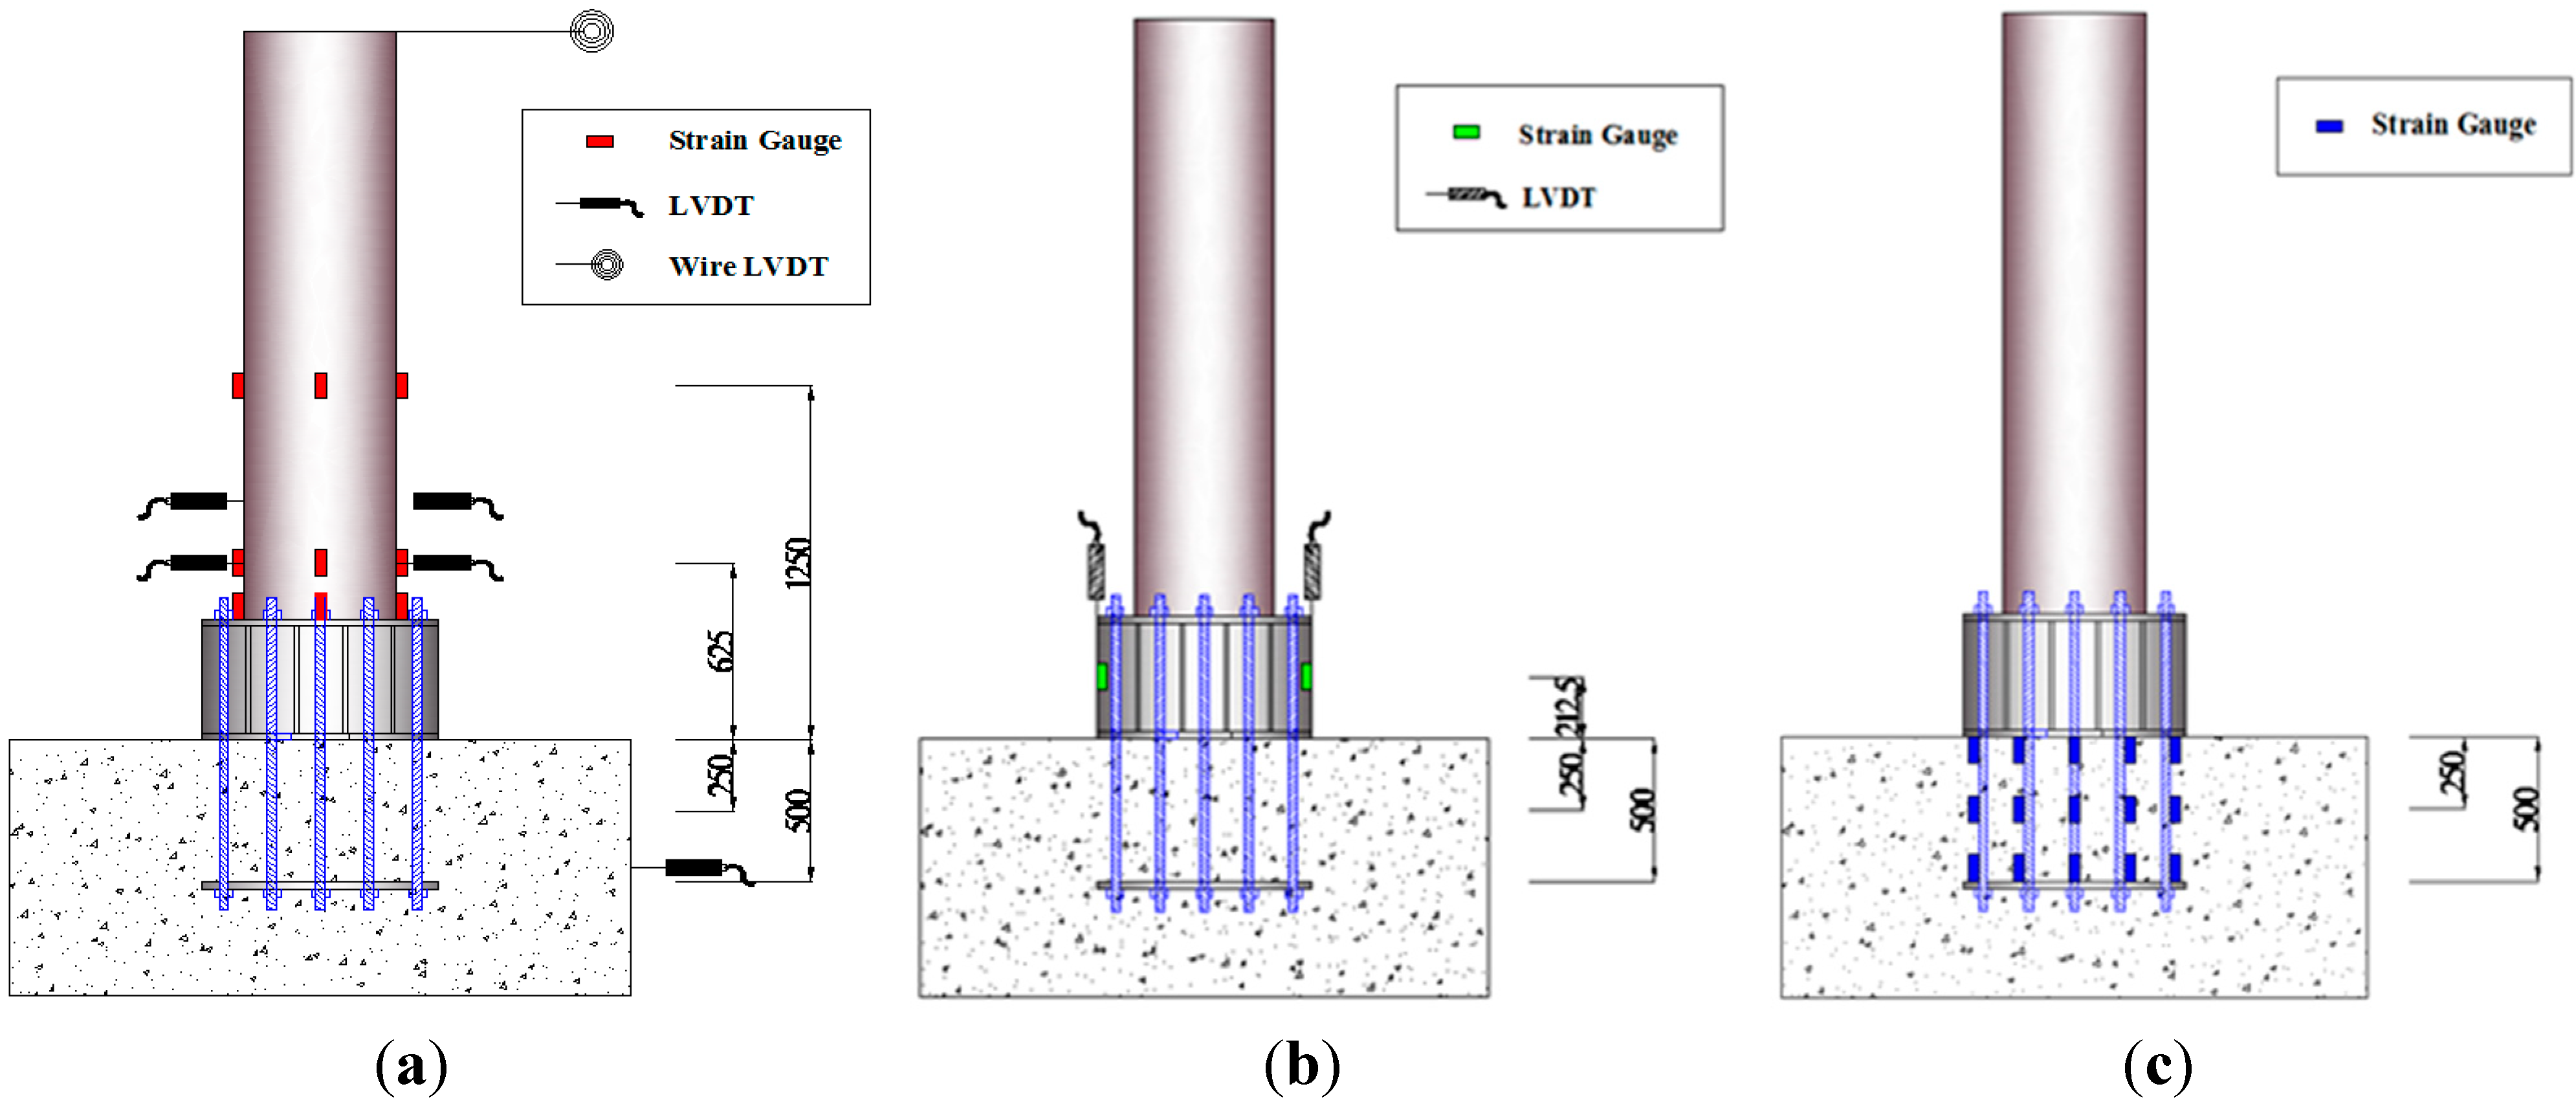
| M-AF | General Anchor, Anchor Frame | Figure 1a |
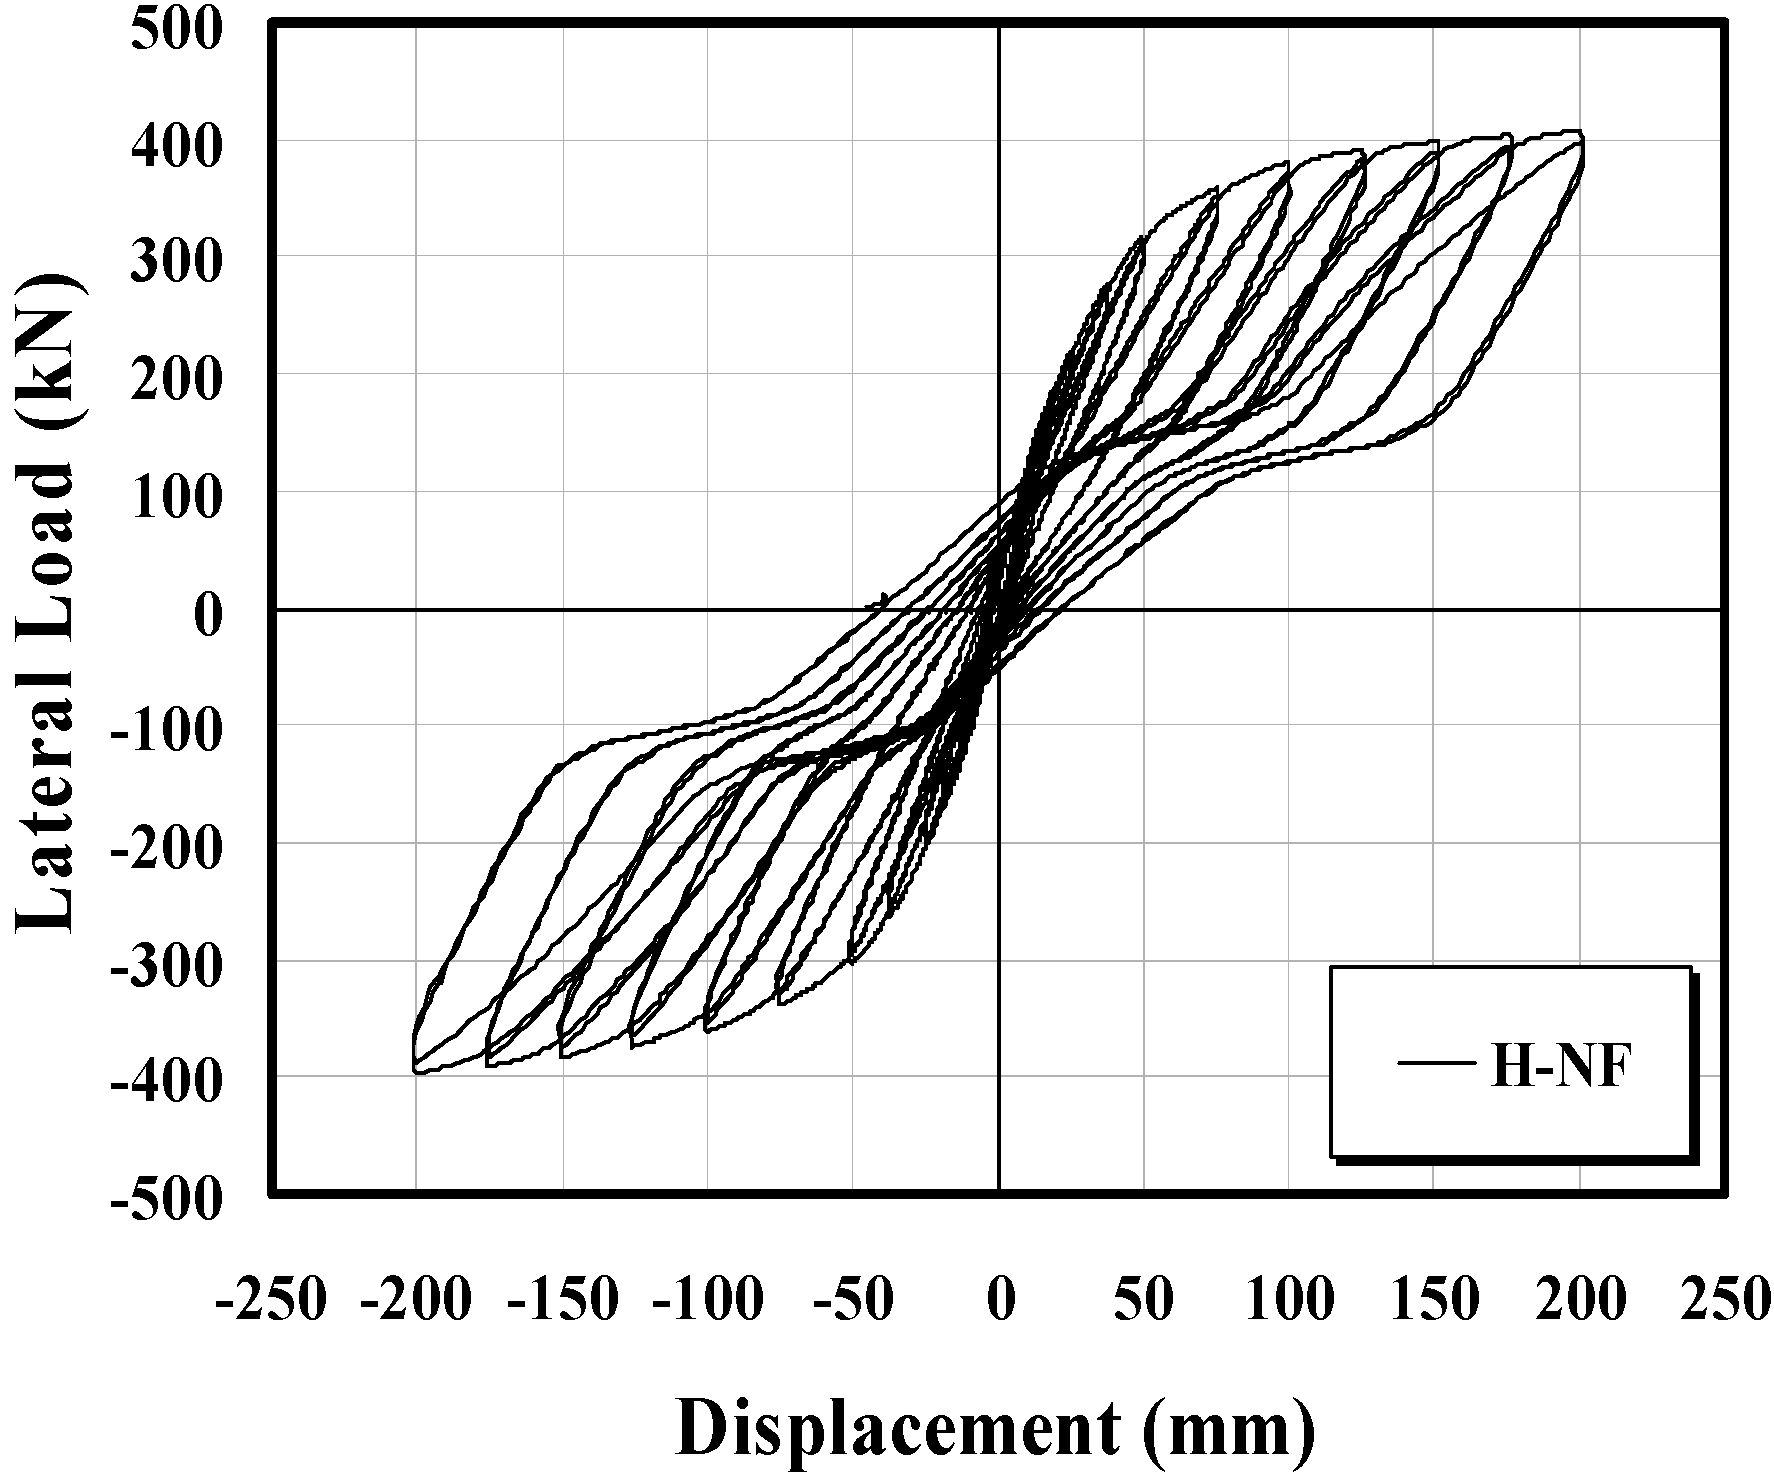
| H-NF | High-Tension Bolt, No Anchor Frame | Figure 1b |
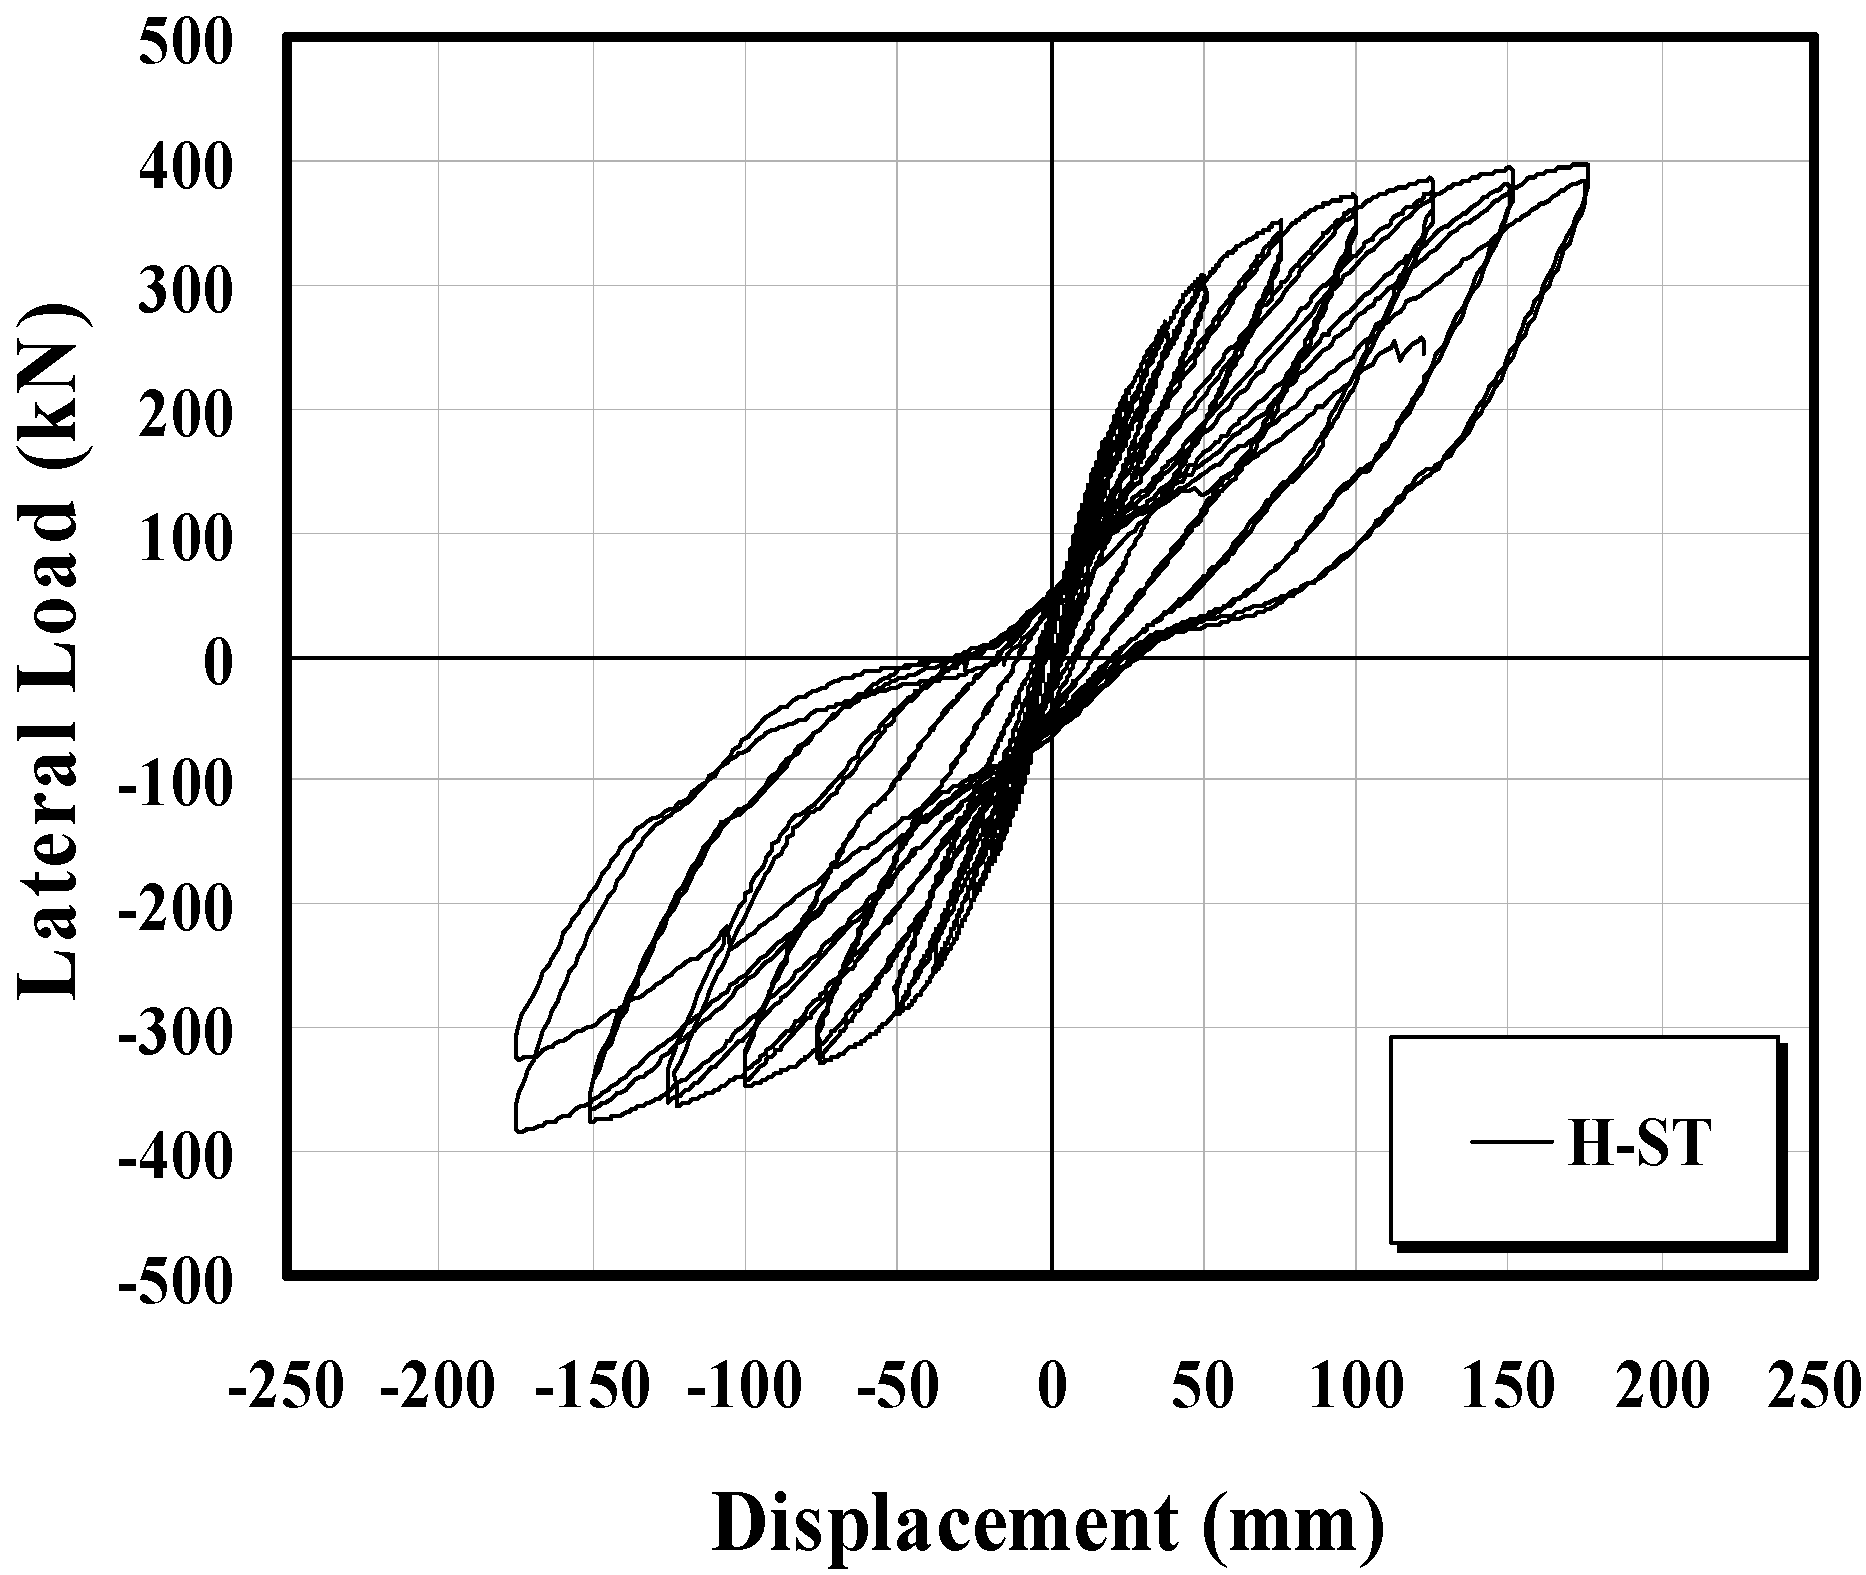
| H-ST | High-Tension Bolt, Stud | Figure 1c |
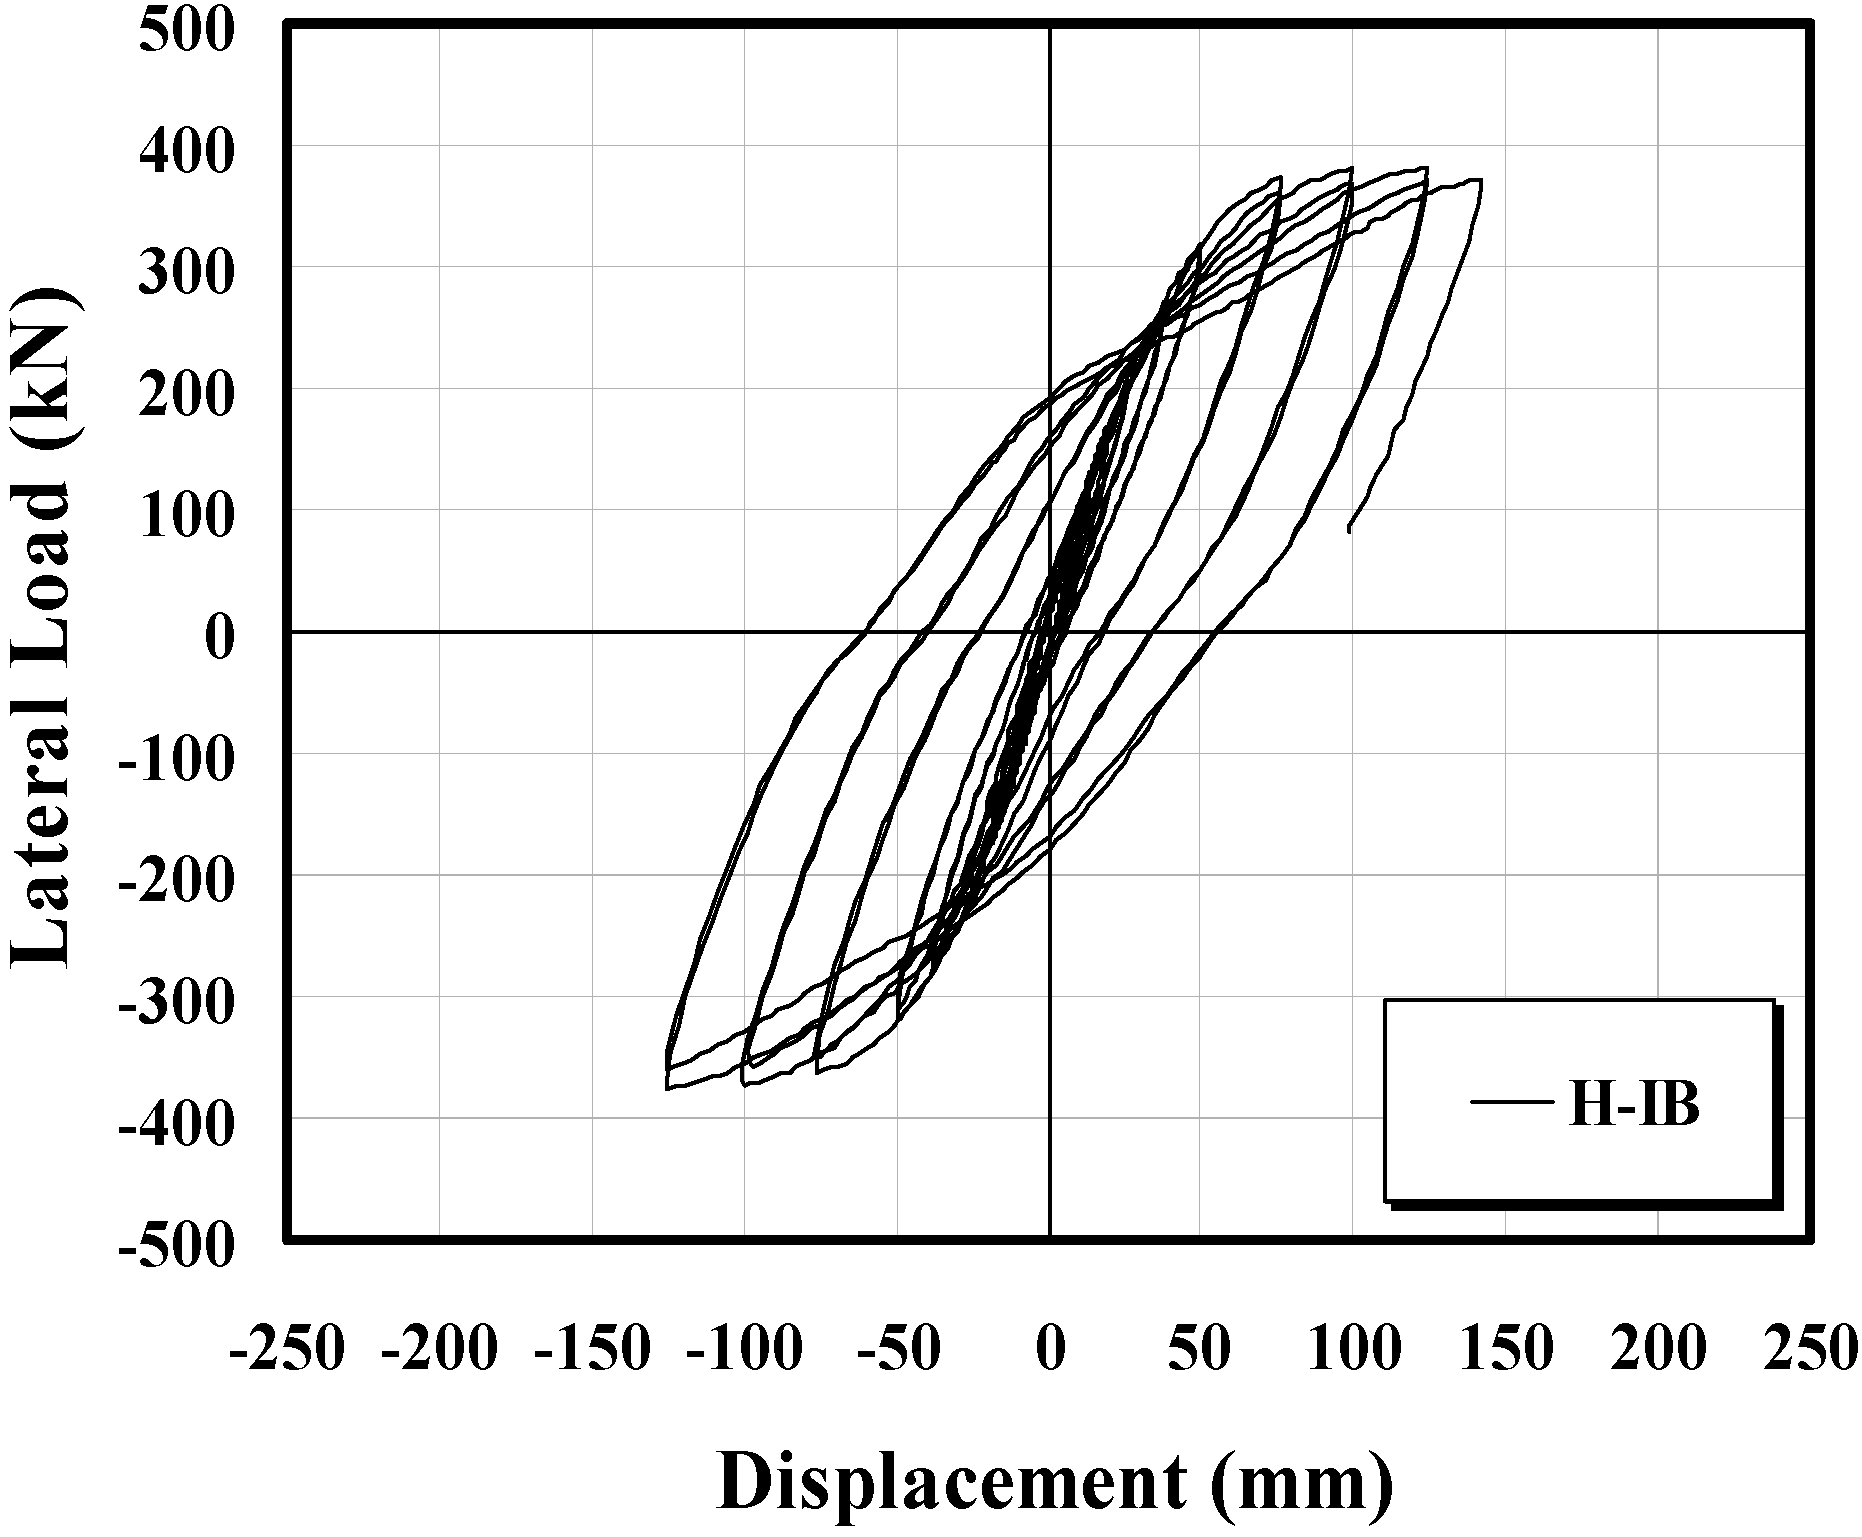
| H-IB | High-Tension Bolt, Inner Deformed Bar | Figure 1d |
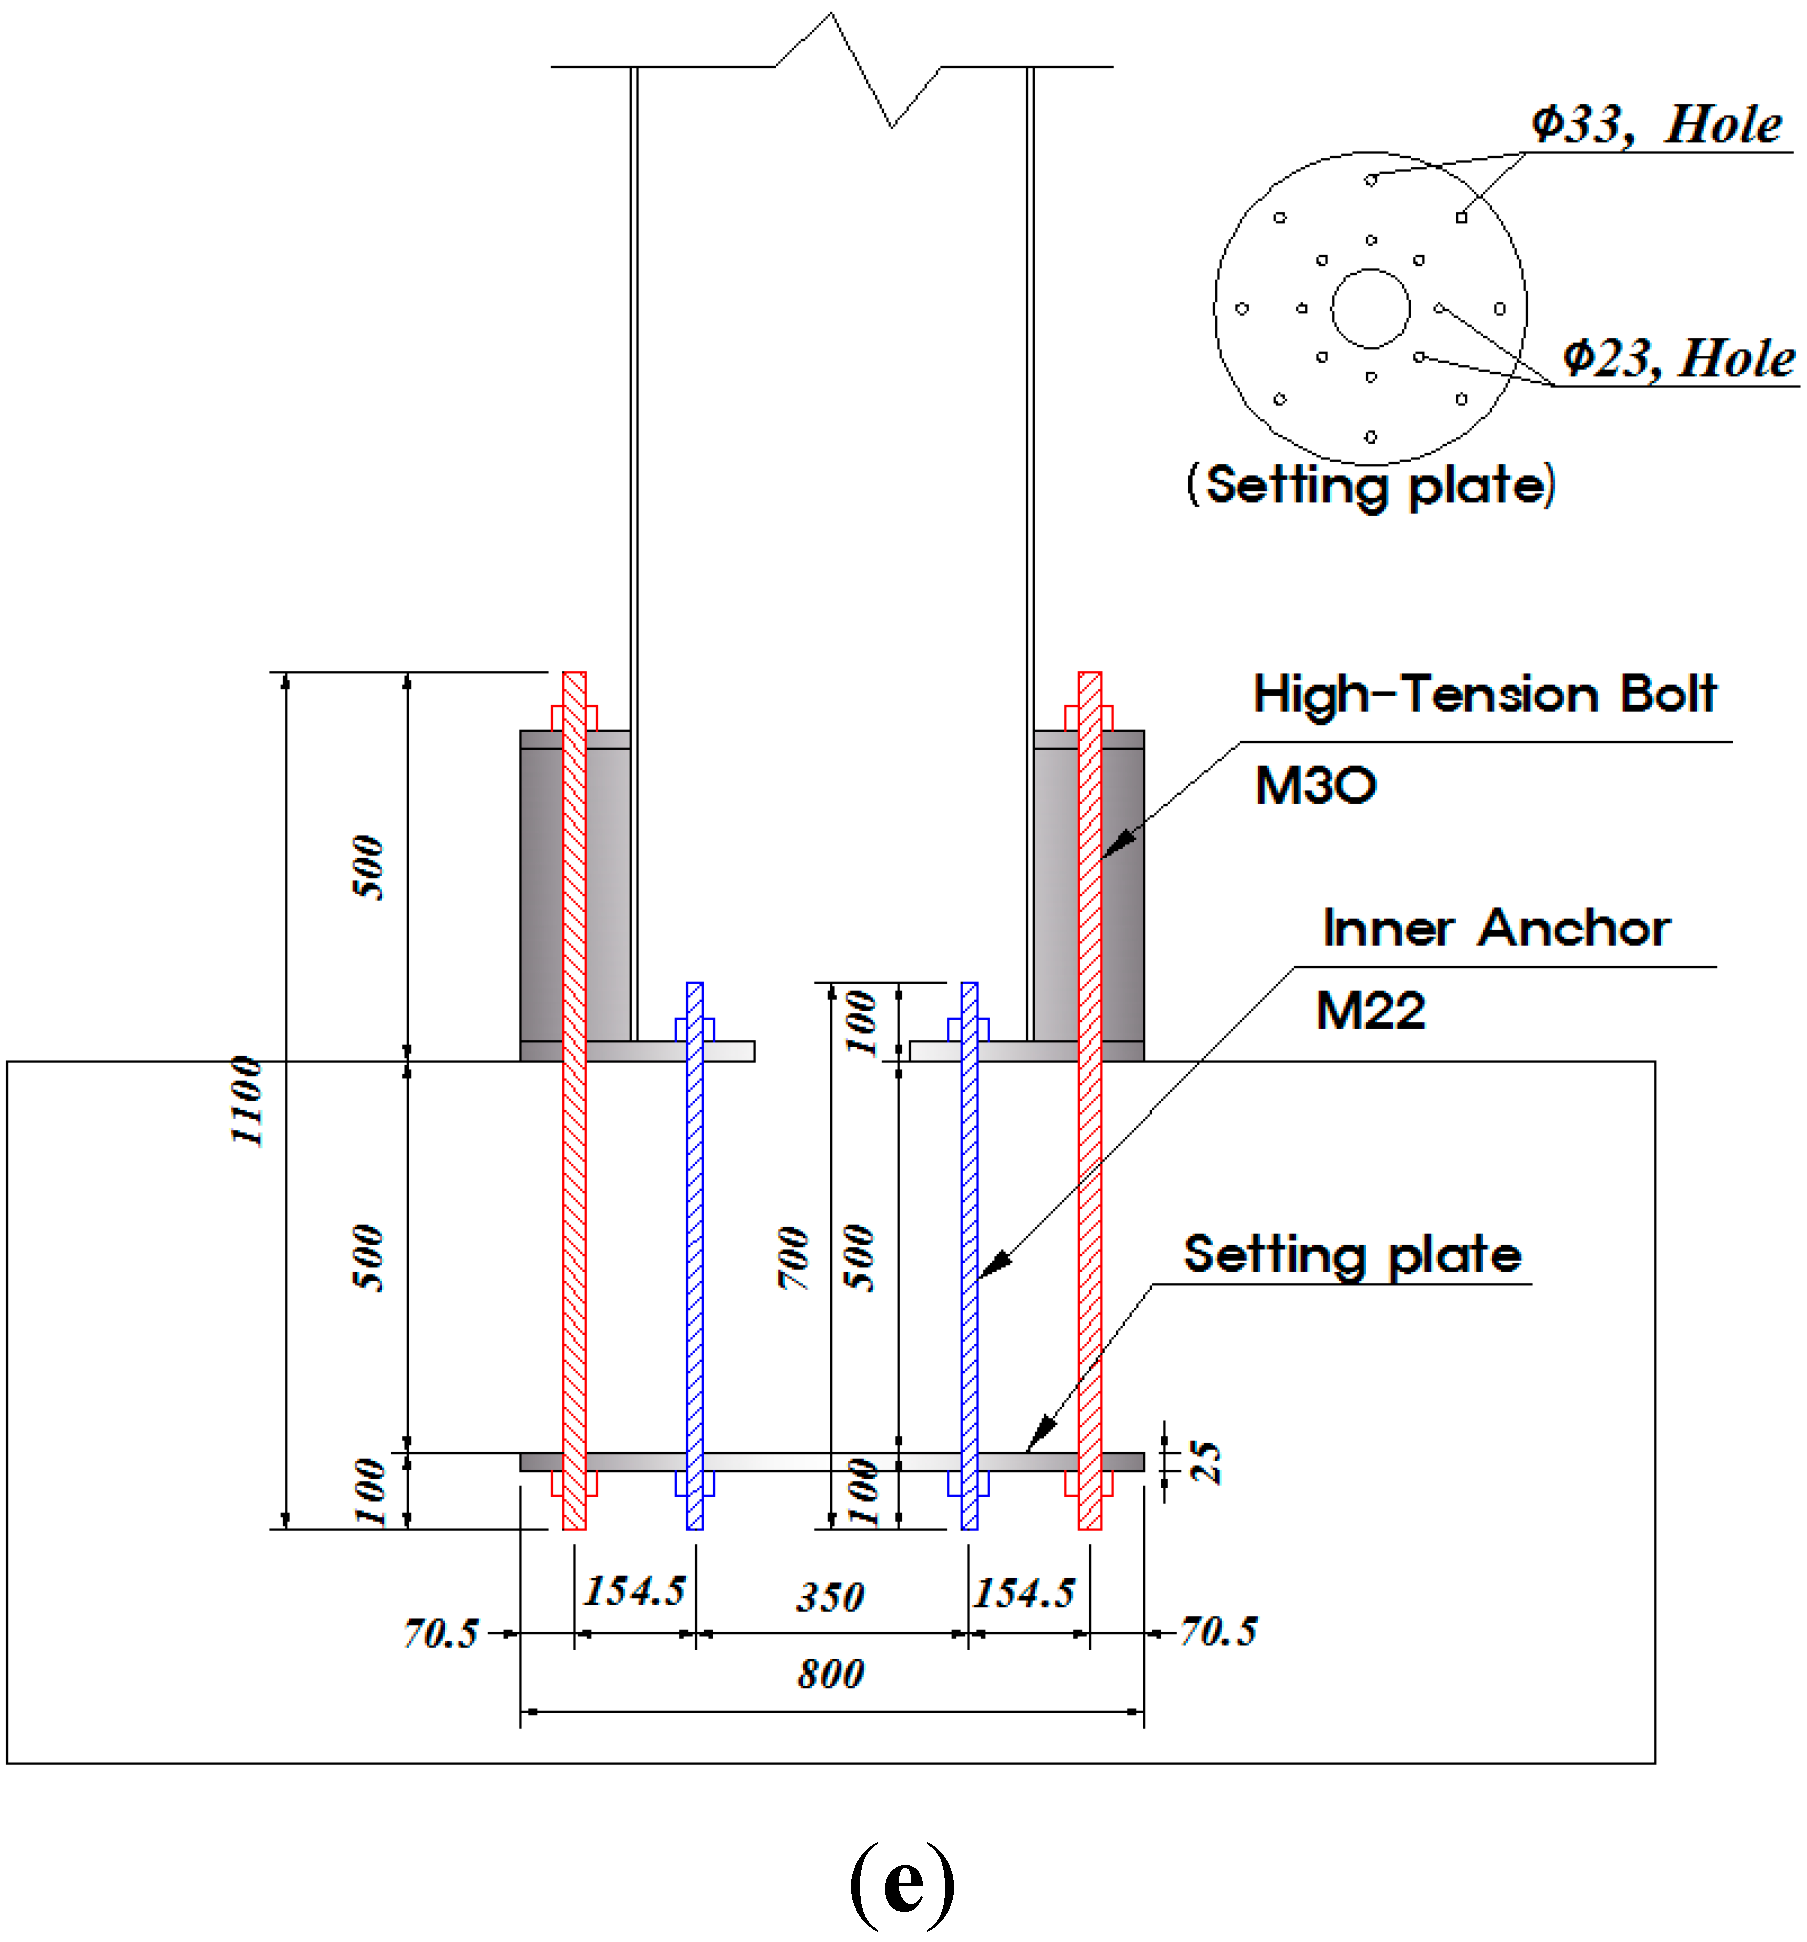
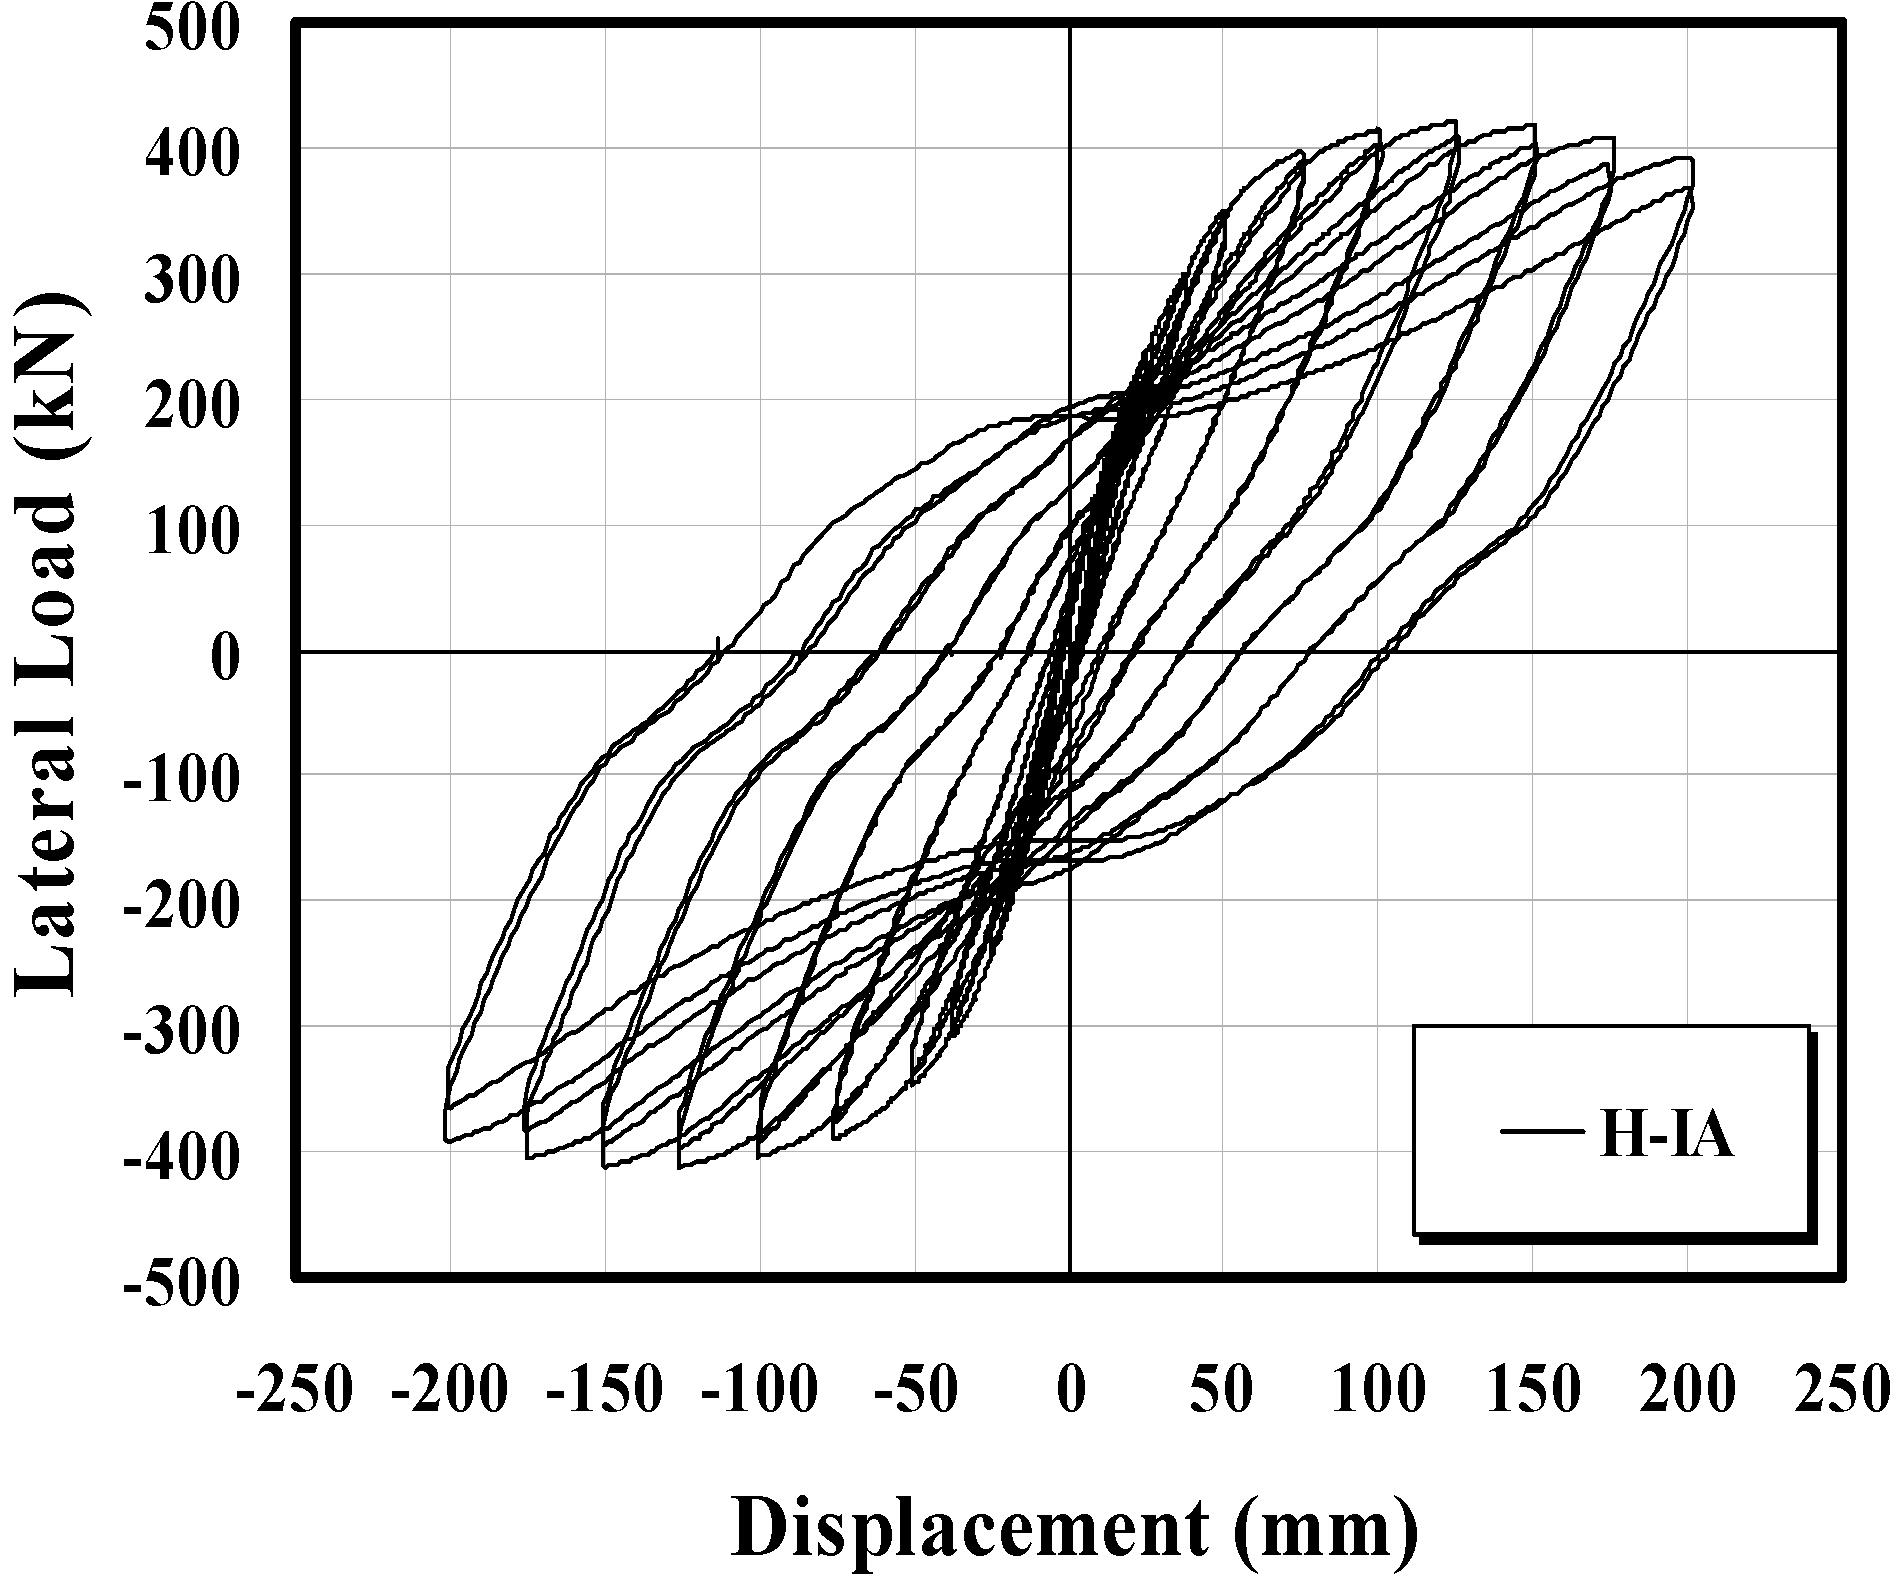
| H-IA | High-Tension Bolt, Inner Anchor | Figure 1e |
| Classification | Details (mm) | ||
|---|---|---|---|
| Column | Height | 2500 | |
| Diameter | Outside | 518 | |
| Inside | 500 | ||
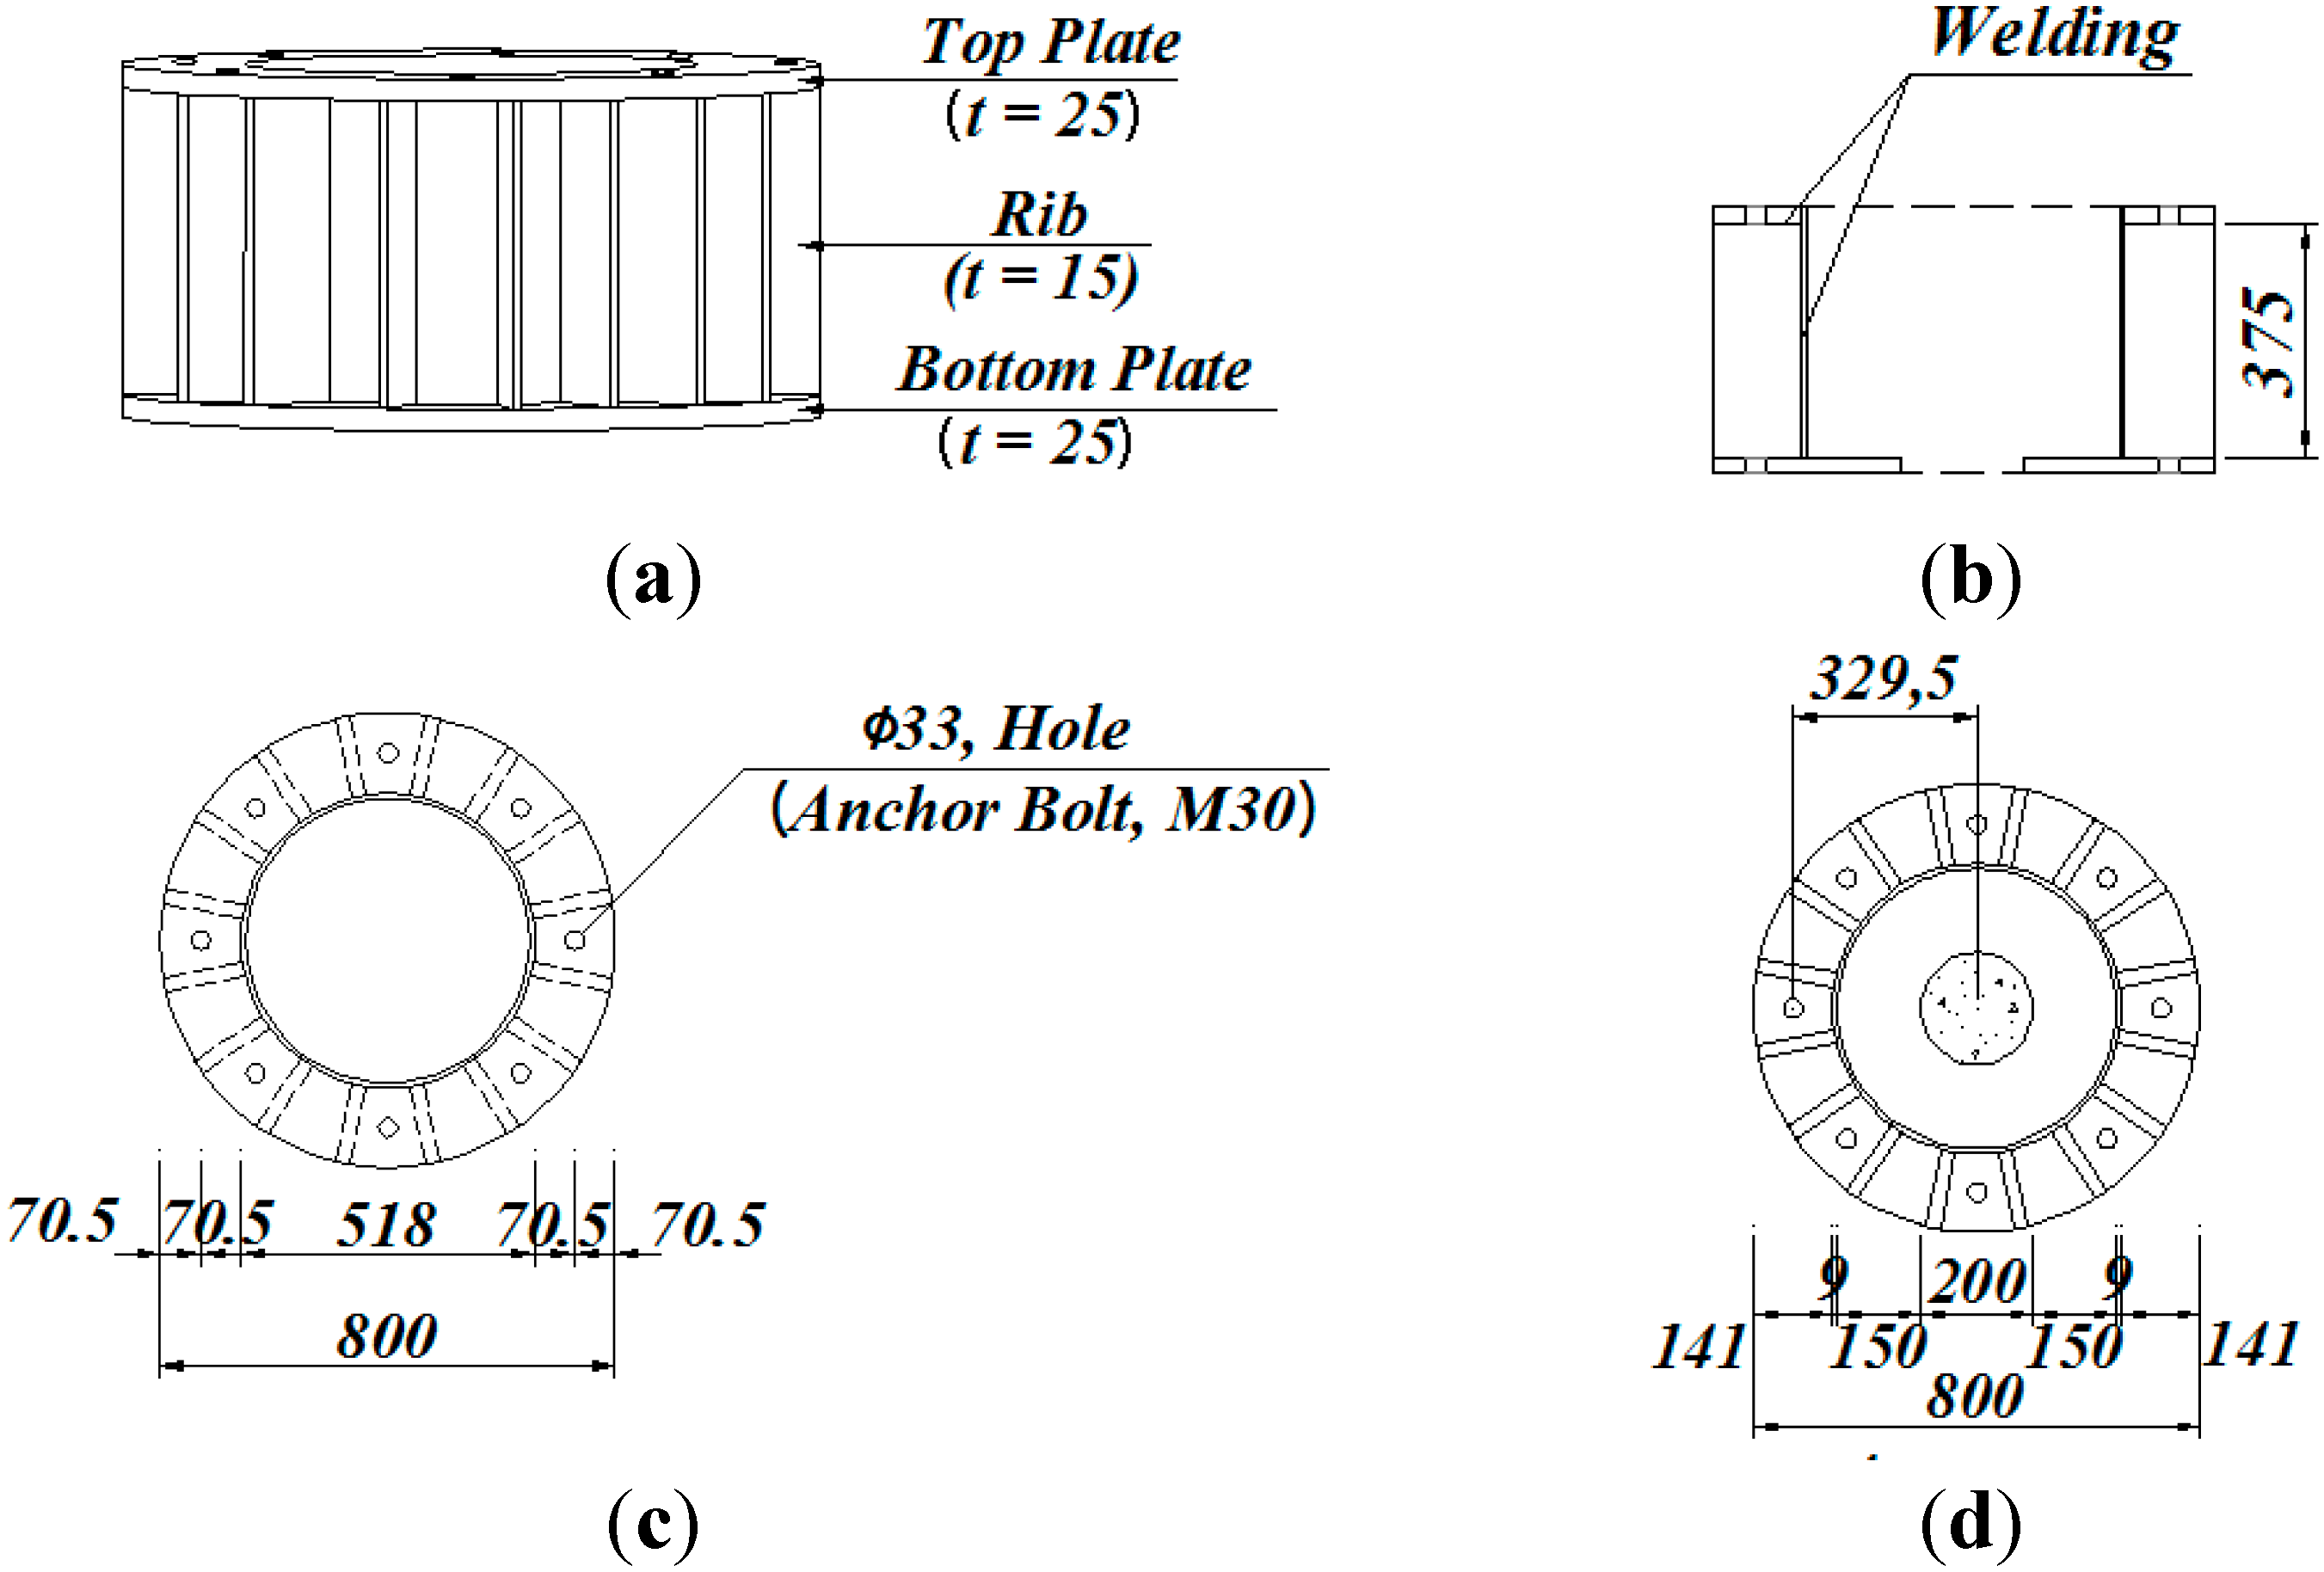
| Baseplate | Distance between Baseplates | 375 | |
| Thickness of Baseplates | 25 | ||
| Thickness of Ribs | 15 | ||
| Foundation | Width | 2210 | |
| Length | 1710 | ||
| Height | 900 | ||
| General and High-tension Anchor Bolt | Diameter | 30 | |
| Length | 1000 | ||
| Inner Deformed Bar | Diameter | 22 | |
| Length | 1125 | ||
| Inner Anchor | Diameter | 22 | |
| Length | 700 | ||
2.2. Material Properties
| Classification | Yield Strength (MPa) | Tensile Strength (MPa) | Elongation (%) |
|---|---|---|---|
| Steel Pipe | 322.28 | 515.97 | 32.52 |
| General Anchor | 542.92 | 584.05 | 17.03 |
| High-Tension Bolt | 561.91 | 732.68 | 16.25 |
| Classification | Average Compressive Strength (MPa) | Average Compressive Strength/Design Compressive Strength (%) |
|---|---|---|
| First | 40.08 | 97.5 |
| Second | 27.36 | 99.0 |
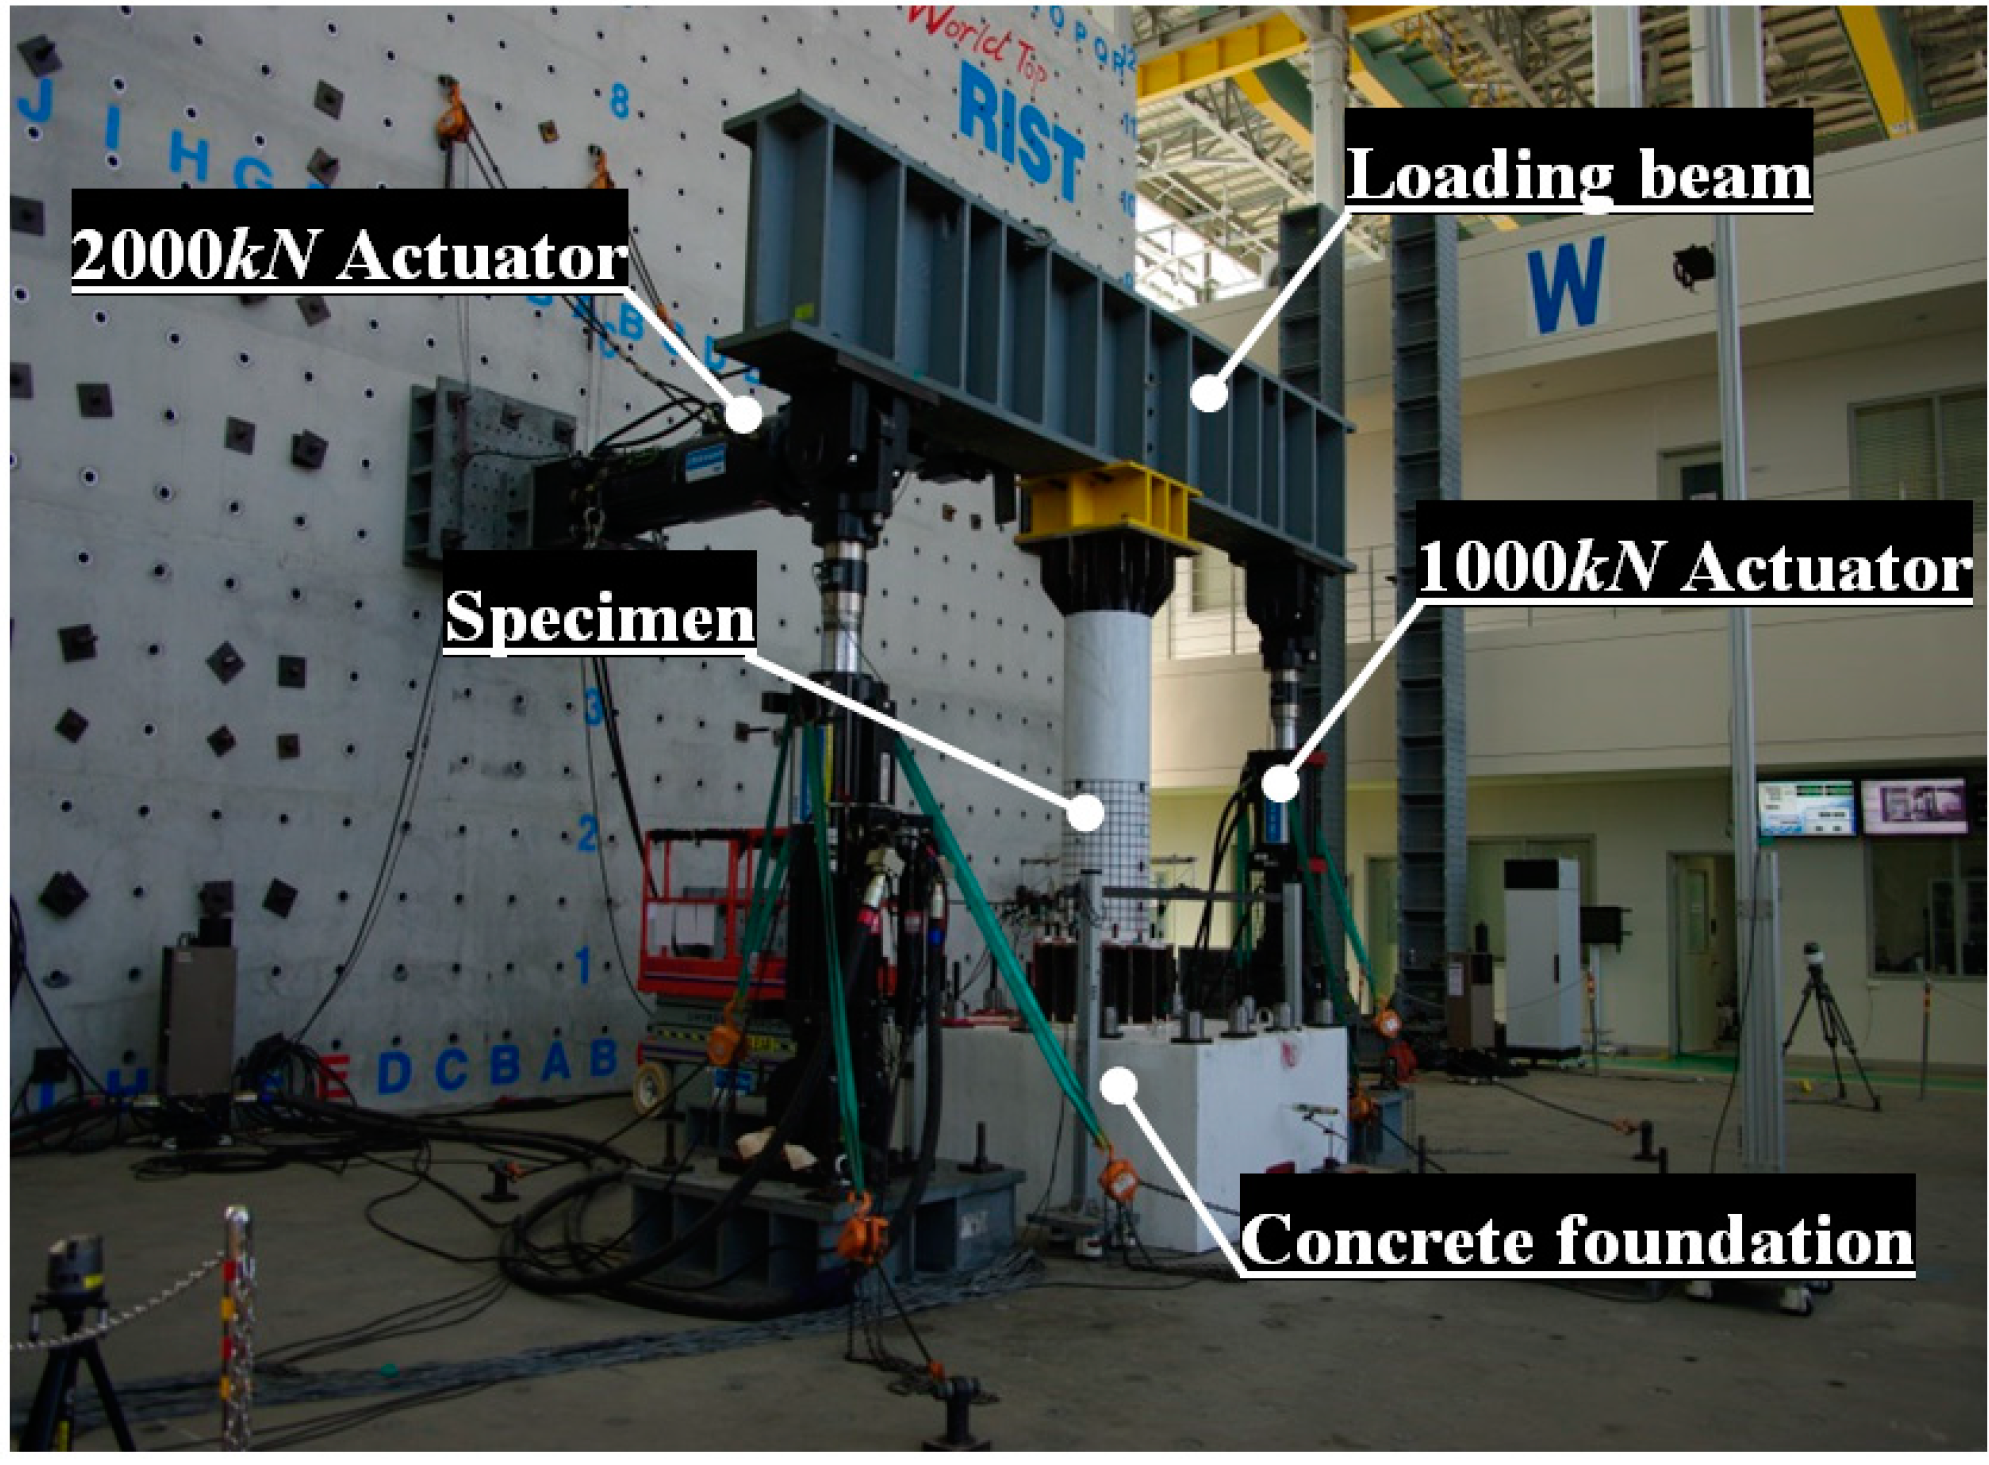
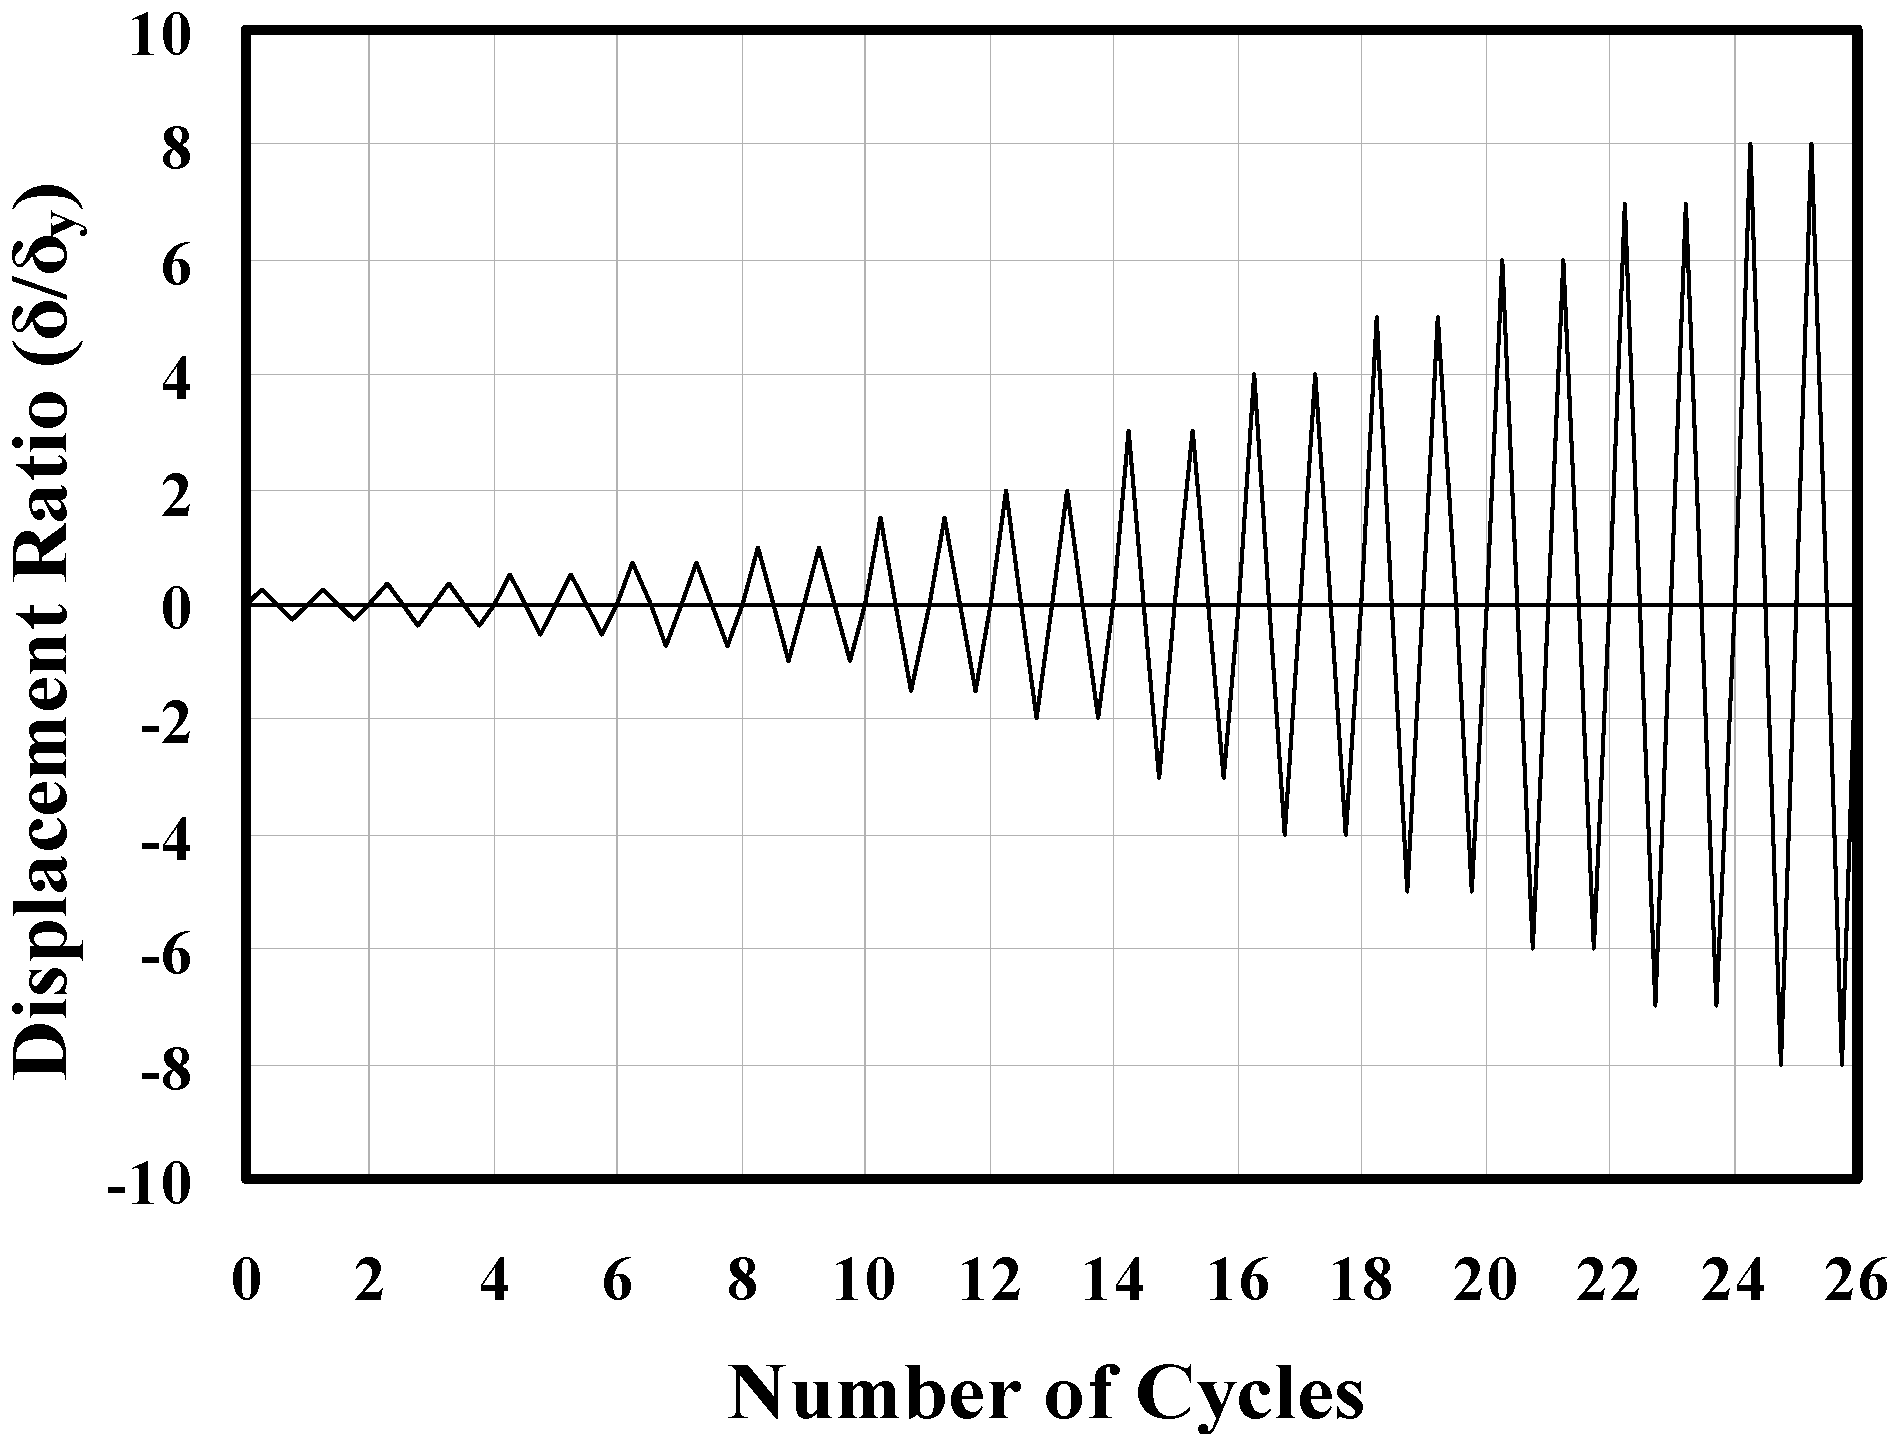
2.3. Loading Equipment and History
2.4. Instrumentation
3. Elastic Behavior Characteristics
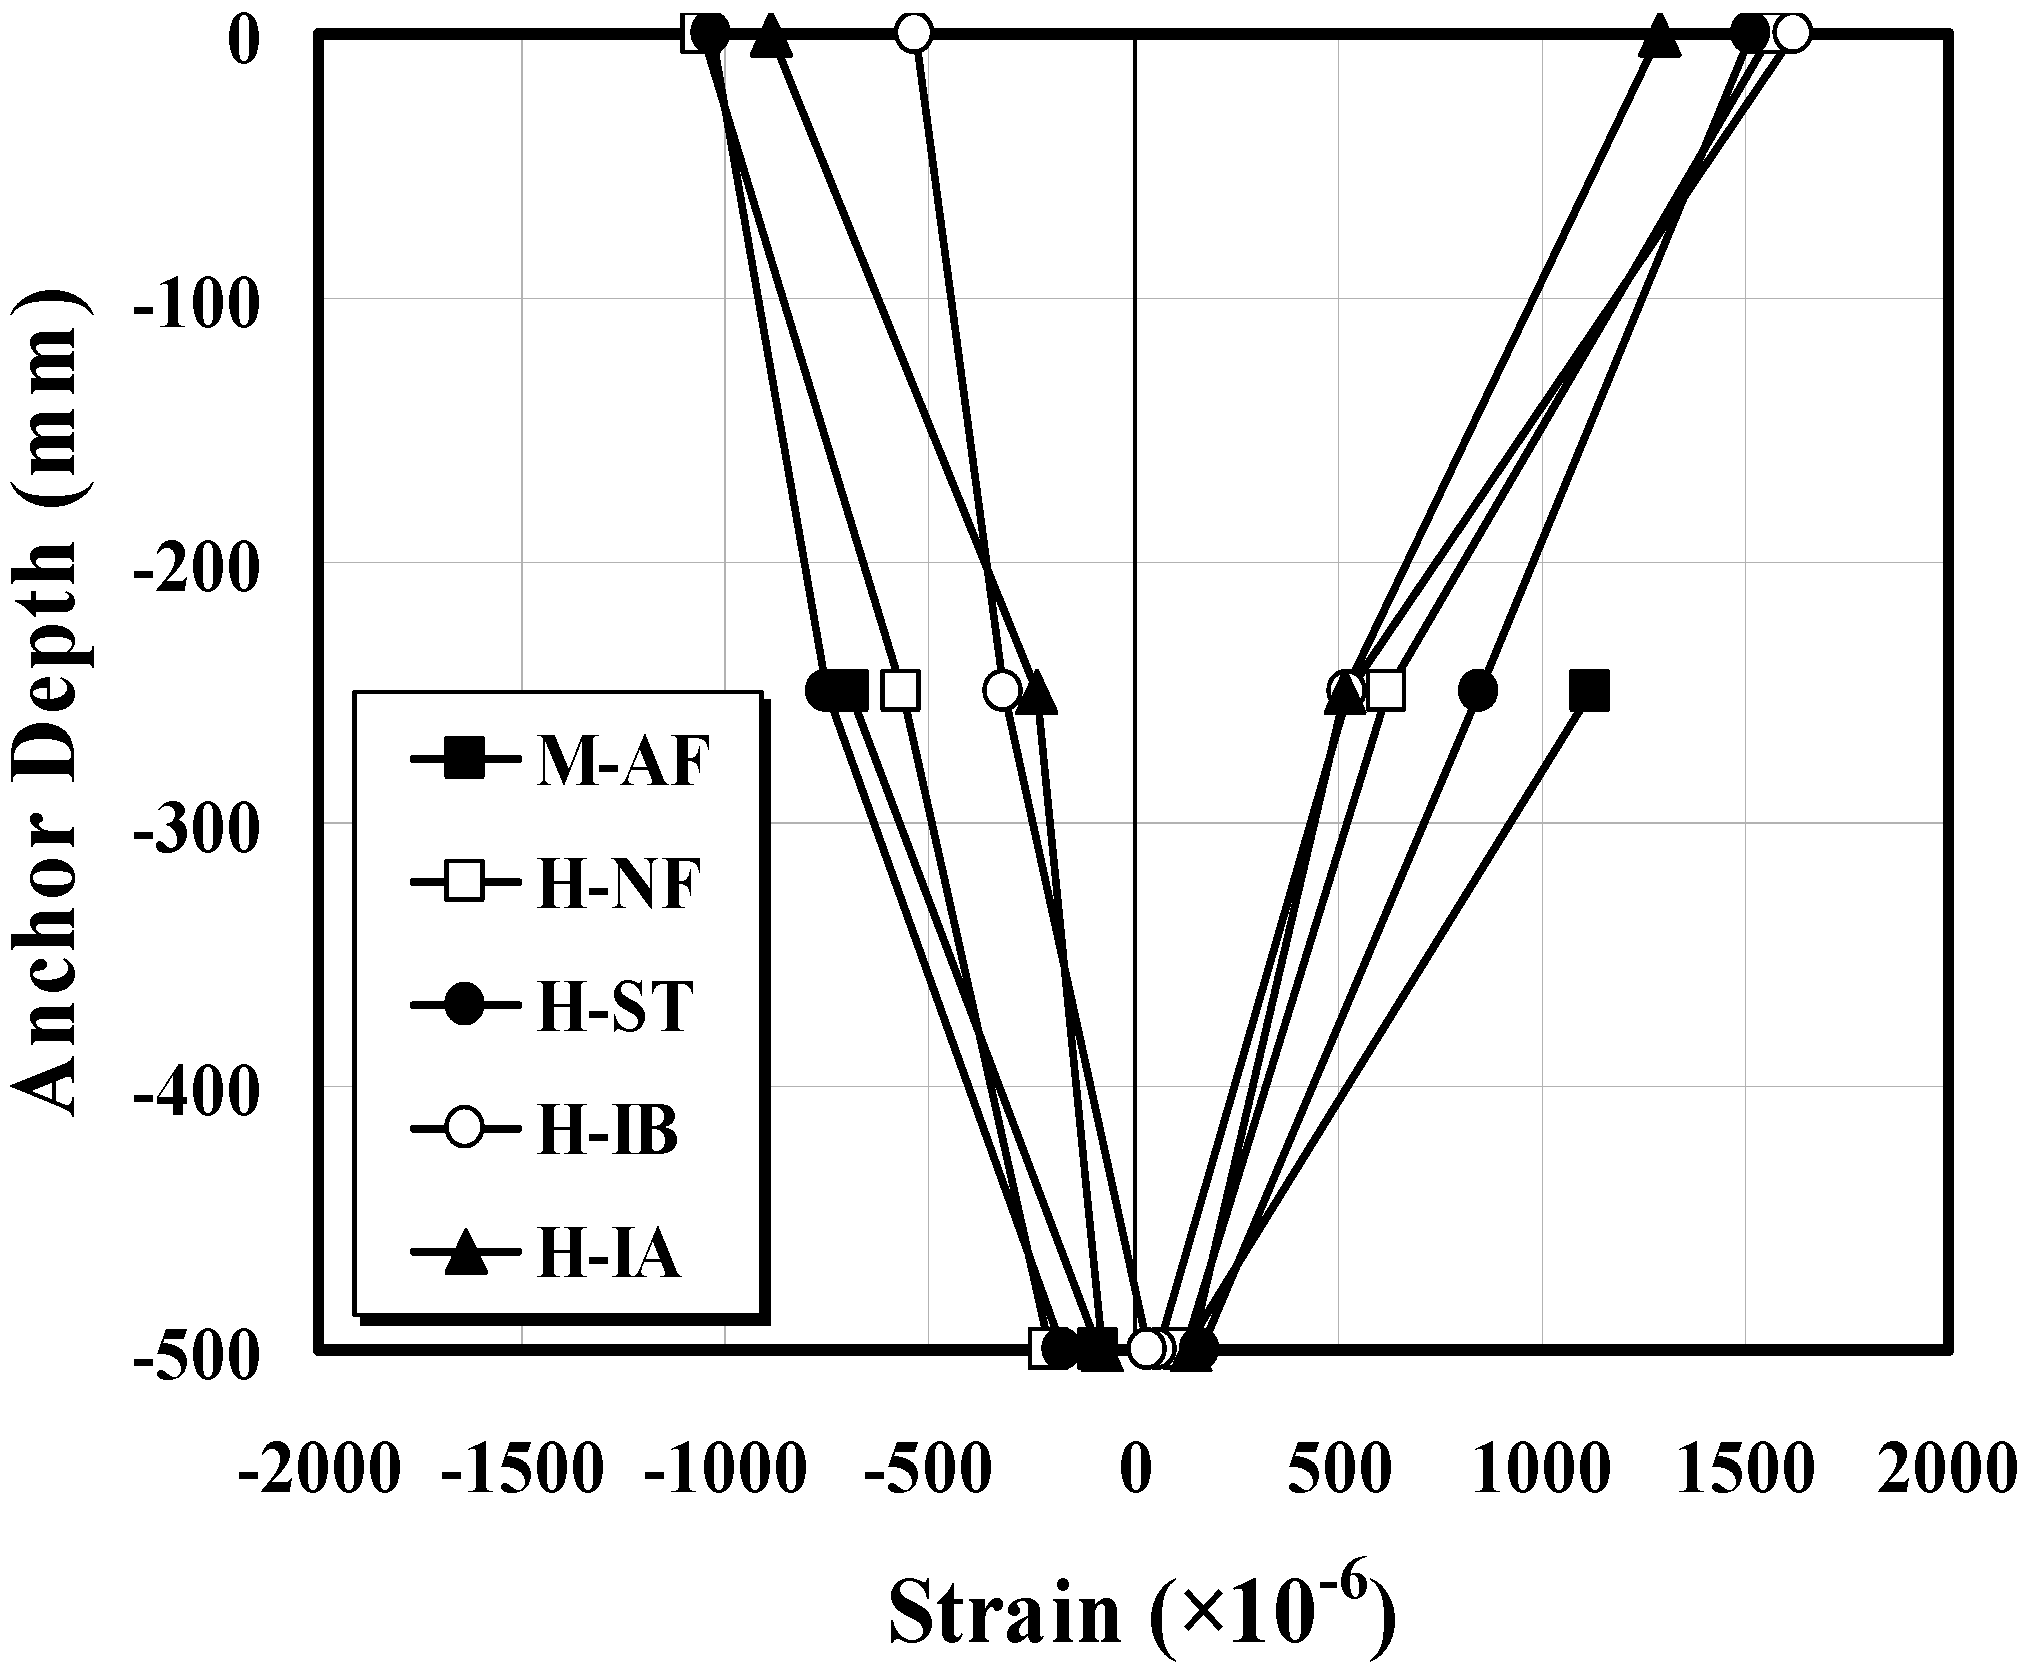
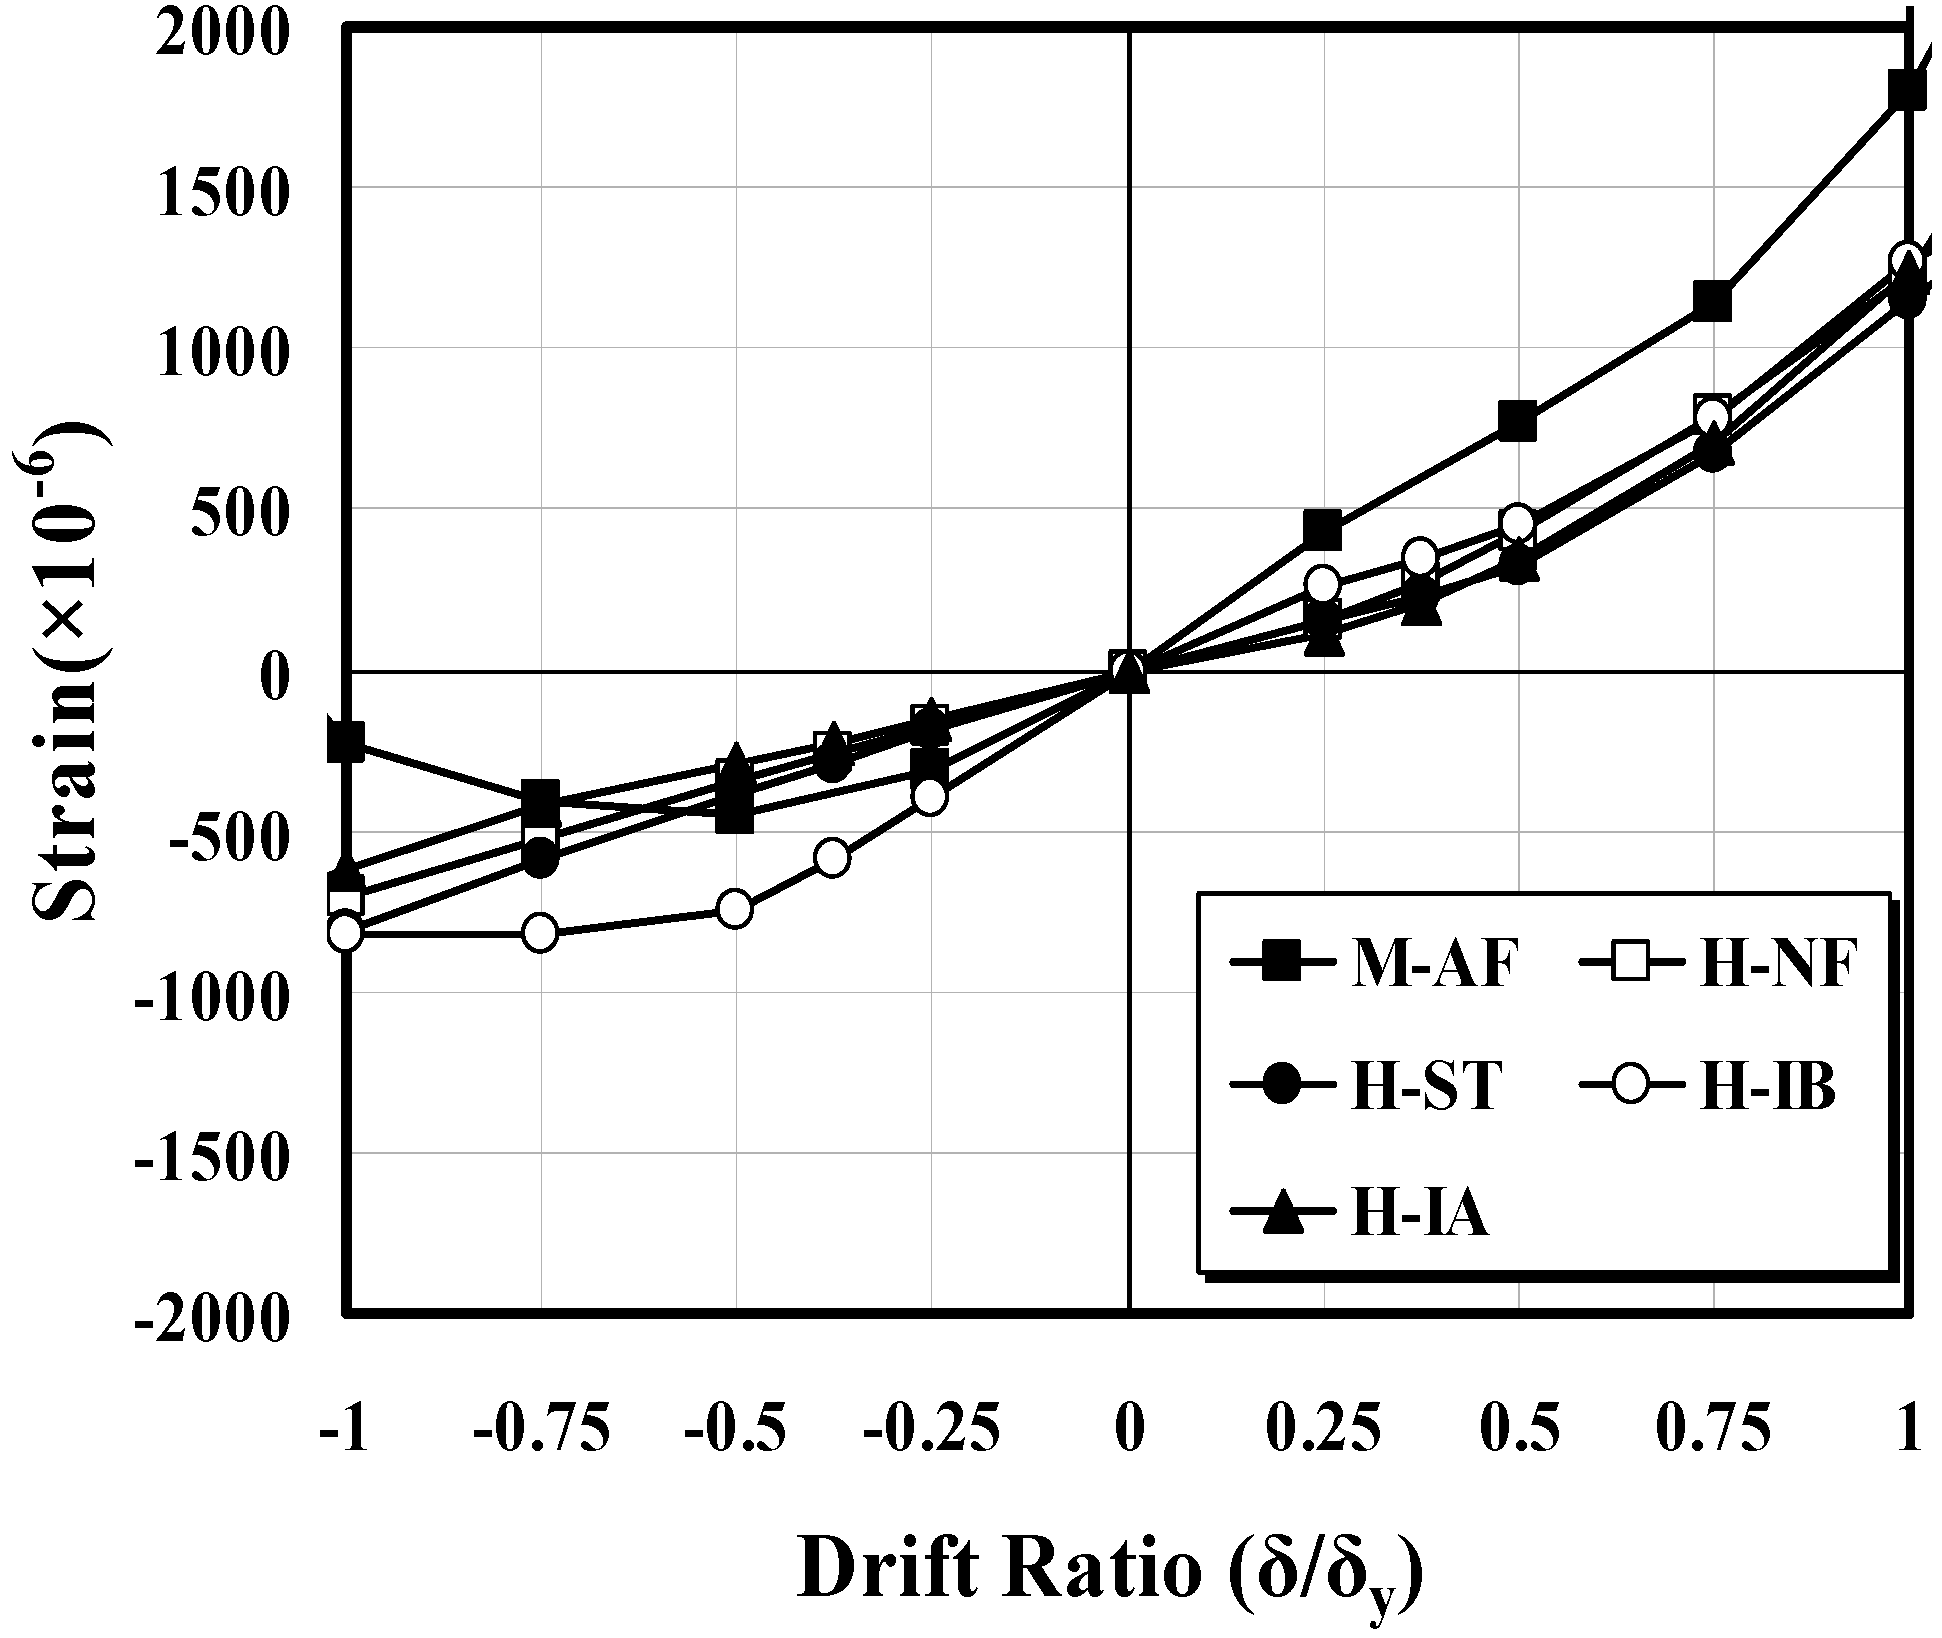
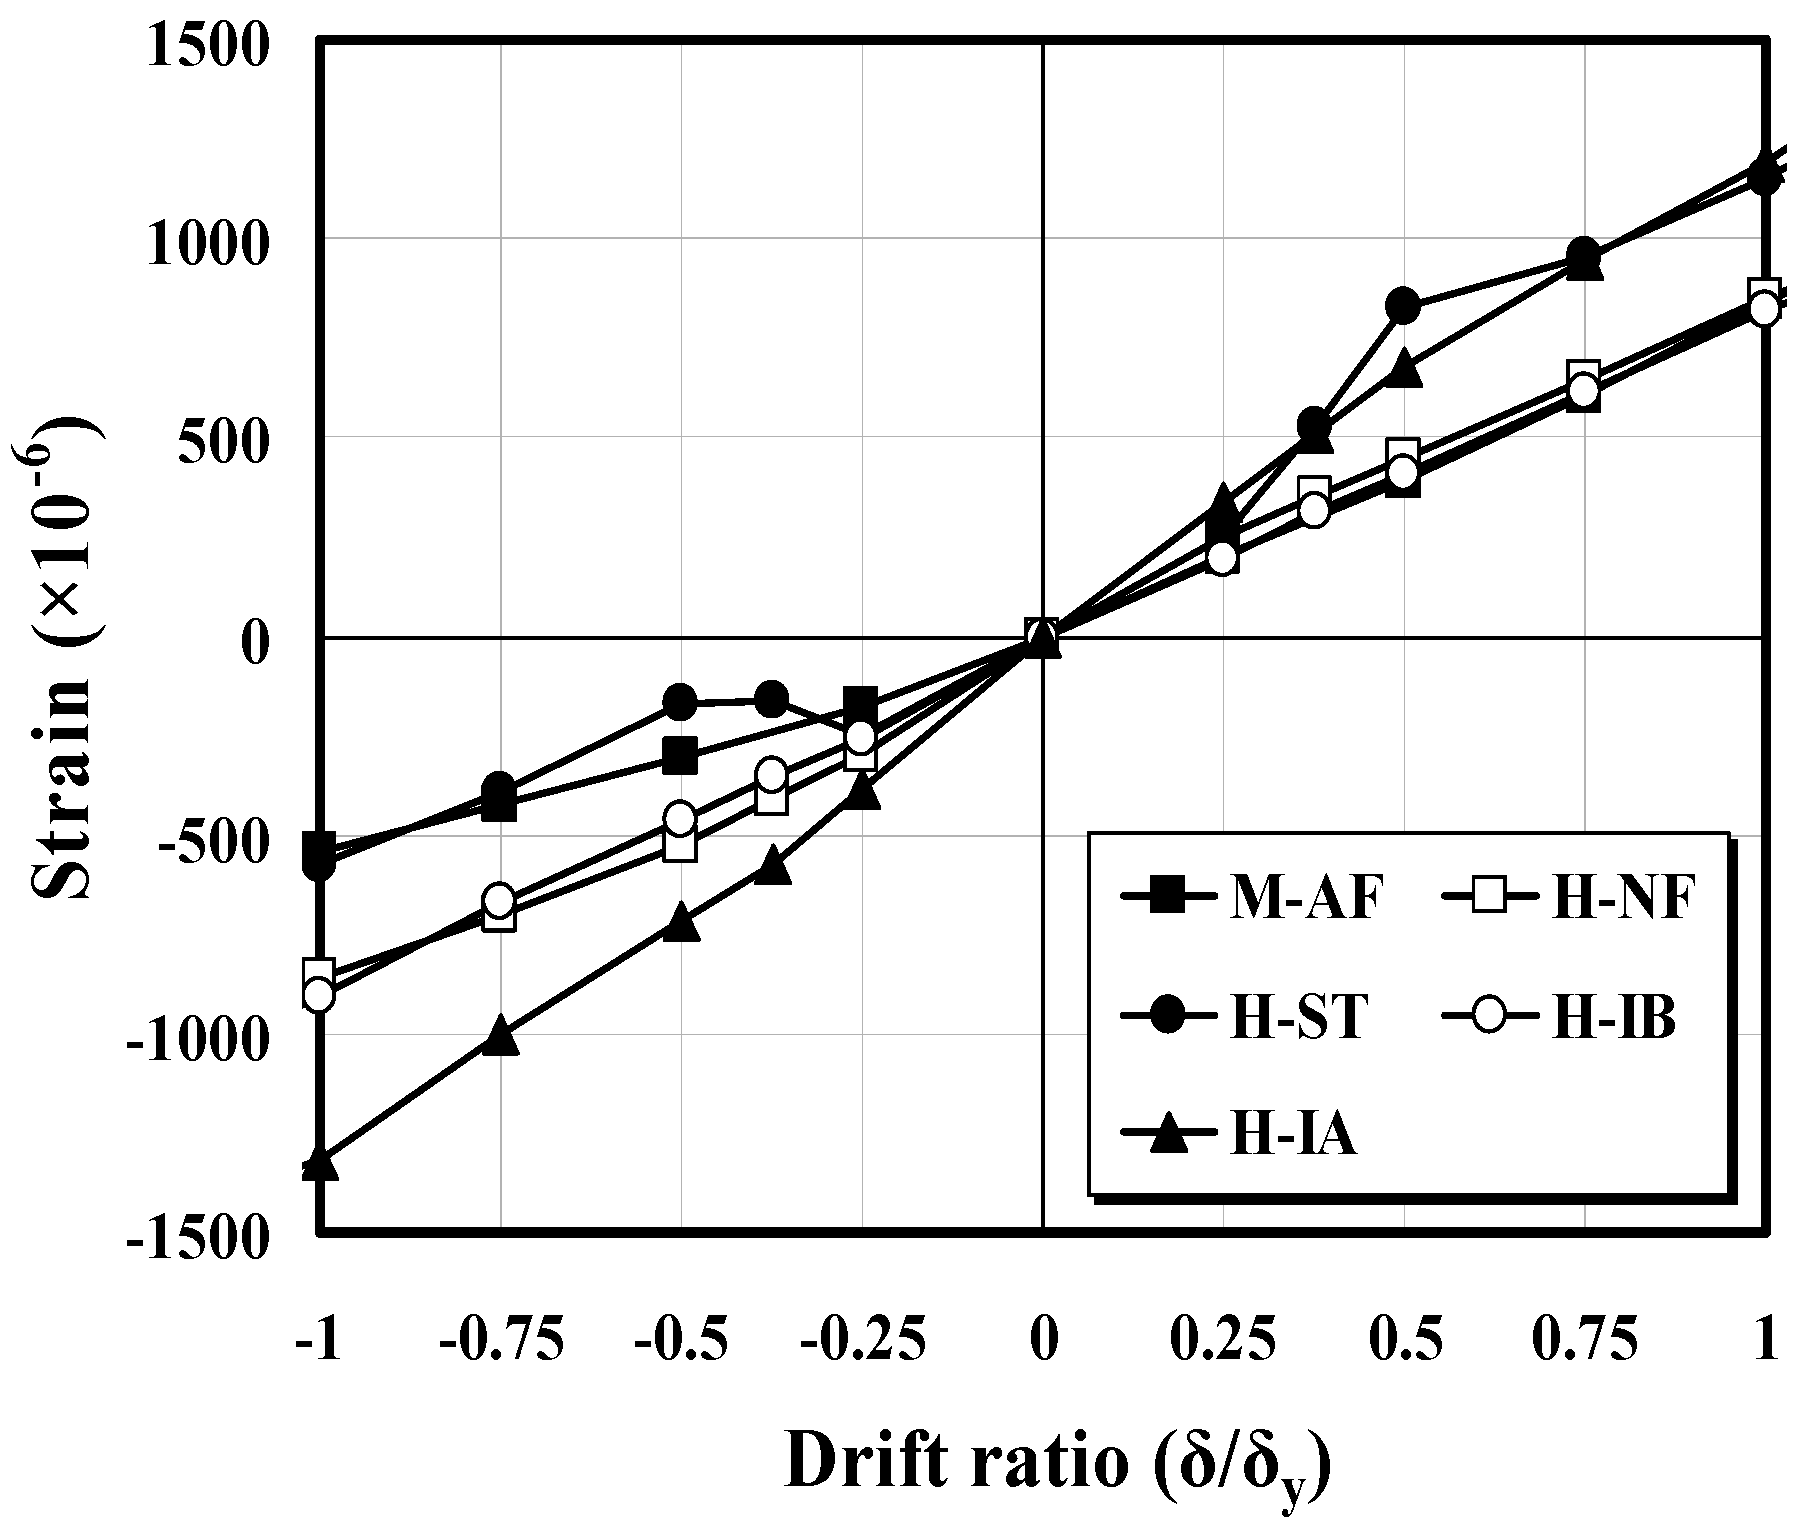
3.1. Strain Distribution Characteristics of Anchor
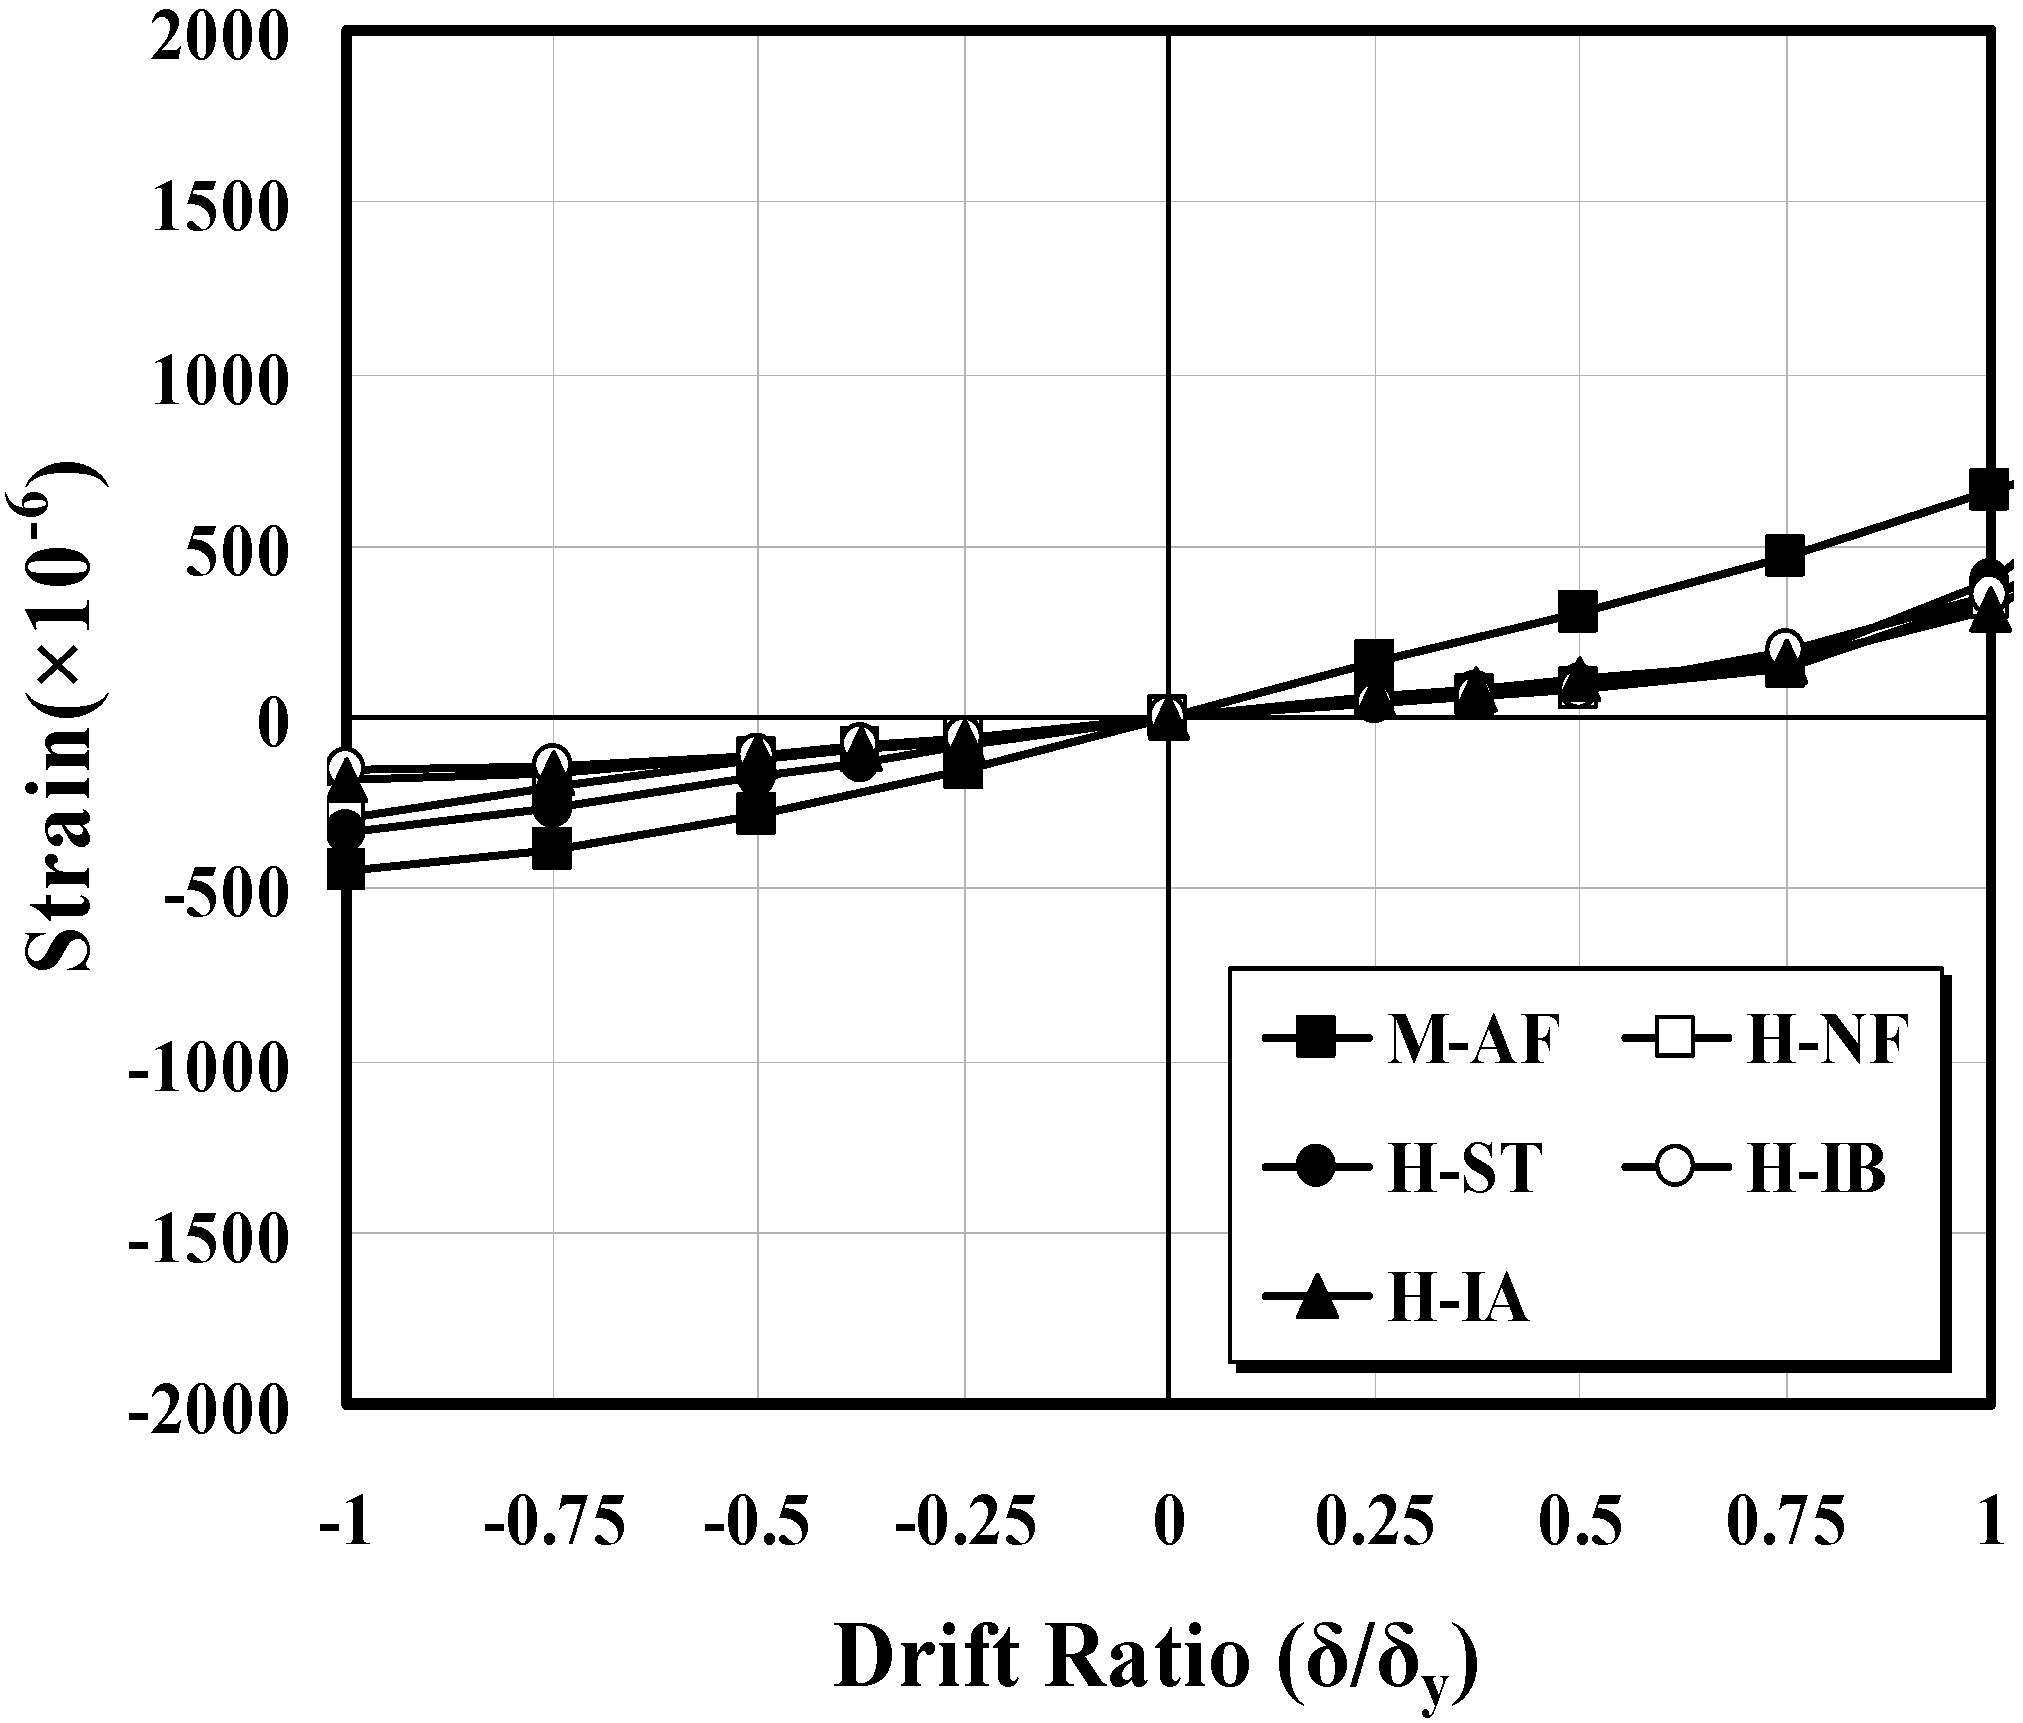
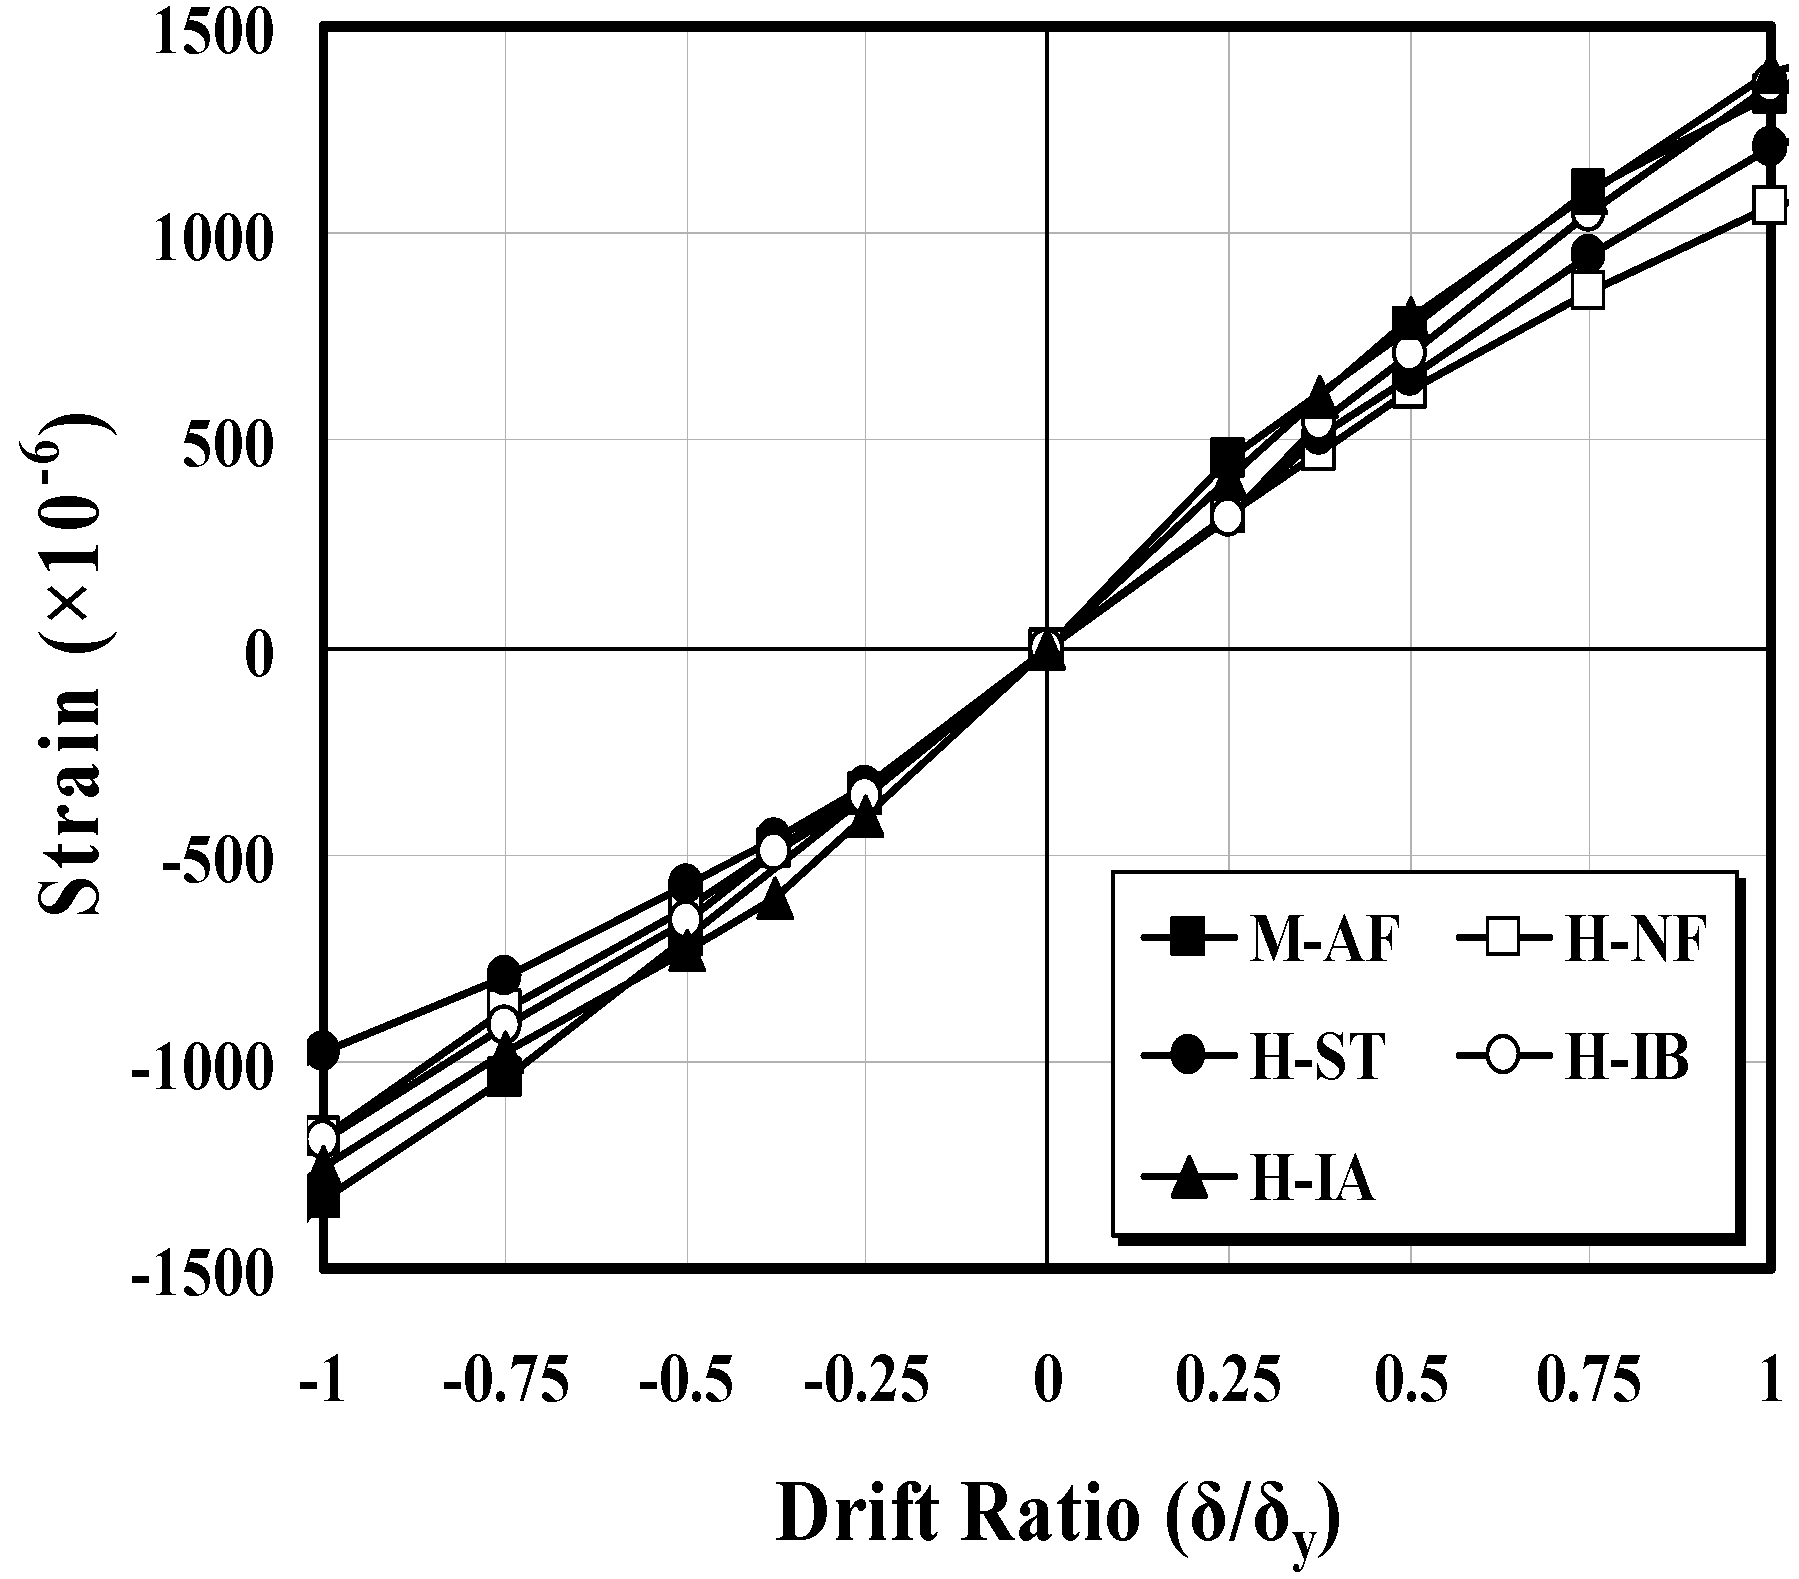
3.2. Strain Distribution Characteristics of the Base Plate
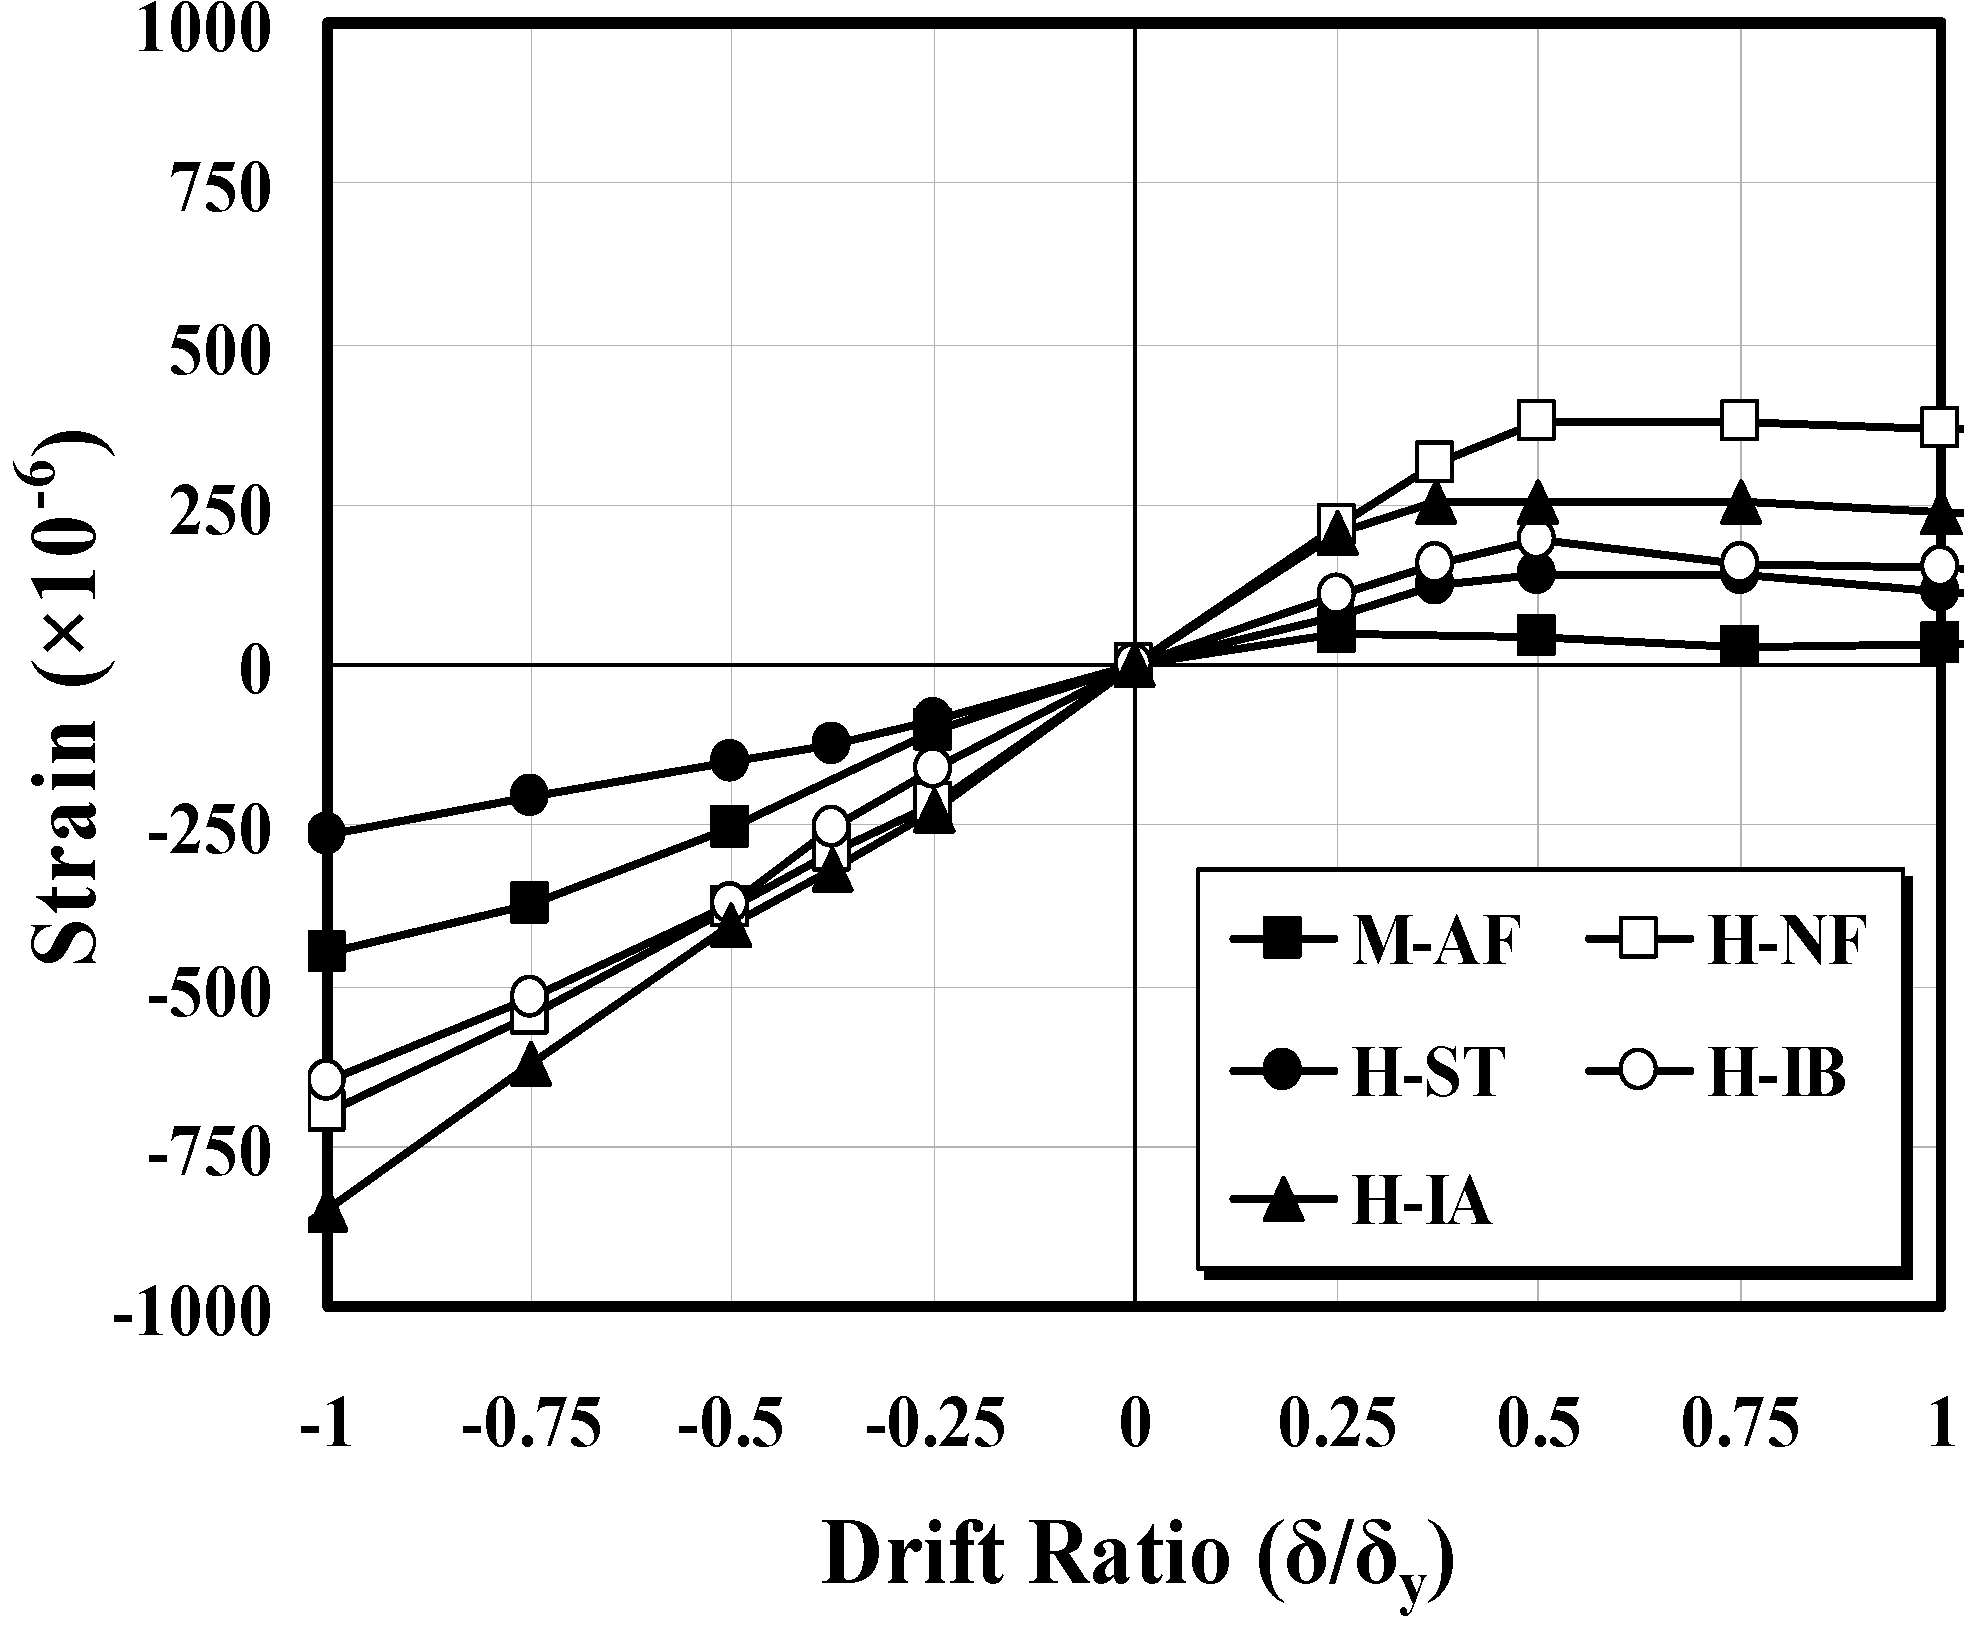
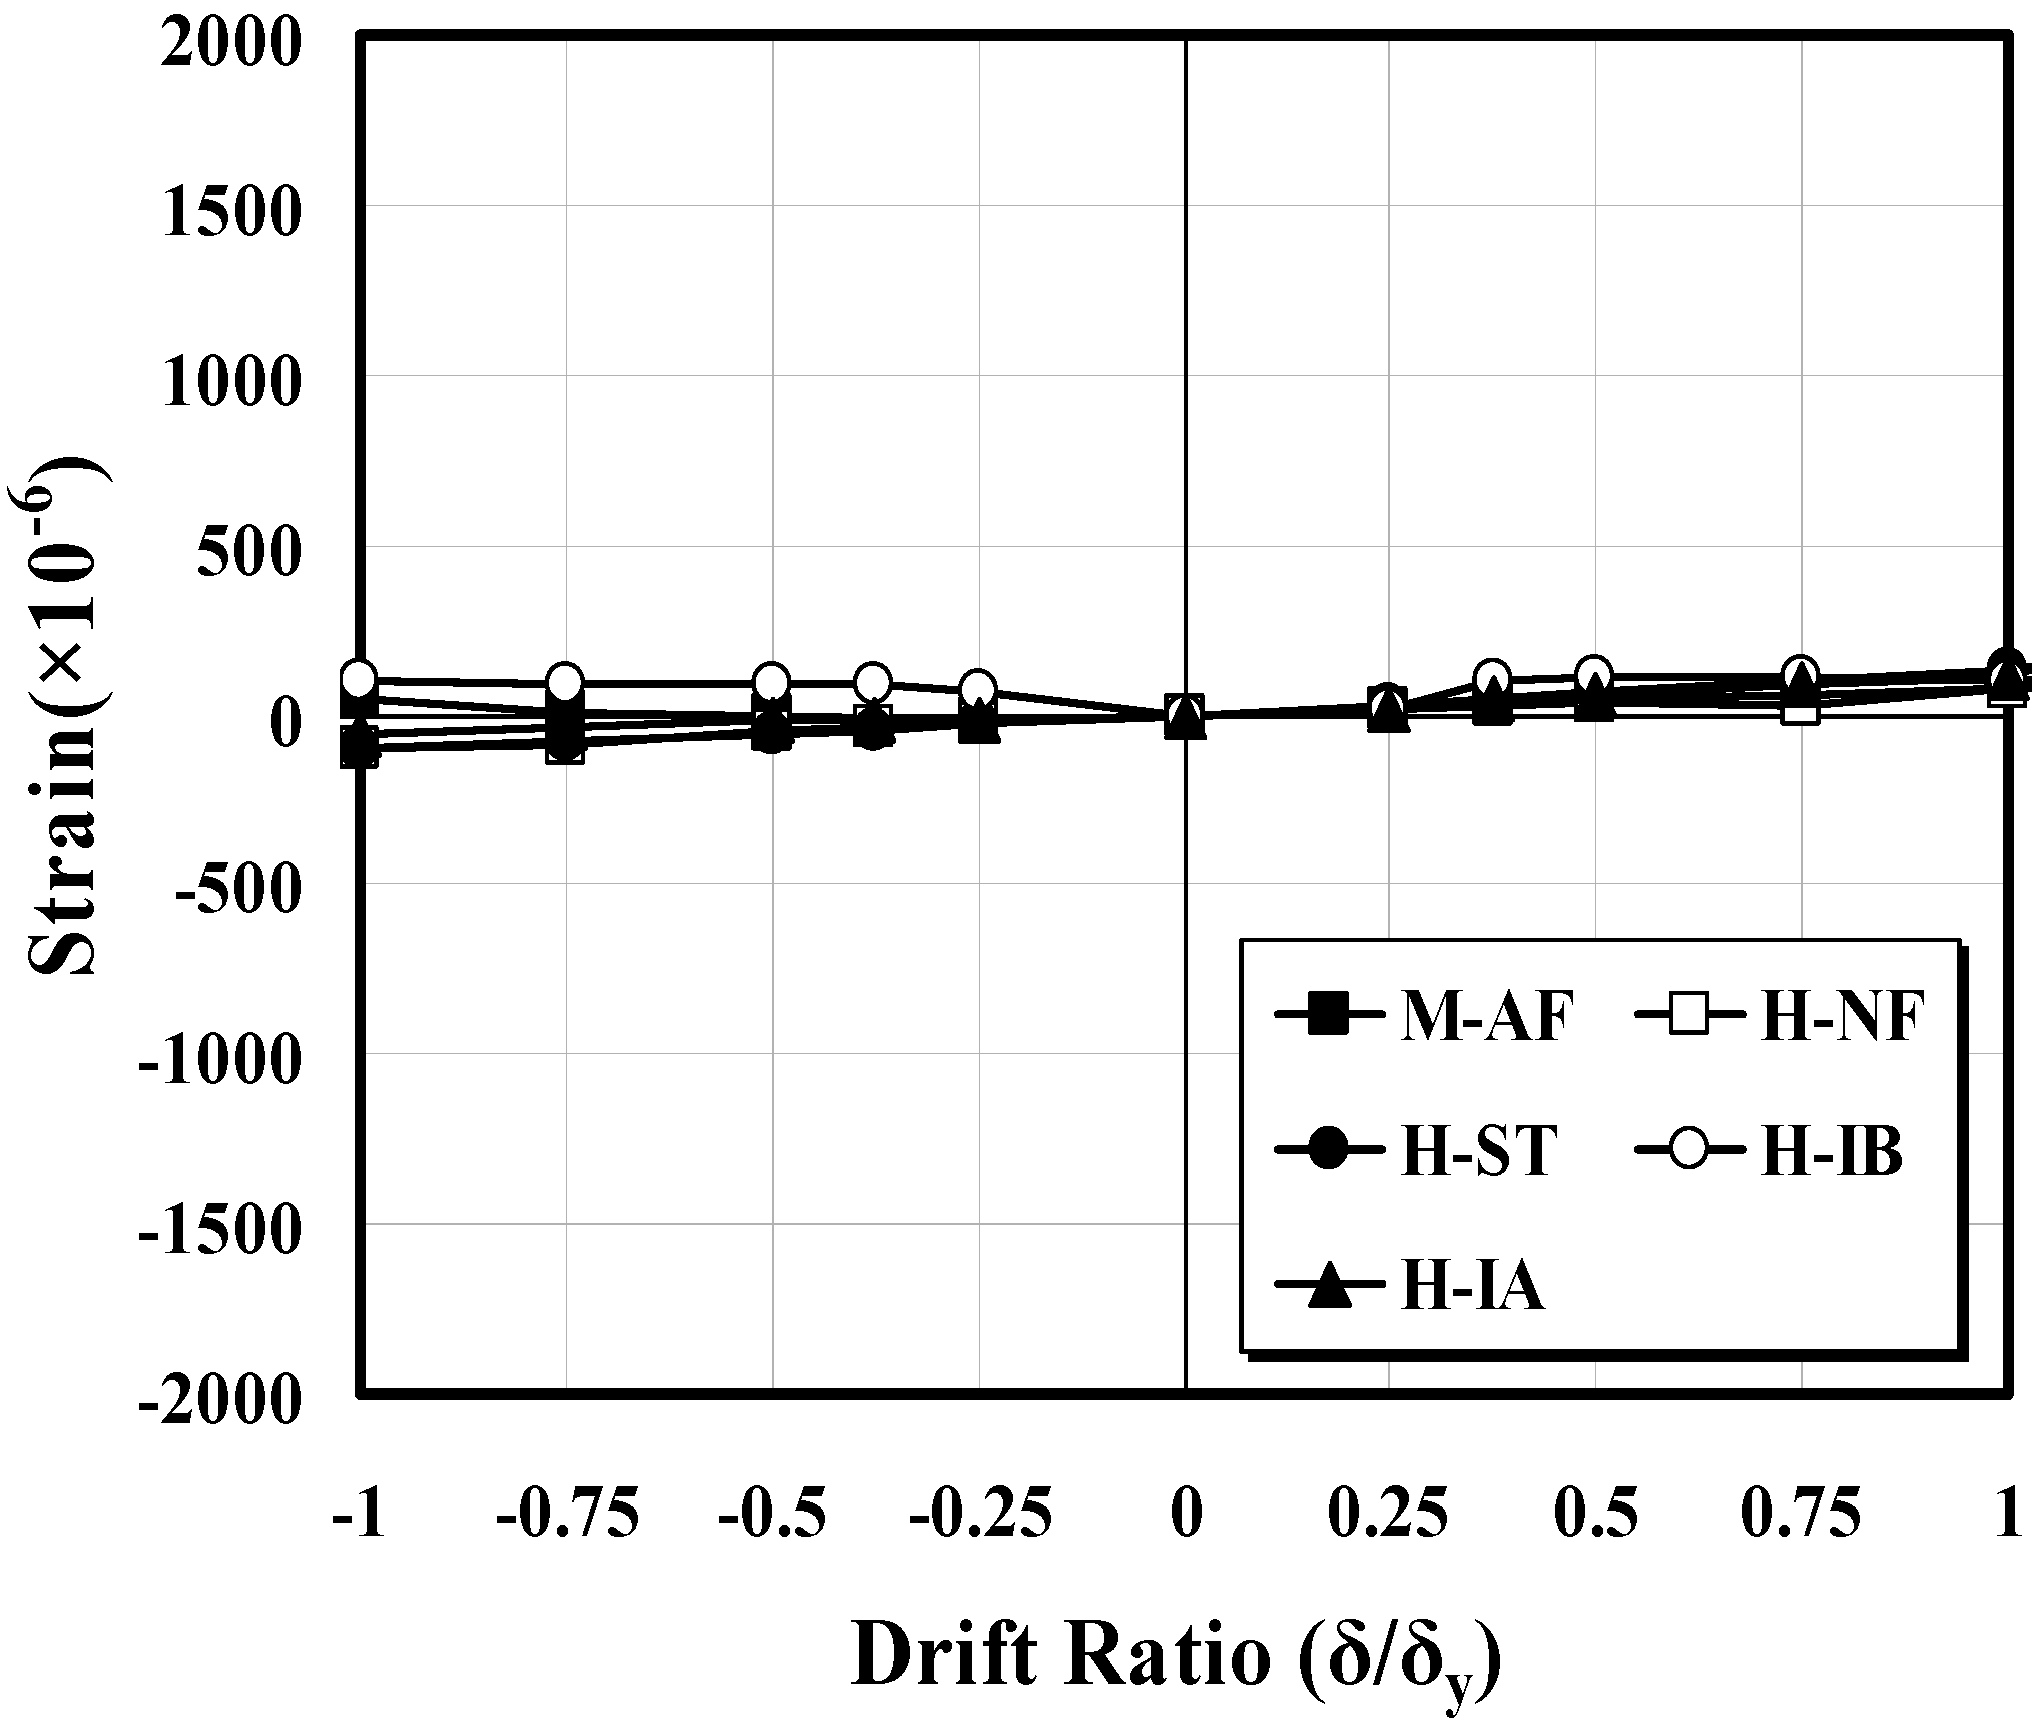
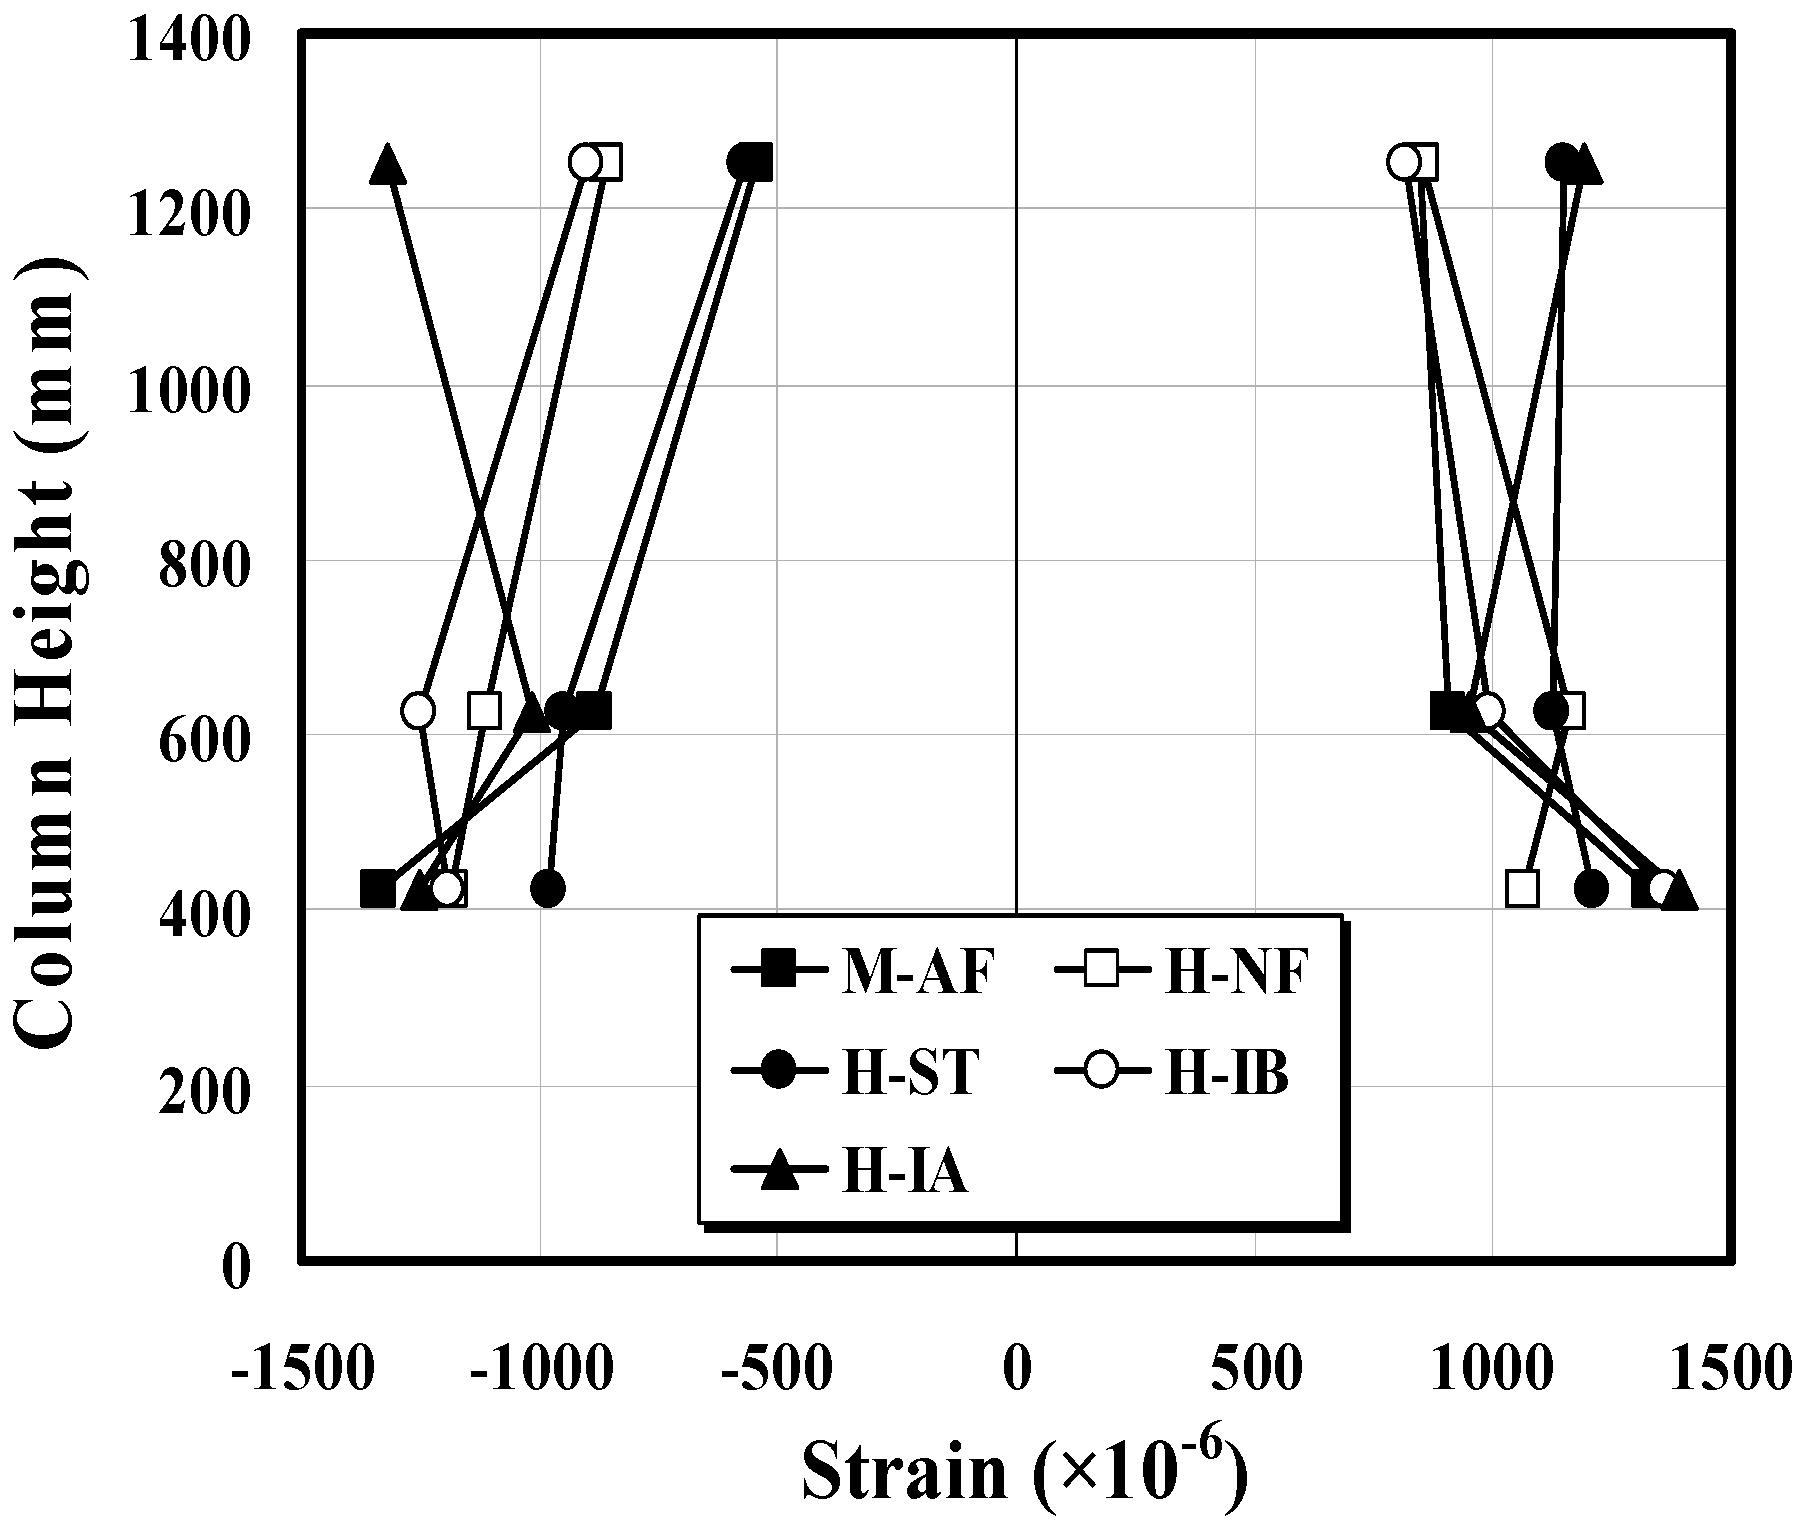
3.3. Strain Distribution Characteristics of Column

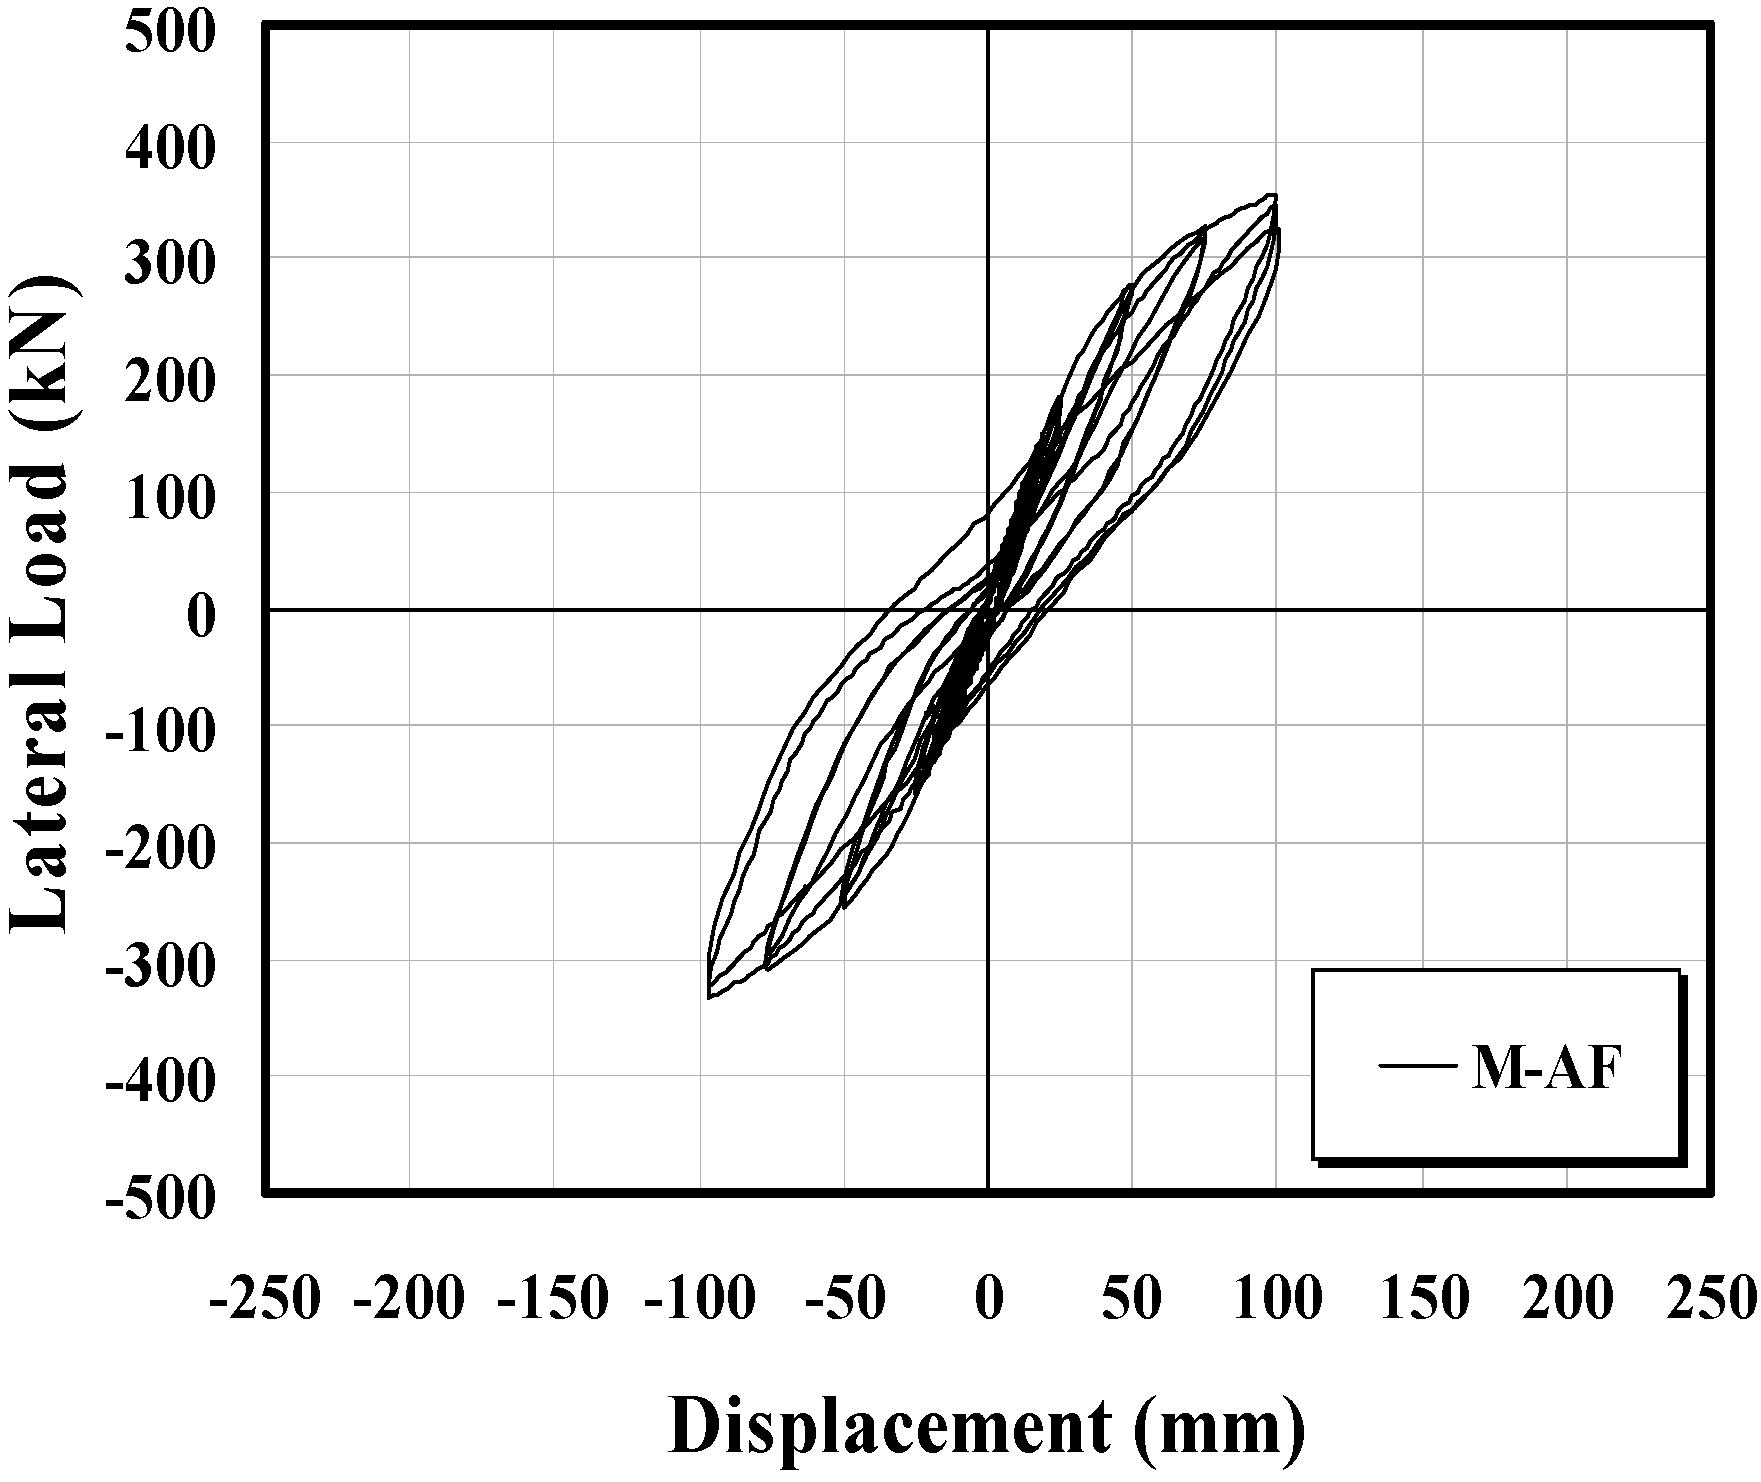
4. Hysteresis Curve under Cyclic Loading
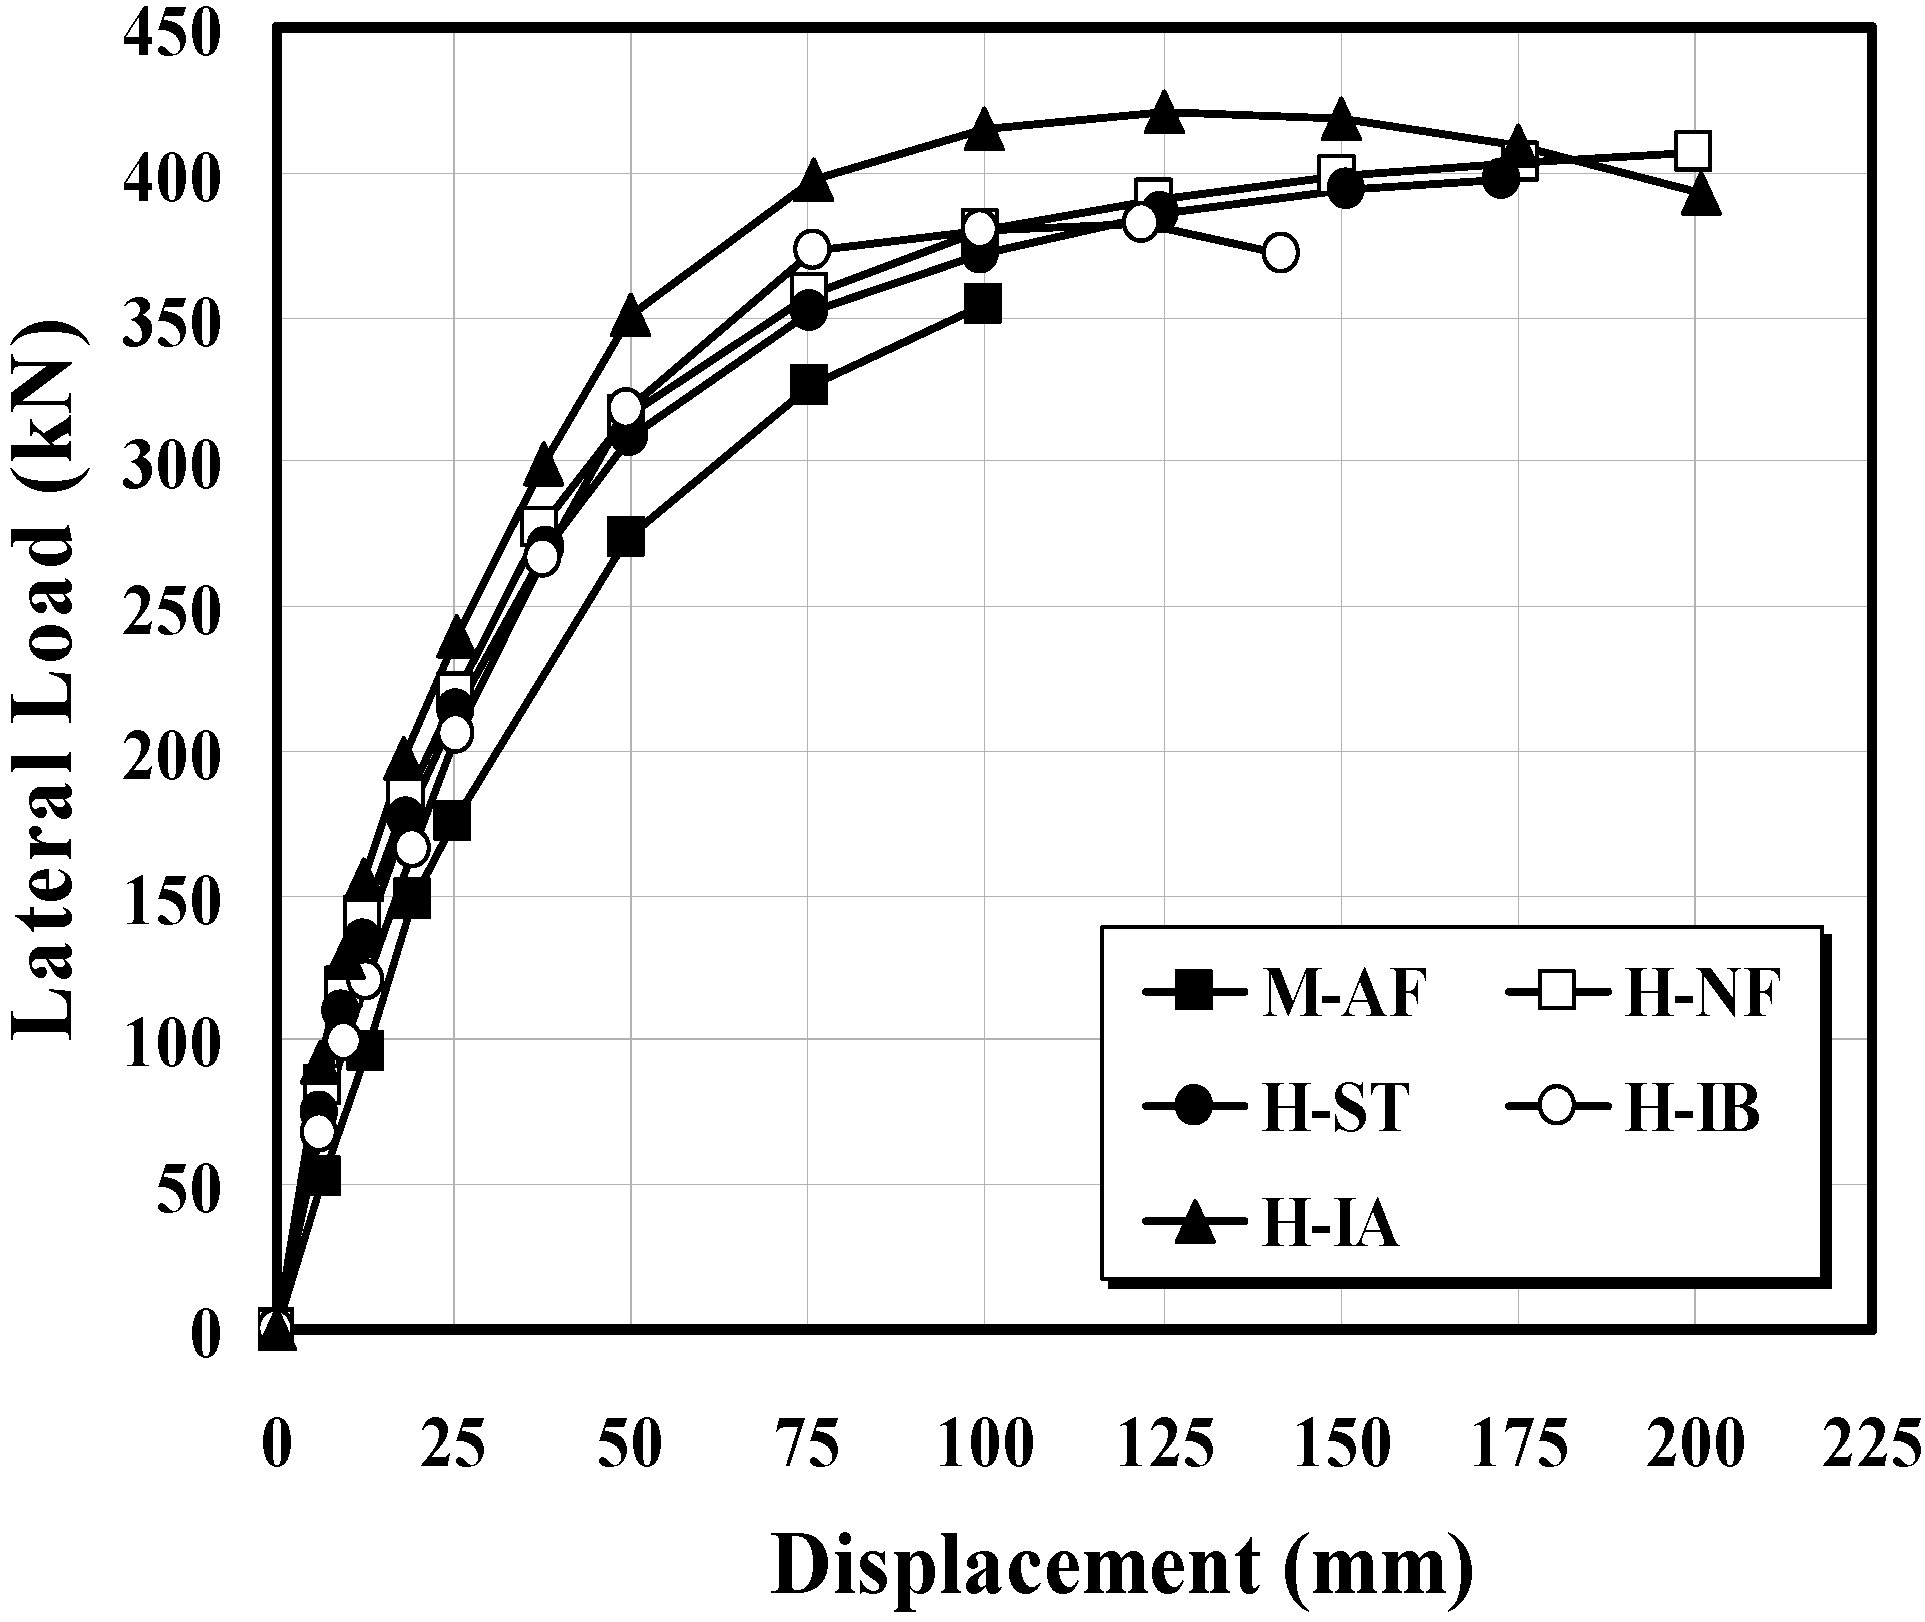
4.1. Comparison of Deformed Capacity
4.2. Comparison of Strength Characteristic
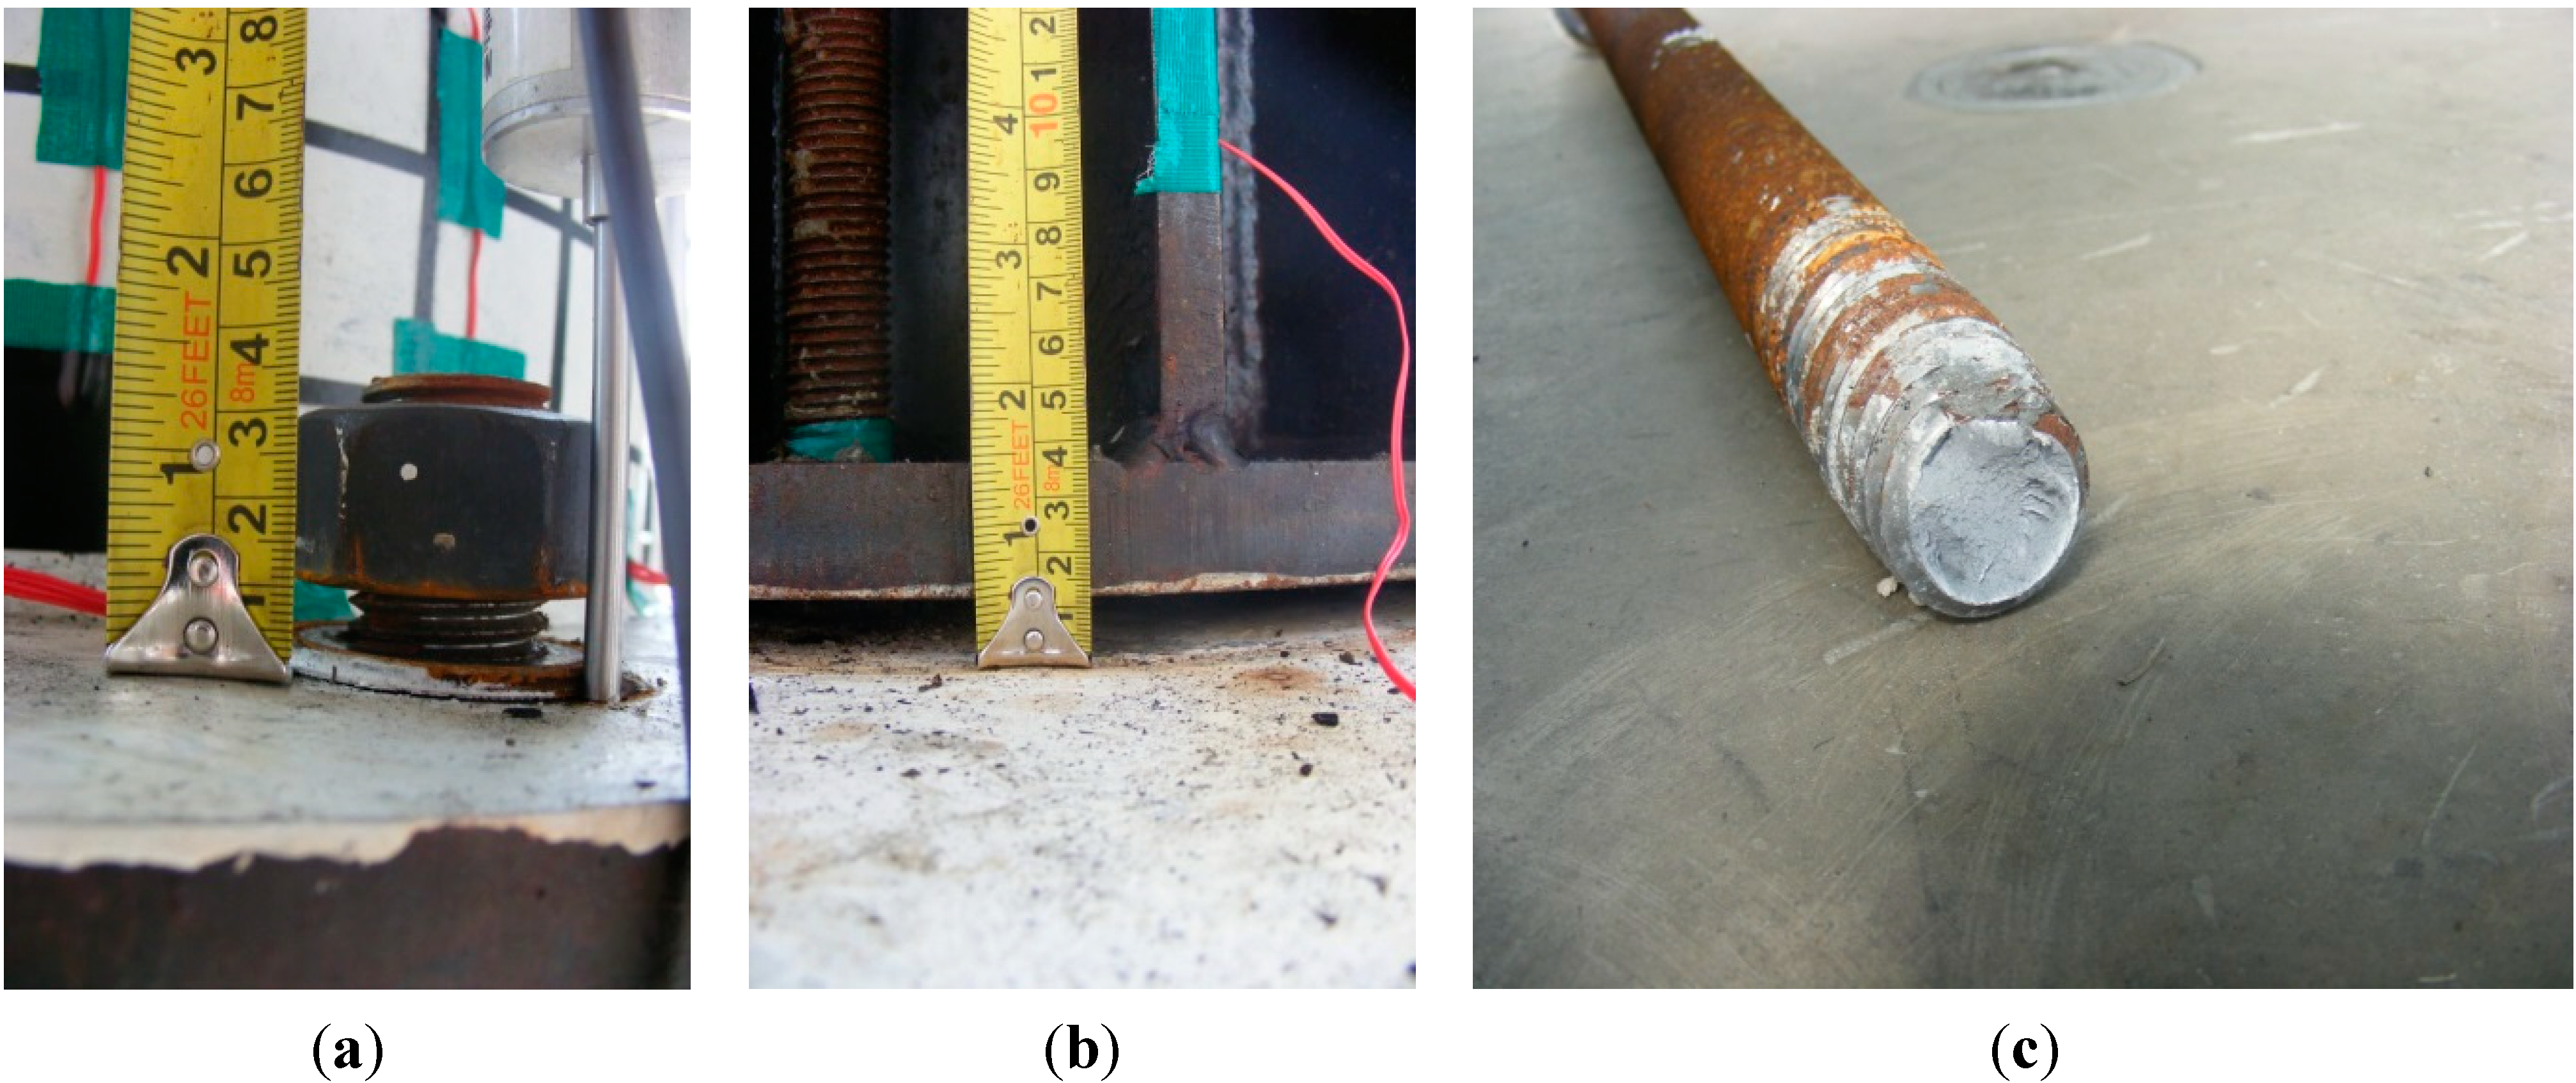
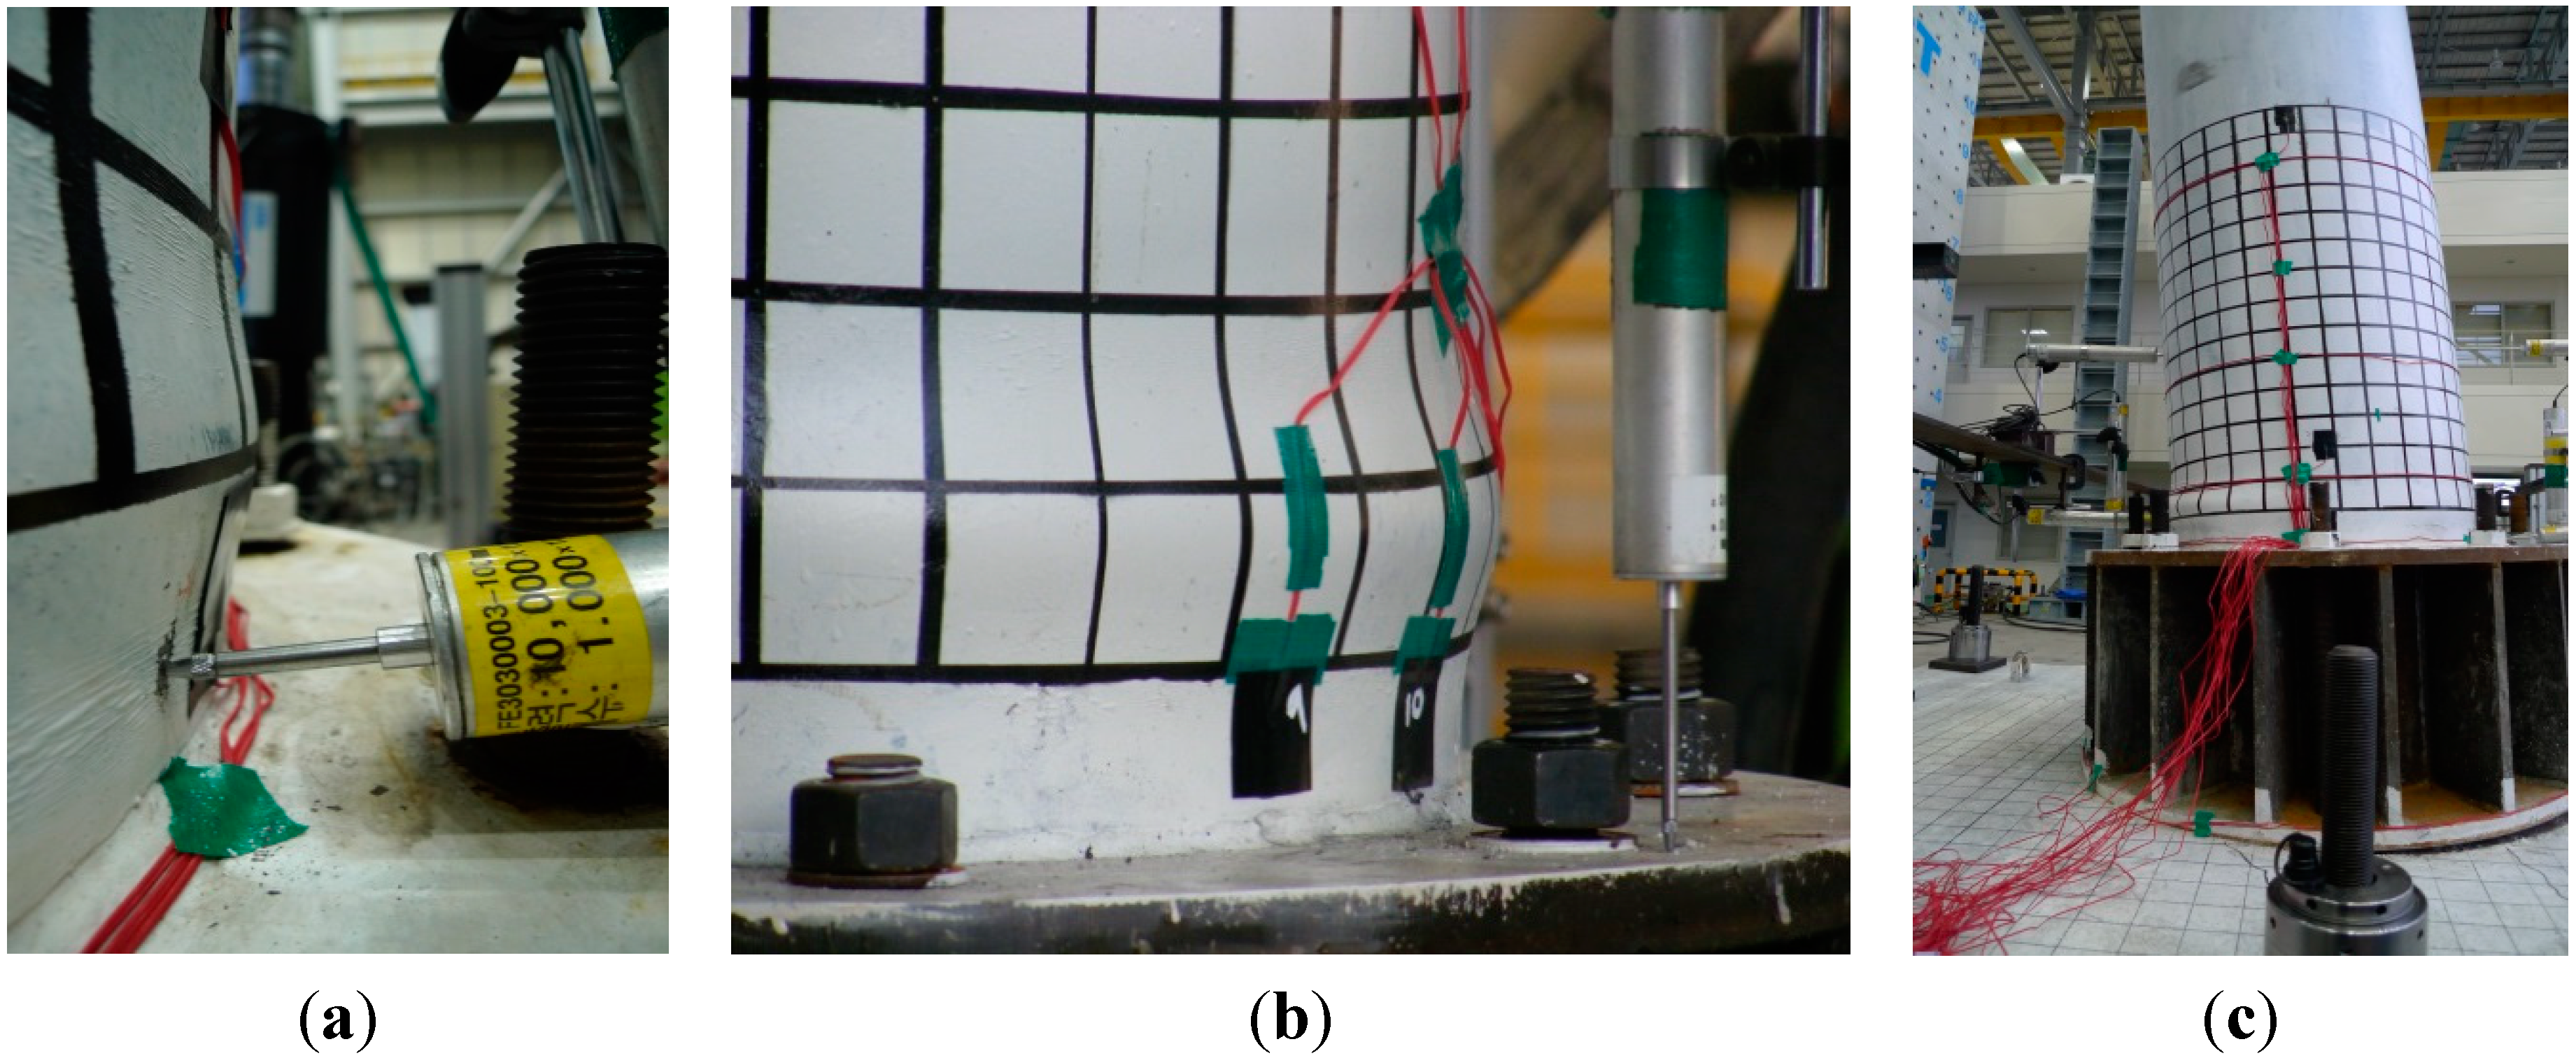
5. Failure Types
5.1. Failure of the Connection

5.2. Failure of the Column
6. Conclusions
- (1)
- The failure type of each circular CFT column-to-foundation connection can be classified as anchor failure and local buckling at the column base. The specimens with general anchors and anchor frames exhibited tensile anchor failure. On the other hand, the specimens with high tension bolts showed local bucking failure under a load. It was thought that the failure type changed because of strength increment. Therefore, to ensure sufficient strength of the column-to-foundation connections, installing high-tension bolts is reasonable.
- (2)
- The experimental loading tests revealed that the specimens with high tension bolts exhibited better structural performance than those with general anchors or anchor frames. In addition, The H-NF’s behavior without anchor frames was similar to M-AF’s in lifted displacement and crack of concrete foundation so it was thought that installation of anchor frames little affects structure’s behavior. For this reason, this study suggested new structural details for design using high tension bolts.
- (3)
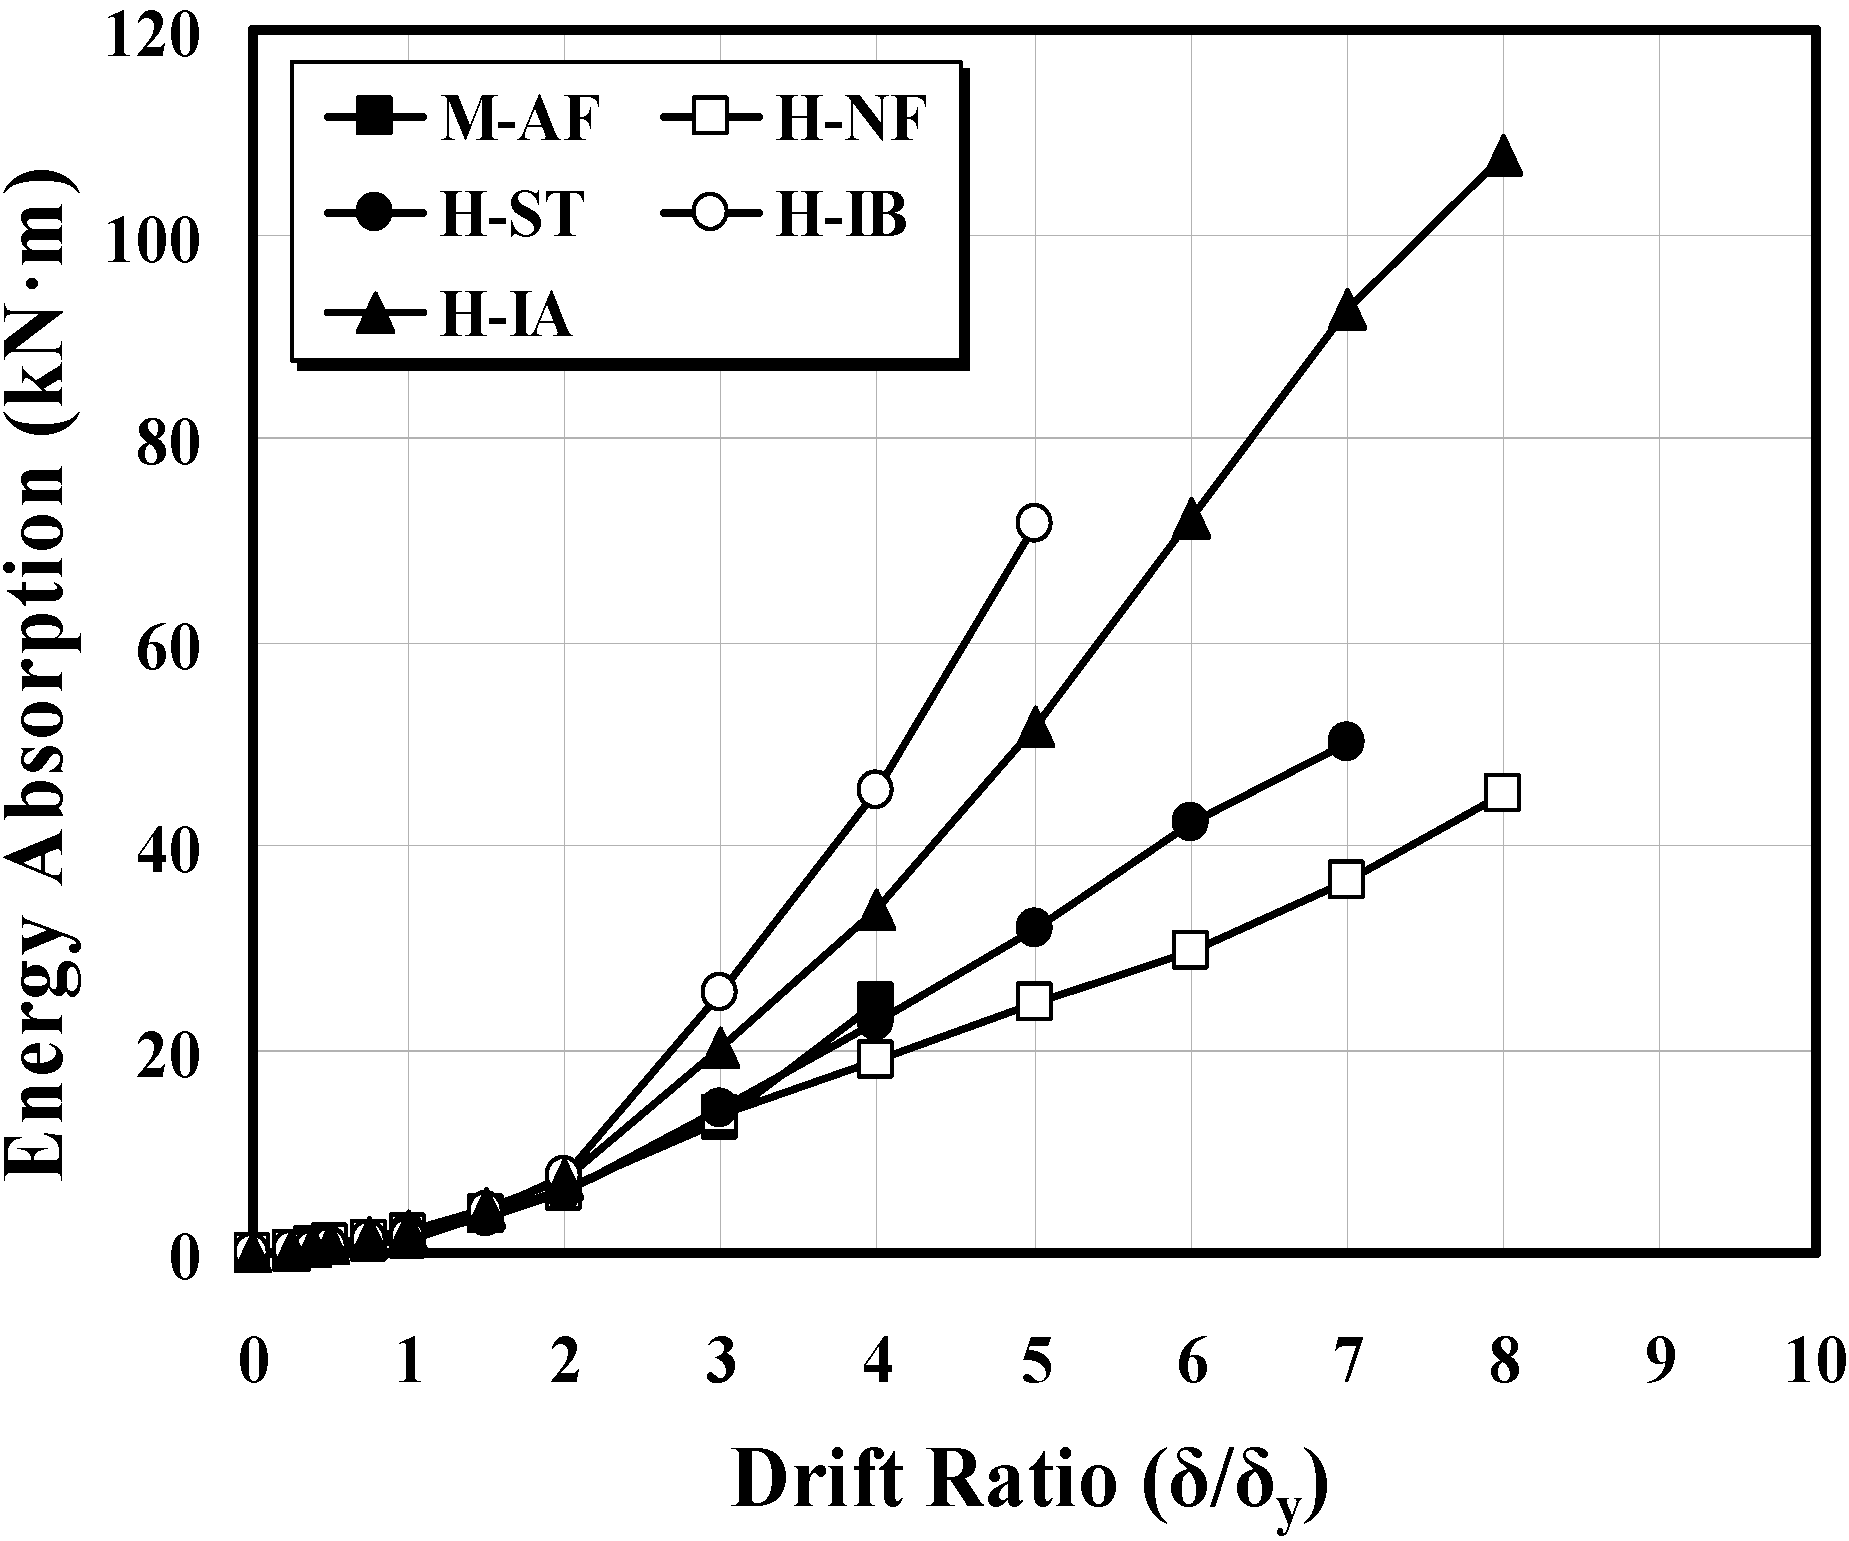
- The envelope curves used mostly for estimating the energy dissipation were obtained from the experimental tests. Both curves compared to each other clearly showed their differences according to the failure types, such as the tensile fracture and local buckling. The H-IB and H-IA specimens with inner reinforcing showed more energy dissipation and especially, H-IB had maximum 1.39 times more energy dissipation than H-IA. The H-IA’s accumulated dissipated energy for each section, however, was more increased than the H-IB’s. Therefore, it is thought that the specimen with inner reinforcing is more advantageous than that with the high-tension bolts.
- (4)
- For the purpose of replacing the established types (i.e., M-AF model), four specimen types newly proposed herein displayed different behavioral characteristic. With the exception of anchor frames, specimens with high tension bolts, which generally show better performance, need to be applied as inner reinforcements to improve the performance of high tension bolts.
Acknowledgments
Author Contributions
Conflicts of Interest
References
- AISC. Steel Construction Manual, 14th ed.; American Institute of Steel Construction: Chicago, IL, USA, 2007. [Google Scholar]
- KSCE Committee. Korean Highway Bridge Specifications; Ministry of Construction and Transportation: Seoul, Korea, 2008. [Google Scholar]
- Kanvinde, A.M.; Jordan, S.J.; Cooke, R.J. Exposed column base plate connections in moment frames—Simulations and behavioral insights. J. Constr. Steel Res. 2013, 84, 82–93. [Google Scholar] [CrossRef]
- Lee, D.-Y.; Goel, S.C.; Stojadinovic, B. Exposed Column-Base Plate Connections Bending about Weak Axis: 1. Numerical Parametric Study. Int. J. Steel Struct. 2008, 8, 11–27. [Google Scholar]
- Lee, D.-Y.; Goel, S.C.; Stojadinovic, B. Exposed Column-Base Plate Connections Bending About Weak Axis: 2. Experimental Study. Int. J. Steel Struct. 2008, 8, 29–41. [Google Scholar]
- Lee, S.-J.; Lu, L.W. Cyclic Test of Full Scale Composite Joint Sub-assemblages. J. Struct. Eng. 1989, 115, 1997–1998. [Google Scholar]
- Astaneh, A.; Bergsma, G.; Shen, J.H. Behavior and Design of Base Plates for Gravity, Wind and Seismic Loads. In Proceeding of the AISC National Steel Construction Conference, Las Vegas, NV, USA, 3–5 June 1992.
- Park, Y.-M.; Hwang, W.-S.; Yoon, T.-Y.; Hwang, M.-O. A new Base Plate System using Deformed Reinforcing Bars for Concrete Filled Tubular Column. Steel Comp. Struct. 2005, 5, 375–394. [Google Scholar] [CrossRef]
- Chung, J.; Matsui, C. SRC Standards in Japan and Comparison of Various Standards for CFT Columns. Int. J. Steel Struct. 2005, 5, 315–323. [Google Scholar]
- Hognestad, E.; Hanson, N.W.; McHenry, D. Concrete Stress Distribution in Ultimate Stress Design. ACI J. 1955, 27, 455–479. [Google Scholar]
- Park, K.-D.; Kim, H.-J.; Hwang, W.-S. Experimental and Numerical Studies on the Confined Effect of Steel Composite Circular Columns Subjected to Axial Load. Int. J. Steel Struct. 2012, 12, 253–265. [Google Scholar] [CrossRef]
- Marson, J.; Bruneau, M. Cyclic Testing of Concrete-Filled Circular Steel Bridge Piers having Encased Fixed-Based Detail. J. Bridge Eng. 2004, 9, 14–23. [Google Scholar] [CrossRef]
© 2015 by the authors; licensee MDPI, Basel, Switzerland. This article is an open access article distributed under the terms and conditions of the Creative Commons Attribution license (http://creativecommons.org/licenses/by/4.0/).
Share and Cite
Kim, H.-J.; Hu, J.-W.; Hwang, W.-S. Cyclic Testing for Structural Detail Improvement of CFT Column-Foundation Connections. Sustainability 2015, 7, 5260-5281. https://doi.org/10.3390/su7055260
Kim H-J, Hu J-W, Hwang W-S. Cyclic Testing for Structural Detail Improvement of CFT Column-Foundation Connections. Sustainability. 2015; 7(5):5260-5281. https://doi.org/10.3390/su7055260
Chicago/Turabian StyleKim, Hee-Ju, Jong-Wan Hu, and Won-Sup Hwang. 2015. "Cyclic Testing for Structural Detail Improvement of CFT Column-Foundation Connections" Sustainability 7, no. 5: 5260-5281. https://doi.org/10.3390/su7055260