Article

Thermodynamic Analysis of a Power Plant Integrated with Fogging Inlet Cooling and a Biomass Gasification

by
Hassan Athari
1,
Saeed Soltani
2,*,
Marc A. Rosen
3,
Seyed Mohammad Seyed Mahmoudi
2 and
Tatiana Morosuk
4
1
Department of Mechanical Engineering, University of Ataturk, Erzurum 25240, Turkey
2
Faculty of Mechanical Engineering, University of Tabriz, Tabriz 51666-16471, Iran
3
Faculty of Engineering and Applied Science, University of Ontario Institute of Technology, 2000 Simcoe Street North, Oshawa, ON L1H 7K4, Canada
4
Institute for Energy Engineering, Technische Universität Berlin, Marchstr 18, 10587 Berlin, Germany
*
Author to whom correspondence should be addressed.
Sustainability 2015, 7(2), 1292-1307; https://doi.org/10.3390/su7021292
Submission received: 3 December 2014 / Revised: 24 December 2014 / Accepted: 19 January 2015 / Published: 27 January 2015
(This article belongs to the Section Energy Sustainability)

Abstract

:
Biomass energy and especially biofuels produced by biomass gasification are clean and renewable options for power plants. Also, on hot days the performance of gas turbines decreases substantially, a problem that can be mitigated by fog cooling. In the present paper, a biomass-integrated fogging steam injected gas turbine cycle is analyzed with energy and exergy methods. It is observed that (1) increasing the compressor pressure ratio raises the air flow rate in the plant but reduces the biomass flow rate; (2) increasing the gas turbine inlet temperature decreases the air and biomass flow rates; (3) increasing the compressor pressure ratio raises the energy and exergy efficiencies, especially at lower pressure ratios; (4) increasing the gas turbine inlet temperature raises both efficiencies; and (5) overspray increases the energy efficiency and net cycle power slightly. The gas turbine exhibits the highest exergy efficiency of the cycle components and the combustor the lowest. A comparison of the cycle with similar cycles fired by natural gas and differently configured cycles fueled by biomass shows that the cycle with natural gas firing has an energy efficiency 18 percentage points above the biomass fired cycle, and that steam injection increases the energy efficiency about five percentage points relative to the cycle without steam injection. Also, the influence of steam injection on energy efficiency is more significant than fog cooling.

1. Introduction

The performance of a gas turbine, particularly output power and energy efficiency, is significantly affected by ambient temperature. This is especially problematic during hot and humid summer periods when power demands often peak. The cooling of inlet air, which is one way to increase energy efficiency, involves spraying water droplets into the turbine inlet air to reduce its temperature towards the corresponding wet-bulb temperature. Depending on the injected water amount and injection location, three kinds of fogging systems can be identified:
  • High pressure fogging (evaporative fogging) [1]: During the injection of water into the compressor inlet duct, water evaporation is completed before the air enters the compressor.
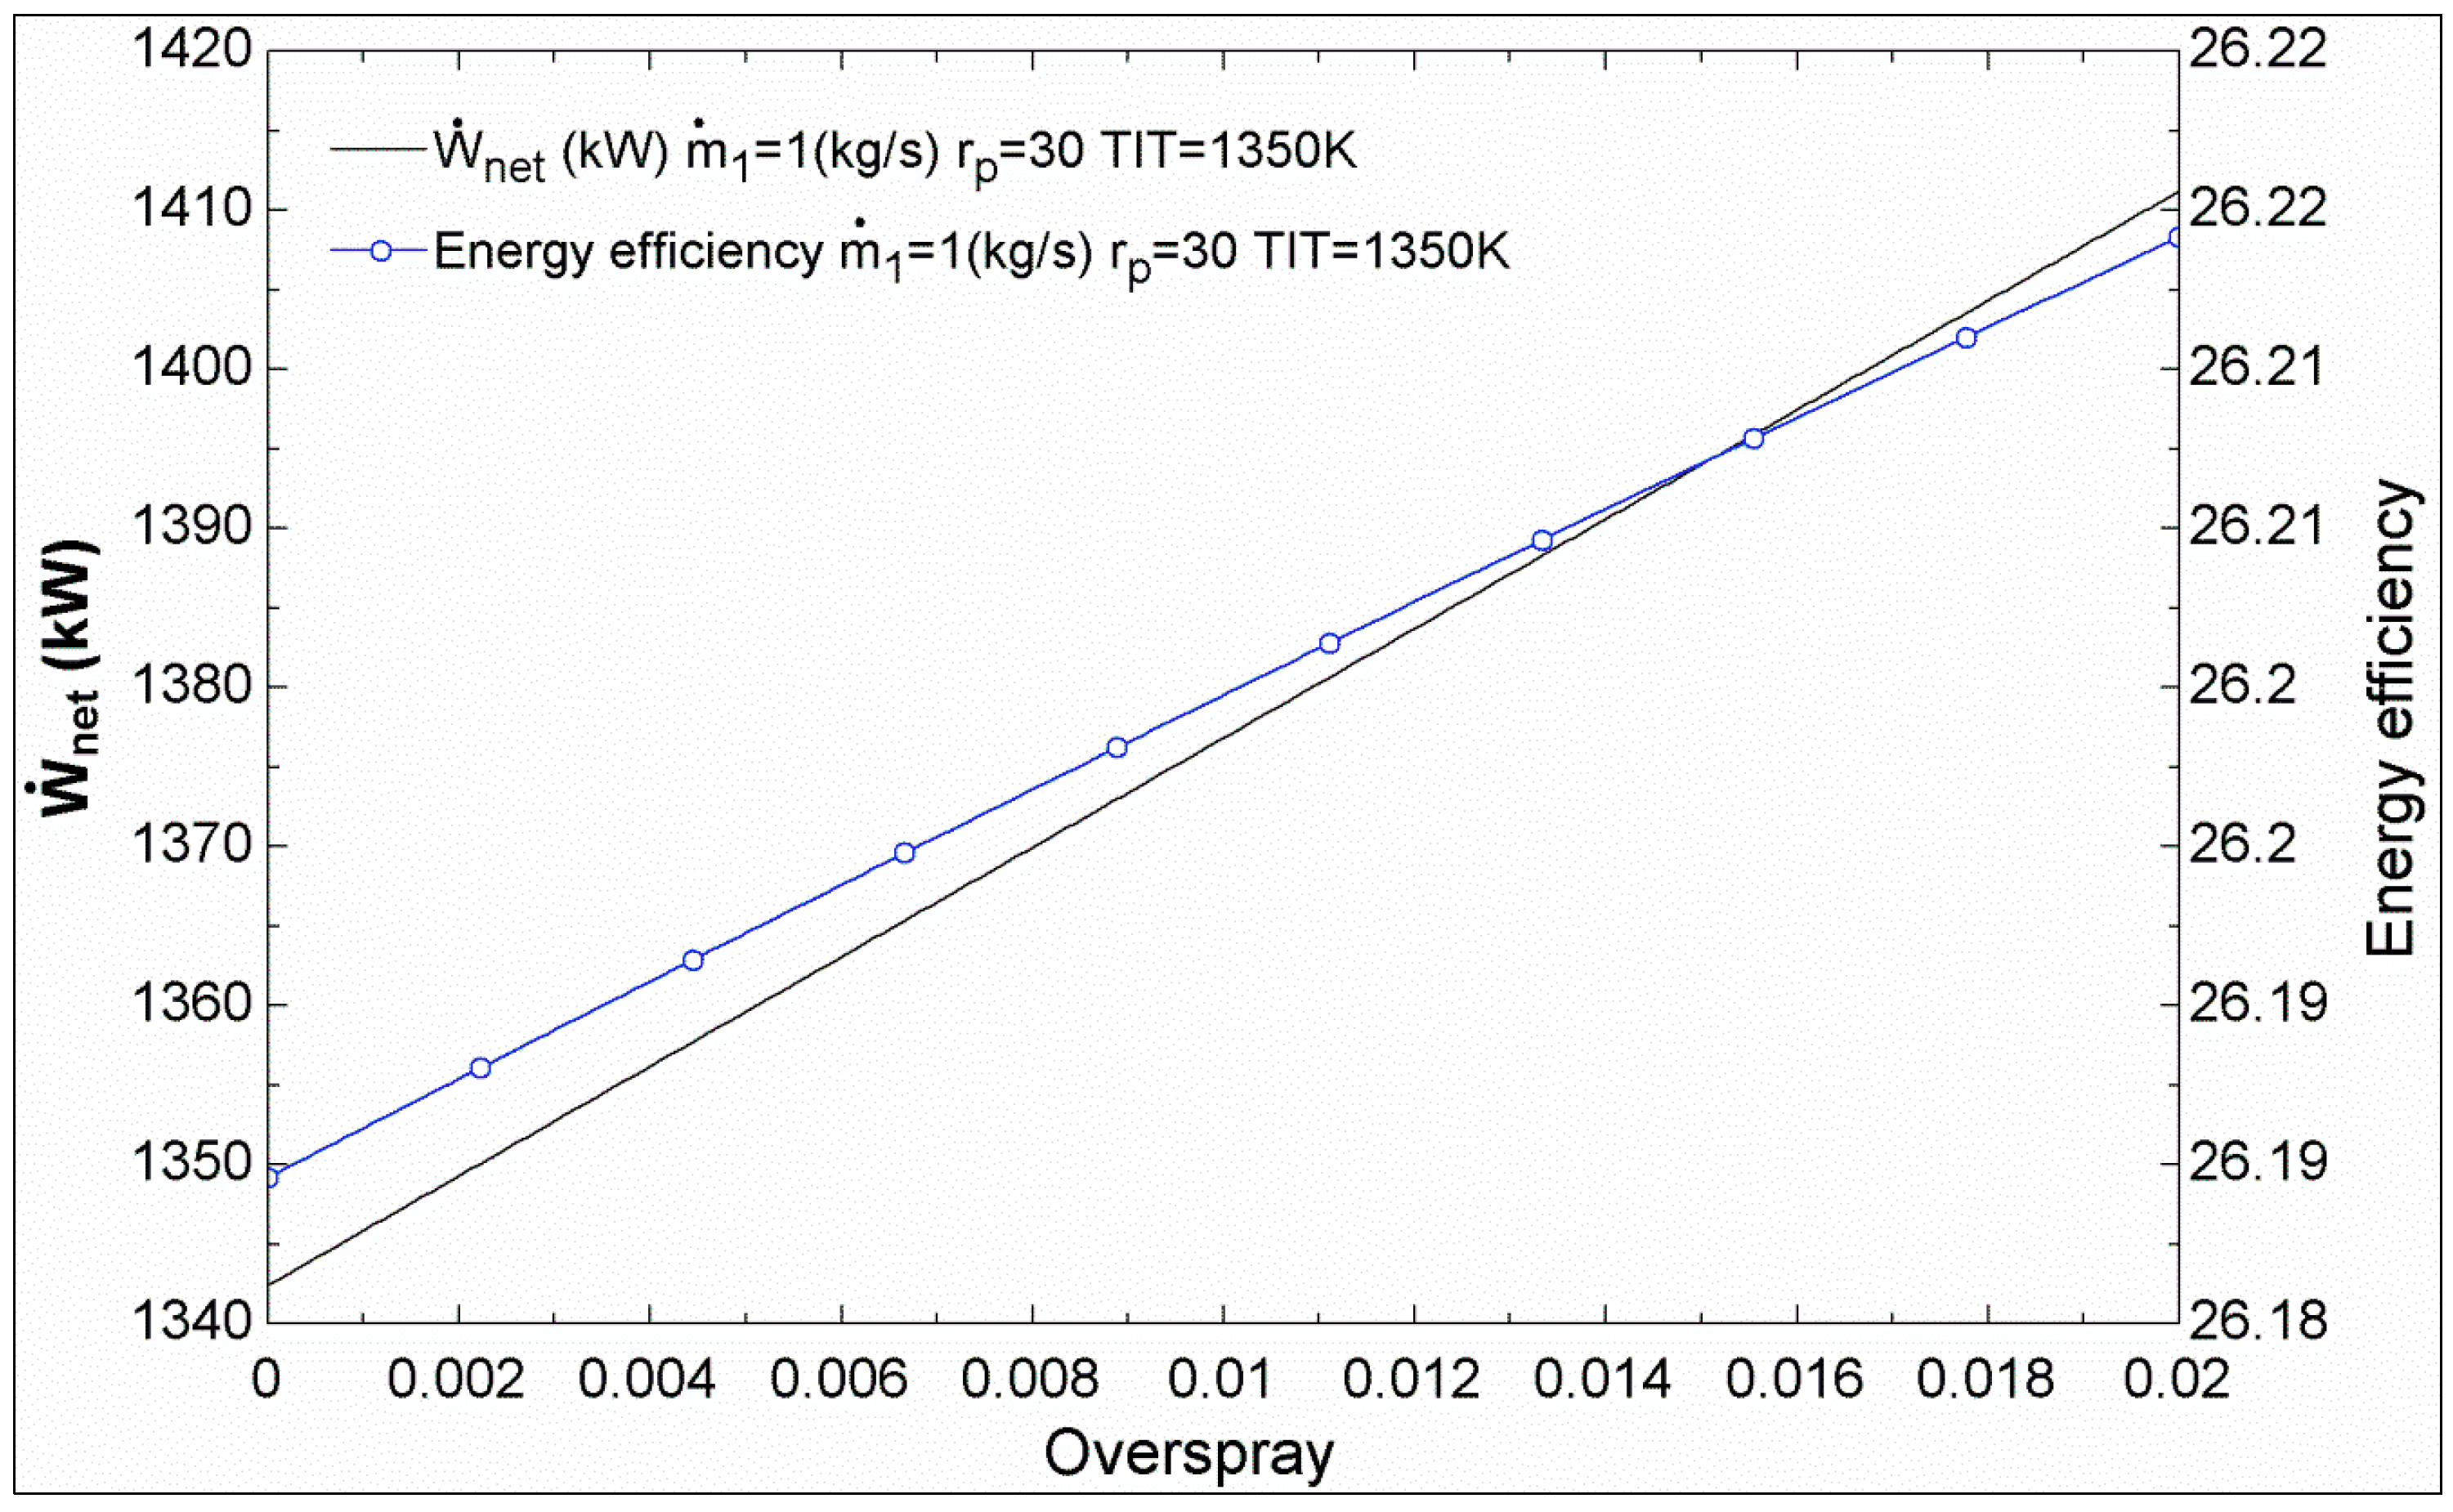
  • Overspray fogging (spraying more water into the air stream than can be evaporated,) [2,3,4]: The quantity of water injected into the inlet air exceeds greatly the amount required for air saturation. Hence, a percentage of the water (often ~2%) remains in a liquid phase (i.e., as overspray) and enters the compressor for evaporation there. This method includes a series of high pressure reciprocating pumps providing demineralized water to an array of fogging nozzles located after the air filter elements. The nozzles create a large number of micron size droplets which evaporate, cooling the inlet air to wet bulb conditions.
  • Fog intercooling (interstage injection) [5]: The water is injected through the compressor stator blades in order to provide traditional intercooling during compression.
The most advantageous among the available systems is difficult to determine and usually depends on ambient conditions (e.g., ambient air temperature and relative humidity) and design parameters (e.g., air flow rate to gas turbine, power output ratio and number of hours per day in which additional power is needed).
An energy analysis of fogging inlet cooling with overspray demonstrated that inlet air fogging increases the power input to the compressor, reaching the highest value when the inlet air is saturated with moisture [6]. The reason given for this result is that decreasing the inlet air temperature causes an increase in its density and mass flow rate.
Since gas turbines are constant volume machines, at a given shaft speed they move the same volume of air. However, the power output of a turbine depends on the flow of mass through it, which is why on hot days, when air is less dense, the power output declines. A 1 °C temperature rise of inlet air leads to a 1% decrease in power output, while increasing the heat rate of the turbine [7].
Steam injection, in which superheated steam is injected into the combustion chamber of a gas turbine, is a useful method for enhancing performance.
It is possible to utilize both techniques through the FSTIG (gas-turbine cycle with steam injection and simultaneous cooling) method. The use of fogging along with steam injection in a gas turbine reduces the inlet air temperature [8]. With this method, the amount of water vapor produced in the boiler is reduced because of the lower temperature of the exhaust gas exiting the turbine. The FSTIG method can modify the performance of cycles by coupling renewable and environmentally benign energy sources. Efforts continue to increase the utilization efficiency of many renewable energy sources [9].
Biomass (e.g., paper, agriculture residue, forestry residue, straw, wood waste, sawdust, paddy husk) can be used as a renewable energy source, and is relatively abundant, clean and carbon dioxide neutral. Biomass can be converted to biofuels via gasification and other methods. Biofuels are usually used for electricity and/or heat generation. Integrated electricity generation cycles that utilize gasification of solid and/or liquid biomass can be environmentally benign and cost effective [10,11,12]. Nonetheless, biomass fired power plants have some challenges (e.g., relatively low efficiencies), and methods have been proposed in recent years to integrate biomass gasification and natural gas fired gas turbines, to exploit the environmental benefits of the former and the thermal performance and efficiency benefits of the latter [13,14,15,16,17]. However, better understanding of such integrated systems is needed before they can be more widely applied, and that is the focus of this work. In the present paper, therefore, the biomass integrated fogging steam injected gas turbine (BIFSTIG) is assessed with energy and exergy analyses. Parametric studies are included to assess the effects of various design parameters on the thermodynamic performance of the cycle. The results are expected to have practical application, since the considered cycle is used for supplying the energy in villages and small towns, especially in tropical locations.

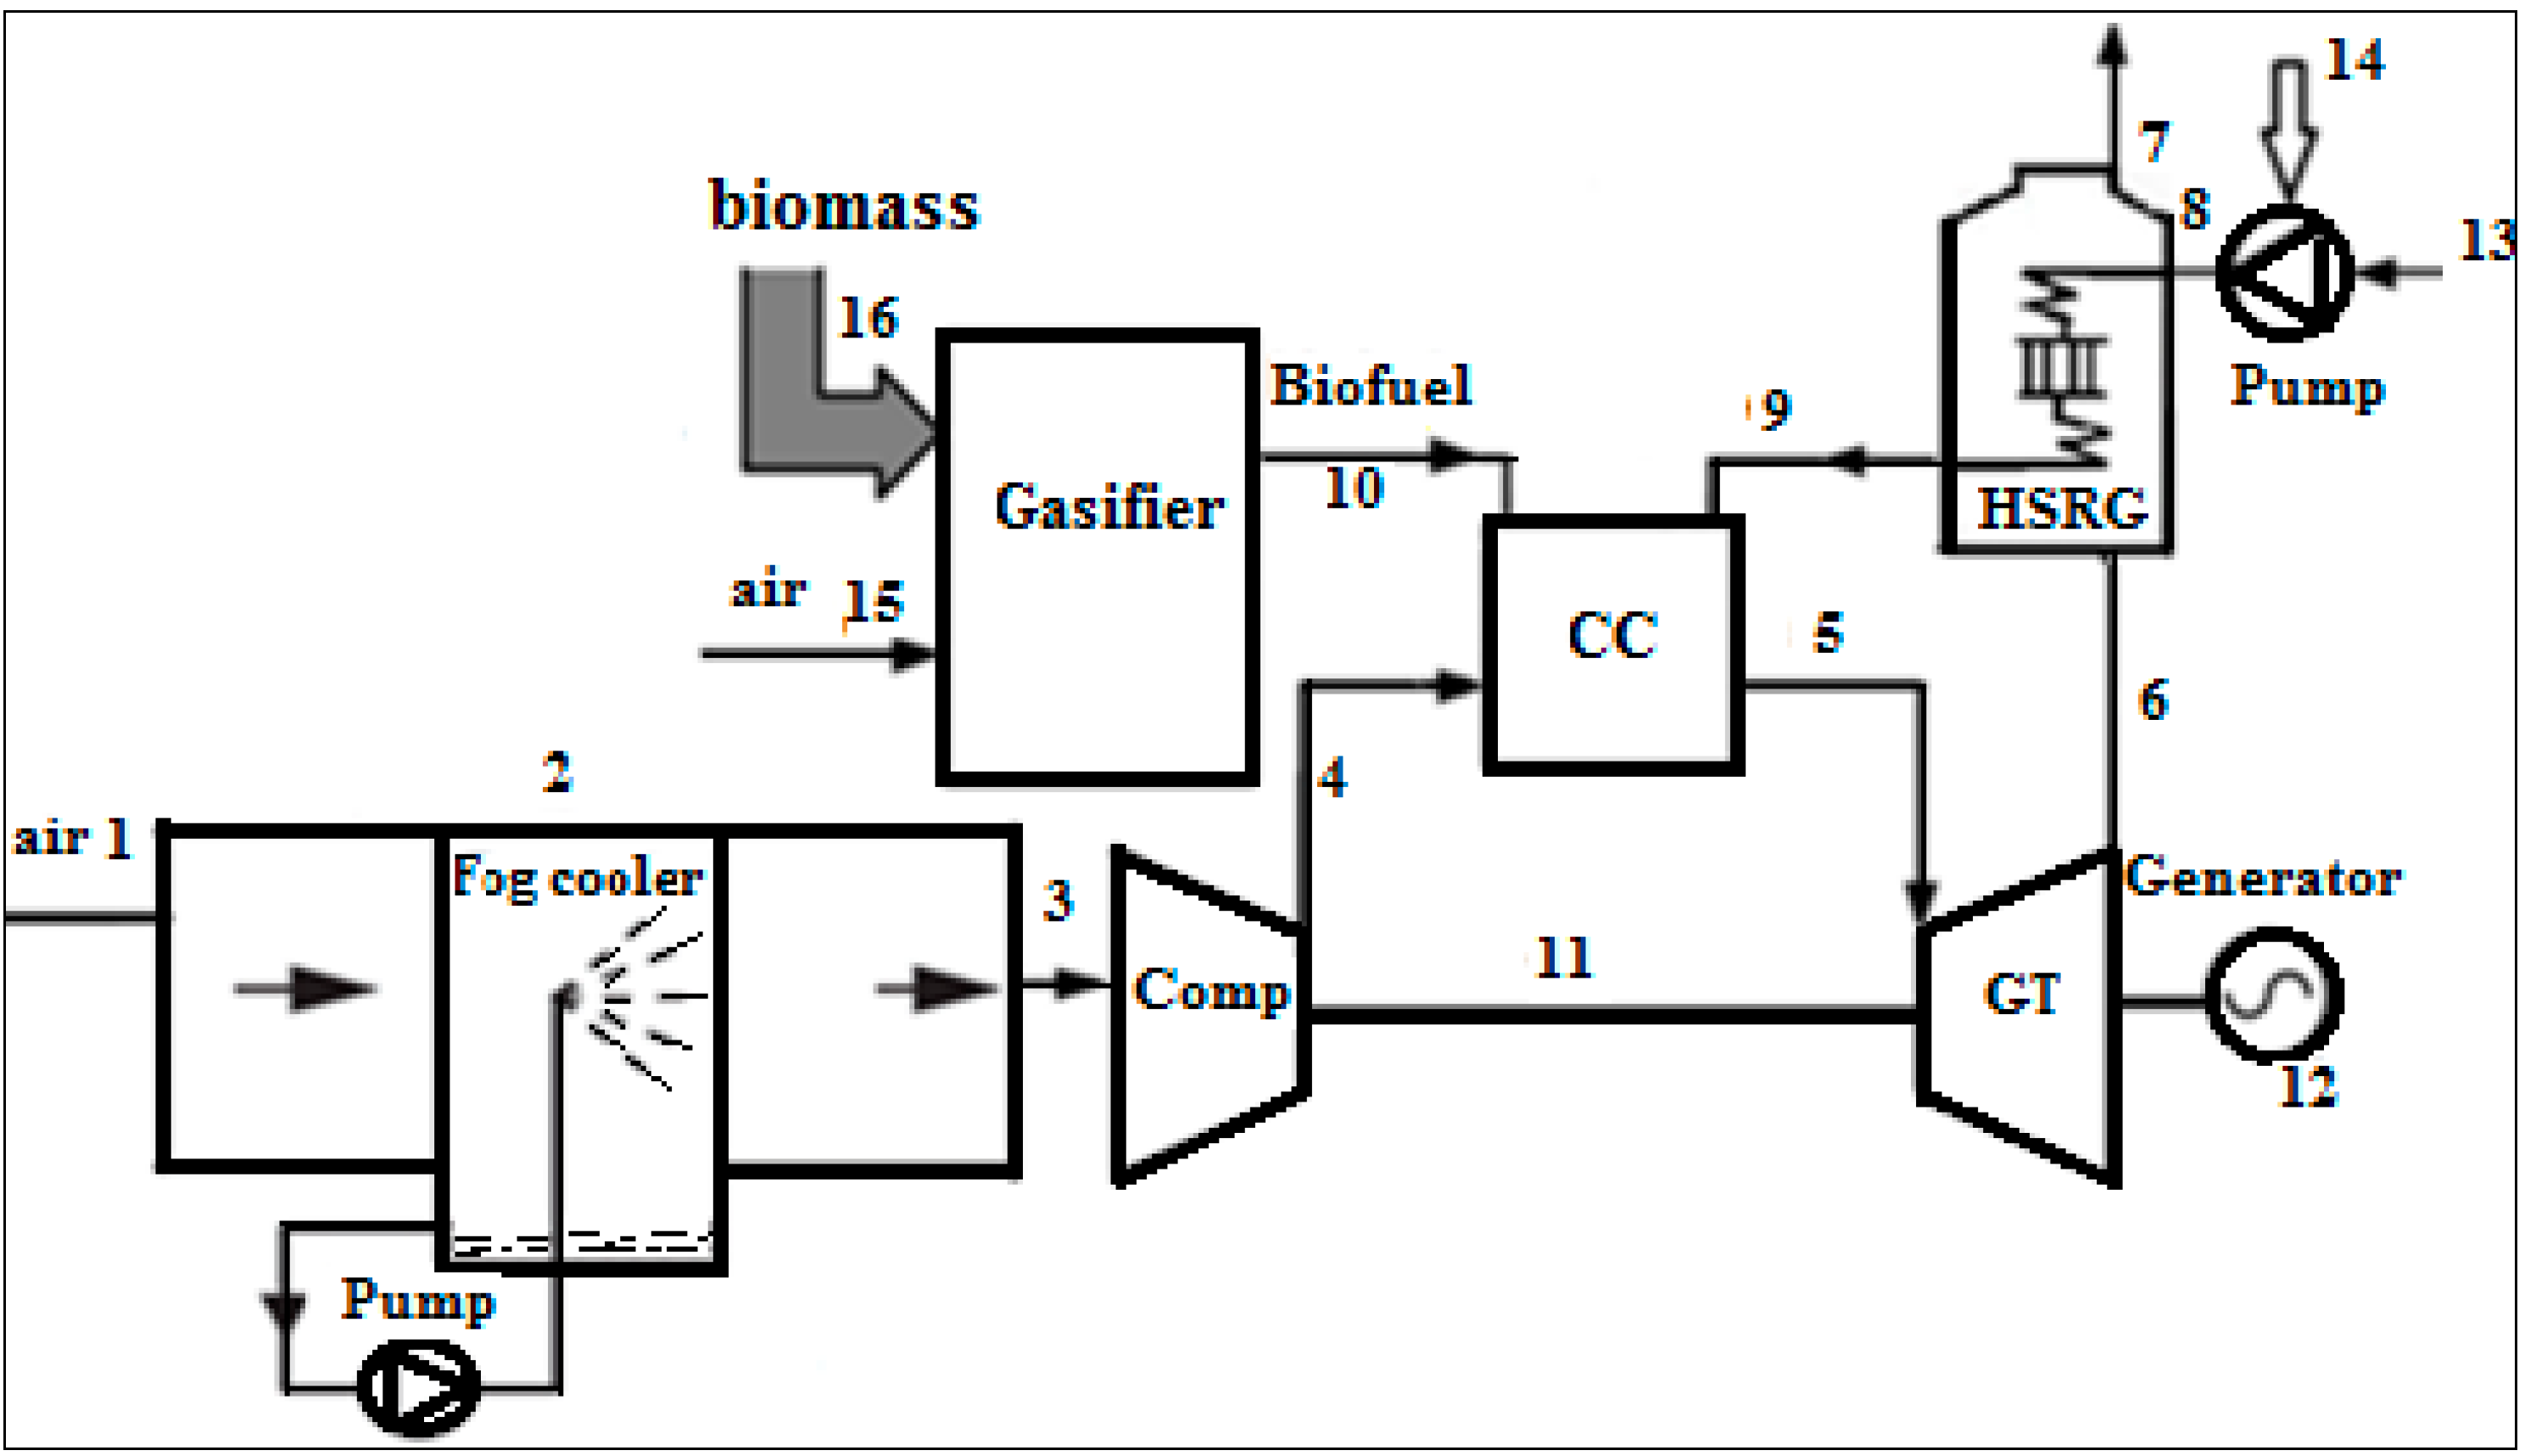
2. Plant Description and Modeling

2.1. BIFSTIG Plant

In the considered BIFSTIG plant (see Figure 1), inlet air at ambient conditions (given in Table 1) enters the fogging cooler. The latent heat of vaporization of water is exploited for cooling, since the water is evaporated in the air stream through adiabatic cooling. Hence, the cooling energy efficiency is close to 100%. Adiabatic saturation cooling is a process in which air is cooled from the dry bulb temperature to the wet bulb temperature. In this process, the latent heat of vaporization of the water is provided by sensible heat from the air as the water evaporates, reducing in the air stream temperature while increasing its relative humidity to 100%. Due to overspray (usually up to 2%), water particles often are present at the fog cooler exit. In this study, adiabatic mixing is assumed in the fogging cooler.
The compressor in the BIFSTIG cycle raises the pressure of the saturated air to the combustion chamber pressure. The biomass fuel (wood in the present case) is gasified, and the producer gas from the gasifier enters the combustion chamber. The hot combustion gases expand in the turbine, generating mechanical power, and then enter the heat recovery steam generator (HRSG). There, superheated vapor is produced and for injection into the combustion chamber.
Biomass can be advantageously utilized in this way because biomass-fired gas turbines alone usually cannot attain an adequately high turbine inlet temperature (TIT), while biomass and biofuels have limits regarding system reliability and fuel flexibility.
Figure 1. Gas turbine cycle with steam injection and inlet fogging cooler.
Sustainability 07 01292 g001
Table 1. Assumptions and data used in BIFSTIG analyses.
Device or ConditionAssumptions and Data
Ambient parameters
  • Inlet air is at atmospheric conditions, i.e., P1 = 101.325 kPa, T1 = 318 K and φamb = 60%
  • Air composition is 79% nitrogen and 21% oxygen, by vol.
Compressor, turbine, pump
  • Compressor and turbine polytropic efficiencies are 0.88 [18]
  • The pump isentropic efficiency is 0.8
Gasifier
  • The dry biomass (wood) has a gravimetric composition of C: 50%, H: 6% and O: 44%, and a calorific value (on a dry basis) of 449,568 kJ/kmol [19]
  • The biomass moisture content is 20% on a mass basis
  • The equivalence ratio for gasification is 0.4188
Heat recovery steam generator
  • The HRSG steam pressure is 80 bar
  • The HRSG end temperature difference is 50 K
  • The pinch point temperature difference in the boiler is 10 °C [20]
Combustion chamber
  • Complete combustion occurs in the combustion chamber
  • The combustion chamber is adiabatic and has a pressure drop of 1%

2.2. Assumptions and Data

The assumptions and data which used in the BIFSTIG analyses are listed in Table 1.
The overspray process consists of inlet fogging and wet compression. With inlet fogging, water is injected at approximately 1%–2% of the air mass flow rate.

2.3. Thermodynamic Modeling and Simulation

In modeling and simulating the cycle, mass, energy and exergy balances are written for the BIFSTIG cycle and its components. The exergy analysis considers “Exergy of fuel” and “Exergy of product” [21,22,23,24,25]. Before performing the analysis, it is helpful to define the terms used: m ˙ , E ˙ , E ˙ D , k denote respectively mass flow rate, exergy rate, exergy destruction (irreversibility) rate. The mass and energy balance equations for the all components are summarized by Table 2, but we describe the exergy equations below due to their significance.
Exergy rate balances for the fogging cooler, the compressor and the combustion chamber can be written as follows:
E ˙ 1 + E ˙ 2 E ˙ 3 E ˙ D , F C = 0
E ˙ 3 + E ˙ 11 E ˙ 4 E ˙ D , c o m p = 0
E ˙ 4 + E ˙ 10 + E ˙ 9 E ˙ 5 E ˙ D , c c = 0
where numerical subscripts denote locations identified in Figure 1.
The turbine outlet temperature (TOT) and compressor delivery temperature (CDT) are determined according to Table 2, using energy analysis and the specified inlet gases for the turbine and air for the compressor. To determine the steam injection to the combustion chamber, we define x as the ratio of injected steam from the HRSG to the combustion chamber per 20 kg inlet air mass), and utilize energy equations for the combustion chamber. Thus, the value of FA (ratio of fuel mass injected from combustion chamber to 20 kg inlet air mass) is obtained. Exergy rate balances for the turbine the heat recovery steam generator and gasifier can be written as:
E ˙ 5 E ˙ 6 E ˙ 11 E ˙ 12 E ˙ D , T u r b = 0
E ˙ 6 + E ˙ 8 E ˙ 7 E ˙ 9 E ˙ D , H R S G = 0
E ˙ 16 + E ˙ 15 E ˙ 10 E ˙ D , G = 0
Table 2. Mass and energy rate balance equations for BIFSTIG cycle components.
ComponentMass Rate BalanceEnergy Rate Balance
Fog cooler m ˙ W = m ˙ a .   O S , m ˙ 1 + m ˙ 2 = m ˙   a 3 + m ˙   W 3 h   a 3 + w   3 h   v 3 + O S × h   W 3 = h   a 1 + w   1 h   v 1 + ( w   3 w   1 + O S ) h   W 2
Compressor m ˙   a 3 + m ˙ W 3 = m ˙ 4 T 3 T 4 CP ¯ , a i r dT T = P 3 P 4 R ¯ η ?   c o m p dP P , W ˙ comp = m ˙ 3 ( h 4 h 3 )
Turbine m ˙   5 = m ˙   6 TOT T 5 C ¯ P , g dT T = P 6 P 5 η ?   t u r b R ¯ dP P , W ˙   turb = m ˙   5 ( h   5 h   6 )
Heat recovery steam generator m ˙ 8 + m ˙ 6 = m ˙ 9 + m ˙ 7 Q ˙ H R S G = m ˙ 8 × ( h 9 h 8 ) ( T 7 T 8 ) = 50   K Q ˙ H R S G = m ˙ s × ( h s h w , h r s g ) P r o d u c t s   n i   T 7 TOT   C ¯ P , g , i dT = n 8 [ h ¯ w ( T 9 , P 9 ) h ¯ w ( T 8 , P 8 ) ] η B x = n s × M H 2 O λ ( n + m 4 ) × 4.76 × ( 1 + w ¯ 3 ) × M air × η c c
Gasifier m ˙ 15 + m ˙ 16 = m ˙ 10 h ¯ f biomass o + n H 2 O × h ¯ f H 2 O o = n 1 ( h ¯ f H 2 o + Δ h ¯ H 2 ) + n 2 ( h ¯ f CO o + Δ h ¯ CO ) + n 3 ( h ¯ f CO 2 o + Δ h ¯ CO 2 ) + n 4 ( h ¯ f H 2 O o + Δ h ¯ H 2 O ) + n 5 ( h ¯ f CH 4 o + Δ h ¯ CH 4 ) + n 6 ( h ¯ f N 2 o + Δ h ¯ N 2 )
Combustion chamber m ˙ 4 + m ˙ 9 + m ˙ 10 = m ˙ 5 298.15 T f C ¯ P , C n H m   dT + λ ( n + m / 4 ) [ 298.15 T 4 C ¯ P , O 2   dT + 3.76   298.15 T 4 C ¯ P , N 2   dT + 4.76 ω ¯ 4   298.15 T 4 C ¯ P , H 2 O dT ] = n 298.15 T I T C ¯ P , CO 2 dT + [ λ ( n + m / 4 ) 4.76 ω ¯ 4 + m / 2 ] 298.15 T I T C ¯ P , H 2 O dT + 3.76 λ ( n + m / 4 )   298.15 T I T C ¯ P , N 2 dT + ( λ 1 ) ( n + m / 4 )   298.15 T I T C ¯ P , O 2 dT - L H V F A = M C H 4 λ ( n + m 4 ) × 4.76 × ( 1 + w ¯ 3 ) × M a i r × η c c
The energy and exergy efficiencies of the cycles and the exergy efficiencies of the components are calculated as follows:
η = W ˙ net,cycle m ˙ fuel LHV fuel
ε = W ˙ net,cycle E ˙ fuel
ε ,k = E ˙ P,k E ˙ F,k

2.4. Validation of Results Obtained for Cycle

The mathematical models developed here for the systems are based on thermodynamic formulations and implemented into the Engineering Equation Solver (EES) software [25] environment, which is useful for developing mathematical models of power plants and their thermodynamic evaluation.
The achieved results are validated in two ways. Initially, we compare the fogging results with results of others and then the biomass results are compared.
The fogging results obtained in this research are compared with experimental work by Sanaye and Tahani [6]. This comparison is shown in Part A of Table 3, where CIT, CDT, W ˙ net , TOT and Heat rate denote respectively compressor inlet temperature, compressor discharge temperature, net power production rate of the cycle, turbine outlet gas temperature and cycle heat rate. Next, the results obtained here for biomass gasification are compared with the experimental [26] and theoretical [27] work of others. The comparison is shown in Part B of Table 3. For both comparisons, a reasonable agreement is observed.
Table 3. Comparison of reported and computed results for fogging cooler and biomass gasification.
Part A: Fogging CoolerPart B: Biomass Gasification
Comparsion conditionsComparison of reported and computed results for selected conditions: TIT = 1122 °C, compressor pressure ratio = 11.84, inlet mass rate of turbine = 374.59 kg/s, overspray = 2%Comparsion conditionsComparison between model and experimental constituent breakdown (in %) for wood at 20% moisture content and a gasification temperature of 800 °C
ParameterReported in [6]Computed hereParameterComputed hereReported in [26]Reported in [27]
CIT (°C)30.0030.08Hydrogen18.0115.2321.06
CDT (°C)293286.9Carbon monoxide18.7723.0419.61
W ˙ net (MW)133136Methane0.681.580.64
TOT (°C)553577Carbon dioxide13.8416.4212.01
Heat rate (kJ/kWh)10,60910,653Nitrogen48.742.3146.68
Oxygen0.001.420.00

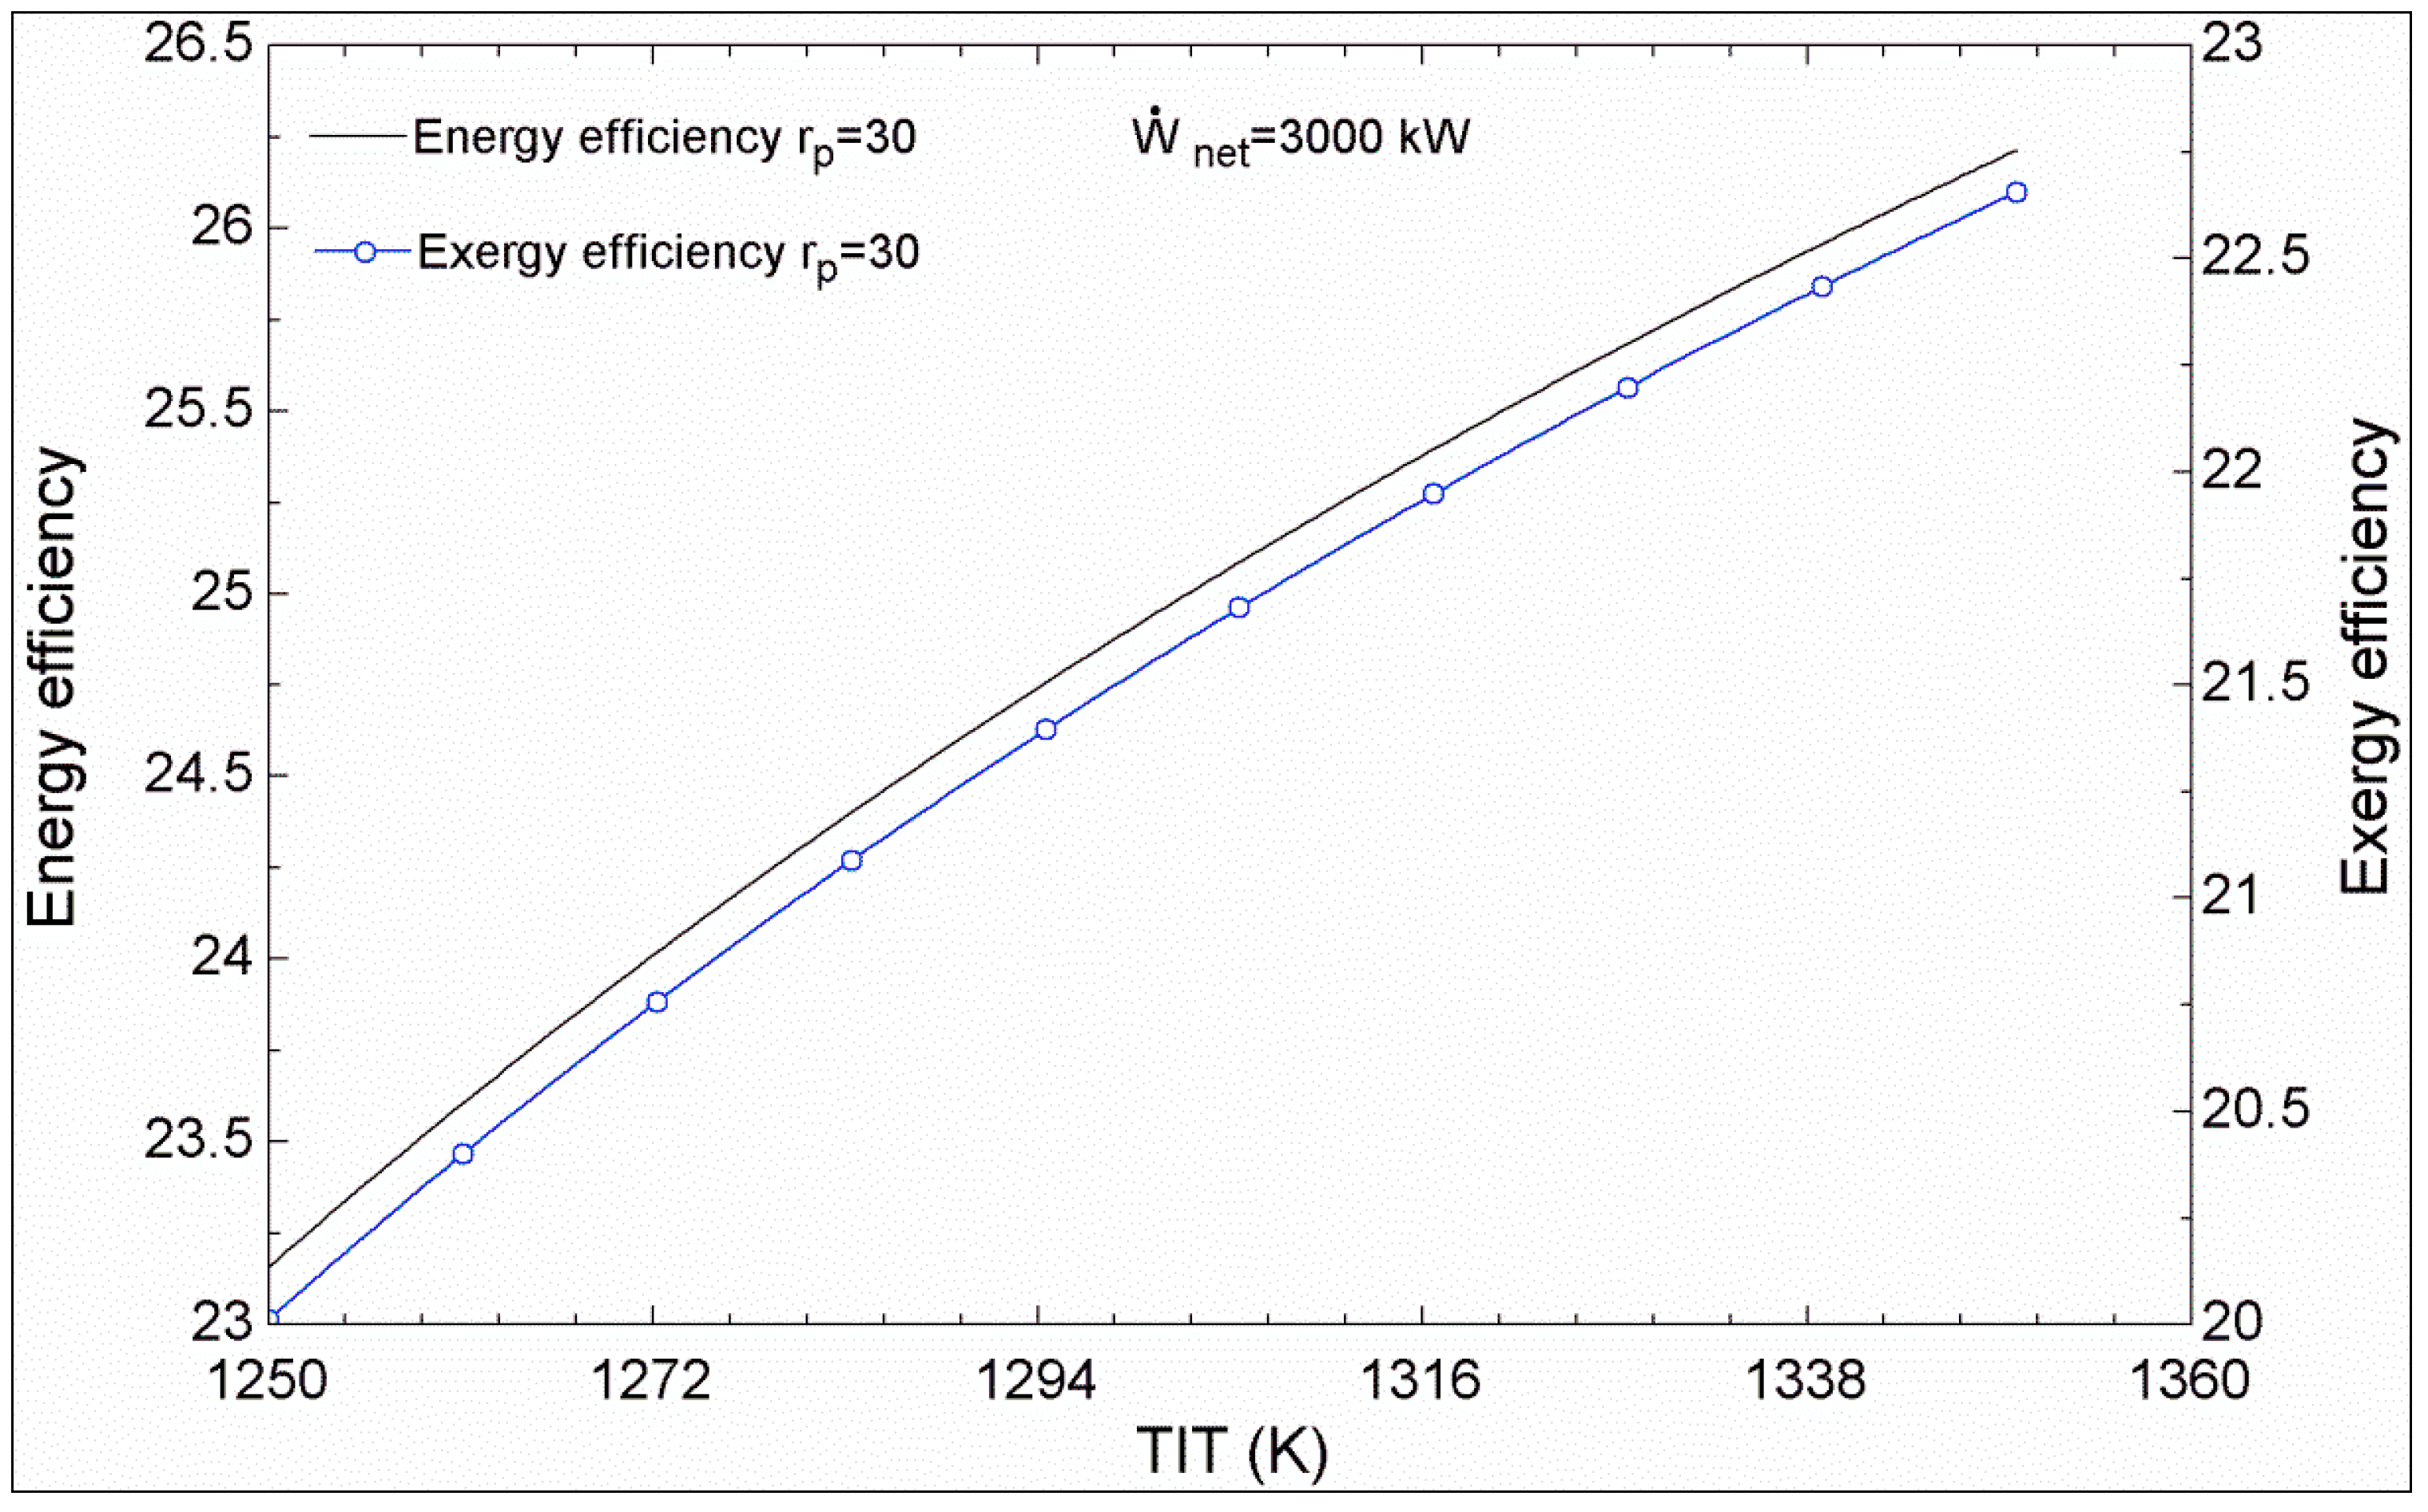
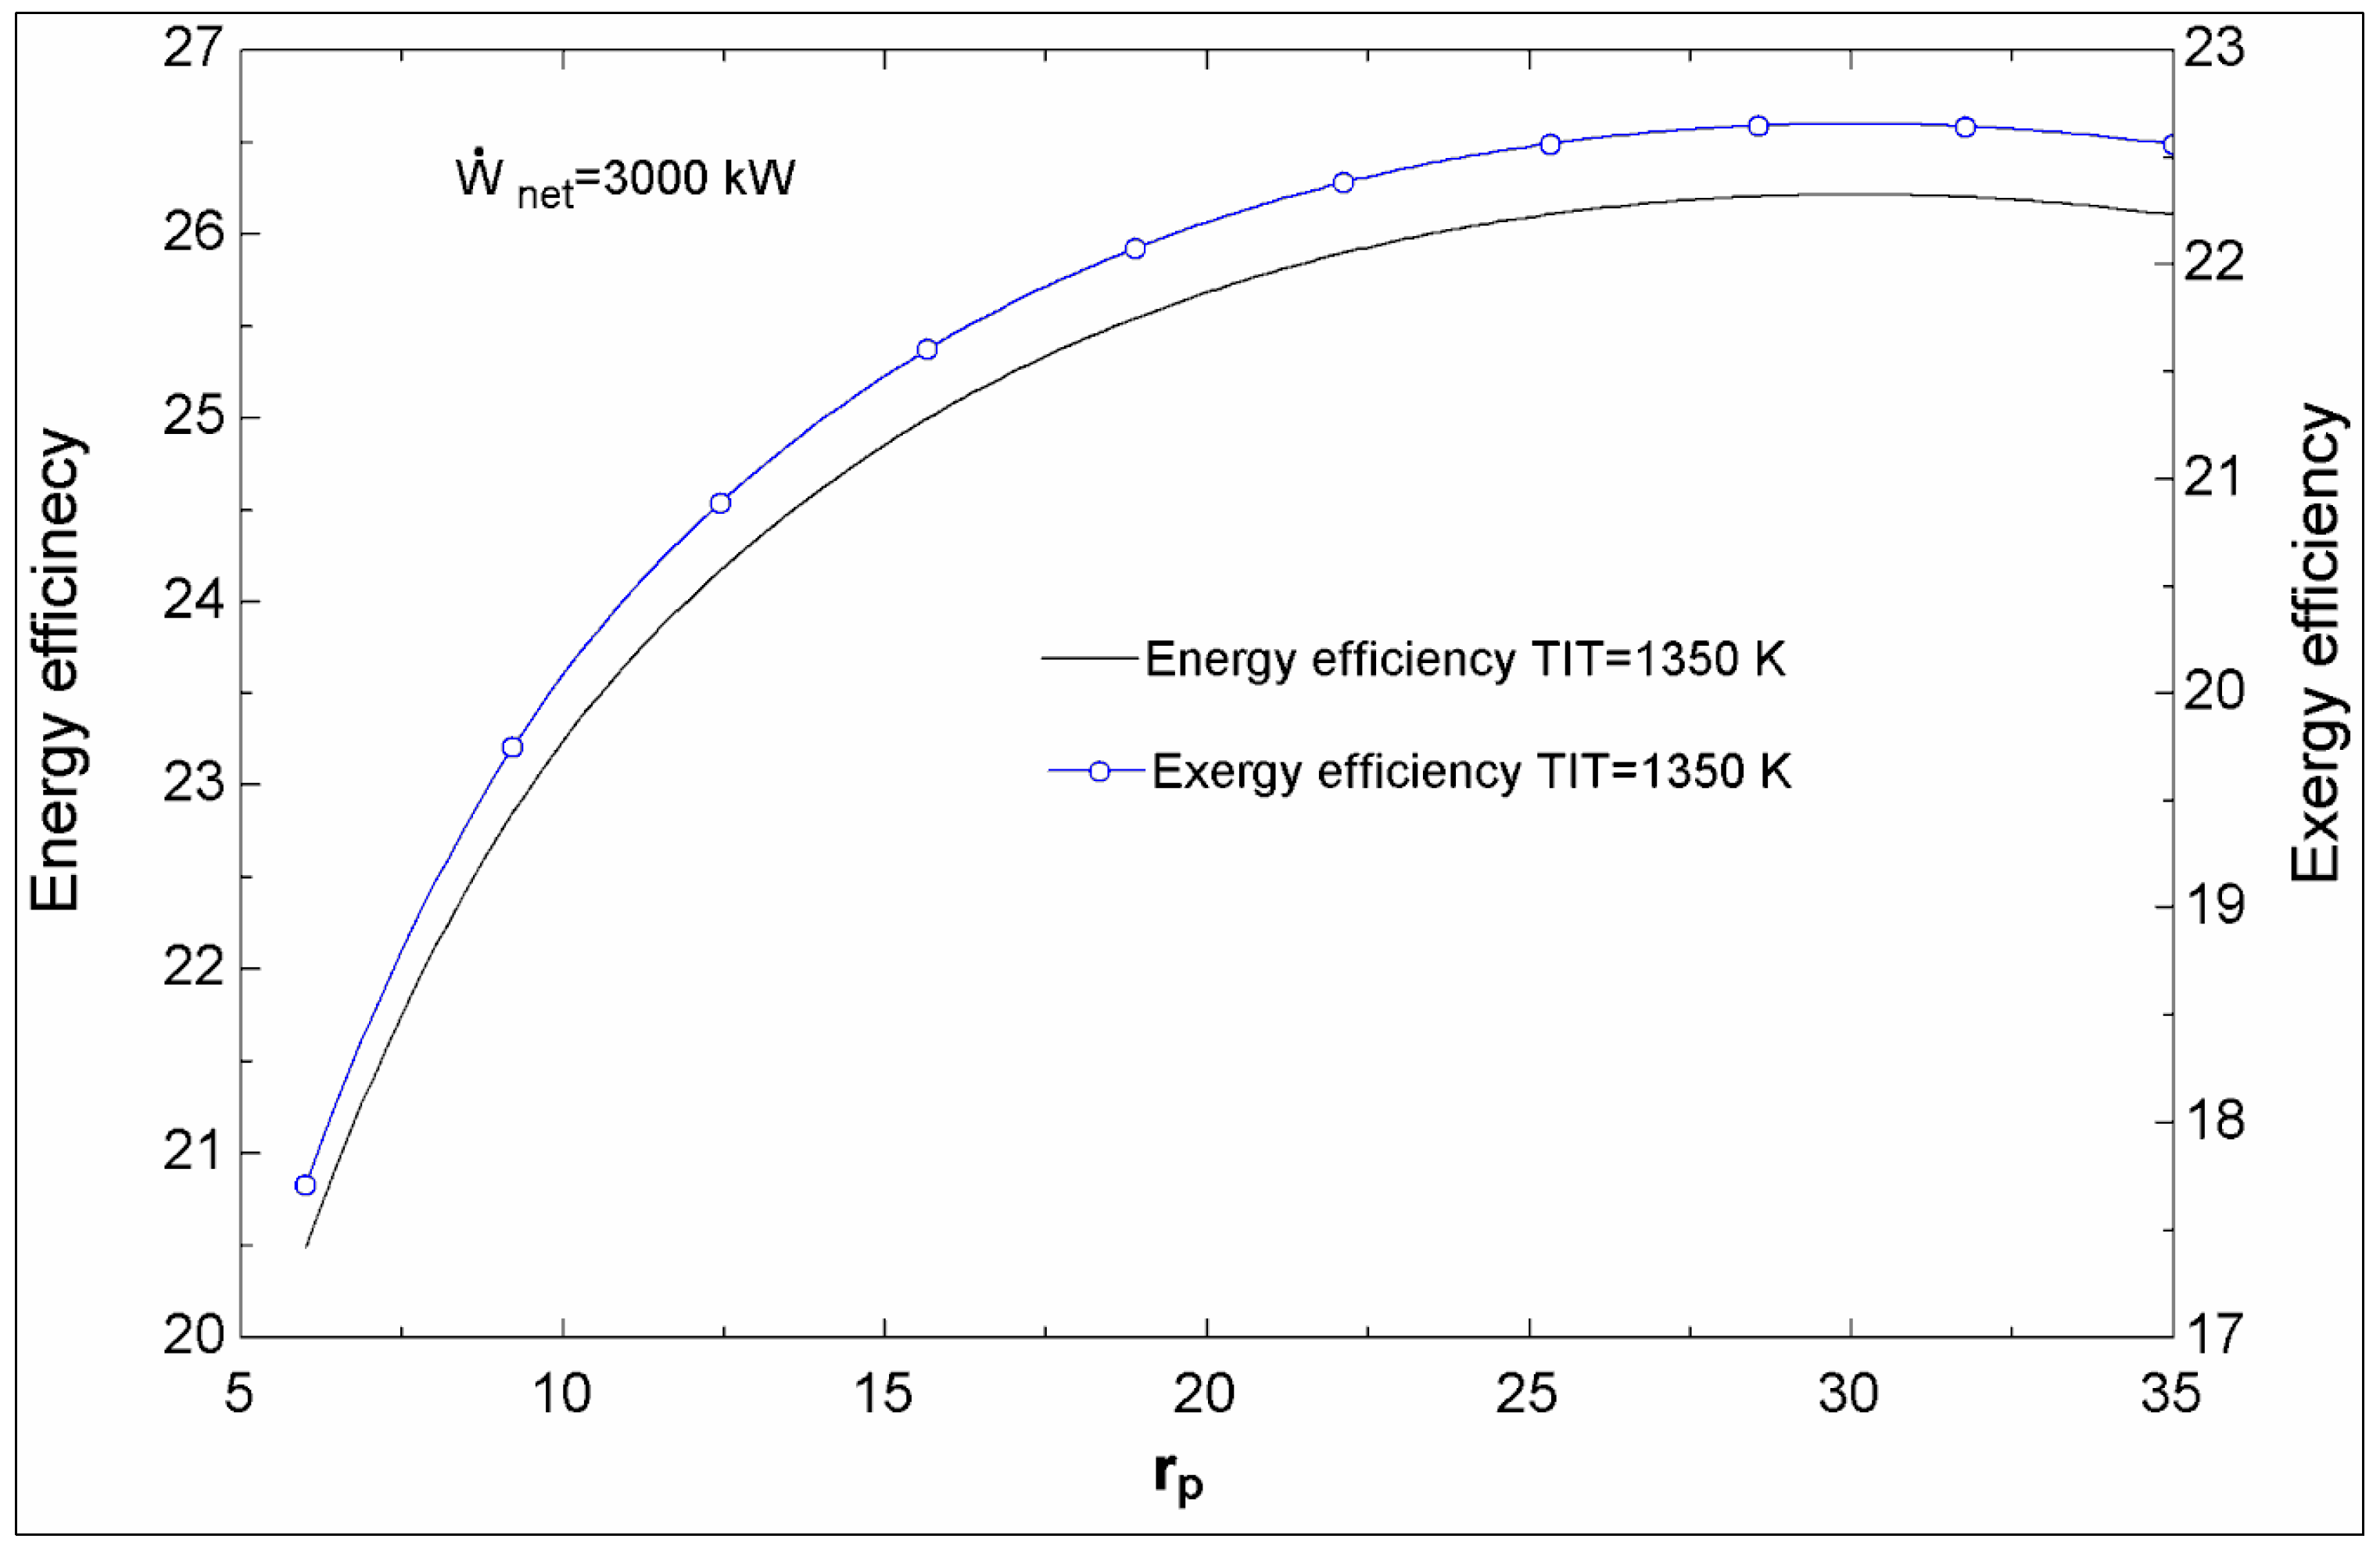
3. Results and Discussion

The variations with compressor pressure ratio of the biomass and air mass flow rates are shown in Figure 2a for the BIFSTIG plant. As pressure ratio increases, the air mass flow rate increases and the biomass mass flow rate decreases for low values of rp. At higher values of rp, the curves become flat and even rise. When rp increases, the compressor outlet temperature increases and, for a constant value of net power output for the power plant, more air can be heated to the desired TIT. Therefore, the air flow rate increases by raising rp. Also, this increase in rp and the consequent rise in compressor outlet temperature decrease the biofuel flow rate to the combustion chamber. However, above some value for rp the increase in air flow rate has the opposite effect and the biomass flow rate increases. This observation indicates that increasing the compressor pressure ratio increases the size of the power plant. High values of rp may, consequently, increase the power plant cost due to factors such as the need for thick component wall to withstand the high pressure ratio and the increased cost associated with the air mass flow rate for larger power plants. However, a comprehensive thermoeconomic analysis is needed to determine the actual costs and trends for various cases.
The variations with gas turbine inlet temperature of biomass and air mass flow rates are shown in Figure 2b for the BIFSTIG plant. As TIT increases, the biomass and air mass flow rates decrease, indicating that increasing TIT decreases the size of the power plant. Increasing TIT for a constant rp (i.e., a constant compressor outlet temperature) and a constant power plant net power output causes less air to be heated to the desired TIT and decreasing the air flow rate causes less biomass to be burned, although TIT is increased. However, as TIT increases, the cost of the gas turbine increases. These differing trends make it difficult to ascertain trends with turbine inlet temperature regarding power plant cost, and likely require comprehensive case-dependent thermodynamic and thermoeconomic analyses.
Figure 2. Variations of biomass and air mass flow rates with (a) rp and (b) turbine inlet temperature (TIT) for the BIFSTIG plant.
Sustainability 07 01292 g002
The variations of energy and exergy efficiencies with rp are shown in Figure 3 for the BIFSTIG plant. Increasing the compressor pressure ratio raises both efficiencies. The rate of increase with rp is sharper at lower values of rp, while at higher values of pressure ratio the increase in energy and exergy efficiencies with rp is approaches zero and even decreases when rp > 30. Regarding Figure 2a, increasing rp causes the biomass flow rate to decrease to a point and then rise slightly. Therefore, based on Equations (7) and (8), the energy and exergy efficiencies increase and then decrease slightly with the pressure ratio.
Figure 3. Variation of energy and exergy efficiencies with rp, for the BIFSTIG plant.
Sustainability 07 01292 g003
The variations of energy and exergy efficiencies with TIT are shown in Figure 4 for the BIFSTIG plant. Increasing TIT raises both efficiencies, at roughly the same rate. Regarding Figure 2b, increasing TIT leads to a decrease in the biomass flow rate. Therefore, based on Equations (7) and (8), the energy and exergy efficiencies increase with the turbine inlet temperature.
Figure 4. Variation of energy and exergy efficiencies with TIT, for the BIFSTIG plant.
Sustainability 07 01292 g004
The variations of net power output and energy efficiency with overspray are shown in Figure 5 for the BIFSTIG plant. Increasing the overspray raises the net power output and the energy efficiency, but the effect is more pronounced for the net power output. The energy efficiency is only slightly influenced by the level of overspray. Increasing the overspray decreases the compressor consumption power so that the net power increases. Overspray on the other hand decreases the compressor outlet temperature; this requires additional fuel for the combustion chamber. These two opposite effects have different influences on the energy efficiency. For this case, the decrease in compressor power is more significant and the energy efficiency increases, although this increase is very minor.
Figure 5. Variation of net power and energy efficiency with overspray, for the BIFSTIG plant.
Sustainability 07 01292 g005
Component exergy efficiencies are shown in Figure 6 for the BIFSTIG plant, for the maximum energy efficiency condition, i.e., for constant value of TIT and net power output. The gas turbine exhibits the highest exergy efficiency and the combustor the lowest. The large exergy destruction in the combustor is attributable to the fact that irreversible chemical reactions occur there along with heat transfers across large temperature differences. The large exergy destruction in the fog cooler is attributable to mixing of streams at different temperatures, while the low exergy efficiency of the gasifier is mainly due to chemical reactions in this component.
Figure 6. Exergy efficiencies of components of the BIFSTIG plant, for the maximum energy efficiency condition (TIT = 1350 K, W ˙ net = 3000 kW).
Sustainability 07 01292 g006
The variations of combustor exergy efficiency and exergy destruction rate with rp are shown in Figure 7 for BIFSTIG plant and, for comparative purposes, a FSTIG plant, which is the BIFSTIG configuration except with natural gas as the fuel. This alternative is included to compare the combustion chamber exergy efficiency and exergy destruction rate for these two conditions. Increasing the pressure ratio raises the combustor exergy efficiency and lowers the exergy destruction rate for both cycles. However, the decrease in exergy destruction rate with increasing rp is sharper for the BIFSTIG than the FSTIG plant. In fact, for the latter case, the exergy destruction rate decreases with pressure ratio to a peak and then increases at higher values of rp. When biomass is the fuel, the number of reactants in the combustion chamber increases and this is the main reason for high exergy destruction rate for the combustion chamber in BIFSTIG cycle. Increasing rp raises the temperature of the inlet air to the combustion chamber so the temperature difference between reactant air and products in the combustion chamber decreases, raising the exergy efficiency.
Figure 7. Variation of combustion chamber (CC) exergy efficiency and exergy destruction rate with rp, for the BIFSTIG and FSTIG plants.
Sustainability 07 01292 g007
The variations of combustor exergy efficiency and exergy destruction rate with rp are shown in Figure 7 for the BIFSTIG and FSTIG plants. An interesting result is shown in Figure 8, in that increasing TIT raises the combustor exergy efficiency and decreases exergy destruction rate, for both cycles. When TIT is high, the combustion process converges to stociometric combustion, which has a lower exergy destruction. The combustor exergy efficiency is observed to be higher for the FSTIG plant than the BIFSTIG plant. The lower exergy efficiency for the combustion chamber in the BIFSTIG plant relative to the one in the FSTIG plant means a disadvantage for exploiting biomass in this cycle.
Figure 8. Variation of combustion chamber (CC) exergy efficiency and exergy destruction rate with TIT, for the BIFSTIG and FSTIG plants.
Sustainability 07 01292 g008
Figure 9. Variation of energy efficiency with rp, for various plants.
Sustainability 07 01292 g009
In order to analyze the BIFSTIG plant and its simplified configurations including the FSTIG plant, the variations of energy efficiency with rp are shown in Figure 9 for various plants: BIFSTIG (biomass integrated fog cooling steam injection gas turbine), FSTIG (fog cooling steam injection gas turbine with firing of natural gas), BISTIG (biomass integrated gas turbine with steam injection), BIFGT (biomass integrated gas turbine with fog cooling) and BISGT (biomass integrated simple gas turbine). For the FSTIG plant, increasing rp raises the energy efficiency to a peak, beyond which the energy efficiency decreases. For the BIFSTIG, BISGT, BIFGT and BISTIG plants, however, increasing the pressure ratio has a notably different influence on the energy efficiency. That is, the efficiency increases sharply with rp to a value of about 30 and then decreases slightly as rp increases further. The higher energy efficiency of the FSTIG is due to the firing of natural gas, which has a higher heating value. The BISTIG and BIFSTIG cycles have similar energy efficiencies, both higher than for the BIFGT and BISGT cycles, showing that the effect of fogging cooling on energy efficiency is less pronounced than the effect of steam injection. Furthermore, the BIFSTIG and BIFGT plants have higher energy efficiencies because of fogging cooling.

4. Conclusions

During hot and dry summer periods, when power demand often peaks, compressor inlet cooling is an effective method for offsetting the typical decline in gas turbine performance, while steam injection to the combustion chamber, using steam raised from the turbine exhaust gases in a heat recovery steam generator, is an effective use for the hot gas turbine exit gases. Biomass gasification can be efficiently integrated with a gas turbine cycle for cleaner electricity generation. The biomass integrated fog cooling and steam injection plant gas turbine cycle proposed and analyzed here with energy and exergy methods has significant potential and understanding of its behavior has been improved via the present results. That is, increasing the compressor pressure ratio rp and gas turbine inlet temperature TIT increases the energy and exergy efficiencies. Also, increasing rp and TIT decreases the biomass flow rate, while the air mass flow rate increases with increasing rp and decreases with increasing TIT. Overspray raises the net power output and the energy efficiency, with the influence on the former being more significant. Moreover, increasing the rp and TIT raises the combustor exergy efficiency for the BIFSTIG plant, while increasing the pressure ratio raises the energy efficiency. However, there is an optimum point in terms of a specific pressure value in the natural gas fired plant (FSTIG). For the maximum energy efficiency condition of the BIFSTIG plant, the component exergy efficiency is highest for the turbine and the lowest for the combustor. The BIFSTIG combustor exergy efficiency is lower than for a similar plant fired with natural gas.

Author Contributions

Saeed Soltani, Hassan Athari and Marc A. Rosen have done the technical, analysis and writing parts. Seyed Mohammad Seyed Mahmoudi and Tatiana Morosuk had contribution in the technical and analysis parts.

Nomenclature

BIFSTIG
Biomass integrated fog cooling steam injection gas turbine
BISTIG
Biomass integrated gas turbine with steam injection
BIFGT
Biomass integrated gas turbine with fog cooling
BISGT
Biomass integrated simple gas turbine
CIT
Compressor inlet temperature (°C)
CC
Combustion chamber
CDT
Compressor discharge temperature (°C)
E ˙
Exergy rate (kW)
E ˙ D
Exergy destruction rate (kW)
FA
Ratio of fuel mass to inlet air mass
FSTIG
Fog cooling steam injection gas turbine with firing of natural gas
ha
Specific enthalpy of dry air (kJ/kg)
hv
Specific enthalpies of vapor (kJ/kg)
hf
Specific enthalpy of water injected into air (kJ/kg)
HRSG
Heat recovery steam generator
LHV
Lower heating value (kJ/kg K)
m ˙ a
Mass flow rate of dry air (kg/s)
m ˙ f
Mass flow rate of the sprayed water in fogging cooler (kg/s)
m ˙ fuel
Mass consumption rate of fuel (kg/s)
m ˙ i?
Mass flow rate of steam at location i (kg/s)
m ˙ s
Mass flow rate of steam injected into combustion chamber (kg/s)
m ˙ w
Mass flow rate of overspray in fogging cooler (kg/s)
m
Number of carbon atoms in hydrocarbon fuel (CnHm)
n
Number of hydrogen atoms in hydrocarbon fuel (CnHm)
ns
Molar quantity of steam (mole)
OS
Overspray (spraying of more water into air stream than can be evaporated)
rp
Compressor pressure ratio (-)
TIT
Turbine inlet temperature (K)
TOT
Turbine outlet temperature (K)
W
Specific humidity (-)
w ¯ i
Molar specific humidity per 1 molar of dry air at point i
W ˙ net
Net power in the cycle (kW)
W ˙ turb
Outlet power of turbine (kW)
X
Ratio of injected steam from HRSG to 20 kg inlet air mass

Greek Letters

η
Energy efficiency
ε
Exergy efficiency
ηcc
Combustion chamber efficiency
λ
Excess air fraction

Subscripts

Comp
Compressor
CC
Combustion chamber
G
Gasifier
F
Fuel
FC
Fog cooler
HRSG
Heat recovery steam generator
i
State point
P
Product
S
Steam
Turb
Turbine
W
Water

Conflicts of Interest

The authors declare no conflict of interest.

References

  1. Bianchi, M.; Melino, F.; Peretto, A.; Bhargava, R. Parametric analysis of combined cycles equipped with inlet fogging. J. Eng. Gas Turbines Power 2006, 128, 326–335. [Google Scholar] [CrossRef]
  2. Bettocchi, R.; Morini, M.; Pinelli, M.; Spina, P.R.; Venturini, M.; Torsello, G. Setup of an experimental facility for the investigation of wet compression on a multistage compressor. J. Eng. Gas Turbines Power 2011, 133, 102001:1–102001:8. [Google Scholar] [CrossRef]
  3. Ehyaei, M.A.; Mozafari, A.; Alibiglou, M.H. Exergy economic and environmental (3E) analysis of inlet fogging for gas turbine power plant. Energy 2011, 36, 6851–6861. [Google Scholar]
  4. Mahto, D.; Pal, S. Thermodynamics and thermo-economic analysis of simple combined cycle with inlet fogging. Appl. Therm. Eng. 2013, 51, 413–424. [Google Scholar] [CrossRef]
  5. Bagnoli, M.; Bianchi, M.; Melino, F.; Peretto, A.; Spina, P.R.; Bhargava, R.; Ingistov, S. A Parametric Study of Interstage Injection on GE Frame 7EA Gas Turbine. In Proceedings of the ASME Turbo Expo 2004, Vienna, Austria, 14–17 June 2004. Paper No. GT-2004-53042.
  6. Sanaye, S.; Tahani, M. Analysis of gas turbine operating parameters with inlet fogging and wet compression processes. Appl. Therm. Eng. 2010, 30, 234–244. [Google Scholar] [CrossRef]
  7. Kim, H.; Ko, H.; Perez-Blanco, H. Exergy analysis of gas-turbine systems with high fogging compression. Int. J. Exergy 2011, 8, 16–32. [Google Scholar] [CrossRef]
  8. Kim, H.; Perez-Blanco, H. Potential of regenerative gas-turbine systems with high fogging compression. Appl. Energy 2007, 84, 16–28. [Google Scholar] [CrossRef]
  9. Soltani, S.; Mahmoudi, S.M.S.; Yari, M.; Morosuk, T.; Rosen, M.A.; Zare, V. A comparative exergoeconomic analysis of two biomass and co-firing combined power plants. Energy Convers. Manag. 2013, 76, 83–91. [Google Scholar] [CrossRef]
  10. Park, S.R.; Pandey, A.K.; Tyagi, V.V.; Tyagi, S.K. Energy and exergy analysis of typical renewable energy systems. Renew. Sustain. Energy Rev. 2014, 30, 105–123. [Google Scholar] [CrossRef]
  11. Consonni, S.; Larson, E.D. Biomass-gasifier/aeroderivative gas turbine combined cycles. Part A—Technologies and performance modeling. J. Eng. Gas Turbines Power 1996, 118, 507–515. [Google Scholar] [CrossRef]
  12. Faaij, A.; van Ree, R.; Waldheim, L.; Olsson, E.; Oudhuis, A.; van Wijk, A.; Daey-Ouwens, C.; Turkenburg, W. Gasification of biomass wastes and residues for electricity production. Biomass Bioenergy 1997, 12, 387–407. [Google Scholar] [CrossRef]
  13. Heidenreich, S.; Foscolo, P.U. New concepts in biomass gasification. Prog. Energy Combust. Sci. 2014. [Google Scholar] [CrossRef]
  14. Rodrigues, M.; Andre Faaij, P.C.; Walter, A. Techno-economic analysis of co-fired biomass integrated gasification/combined cycle systems with inclusion of economies of scale. Energy 2003, 28, 1229–1258. [Google Scholar] [CrossRef]
  15. Tsatsaronis, G.; Pisa, J. Exergoeconomic evaluation and optimization of energy system: Application to the CGAM problem. Energy 1994, 9, 287–321. [Google Scholar] [CrossRef]
  16. Klimantos, P.; Koukouzas, N.; Katsiadakis, A.; Kakaras, E. Air-blown biomass gasification combined cycles (BGCC): System analysis and economic assessment. Energy 2009, 34, 708–714. [Google Scholar] [CrossRef]
  17. Soltani, S.; Yari, M.; Mahmoudi, S.M.S.; Morosuk, T.; Rosen, M.A. Advanced exergy analysis applied to an externally-fired combined-cycle power plant integrated with a biomass gasification unit. Energy 2013, 59, 775–780. [Google Scholar] [CrossRef]
  18. Rahman Khan, J.; Wang, T. Fog and overspray cooling for gas turbine systems with low calorific value fuels. In Proceedings of the GT2006ASME Turbo Expo 2006: Power for Land, Sea and Air, Barcelona, Spain, 8–11 May 2006. Paper No. GT 2006-90396.
  19. Robert, H.P.; Don, W.G. Perry’s Chemical Engineers Handbook, 6th ed.; McGraw Hill: New York, NY, USA, 1984. [Google Scholar]
  20. Soltani, S.; Mahmoudi, S.M.S.; Yari, M.; Rosen, M.A. Thermodynamic analyses of an externally fired gas turbine combined cycle integrated with a biomass gasification plant. Energy Convers. Manag. 2013, 70, 107–115. [Google Scholar] [CrossRef]
  21. Moran, M.J.; Shapiro, H.N.; Boettner, D.D.; Bailey, M.B. Fundamentals of Engineering Thermodynamics, 7th ed.; Wiley: New York, NY, USA, 2011. [Google Scholar]
  22. Dincer, I.; Rosen, M.A. Exergy: Energy, Environment and Sustainable Development, 2nd ed.; Elsevier: Oxford, UK, 2013. [Google Scholar]
  23. Szargut, J.; Styrylska, T. Approximate evaluation of exergy of fuels. Brennstoff Warme Kraft 1964, 16, 589–596. [Google Scholar]
  24. Bejan, A. Advanced Engineering Thermodynamics, 3rd ed.; Wiley: New York, NY, USA, 2006. [Google Scholar]
  25. EES (Engineering Equation Solver); v7.847, #92; F-Chart Software, LLC: Madison, WI, USA, 2010.
  26. Alauddin, Z.A. Performance and Characteristics of a Biomass Gasifier System. Ph.D. Thesis, University of Wales, College of Cardiff, Cardiff, UK, 1996. [Google Scholar]
  27. Zainal, Z.A.; Ali, R.; Lean, C.H. Prediction of performance of downdraft gasifier using equilibrium modeling for different biomass materials. Energy Convers. Manag. 2001, 42, 1499–1515. [Google Scholar] [CrossRef]

