Article

Developing a Sustainability Assessment Model to Analyze China’s Municipal Solid Waste Management Enhancement Strategy

1
Urban Environmental Management, School of Environment, Resources and Development, Asian Institute of Technology, P.O. Box 4, Klong Luang, Pathumthani 12120, Thailand
2
Zhangqiu Environmental Protection Bureau Shandong Province, Zhangqiu 250200, China
*
Author to whom correspondence should be addressed.
Sustainability 2015, 7(2), 1116-1141; https://doi.org/10.3390/su7021116
Submission received: 29 September 2014 / Revised: 5 January 2015 / Accepted: 13 January 2015 / Published: 22 January 2015

Abstract

:
This study develops a sustainability assessment model for analysis and decision-making of the impact of China’s municipal solid waste management enhancement strategy options based on three waste treatment scenarios: landfill disposal, waste-to-energy incineration, and a combination of a material recovery facility and composting. The model employs life cycle assessment, health risk assessment, and full cost accounting to evaluate the treatment scenarios regarding safeguarding public health, protecting the environment and conserving resources, and economic feasibility. The model then uses an analytic hierarchy process for an overall appraisal of sustainability. Results suggest that a combination of material recovery and composting is the most efficient option. The study results clarify sustainable attributes, suitable predications, evaluation modeling, and stakeholder involvement issues in solid waste management. The demonstration of the use of sustainability assessment model (SAM) provides flexibility by allowing assessment for a municipal solid waste management (MSWM) strategy on a case-by-case basis, taking into account site-specific factors, therefore it has the potential for flexible applications in different communities/regions.

1. Introduction

Municipal Solid Waste Management (MSWM), which comes into being to tackle waste problems, is a necessary part of human life and effective management of waste has been identified as essential for human sustainability [1]. Waste problems consist of environment pollution, resource depletion, and public health problems, such as the spread of diseases, etc. which relate to environmental, economic, and social issues of sustainability [2] that must be addressed.
MSWM move towards an integrated approach began in 1962 [3]. Currently, a large number of countries and regions around the world are struggling to handle their waste problems with an integrated waste management (IWM) approach, as formulated by the book: Integrated solid waste management: A life cycle inventory (1st edition) which was released in 1995 in UK [3]. The United Nations Environmental Program (UNEP, 1996) recognized the importance of IWM, which it defined as “a framework of reference for designing and implementing new waste management systems and for analysing and optimising existing systems” [4].
Integrated waste management has been accepted as a sustainable approach to solid waste management in any region [5]. The IWM has been well practiced in developed countries, such as European countries and the United States (e.g., Hampshire, England; Prato, Italy; Copenhagen, Denmark; Seattle, USA), as well as developing countries, such as India (Madras, India) [3]. China adopted an IWM approach and incorporated it in its MSWM enhancing strategy. In 2011, the State Council of China implemented a MSW management (MSWM) enhancement strategy [6] under the auspices of the Circular Economy Promotion Law (2009) and the Cycle Oriented Society Law. This MSWM strategy focuses on resource-oriented management rather than on the mere material disposal of “garbage” [6]. In this regard, the MSWM enhancement strategy in China can be regarded as an updating IWM strategy in China.
Implementation of IWM presents the opportunity to establish sustainable MSWM systems. Experience can be drawn from successful cases, for example an IWM system operating in the city of London, Ontario, Canada. It incorporated three key IWM features, including socially acceptable strategies, economically affordable systems and environmentally effective systems; more importantly, has the support of the citizens and the citizen’s views are sought and utilized in implementing waste management plans for the city [5]. Lessons can be drawn from unsuccessful cases as well, for example a case study in Mysore city, India was taken to find out the problems and prospects of IWM in Mysore city. This case study reveals that the present system is not satisfactory because it currently considers the MSW simply as residue to be thrown away, so it suggests that MSW should be recognized as resource materials for the production of energy, compost and fuel, depending upon the techno-economical viability, local conditions and sustainability of the project on a long-term basis [7].
Many Chinese cities are also making efforts to handle waste problems in an IWM manner recently; these include Beijing [8], Shanghai [9], Chongqing [10] and medium and small cities, such as Hangzhou [11] Suzhou [12] and Guanghan, Sichuan, China [13]. There is also a comparison case study to address IWM issues between foreign cities and Chinese cities, e.g., Chen (2008) systematically compares and contrasts two cases, the Regional Municipality of Waterloo (RMOW) in Canada and Dalian City in China, with a key finding that strengthens the relatively incompetent component in the system of Chinese cities to improve the capacities for waste service and treatment, which are contingent on the development of waste industries [14]. All this practices help to build knowledge and advance management. It can be found that in China, there is still a lack of guidance in how to appropriately handle the diversion of waste from landfill to other treatment options, such as composting and incineration [14], as well as insufficient information transparency, public participation, etc. [14].
The assessment of IWM practices in different cities shows that although individual IWM systems vary across regions [15], but the goals are nearly the same; that is that IWM needs to be sustainable [3]. In the wake of these, China initiated its MSWM enhancement strategy in April 2011, with the aim to build a sustainable MSWM. In view of this, it is necessary to assess and evaluate the effects and results of various waste handling methods [16] implemented by the subject cities and areas under the guidance of MSWM enhancement, ensure the selected MSWM option is harmonization in the economic, environment and social dimensions of sustainable development.
There are a number of useful assessment tools, particularly with reference to the environmental, economic, and social dimensions of waste management. Examples of analytical tools include life-cycle assessments (LCA) and different types of material flow analysis (MFA), which are widely used in environmental impact analyses for waste disposal. A health risk assessment (HRA) has been used for the evaluation of potential public health problems. In addition, economic affordability and sustainability are determined through economic methodologies, such as cost-benefit analysis (CBA), life-cycle cost (LCC), full-cost accounting (FCA), etc. [17].
This paper presents a sustainability assessment model (SAM) to identify, analyze, and evaluate the environmental effectiveness, economic efficiency, and health safeties by the above-mentioned assessment tools separately and then integrate them into an overall sustainability results. The SAM is also intended to enable local stakeholders to have full engagement in the assessment process by establishing a formal collaboration mechanism with all stakeholders’ participation [18]. This aspect of SAM’s applicability is based on the notion that addressing stakeholders’ interests and stakeholders’ interactions are prerequisites for the successful implementation of an MSWM strategy [19] in a given locality.

2. Materials and Methods

2.1. Assessment Framework

The sustainability assessment process is shown in Figure 1. First, it employs a life cycle assessment (LCA), full cost accounting (FCA), and health risk assessment (HRA) to analyze, predict, and evaluate the environmental, economic, and social health aspects of a variety of scenarios. Then, it integrates these individual assessments by means of an analytical hierarchy process (AHP) while involving stakeholder participation. The international standards “ISO 14040” [20] and “ISO 14044” [21] are the main reference systems used in performing the LCA. The US EPA guidelines (RAGS-F) [22] are the main references used for conducting the EHRA. The main reference for performing FCA is the FCA handbook published by the US EPA [23] and the AHP is performed with reference to Saaty’s The Analytic Hierarchy Process [24].
Figure 1. Methodology: sustainability assessment process.
Sustainability 07 01116 g001
The LCA, HRA and FCA employed in SAM are all well-proven assessment tools, which are credible and reliable in assessing environmental, social and economic sustainability and have all been widely used. AHP is also a mature Multi-criteria decision analysis approaches in stakeholders “analysis for identifying the critical criteria, indicators and metrics which represent multi-stakeholders interests” and widely used since its emergence in the 1970s. So in this regard, the four mentioned tools are not new, however, an organic integration of them can bestow new values on them; the highlights are illustrated as follows in the MSWM sustainability assessment study. The SAM is not simple a combination or addition of several already existed assessment tools, including LCA, HRA and FCA; it is an integration under the logic of AHP with institutional stakeholder involvement. This approach facilitates stakeholder participation in an institutional manner, and the direct utility of stakeholder participation will produce results at the decision-making phase based on the separate environmental, social and economic assessment dimensions. In this regard, it is new and needs further practice, since up until now, it has not been applied anywhere else.
The accompanied in-depth case study of MSWM assessment of Zhangqiu City in China serves as an illustration of its application. As a novel assessment model, further investigation is needed to validate or challenge the findings of this study. Since the utility of this model has not been examined by other authors in another context, the SAM needs to be applied in a variety of localities, and further improvements of the SAM can be identified in practice. The SAM is developed as a credible and reliable tool, which is a transformative, life cycle, systems-oriented thinking framework [25] to support the China MSWM enhancement strategy formulation.

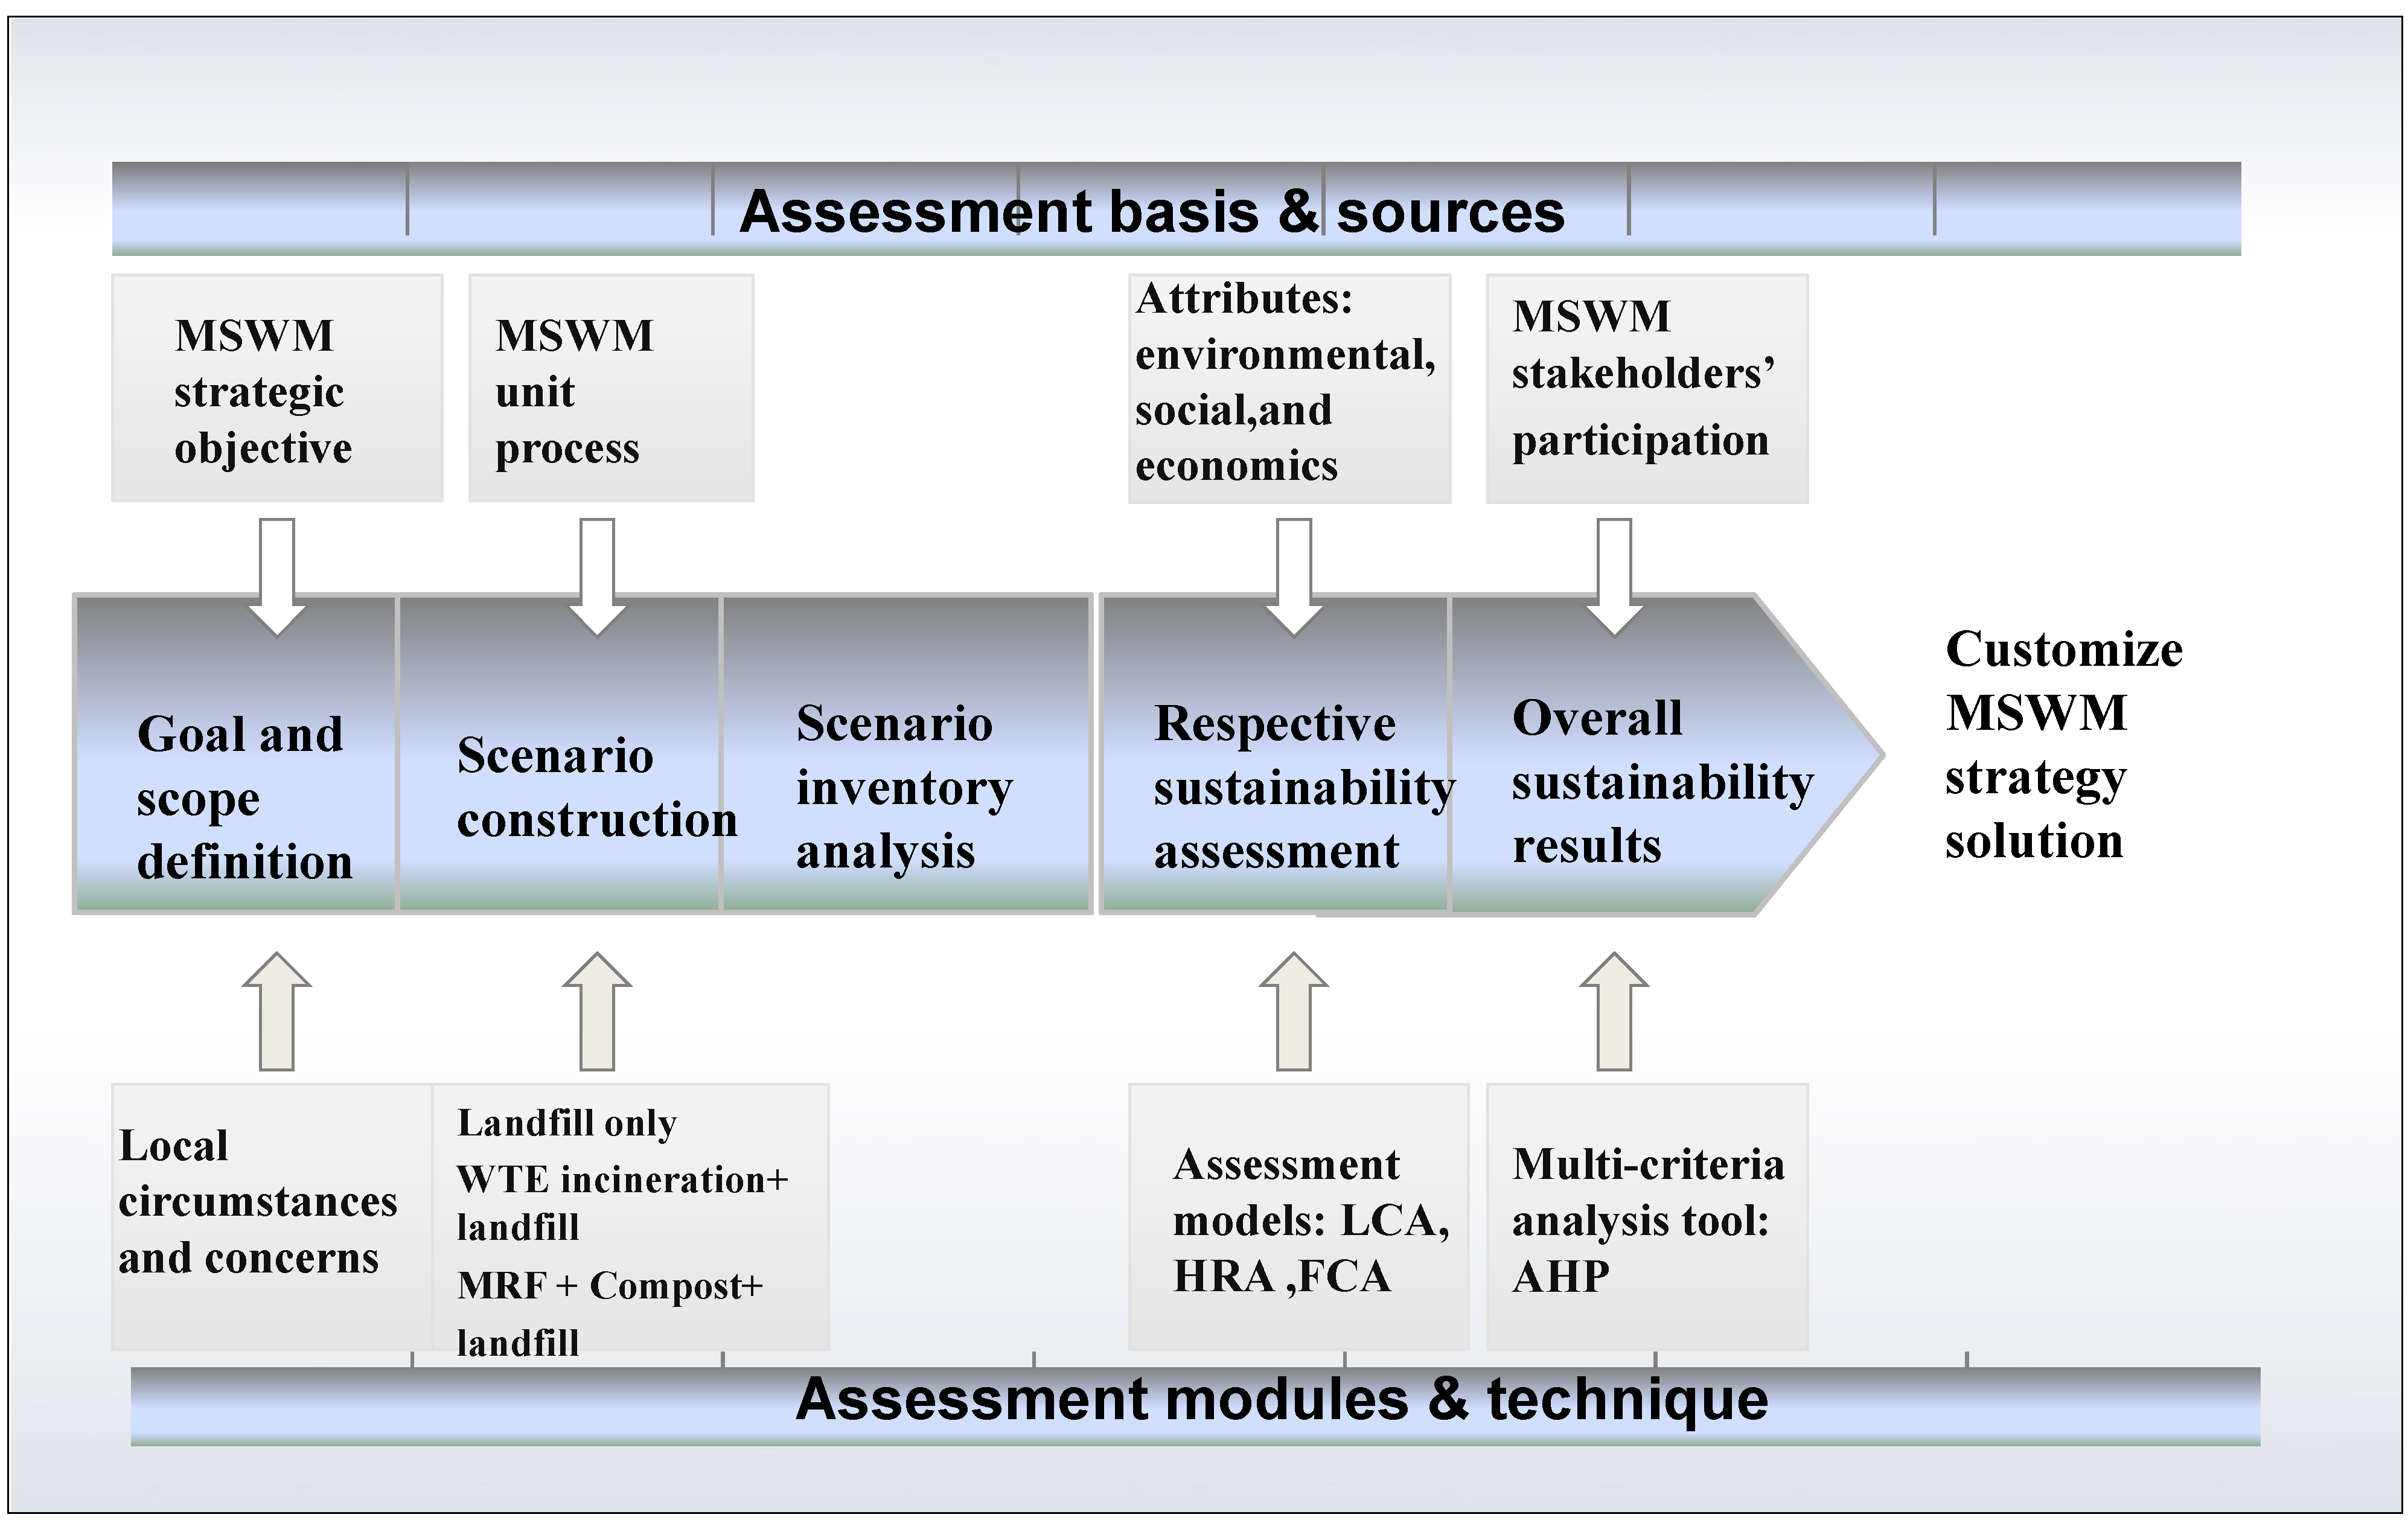
2.2. Purpose and Scope

The purpose of assessment depends on the goals of the policy. The aims and strategic objectives of the MSWM enhancement strategy are to achieve sustainable MSWM as specified in the national MSWM enhancement strategy [2] (Table 1). Accordingly, the purpose of the SAM is to investigate and examine the sustainability performance of a given MSWM strategy in terms of its ability to achieve the protection of human health and the local environment, and the conservation or efficient use of resources in a way that can be economically sustained. Given that the same system boundary and functional unit are considered when comparing alternative systems [26,27], the scope of this methodology is to enable the sustainable assessment of a given waste management system. The functional unit of the methodology is the appropriate management of the total MSW arising of a defined geographical region during a defined period of time. The scope of this methodology is to enable a life cycle inventory of a specific waste management system to be carried out. The unit processes are waste generation, waste collection, material sorting and recovering plus compost, waste-to-energy incineration and landfill. The MSWM system does not include the direct reduction and reuse or waste separation from household or industrial users. MSWM system boundaries of this research are as follows [3]:
(1)
Inputs (Waste): the point where the waste leaves the household.
(2)
Inputs (Energy and raw materials): the extraction of fuel resources and raw materials.
(3)
Outputs (Energy): the electric power leaving an energy-from-waste facility, (the electrical energy generated is subtracted from the energy consumed).
(4)
Outputs (Recovered Materials): Recyclables from Material Recovery Facility.
(5)
Outputs (Compost): exit of biological treatment plant.
(6)
Outputs (Air Emissions): exhaust of transport vehicles, stack of thermal treatment plant, i.e., after emission controls, stack of power station (for electricity generation) or landfill lining/cap.
(7)
Outputs (Water Emissions): outlet of biological treatment plant thermal treatment plant or power station (electricity).
(8)
Outputs (Final Solid Waste): content of landfill at end of biologically active period.
Table 1. Summary of China’s municipal solid waste management (MSWM) enhancement strategy.
Directive ArticlesStrategic ObjectivesSuggested Treatment Options (Article 9)
Article 6. Strengthen the utilization of waste resources;
Article 9. Choose appropriate technologies;
Article 10. Accelerate the construction of facilities
(1) Resource conservation
(2) Environmental protection
(3) Human health
(4) Economic feasibility
(1) Sanitary landfill
(2) Waste-to-energy incineration
(3) Biological treatment
(4) Other treatment technologies

2.3. Scenario Construction and Inventory Analysis

Three scenarios, representing the most likely MSWM strategy options for contemporary cities in China, were analyzed. The scenarios were constructed as follows:
  • Scenario 1 (baseline scenario): Comingled collection and landfills with landfill gas (LFG) and leachate collection and treatment. The collected LFG is burned and emitted into the atmosphere through a 15-meter smokestack with no LFG torch flares and no energy recovery.
  • Scenario 2: Comingled collection of which all of the waste is sent to waste-to-energy (WTE) incineration. Bottom ash and air pollution control residues are sent to landfills as inert materials. The WTE plant and landfill plant are located near each other at the same site so that no transportation of waste needs to be considered.
  • Scenario 3: Comingled collection of which all of the waste is sent to a comprehensive compost plant accompanied by a material recovery facility (MRF). Organic waste is composted and the inert materials are sent to the landfill. The compost and landfill plants are located near each other at the same site so that no transportation of waste needs to be considered.

2.4. Scenario Inventory Analysis

Data from Zhangqiu City, located in northeast China, was used to undertake this study.

2.4.1. Waste Inputs

In 2012, Zhangqiu City had a population of 1,002,000 and approximately 250,000 households. The waste generation, the unit of analysis was about 255,500 metric tons in 2012, which is about 700 metric tons per day. The general composition and physical characteristics of its commercial waste is presented in Table 2 [28].
Table 2. Composition and physical characteristics of municipal solid waste (MSW) in Zhangqiu City in 2012.
NameOrganic (%)Inorganic (%)Recyclable (%)Others
AnimalPlantDirtTile/CeramicsPaperTextilePlasticsMetalGlassWood
Wet-basis composition1.5947.450.143.0115.685.0714.330.220.960.2211.35
Dry-basis composition2.4437.340.215.0215.075.3517.930.522.210.2813.65

2.4.2. Waste Collection and Transportation

The formal MSW collection and transportation of waste in the city was performed by the City Appearance and Environmental Sanitation Administrative Centre (CAESAC). The collection system was a ‘communal-curbside’ collection scheme, in which people placed waste in bins (either 660 L bin or 240 L bin) at the curbs of the streets in their neighborhoods and city vehicles were allocated to haul it away. Waste from the urban areas was taken directly to the treatment plants; waste from the rural areas was first taken to one of six transfer stations before being sent to the main treatment plant as specified in the scenario construction. Sixty percent of waste is transported via transfer station; diesel fuel and electrical energy consumption are credited, besides the transportation process.

2.4.3. Waste Treatment

Data (such as energy requirements, operating costs and operating efficiency) are required to describe each of the waste management unit processes for WTE incineration, material recovery facility, compost and landfilling.
Data about the WTE mass incineration plant were derived from the first phase project of the Zhangqiu WTE Incineration Plant in 2012. This plant was designed to fully meet the Standard for pollution control for the municipal solid waste incineration plant [29]. Documents related to the design parameters of the plants provided further data, in particular with respect to the WTE incineration plant. Main data includes Electricity generation and self-consumption, raw material consumption, air emission parameters, and so on. The gross efficiency of energy recovery is 20%, and 20% of the electricity generated is consumed by the WTE plant, so 80% of the total electricity is exported to the local power grid and this will be credited in LCI. It is assumed that air pollutants generated in the incineration process are emitted into atmosphere through an 80-meter stack, after gas-cleaning equipment treatment.
A hypothetical analogical survey was made of the planned compost plant (based on an assumption of similar waste composition), which thus provided some approximate operational data for this planned facility. Data for the composting treatment came from the documentation, which was based on the Xiaojianxi Compost Plant in Qingdao City, and would be constructed to fully meet the Standard for construction on the municipal solid waste compost project [30]. Main data include electrical energy consumption, raw material consumption, recyclables collected, compost generation, air emissions, etc. Air pollutants are assumed to be collected in the compost workshop and emitted into atmosphere through a 15-meter stack after gas-cleaning equipment treatment. All residue waste is assumed to be transported to the neighborhood landfill plant.
Data reference for landfill plant was made to the Zhangqiu First Landfill Plant and the Laiwu Landfill Plant (Laiwau is a neighboring city to Zhangqiu). Which are all meet the Standard for pollution control for the municipal solid waste landfill site [31] and Environmental management-life cycle assessment-goal and scope definition and inventory analysis (GB/T 24041-2000) [32]. Main data include electrical energy consumption, diesel consumption and raw materials, air emissions and so on. The key operation parameter for landfill gas collection rate is 60%, collected LFG are flared and emitted into the atmosphere through a 15-meter stack without energy recovery; and the ruminant 40% LFG are diffused in a natural manner.
In addition, other actual data needed are also required for data analysis to enable the SAM application, especially those data for the IWM-2 and SCREEN3 calculation. For example, the HRA demands key data, such as the landform and geological condition, climate and meteorology situation data of the subject area (Zhangqiu city), etc. In accordance with the Guidelines for Environmental Impact Assessment-Atmospheric Environment (HJ2.2-2008) [33], this research adopts one-year (2012) continued meteorological data of Zhangqiu City for reference (Zhangqiu meteorological station, China, 2012).

2.5. Sustainability Assessment Process

The SAM uses several specific analytical tools and modules based on the principle of fostering strengths and circumventing weaknesses to account for the dynamic and inclusive nature of MSWM.
The logic of the SAM modeling is: (1) LCA provides a holistic assessment of the resource conservation and environmental protection performance of the possible MSWM options; (2) HRA evaluates the approximately “real” (virtual) impacts on human health by the MSWM system, then identifies the “potential” impacts that were analyzed as ‘eco toxicity/human toxicity’ by the LCA, and, reformulates the methodology; and (3) FCA determines the total financial cost of construction and operation of an MSWM system using a life cycle cost approach. Finally, AHP are employed to combine these results and formally incorporate stakeholder’s participation to generate a final results Calculation procedure of LCIA, HRA and FCA are as follows.

2.5.1. LCIA Calculation

The environmental impacts are focused on air emissions by evaluating LCI results in four categories: (1) climate change; (2) photo-oxidant formation; (3) acidification; and (4) eutrophication. The categories were selected by following the Environmental Design of Industrial Products (EDIP) methodology [34] and Yang, et al. [35]. First, the different substances that contributed to the environmental impact of the MSW were quantitatively aggregated accounting for their substance-specific effects. Then, a complete set of category indicator results was created by applying normalization and weighting process (again following the EDIP and Yang, et al.) [34,35]. The result was an “environmental profile” of the MSW system represented by its potential per person environmental impact (EIP). The references used for the calculation of potential impacts are outlined in Table 3.
Table 3. References used to calculate the potential environment impact of the municipal solid waste (MSW).
Impact CategoryStressorsEquivalent FactorTransfer CoefficientNormalization ValueWeight Factor
Climate changeCO2CO21.008700.000.82
CO2.00
CH425.00
NOx40.00
Chl.HC3300.00
AcidificationSO2SO21.0036.000.73
NOx0.70
HCI0.88
HF1.60
H2S1.88
NH31.88
EutrophicationNO3NO31.0062.000.73
NH33.64
NOx1.35
COD0.23
Photo-oxidant formationC2H4C2H41.000.650.53
CH40.03
CO0.03
NMHC a0.038
SO20.05
NOx0.03
a NMHC is the abbreviation of non-methane Hydrocarbons.

2.5.2. HRA Calculation

The health risk assessment was performed twice, first with respect to the potential carcinogenic effects and then with respect to potential non-carcinogenic effects. The effects were calculated and represented as increased lifetime cancer risk (ILCR) and hazard index (HI), respectively. The result was a single health risk value derived for each of the scenarios.
For the calculation of the ILCR, a chronic Exposure Concentration (EC) and a Unit Risk Factor/Cancer Slope Factor (URF/CSF) were used to calculate separate ILCRs and a combined ILCR (Equations (1) and (2)).
I L C R = E C × U R F
where EC = Exposure Concentration and URF = Unit Risk Factor
T I L C R = j = 1 n E C j × U R F j
where ECj = Exposure Concentration of chemical j and URFj = URF of chemical j.
The US EPA Risk assessment guidance for Superfund Volume I: Human health evaluation manual (Part F, Supplemental Guidance for Inhalation Risk Assessment), (RAGS-F) was followed in the calculation of HI. The ratio of the estimated receptor exposure to the exposure limit (Concentration Ratio (CR)) and Reference for Concentration (RfC) were used to calculate an estimated CR (Equations (3) and (4)).
C R = E C R f C
In this way, the HI for threshold compounds is:
H I = j = 1 n E C j R f C j = j = 1 n C R j
where ECj = Exposure Concentration of chemical j, RfCj = RfC of chemical j, and CRj = CR of chemical j.
The RfC of conventional pollutants for non-cancer risk refers to the 1-hour average (mean) value of the second level standards specified in the China Air Quality Standards [36]. The RfC values of specific pollutants, such as heavy metals, and the URF and CSF values of dioxins and heavy metals are in accordance with the Guidelines for Risk Assessment of Contaminated Sites [33] and Technical Guidelines for Risk Assessment of Contaminated Sites [37].

2.5.3. FCA Calculation

FCA was calculated using the 2012 values of monetary costs, including the positive and negative financial costs of the functional units. These costs were calculated using three components: capital cost, operation and maintenance costs, and revenues. Capital costs consisted of the up-front costs and the back-end costs. Any changes in monetary value due to inflation were accounted for by applying a discount rate to convert all potential costs into what would be their equivalent values in 2012. The regulations of the Chinese accounting system require that the depreciation period for construction is 30 years; the depreciation period for apparatus, equipment, and transportation vehicles is 10 years; and the depreciation period is 5 years for 240-L bins and 10 years for 660-L bins, respectively. Equation (5) was used to calculate the economic assessment.
FCA cost = capital cost + operation and maintenance cost − revenues

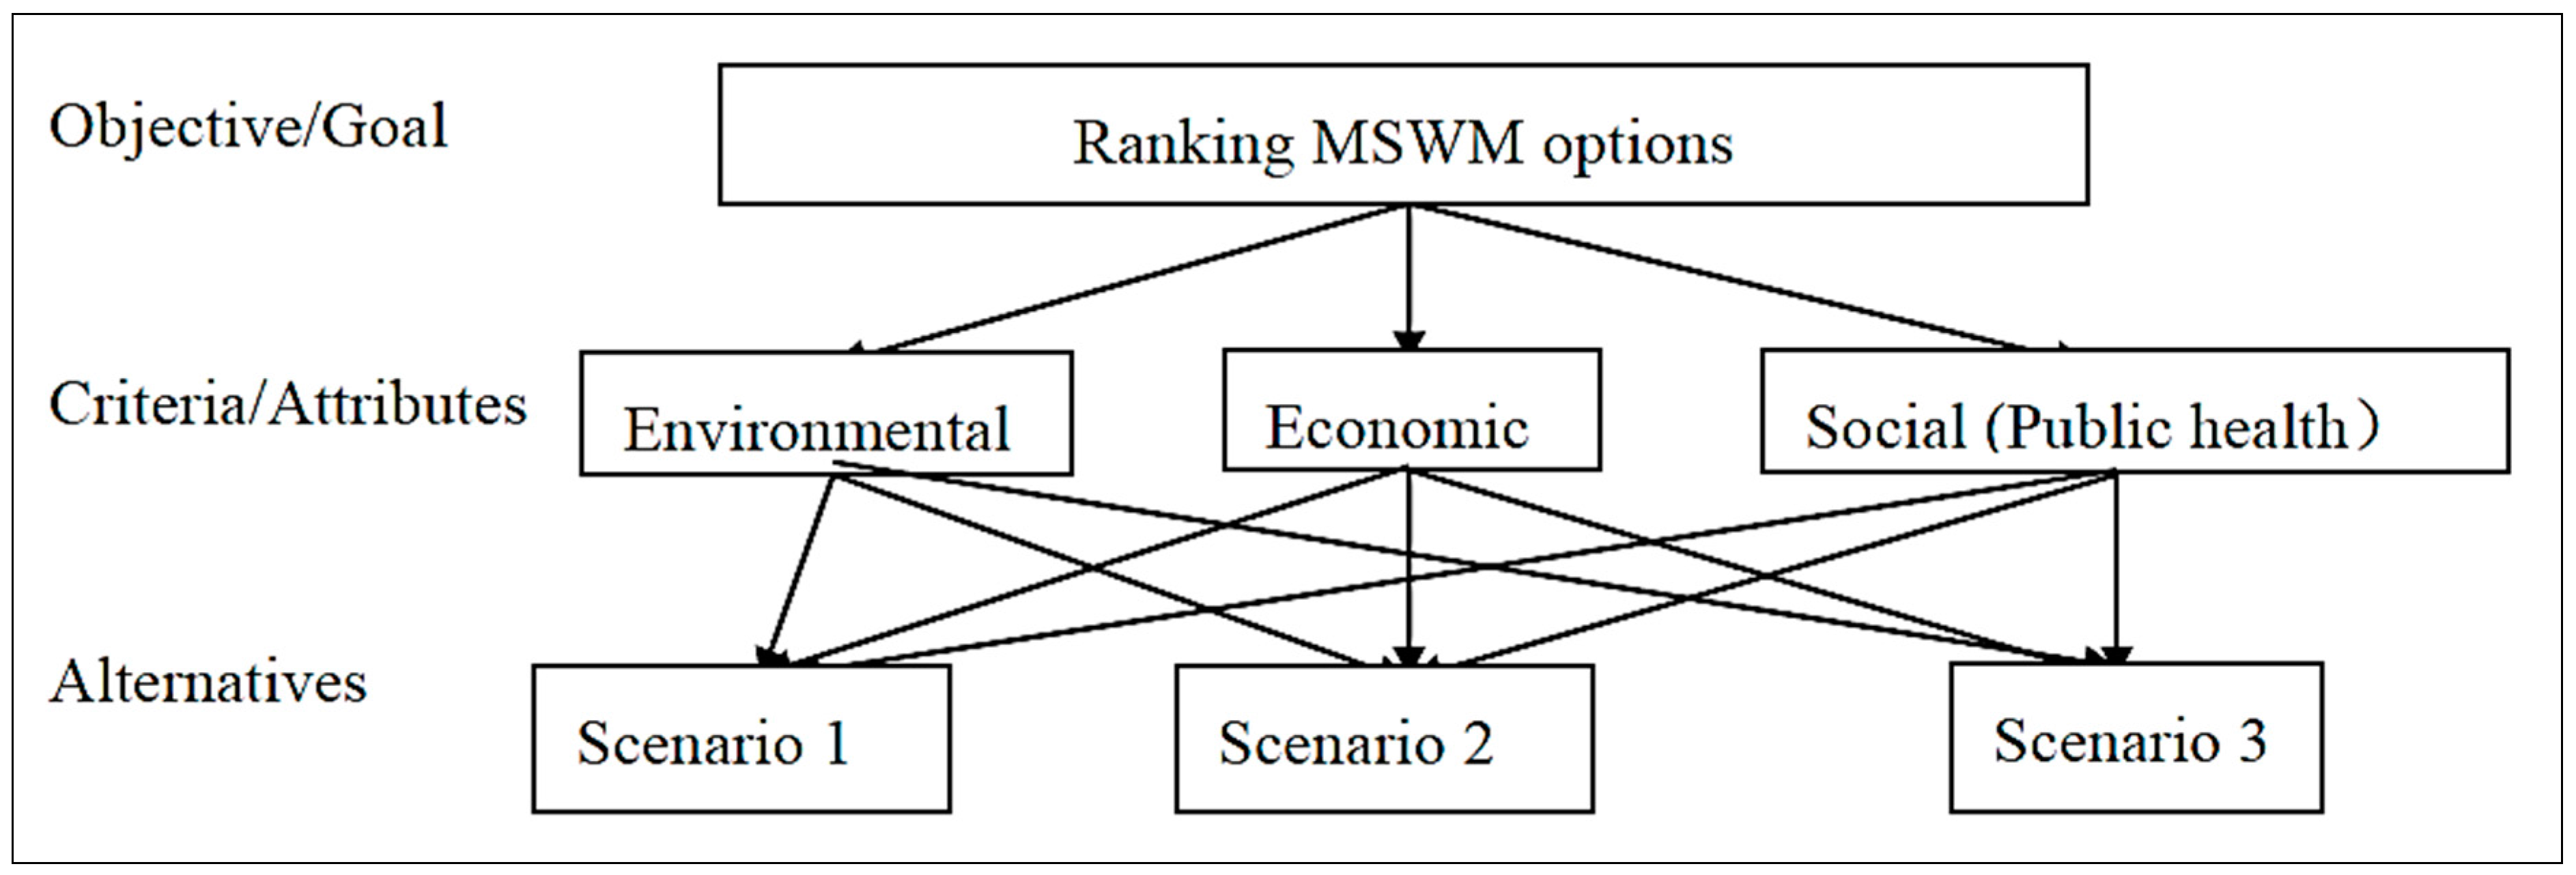
2.5.4. AHP Calculation

The obtained results from the above environmental, social and economic assessment to some extent are fragmented, and thus have limited practical value [38]. The SAM integrates these results through AHP that yields a detailed overall formulation and implementation of an MSWM strategy. AHP is a multi-criteria decision analysis model that can include multiple stakeholders’ interests [39]. This consideration of multiple stakeholders is reflected in the pairwise comparisons of the environmental, social, and economic criteria to the overall sustainability goals that synthesize the final numerical priorities results of the individual scenarios.
Finally, a customized MSWM strategy solution may derive from the AHP priority results. As a credible and reliable method, the SAM is also straightforward in its application and easy to communicate to stakeholders. The procedure that was used to compute the AHP is illustrated in Figure 2.
Figure 2. The Analytic Hierarchy Process (AHP) formulations for the MSWM enhancement strategy options.
Sustainability 07 01116 g002
The calculation process consists of three steps. First, calculate the alternatives (scenarios) with respect to their strength in meeting the sustainability criteria to compare pairs of scenarios with respect to environmental, social and economic performance. The quantitative results of LCA, HRA and FCA are used to transfer the quantitative results into the AHP scale, respectively, based on the judgment of the author. A series of pair-wise comparisons of the elements on a scale of 1 to 9 (where 1 represents the equal importance of each element and 9 represents the extreme importance of one element over the other) [25] are used in attribute priorities to three alternatives under three criteria of sustainability. The scale for pair-wise comparison presents in Table 4.
For example, under the Environmental criteria, the EIP results for scenario 1 is 1.54 × 10⁻¹, and EIP for scenario 2 is −9.39 × 10⁻³; thus, it means that scenario 2 is favored very strongly over scenario 1 and its dominance is demonstrated in practice, thus, a pair wise weight ratio of 1 to 7 (Scenario1:Scenario2), is credited into a cell (Row 2, Column 3) of table (Table 6 in the following section). The weight ratio of 7 (7:1) in cell (Row 3, Column 3) is a reciprocal of the weight ratio in cell (Row 2, Column 3). Then, by calculating the matrix’s first eigenvector, or second eigenvector if necessary, the priorities for three scenarios with respect to environmental, social and economic sustainability criteria assessment are derived.
Table 4. Scale for pair-wise comparison.
Intensity of ImportanceDefinitionExplanation
1Equal importance Two elements contribute equally to the objective
3Moderate importanceExperience and judgment moderately favor one elements over another
5Strong importanceExperience and judgment strongly favor one elements over another
7Very strong importanceOne element is favored very strongly over another; its dominance is demonstrated in practice
9Extreme importanceThe evidence favoring one element over another is of the highest possible order of affirmation
Intensities of 2, 4, 6 and 8 can be used to express intermediate values. Intensities of 1.1, 1.2, 1.3 etc. can be used for elements that are very close in importance. Source: Saaty [24], 1980.
Second, it is to evaluate the criteria of environmental, social and economic sustainability with respect to their importance in SAM. It is again conducted by a series of pair-wise comparisons. In this phase, stakeholders’ opinion on the weight of three criteria against MSWM sustainability goals is embodied in the pair-wise comparison process.
Stakeholders are selected from municipal government and its departments, such as City Appearance and Environmental Sanitation Administrative Center (CAESAC); enterprises and private companies; residential waste generators; township, villages, and communities; residents near waste treatment facilities; non-governmental organizations and academia; etc. All of the interviews will be conducted personally, without assistance from other interviewers, due to the small-scale surveys of this research. A sample of 50 individuals from these above-mentioned stakeholders was chosen in this research and a questionnaire was conducted to get their opinion on the priority of the three criteria of environmental, social and economic factors under the sustainability goal. For example, if an interviewer reply that economic factors(criteria)less than moderately favors over environmental factors, then a pair-wise weight ratio for environmental and economic of 2:1 is credited into a cell (Row 2, Column 4) of table (Table 7). The weight ration in cell (Row 4, Column 2) is the reciprocal of the weight ratio in cell (Row 2, Column 4).
In this way, numerical priorities are calculated for each of the criteria and stakeholder’s participation and engagement will directly reflected in the decision making process and in this way, the interest in site-specific information is reflected; the decision makers not only get general advice on choice of MSWM options, but also get knowledge regarding the aspects that may have a significant influence on the choice between alternatives.

2.5.5. Customize MSWM Strategy Solution

The final step of SAM is to calculate (multiplying and adding) the priorities of scenarios with respect to the criteria (environmental, social and economic), and the priorities of the criteria with respect to the sustainability goal. As a result, the scores of three scenarios’ relative ability to achieve sustainable MSWM are obtained.

2.6. Computer Software Programs

The IWM-2 model was used to conduct the life cycle inventory. SCREEN 3 [40] (Screening Air Dispersion Model, Version 3.0) was used to analyze specific air contaminants among the COPCs (contaminants of potential concern) that are produced as a result of the different treatment options.
The cornerstone of the SAM is the life cycle inventory, which is calculated by IWM-2 model. IWM-2 is a stand-alone Windows program that contains updated global data with high user friendliness, modeling flexibility, and transparency of both data and calculations.
Admitted, there are many LCA models that can be used for a LCI calculation, e.g., Simapro, CML-IA, Gabi, and AIST-LCA to name a few. The reasons for choosing IWM-2 in this research are as follows, which was illustrated by Mcdougall [41]:
(1)
Easy to use. They should be accessible to waste planners and managers, not just the domain of LCA experts or computer experts. Only if they are easy to use will full use be made of their potential to run creative “what if ..?” scenarios. Input from user groups will be essential to ensure the tools meet the needs of waste planners, managers and others.
(2)
Easy to understand and communicate to others. Endless tables of data do not communicate well.
(3)
Flexible. Users need to be able to customize the models so that they fit their specific circumstances.
(4)
Credible. If LCI results are going to be used as the basis for discussion between the many and varied stakeholders in waste management decisions, the tool needs to be credible. The methodology and assumptions must be transparent, and the basic data relevant and reliable. Having endorsement from the UK Environment Agency or the US Environmental Protection Agency may help to establish the credibility of models [41].
In this sense, the IWM-2 is selected because it is fully in accordance with the developed SAM, which is credible, reliable and easy to understand and communicate. The SCREEN3 model is highly recommend by the Ministry of Environmental Protection of the People’s Republic of China, as well as the USEPA, and so is employed by the SAM.

3. Results and Discussions

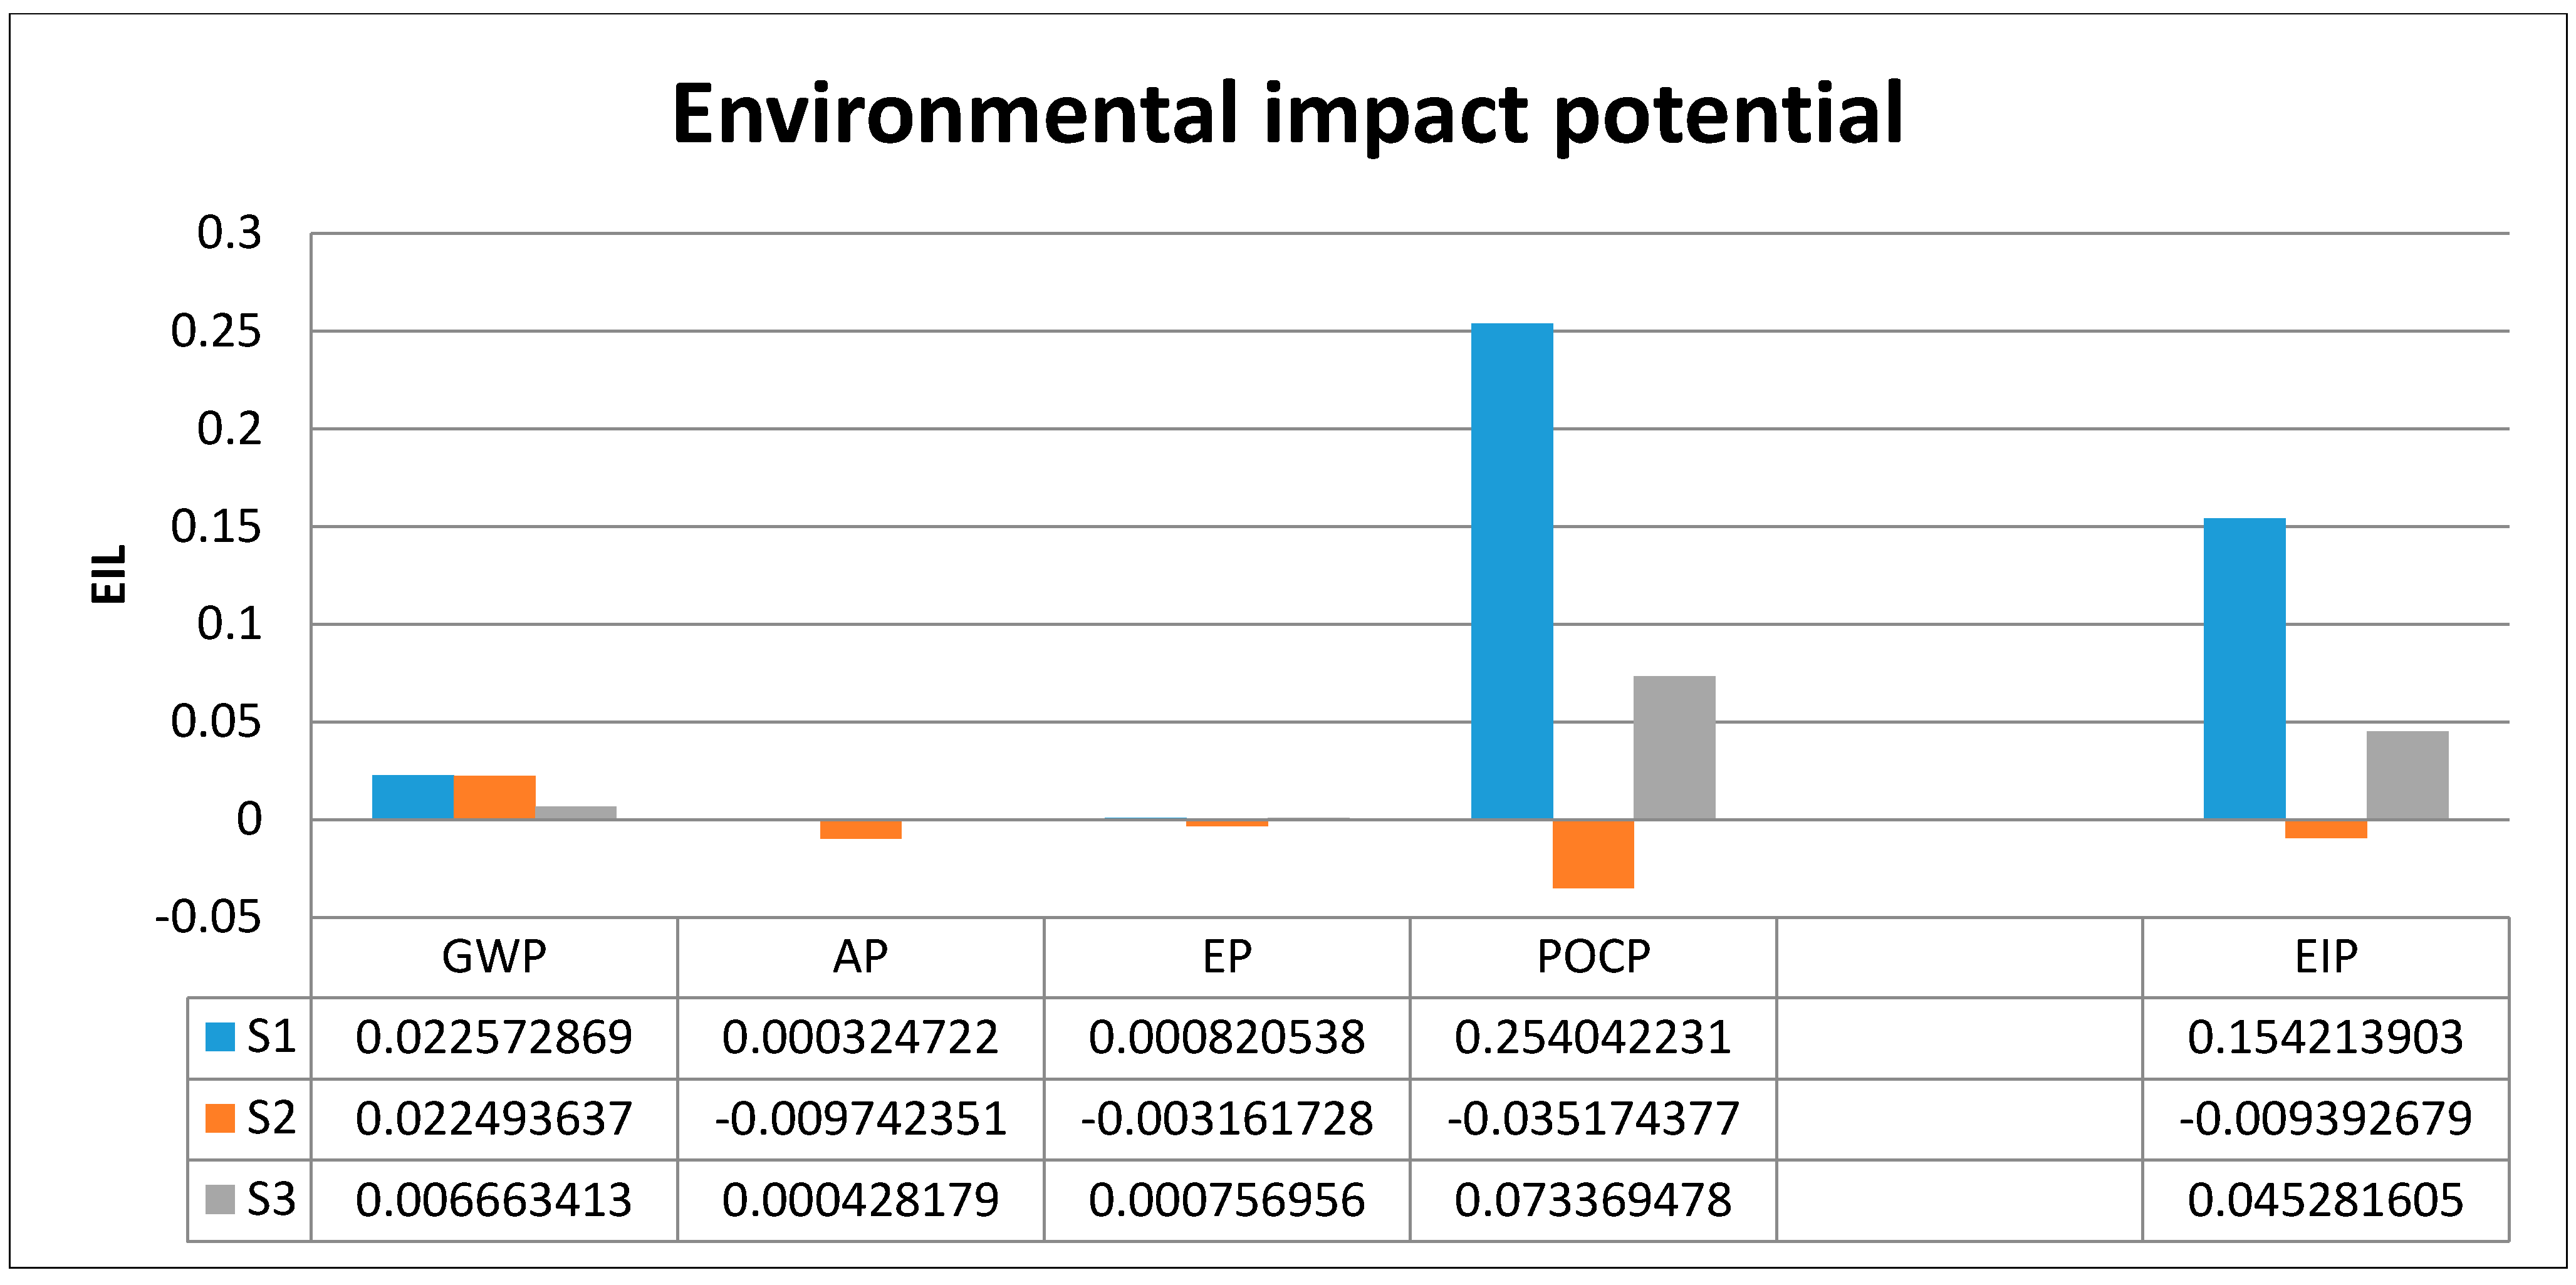
3.1. Environmental Impacts Assessment

Figure 3 presents the environmental sustainability assessment results. Scenario 2 had a negative EIP (−9.39 × 10⁻³), due to avoiding the negative environmental impact of commensurable hard coal in generating an equal amount of electricity. The evaluation was performed with reference to the electrical source of the Zhangqiu City grid, which mainly uses energy generated from a coal power plant and emits large quantities of SO2, NOx, and other chemicals (Table 5) [42]. The value of recyclables in MRF in Scenario 3 is also a remarkable reduction in EIP from virgin material production. Scenario 3 had an EIP value of 4.54 × 10⁻², which was one-third of the EIP value assessed for Scenario 1 (1.54 × 10⁻¹).
Figure 3. Environmental impact potential results.
Sustainability 07 01116 g003
Table 5. Chemicals present in the air emissions from the Zhangqiu Waste-to-Energy (WTE) incineration plant a.
CO2CH4COSO2NOxPMHCIHeavy metals (Hg, Pb, etc.)Dioxins
a The marginal energy source is hard coal.
The results of the application of SAM in the Zhangqiu case showed a number of implications for the three potential scenarios within the MSWM enhancement strategy. In terms of the environmental assessment, there is an unexpected result that the WTE incineration scenario performs the best compared with MRF and composting, which is in contrast with the Waste Management Hierarchy. The LCIA result of this study supports McDougall et al. [3] who put forward the criticism that the waste hierarchy concept is not an appropriate strategy for sustainable development, because it cannot provide an overall impact assessment for waste management. The best performance of WTE incineration option is accredited to the credit of environmental benefits of the avoidance of the negative environmental impact of the commensurable hard coal in generating the same amount of electricity. Because the Zhangqiu electricity supply mainly comes from coal incineration, and all the electricity generated in WTE incineration is supposed to displace hard coal, a great amount of hard coal is offset in generating the same amount of electricity, which otherwise emits larger quantities of SO2, NOx and so on, thus avoiding great negative impacts to the environment. However, it is not caused by the model’s design, but the data input from geographic specificities that have an impact on the results of waste LCA models [43]. That is, in another locality, different data inputs may generate different outcomes by using the same model.

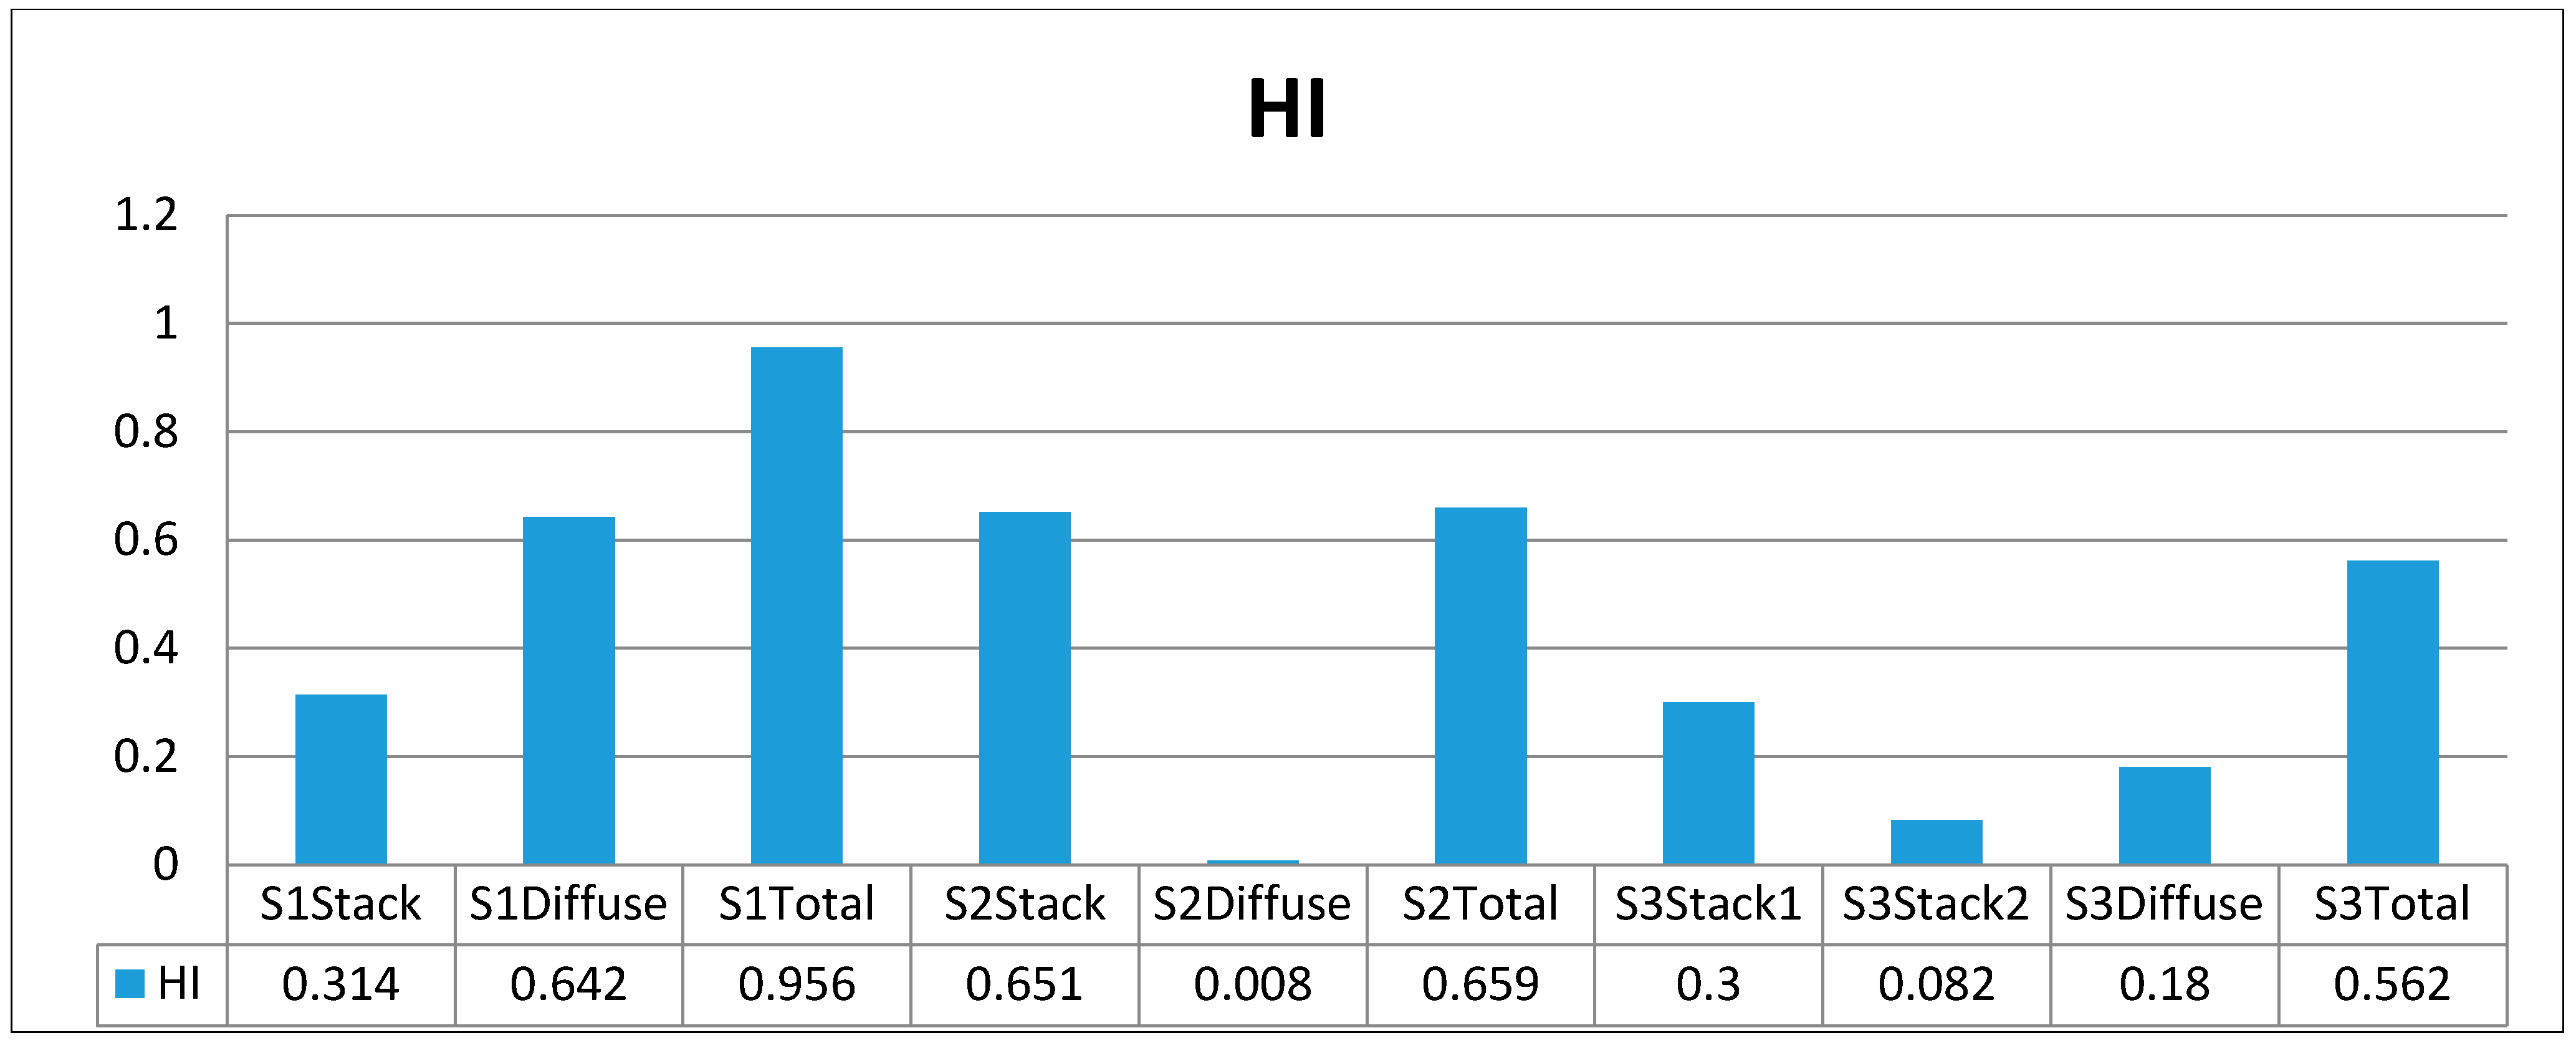
3.2. Social Health Risk Assessment

The social health risk assessment also focused on air emissions by calculating the extent of human toxicity and eco-toxicity in the LCIA and a health risk assessment was conducted to identify the timing and manner in which these toxic impacts might emerge. The three treatment facilities were assumed to be in the same site located northeast of the Zhangqiu City urban areas. The receptors were assumed to be the downtown residents that lived the nearest (four km) from these treatment facilities. Applying the precautionary principle (PP) [44], the health risk assessment calculation was based on the most unfavorable potential outcome of MSWM activities.
The HRA results are shown in two parts (Figure 4 and Figure 5). The results of the ILCR are: Scenario 1 = 1.39 × 10⁻⁶, Scenario 2 = 1.79 × 10⁻⁶, and Scenario 3 = 9.78 × 10⁻⁷. Scenario 3 brings the least cancer risk and which performs the best, followed by Scenario 1 and Scenario 2.The results of the HI are: Scenario 1 = 9.56 × 10⁻¹, Scenario 2 = 6.59 × 10⁻¹, and Scenario 3 = 5.62 × 10⁻¹. Scenario 3 brings the least non-cancer risk, performing the best, followed by Scenario 2 and Scenario 1.
Figure 4. Increase Lifetime Cancer Risk ILCR for individual cancer risks.
Sustainability 07 01116 g004
Figure 5. Hazard Index (HI) for individual non-cancer risks.
Sustainability 07 01116 g005
The HRA results showed that MRF and composting present the lowest public health risk. Although the planned WTE incineration plant was well established with up-to-date technology, and had a pollution control apparatus capable of recovering significant amounts of COPCs for human health, it still presented the largest public health risk of the three options. However, there is the unexpected result that overall the WTE incineration option is not preferable over the landfill only option in terms of cancer health risks. And in this regard, it again contradicts the findings of other studies, which have mostly been in favor of WTE incineration (e.g., Canadian Ministry of the Environment, 1999) [45] when compared with landfill. This may be partly due to the different waste composition and incineration emissions determined by the metal removal efficiency of gas-cleaning technology.

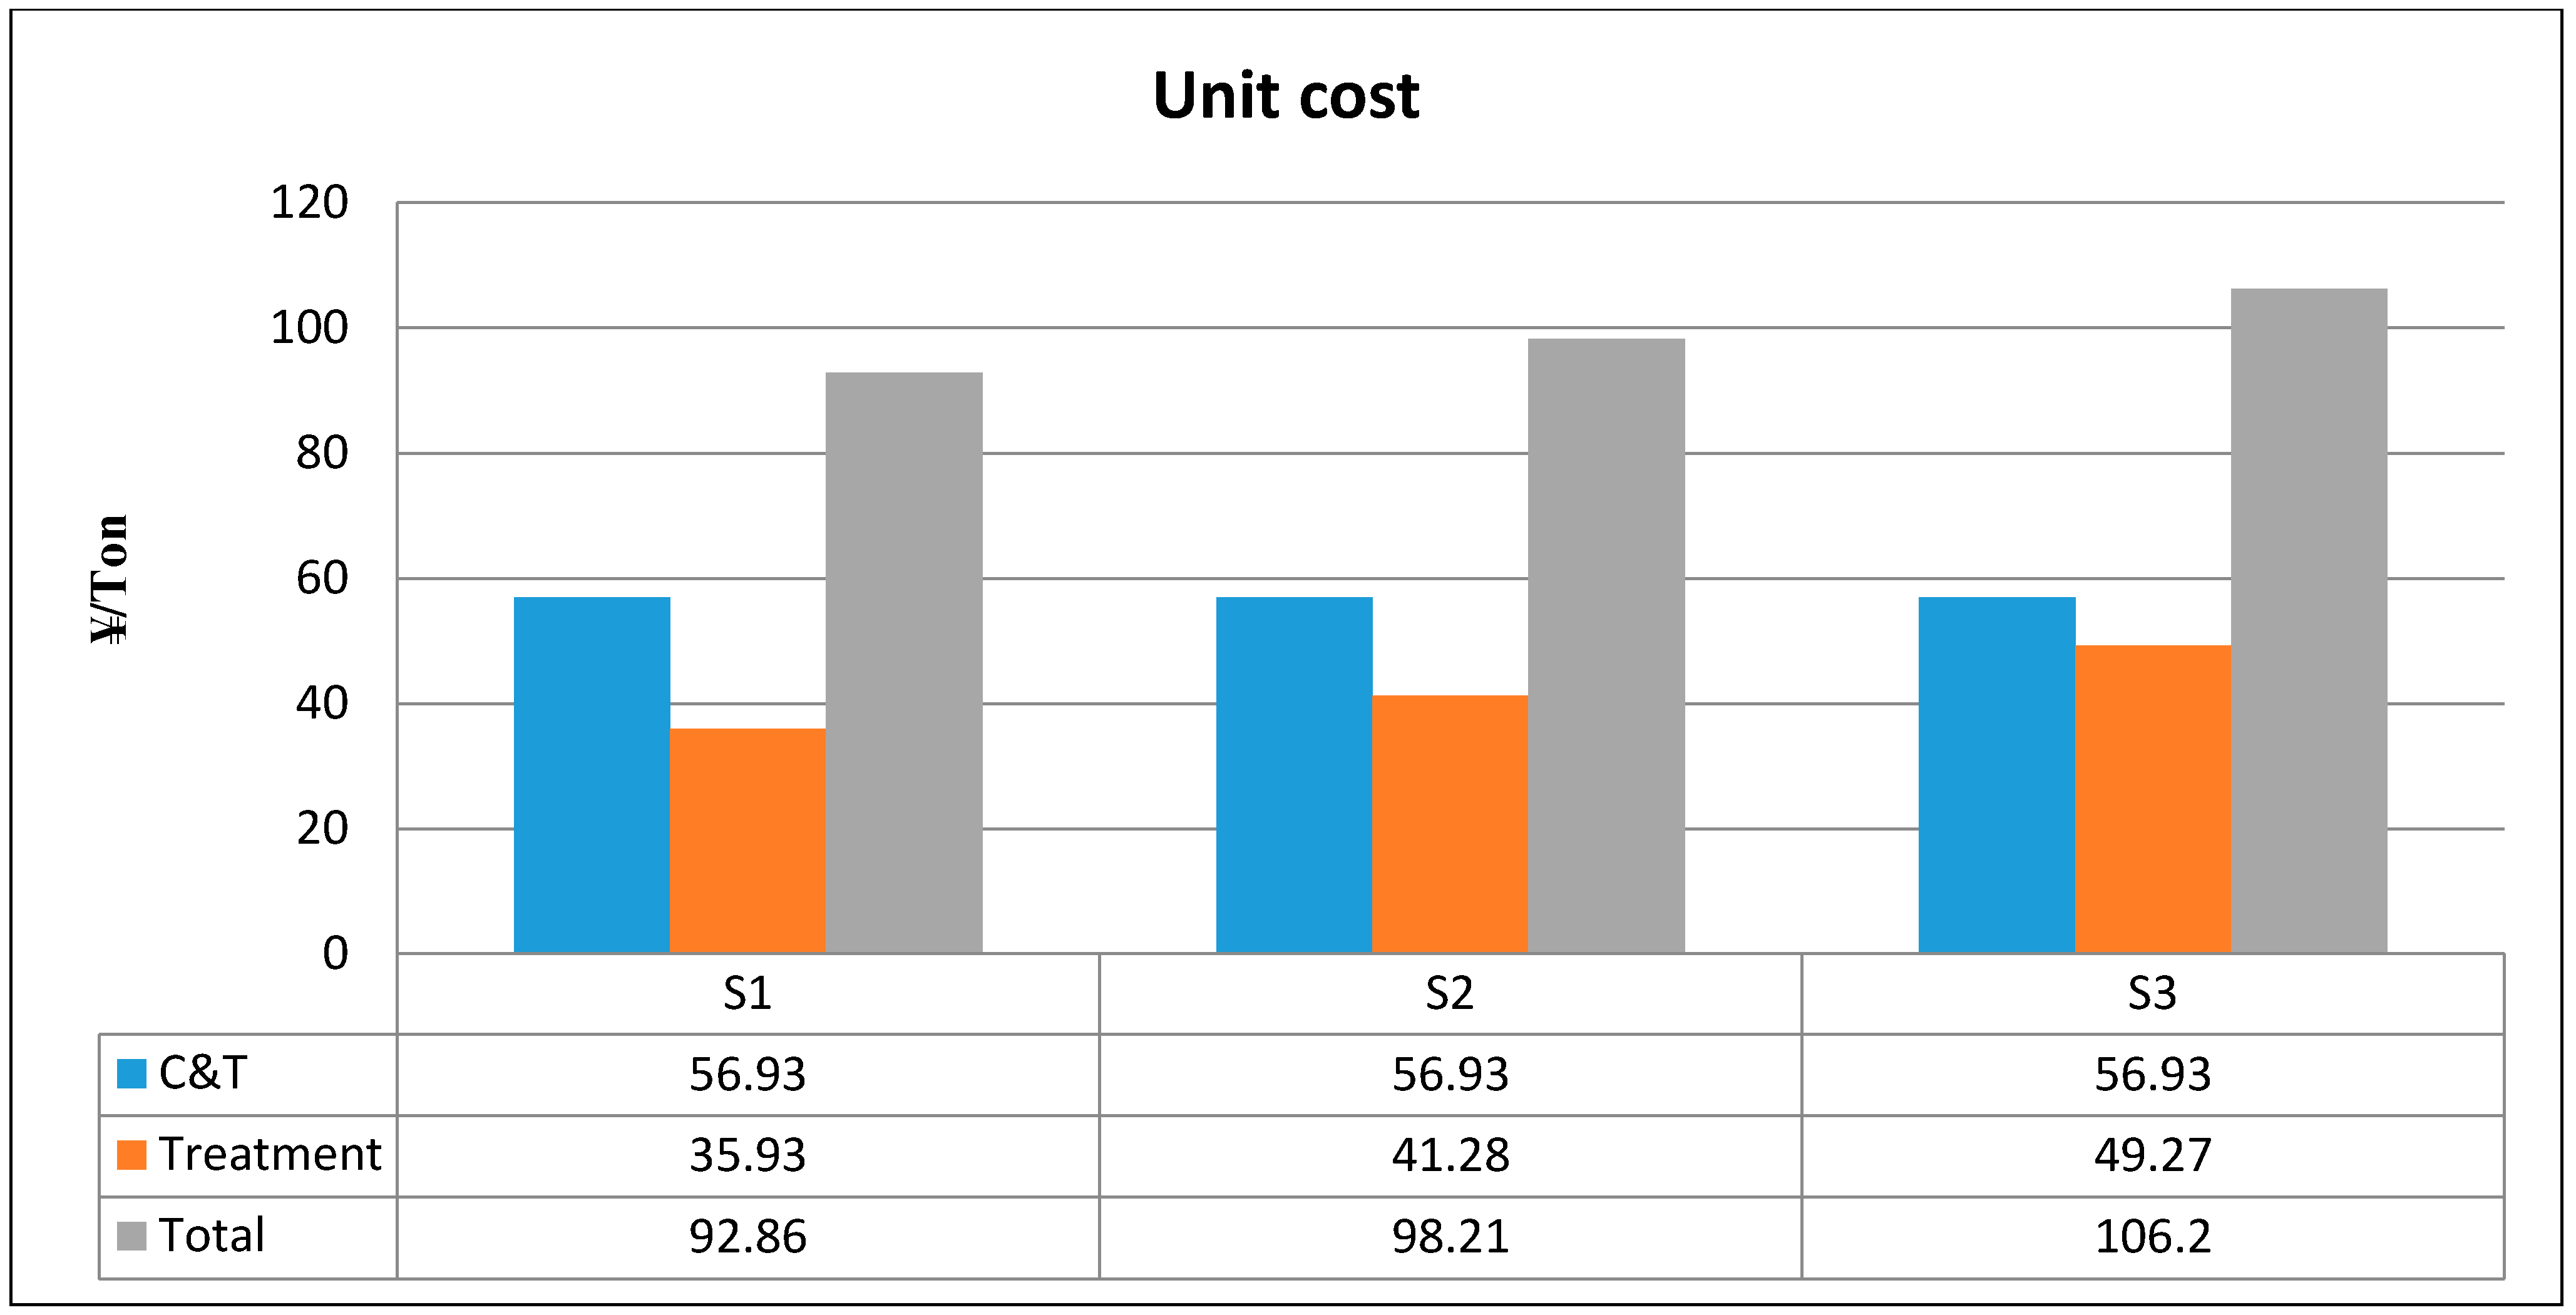
3.3. Economic Assessment

The FCA results of unit cost (UC) for Scenarios 1, 2, and 3 were ¥92.86/ton (USD $14.98/ton), ¥ 98.21/ton (USD $15.84/ton), and ¥ 106.2/ton (USD $ 17.13/ton) (Figure 6). In terms of economic sustainability, the result for the unit cost under the FCA was in accordance with most previous studies [13,26]. That is, it confirmed that the use of landfill treatment sites is the most economically effective way to help achieve the protection of both human health and a sustainable environment. The landfill scenario cost the least, and although it ranked second in the HRA, it scored only marginally less than the MRF and composting scenario.
Figure 6. Unit cost of the three scenarios.
Sustainability 07 01116 g006

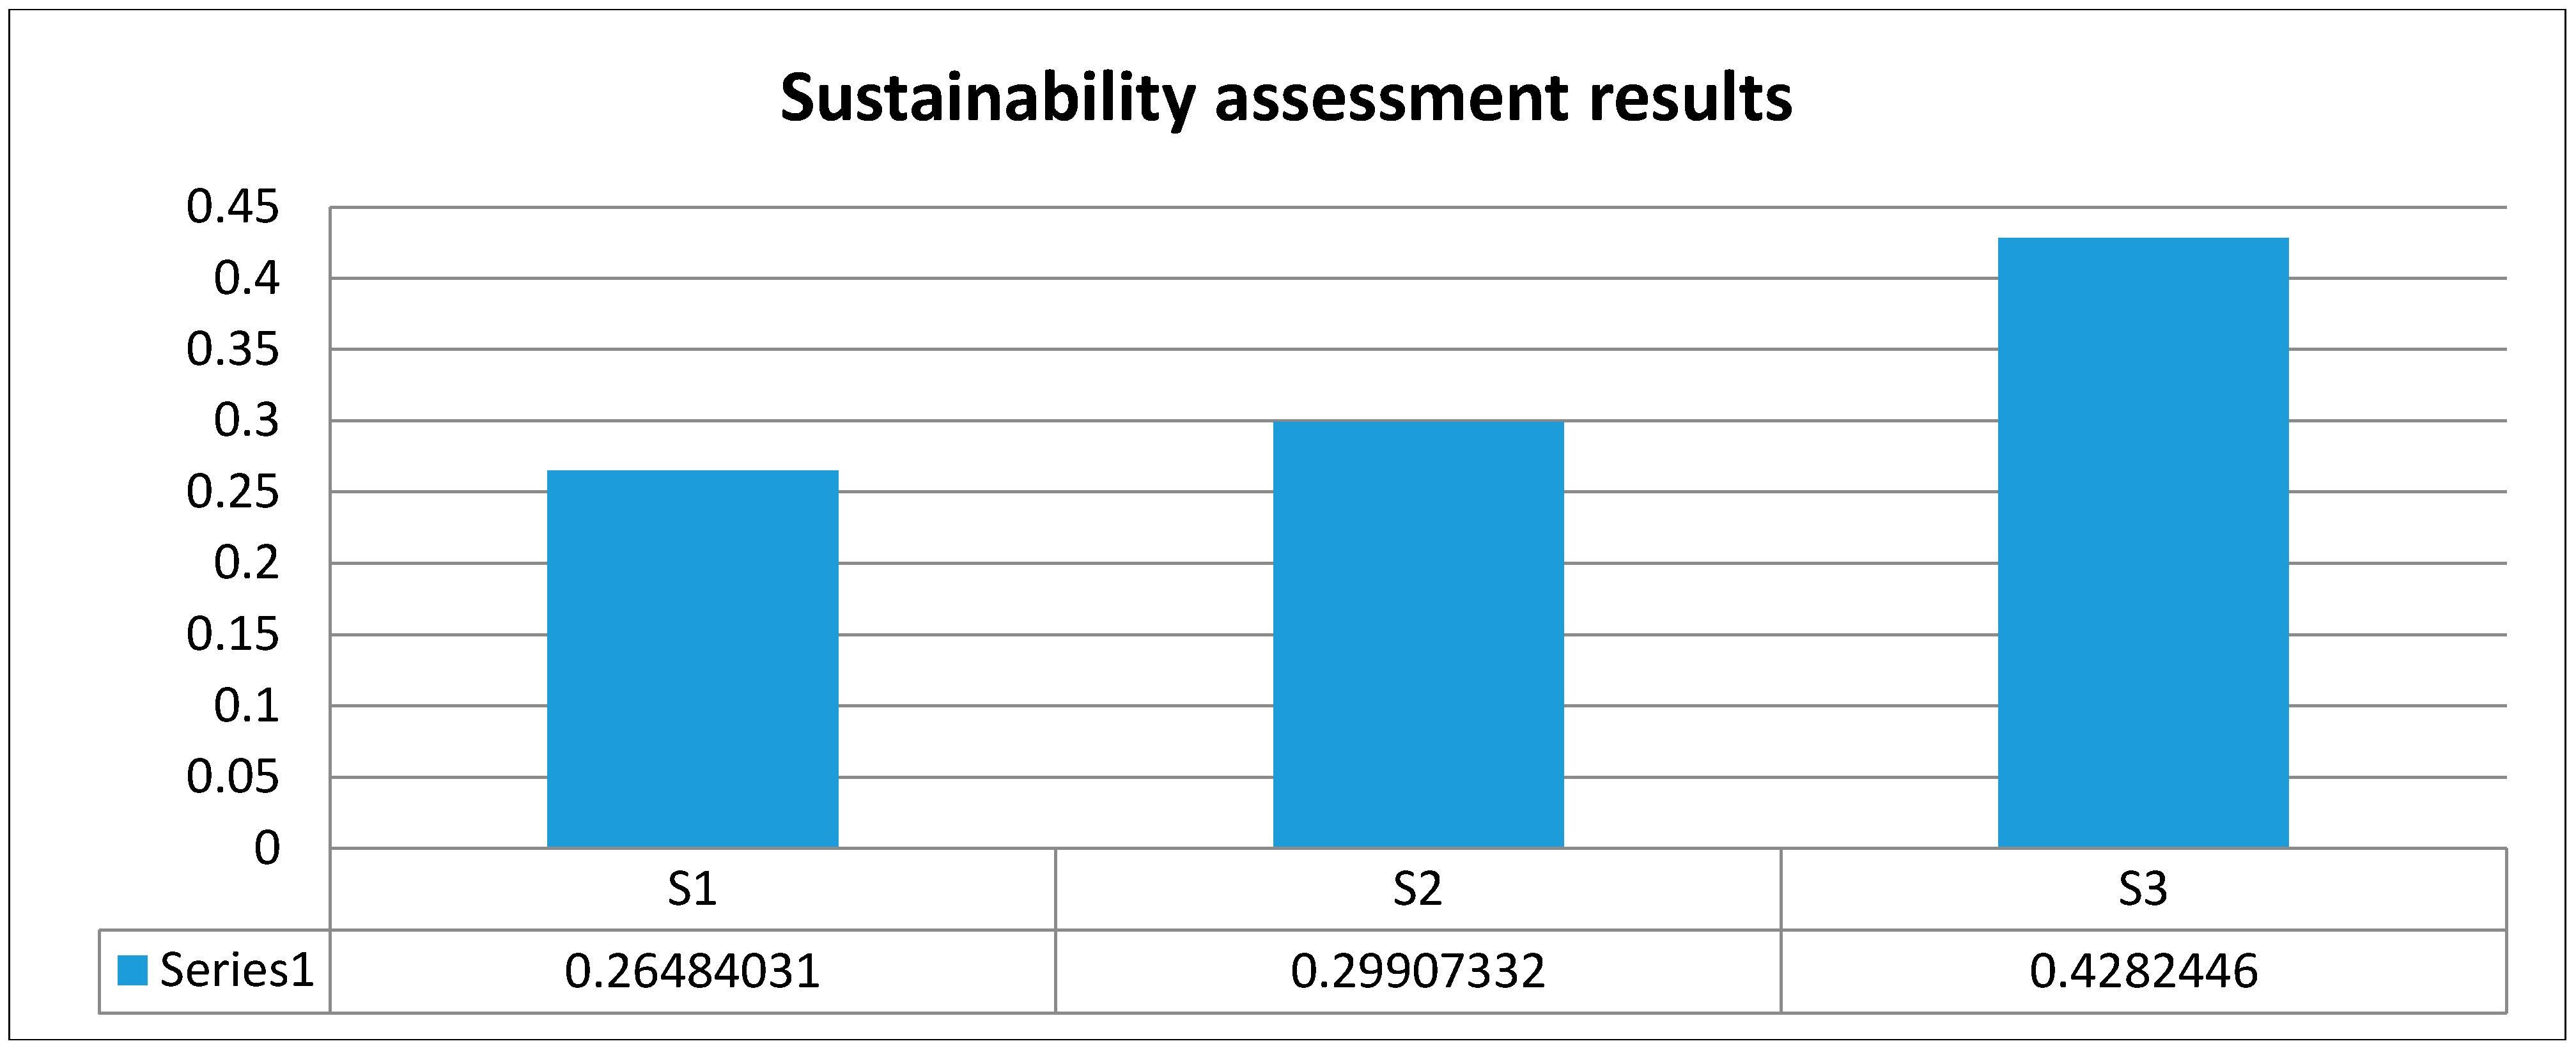
3.4. Integrated Sustainability Assessment

The pairwise comparisons of the scenarios to a given criteria are based on the quantitative results of the EIP, HI, ILCR, and UC derived from the three scenarios. These priority results are shown in Table 6.
Table 6. Priority of strategy options against three criteria.
Environmental SustainabilityScenario 1Scenario 2Scenario 3Priority
Scenario 111/71/30.0758
Scenario 27130.5848
Scenario 331/310.3392
Social SustainabilityScenario 1Scenario 2Scenario 3Priority
Scenario 1121/20.2857
Scenario 21/211/40.1428
Scenario 32410.5714
Economic SustainabilityScenario 1Scenario 2Scenario 3Priority
Scenario 11230.5401
Scenario 21/2120.2968
Scenario 31/31/210.1630
The second step was to assess the pairwise comparisons of environmental, social, and economic criteria to the final sustainability goal based on stakeholders’ opinions and decision-makers’ judgments, which are presented in Table 7.
Table 7. Priority of criteria against sustainability goal.
Overall SustainabilityEnvironmentalSocialEconomicPriority
Environmental11/220.2968
Human health 2130.5401
Economic1/21/310.1630
Third, the SAM synthesizes and calculates a set of overall priorities for the hierarchy. In addition, a sensitivity analysis is conducted for testing the priority of environmental, social, and economic criteria against the overall sustainability goal. The final sustainability assessment results integrated by the AHP are presented in Table 8.
Table 8. Final sustainability assessment results using the Analytic Hierarchy Process AHP a.
CriterionPriority of Criteria with Respect to the Sustainability GoalAlternatives (Scenarios)Priority of Scenario with Respect to CriteriaPriority of Criteria with Respect to GoalsOverall Priority of the Scenario with Respect to the Goals
ABC
ENV0.2968(1) Scenario 10.07580.29680.02250
(2) Scenario 20.58480.29680.17357
(3) Scenario 30.33920.29680.10067
SOC0.5401(4) Scenario 10.28570.54010.15431
(5) Scenario 20.14280.54010.07712
(6) Scenario 30.57140.54010.30861
ECO0.1630(7) Scenario 10.54010.16300.08804
(8) Scenario 20.29680.16300.04838
(9) Scenario 30.16300.16300.02657
a ENV = Environment, SOC = Social/health risk, ECO = Economic.
On this basis, the integrated assessment results of the three scenario options were: Scenario 1 = 0.27, Scenario 2 = 0.30, and Scenario 3 = 0.43, as shown in Figure 7.
Putting these environmental, social (health risk), and economic sustainability elements together, we can conclude that the MRF and composting options are preferable to the WTE incineration and landfill only option, which is a result that in accordance with, or to be more exact in coincidence with, a sequence from waste management hierarchy. However; the coincidence has a different meaning: the sustainability performance of a MSWM plan or program depends on more than just the traditional recycling rate or recovering rate. It is far more complex and dynamic and it requires a more scientific method of analysis and evaluation. Based on SAM results, decision makers have general advice on the available choices for MSWM. More importantly, however, they can also use our findings to gain knowledge of the potential outcomes and impact of each of the alternatives that are available to them; which makes their decision-making process more robust than a rigid waste management hierarchy.
Figure 7. Sustainability assessment result under Analytic Hierarchy Process (AHP).
Sustainability 07 01116 g007

3.5. Sensitivity Analysis

The dynamic and inclusive nature of MSWM involves many uncertain factors so a series of sensitivity analyses were conducted. Four major issues were identified.

3.5.1. Sensitivity Analysis of the Gross Recovery Rate by the WTE Plant on EIP

The first sensitivity analysis test assessed the gross recovery rate of the WTE plant (Figure 8). The 20% gross recovery rate adopted in this study was based on the proposed parameters of the designed WTE plant in Zhangqiu City. However, many other WTE incinerators in use have a gross recovery rate of about 30% and an even higher rate is possible. Therefore, we used a series of gross recovery rates from zero to 30%. When no energy is recovered and whatever energy is generated is totally wasted on incineration, the EIP is 0.034. However, whenever any energy is recovered, the EIP decreases. A recovery rate as low as 15% can improve Scenario 2 enough to yield a net environmental benefit. Thus, the gross recovery rate appears to be crucial for benefits when implementing a WTE plant.
Figure 8. Sustainability assessment result under Analytic Hierarchy Process (AHP).
Sustainability 07 01116 g008

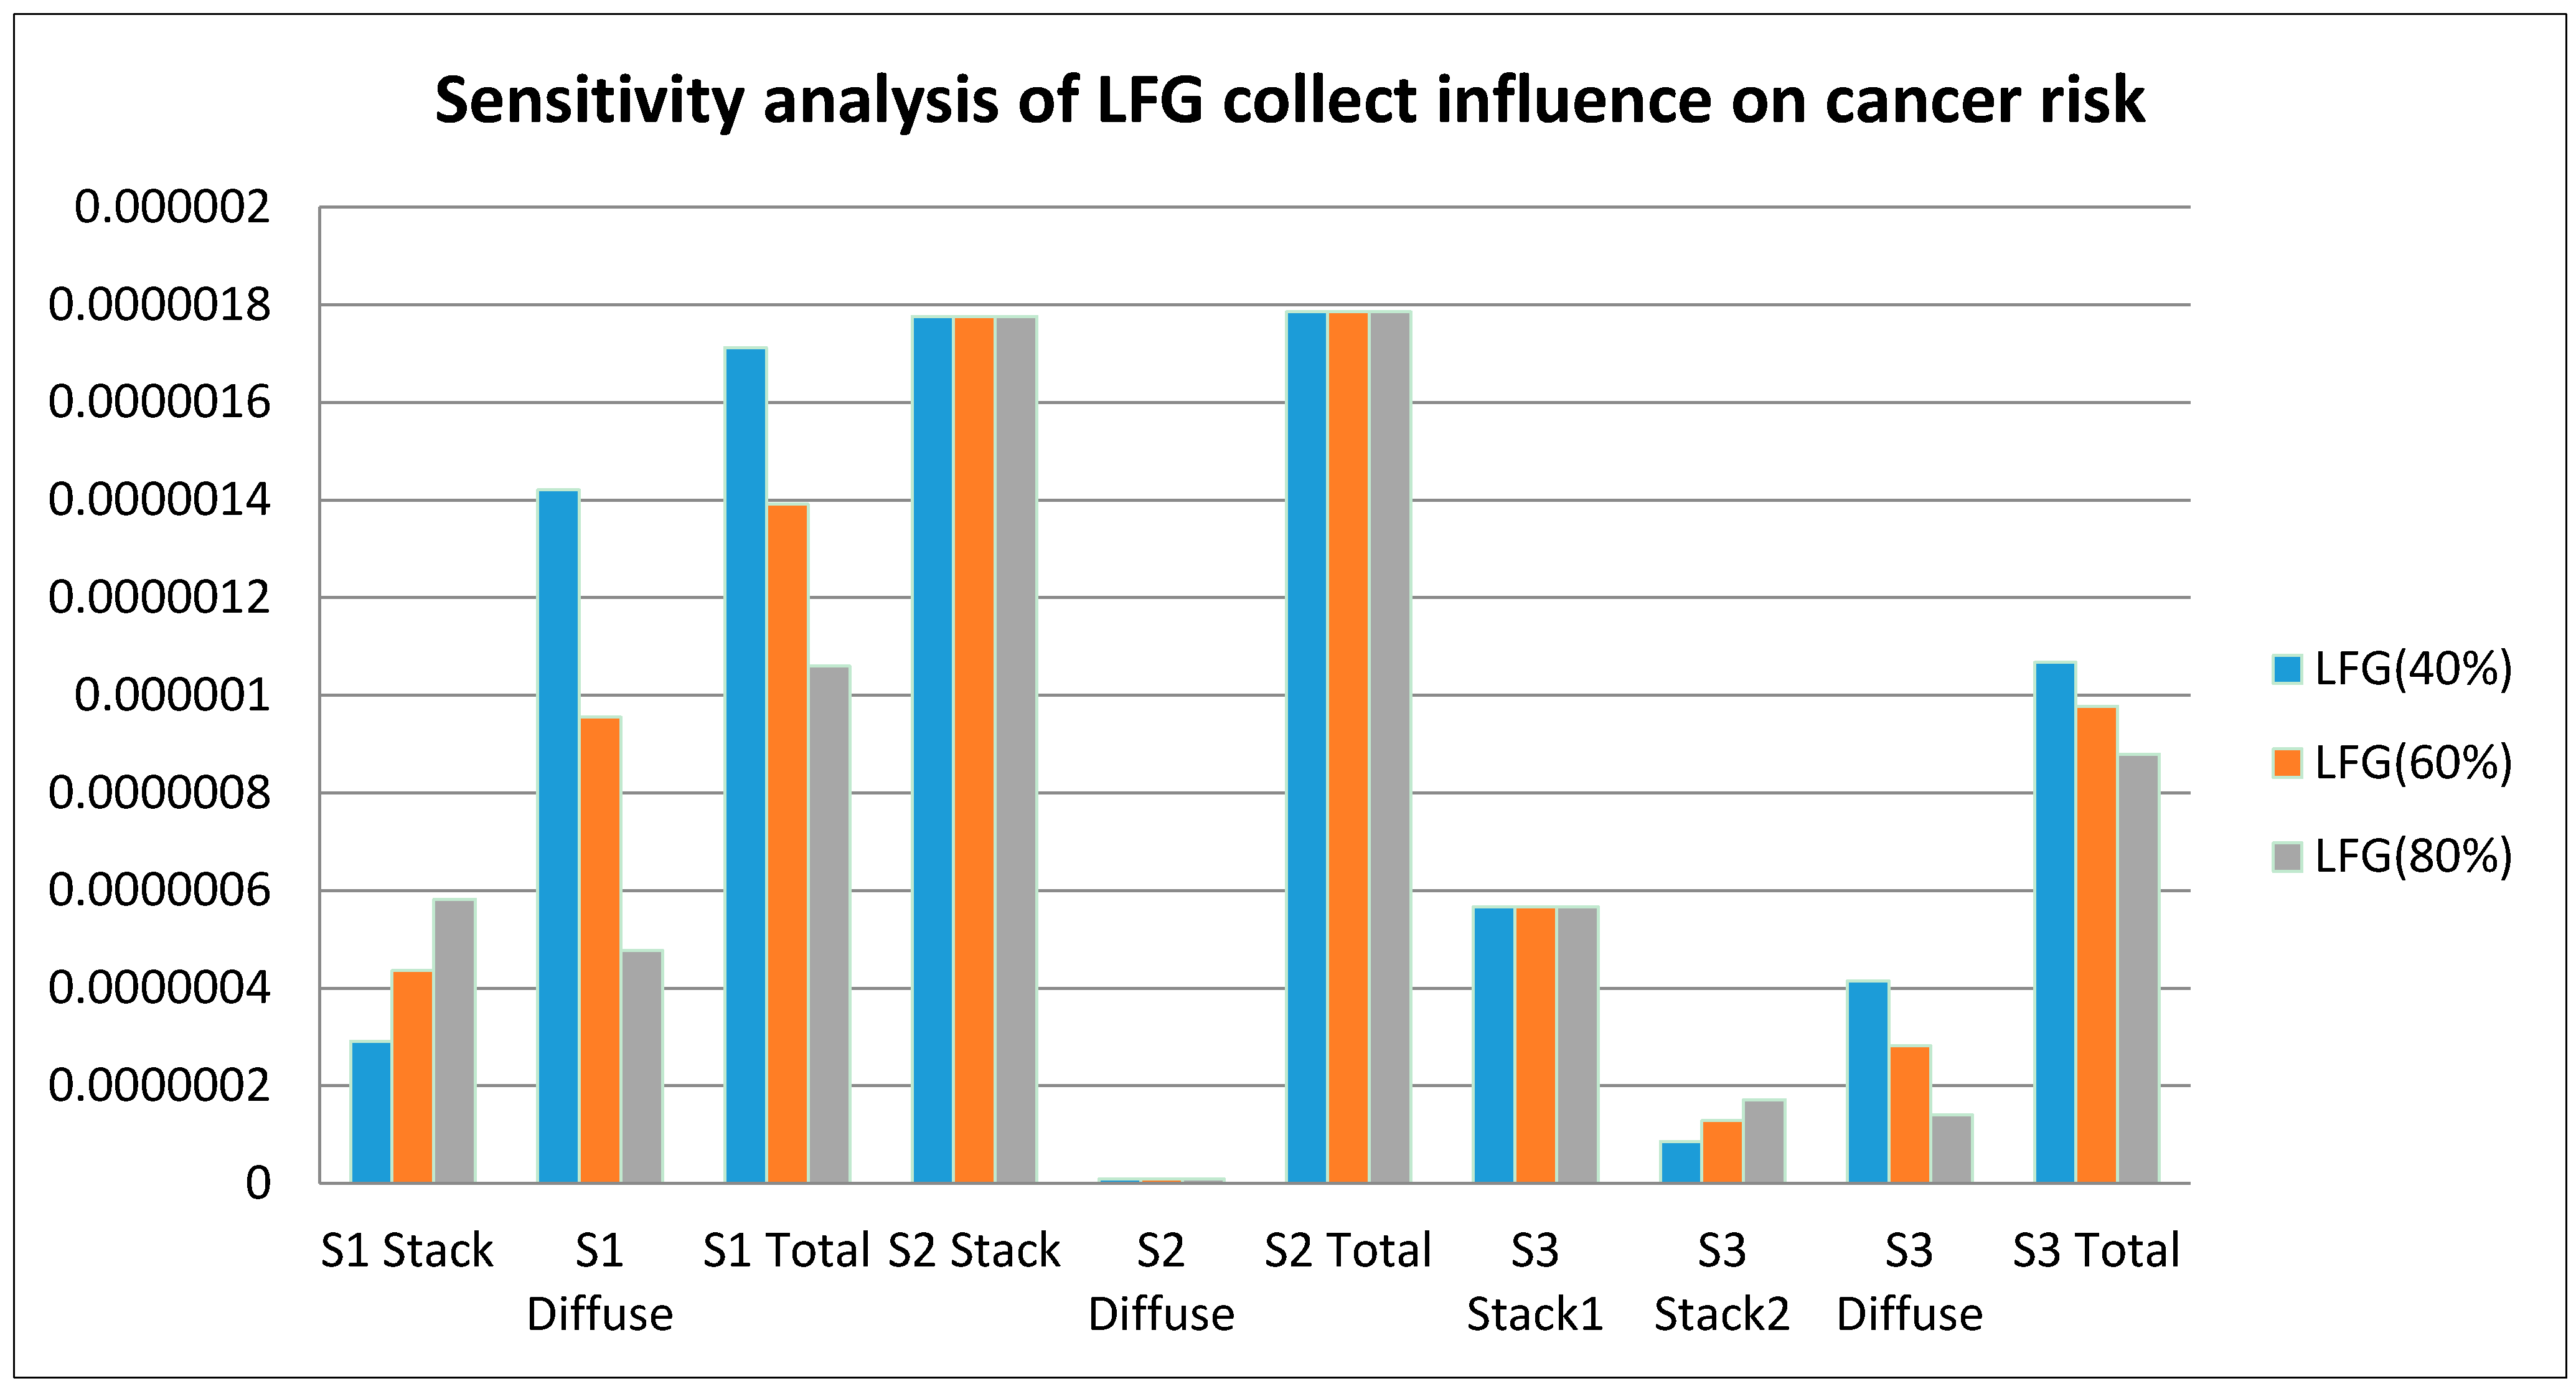
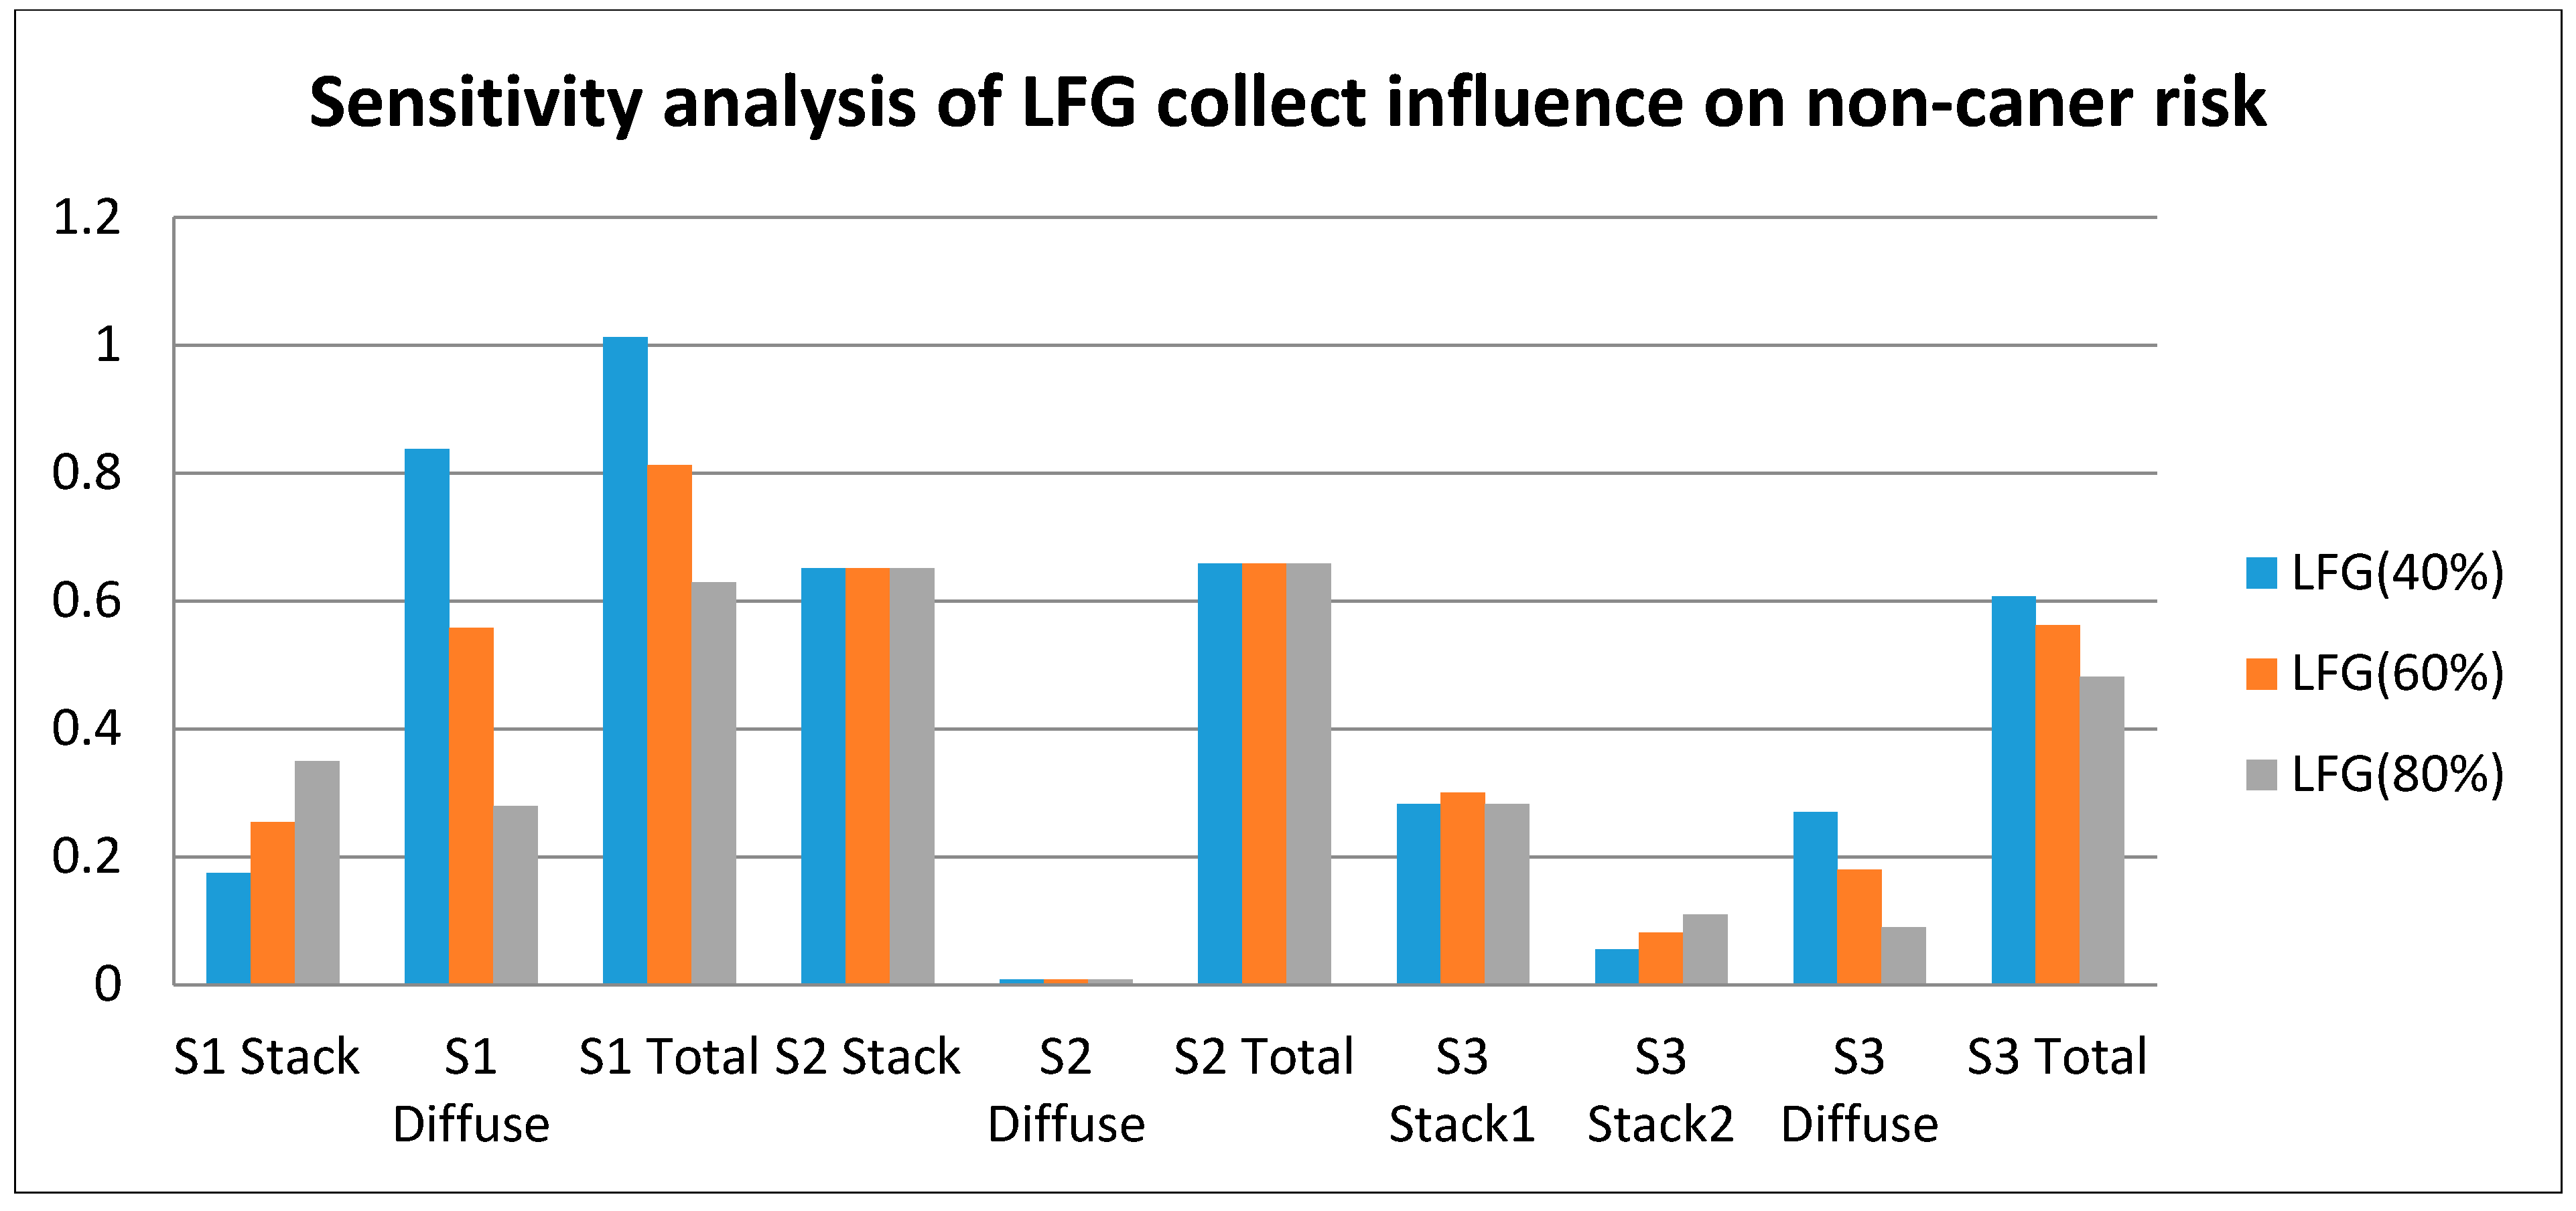
3.5.2. Sensitivity Analysis of LFG Collection Rate on ILCR and HI

In the HRA, the source of emissions of COPCs was divided into point sources through smokestacks and area sources of the landfill plant. A high collection rate of LFG means that more COPCs are emitted through point source smokestacks and may therefore create relatively less health risk to its receptors due to the nature of their dispersion. Reasonable LFG collection rates of 40% and 80% are used as the lower and upper values to test whether this factor can have an influence on the HRA results. The results are shown in Figure 9 and Figure 10.
Figure 9. Sensitivity analysis of Landfill gass (LFG) collection rate’s influence on Hazard Index (HI).
Sustainability 07 01116 g009
In Scenario 1 and Scenario 3, the HI and ILCR values are sensitive to the LFG collection rate. Under the 40% LFG collection rate, Scenario 1 has an HI value greater than 1.01. Scenario 2 is assumed to not generate LFG because its slag is treated as inert material and it is therefore not involved in this part of the analysis. Scenario 3 has an HI value of 6.10 × 10⁻¹, which is very similar to 6.61 × 10⁻¹, which is Scenario 2’s value. At the lower LFG collection rate of 40%, the ILCR values are 1.71 × 10⁻⁶ and 1.07 × 10⁻⁶ in Scenarios 1 and 3, respectively.
Under the 80% LFG collection rate, the HI in Scenario 1 is 6.29 × 10⁻¹, which is greater than the rate in Scenario 2. Scenario 3 has an even lower HI value (4.81 × 10⁻¹). With respect to ILCR, under the upper LFG collection rate of 80%, the ILCR value in Scenarios 1 and 3 are 1.06 × 10⁻⁶ and 8.79 × 10⁻⁶, respectively.
Figure 10. Sensitivity analysis of Landfill gas (LFG) collection rate’s influence on Increase Lifetime Cancer Risk (ILCR).
Sustainability 07 01116 g010

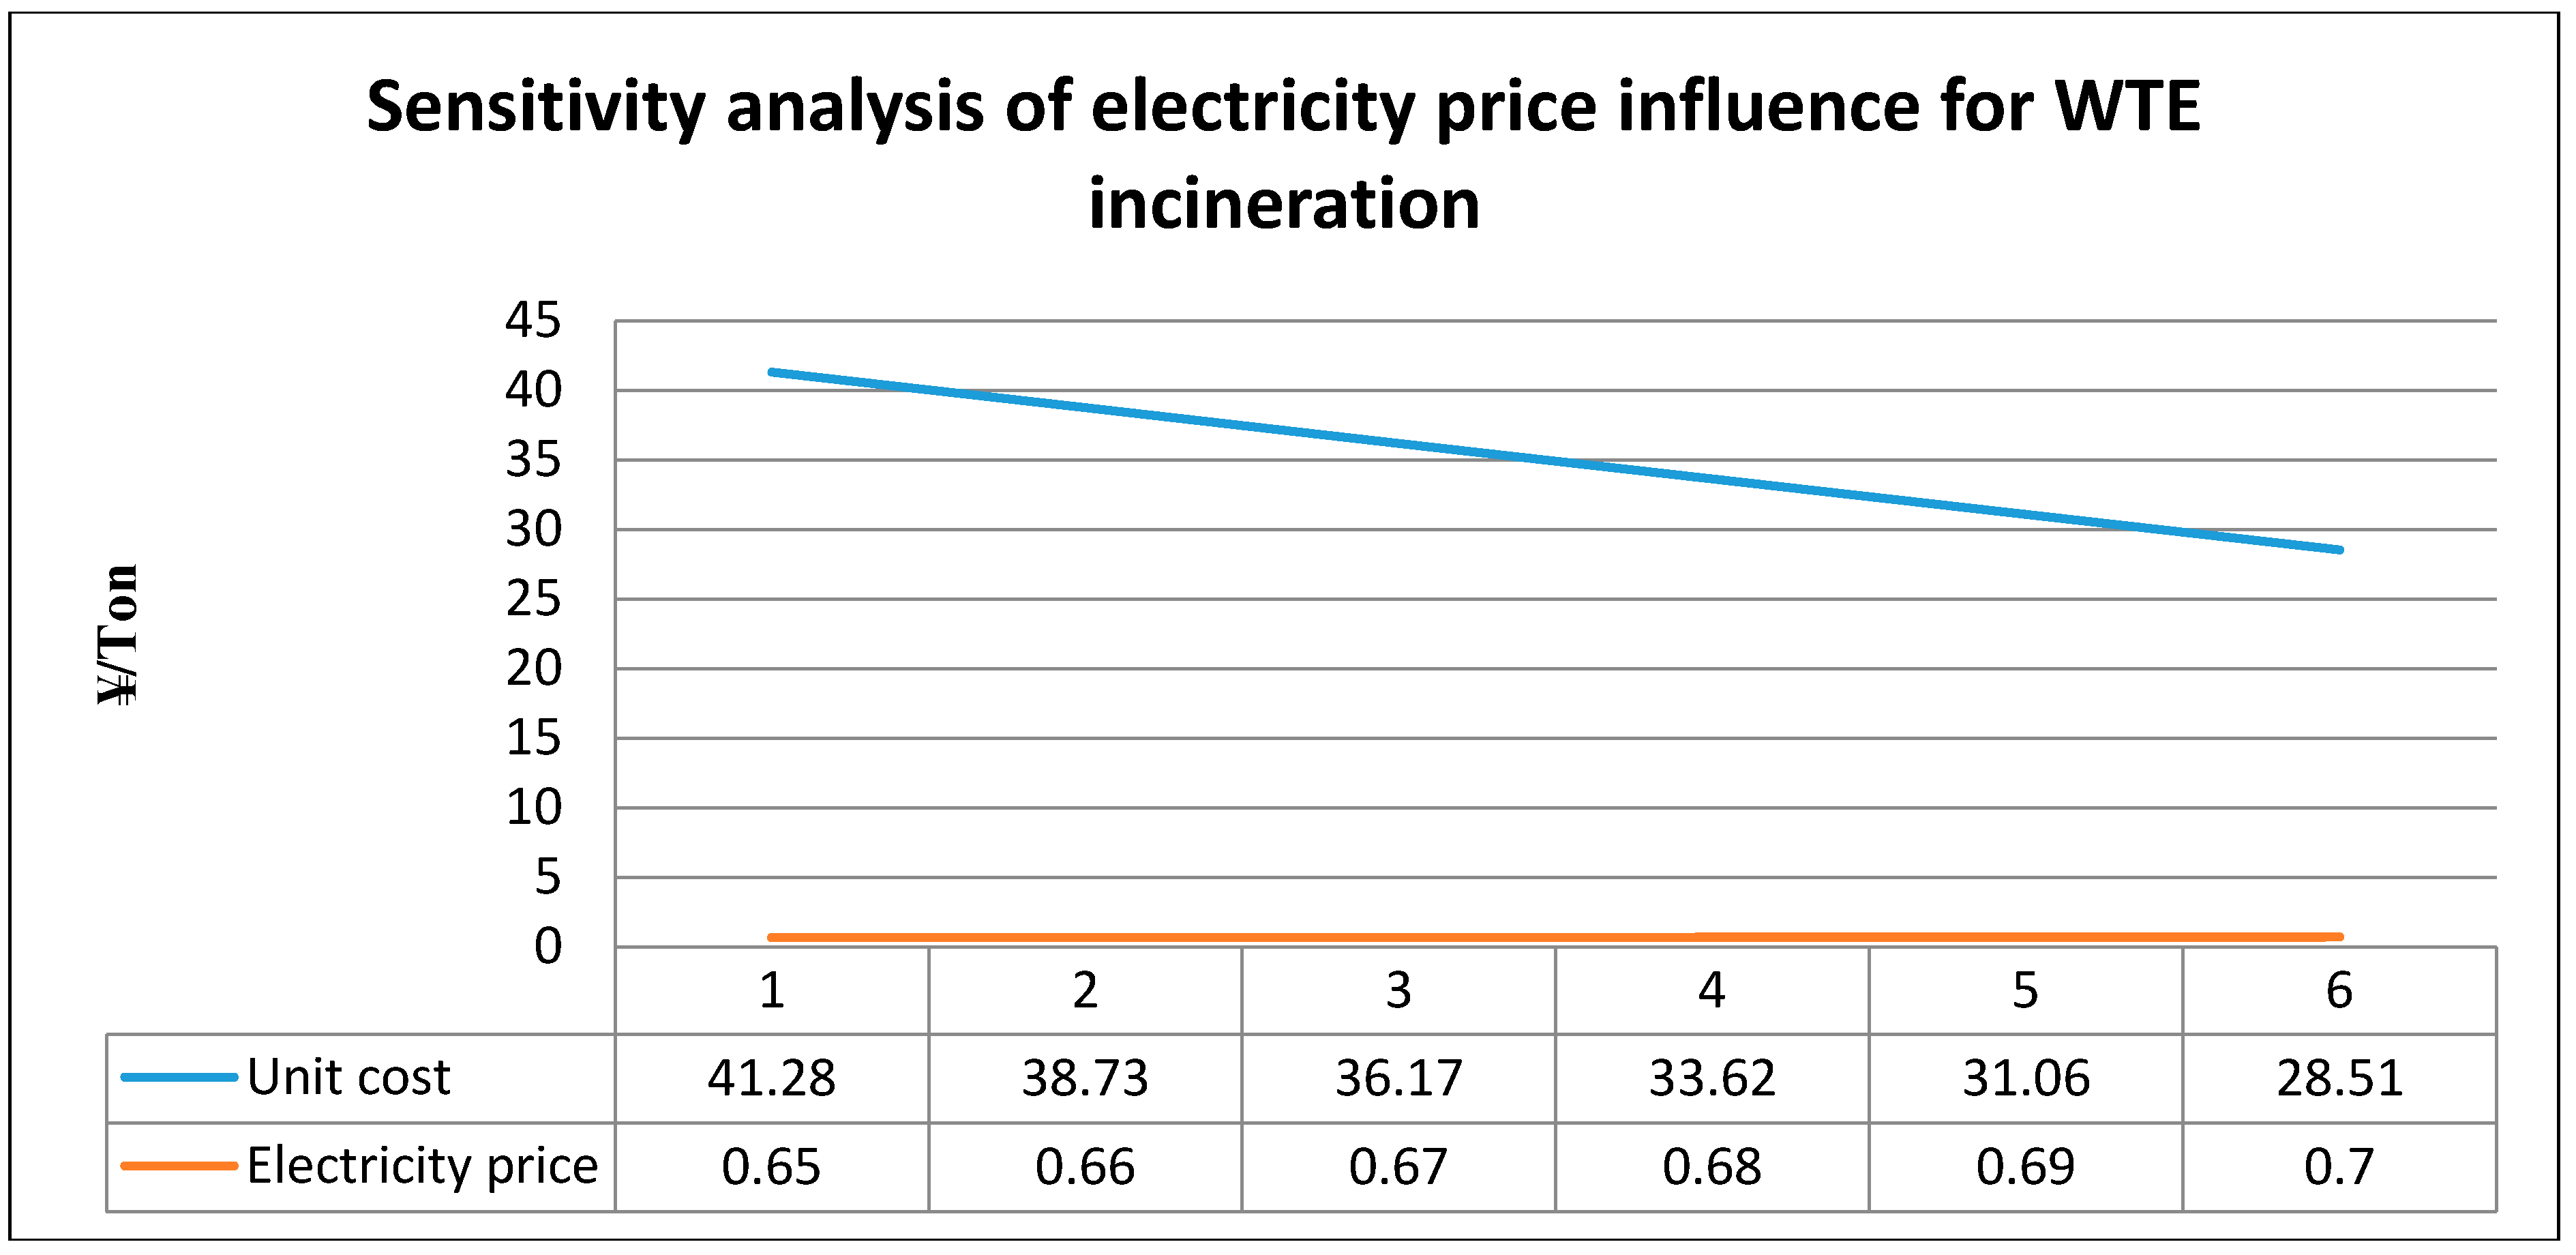
3.5.3. Sensitivity Analysis of Electricity Costs on FCA

The sensitivity analysis of electricity sale price (costs) on WTE incineration was conducted to assess the change of unit cost for WTE incineration associated with a one–cent (USD $0.0016) change in electricity cost. As Figure 11 shows, an increase of ¥ 0.01/kwh (kilowatt hours) will decrease unit cost of ¥ 2.55/ton. In other words, the s (SAF) increased to 4 (a 0.077% increase in electricity cost was projected to result in 0.31% less per unit cost), suggesting that the unit cost is sensitive to electricity cost.
Figure 11. Sensitivity analysis of electricity sale price influence for Waste-to-Energy (WTE) incineration.
Sustainability 07 01116 g011

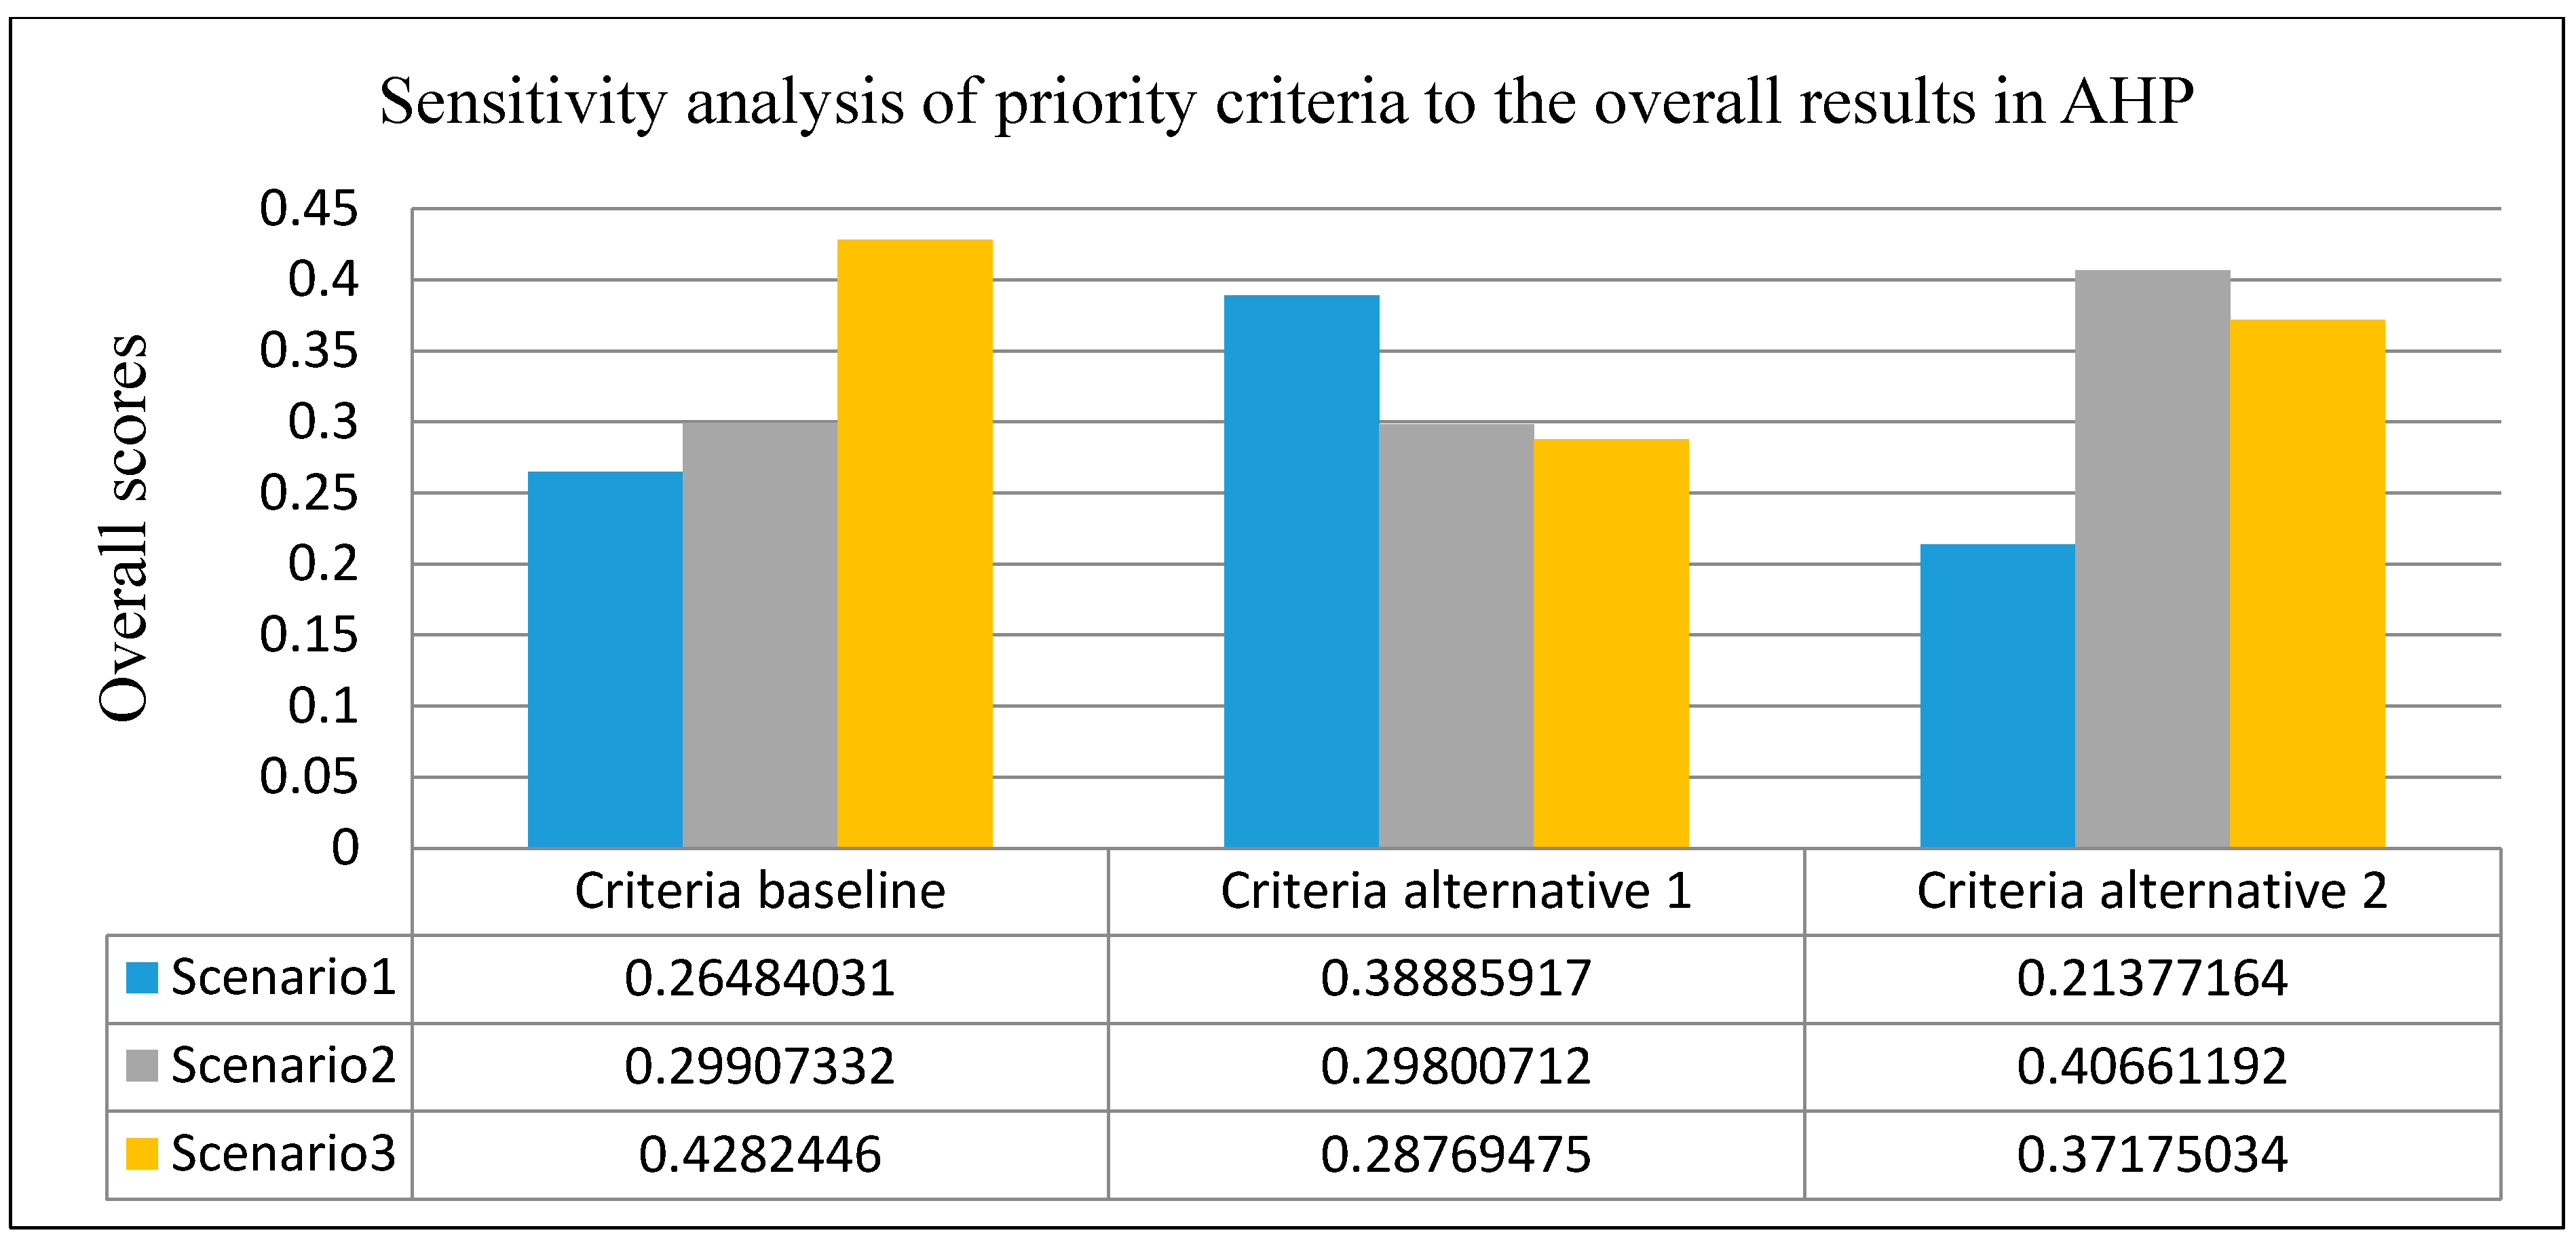
3.5.4. Sensitivity Analysis of the Priority Criteria to the Overall Result of the AHP

The AHP sensitivity analysis was performed by changing different priorities of criteria with respect to the goal under the assumption that they are derived from decision makers and stakeholder’s participation. Criteria alternative 1 attributes the priority weight of 0.5401, 0.2968, and 0.1630 for scenario 1, scenario 2 and scenario 3, respectively. Criteria alternative 2 attributes the priority weight of 0.5401, 0.2968, and 0.1630 for scenario 2, scenario 3 and scenario 1, respectively. The results of this sensitivity analysis are presented in Figure 12.
Figure 12. Sensitivity analysis of priority of criteria to the overall results in Analytic Hierarchy Process (AHP).
Sustainability 07 01116 g012
Under Criteria Alternative 1, Scenario 1 becomes the best overall sustainable option when economic criteria is assigned the highest weight, and scenario 2 becomes the best sustainable option under Criteria Alternative 2 when environmental criteria is assigned the highest weight. It shows that the priorities of criteria (weights assigned to environmental, social and economic sustainability categories) against the overall goal (overall sustainability) play an important role in the final position of AHP. And this point also reflects the importance of stakeholder’s participation for a given locality; this give SAM the attribute of a site-specific tool for case-by-case analysis in a customized manner, rather than providing a universal solution for all regions.

3.6. Discussion

The policy implications of obtained results usually depend on the goals of the policy [17]; the core of implementing a MSWM strategy is the consideration of the ways that sustainability performance may be measured [46]. The results of this study using a SAM suggest that decision-makers may rely on the available options for MSWM strategies. More broadly, SAM has the potential for application in many different contexts and localities, and the SAM results may or may not be the same as the SAM results from Zhangqiu City. Specifically, implications from the SAM application in Zhangqiu Case study brings several implications as follow:
(1) MSWM should be adopted in a ‘site specific’ manner using sustainability principles, this is demonstrated in the sensitivity analysis of AHP, as stakeholders’ opinion affect the pair wise weight ratio of environmental, social and economic criteria against the overall sustainability goal, and stakeholders mainly come from the locality, so the local demands play a key role in deciding the priority of MSWM alternatives (scenarios). In this regard, this study supports Davidson, (2011), who concluded that “conditions vary, therefore, procedures must also vary accordingly to ensure that these conditions can be successfully met” [15]. That means the particular mix of waste treatment methods implemented in any IWM system will be dependent upon the prevailing local conditions [15]. Public feedback in this step is for far more than just to help build public acceptance, it should be part of decision-making elements.
The strong dependence of each SAM on local conditions captures the local specific conditions in the modeling of MSWM system, allows identifying critical problems and proposing improvement options adapted to the local specificities [47], as emphasized by Laurent,(2014) In this regard, the quality of the provided support to decision and policy-makers is strongly dependent on a proper conduct of the life cycle inventory construction [48], improved access to waste data will help craft appropriate MSWM strategies towards sustainable MSWM. Therefore, this study suggests building a broader life cycle inventory database, which includes the basic statistics of MSWM unit process inputs and outputs, operation parameters and algorithms in the calculation, and allows users and researchers in their subject area to search for data specific to unit processes, structures, equipment, or various life cycle inventory (LCI), which is a basis for any sustainability assessments.
(2) MSWM technological contents (technological advancement and efficiency) is more meaningful than the technologies themselves, as shown in the sensitivity analysis; LFG collection rate has significant influence on HRA for landfill and compost and the gross recovery rate of WTE plant has significant influence on the EIP results due to the credits it gained by replacement of the local power net. Furthermore, gas-cleaning technology decides the gas emissions for WTE and compost, which also affects their HRA outcome. That is the SAM outcome is closely related to the technological advancement and efficiency of the treatment facility.
(3) MSWM system is highly dynamic and interrelated; it requires identifying the range of potential options that are suitable for managing waste with cost estimates, risk assessments, and available processing facilities. For example, the high sensitivity to electricity price of the WTE may demand high public subsidy, thus, MSWM should be based on the waste management system analysis, as systems analysis can provide information and feedback that is useful in helping to define, evaluate, optimize and adapt waste management systems [49]. That means, to achieve sustainable MSWM, a preferred MSWM solution should be environmental effectiveness, but also economic viability and be socially acceptable; hence all three areas must be addressed simultaneously [41].

4. Conclusions

In general, the SAM is useful in shaping “sustainable MSWM”. The demonstration of the use of SAM provides flexibility by allowing assessment for a given MSWM strategy on a case-by-case basis [50], taking into account site-specific factors; each locality can use their own criteria to best meet its particular needs and circumstances to determine their favorable options based on their priority order for sustainable development. The formal involvement of stakeholders’ interests in the SAM is fully embedded into a decision-making process for a locality. Sensitivity analysis describe the variability in the model outputs that are generated by plausible variation in the inputs [26] on the one hand, and identifies the most important input variables that are critical to the outcome of sustainability assessment on the other hand. Based on the information provided by such kinds of assessment, decision-makers may get advice on the available choices for MSWM strategy options. More importantly, they gain knowledge of the potential outcomes and impacts of each of the alternatives, which makes their decision-making process more robust.

Acknowledgments

Great thanks are given to the China Scholarship Council under the grant number 201207720038.

Author Contributions

Hua Li and Vilas Nitivattananon conceived and designed the research; Hua Li and Peng Li performed the data collection. Hua Li and Peng Li analyzed the data; Hua Li drafted the paper; Vilas Nitivattananon reviewed the paper and made several comments and suggestions for revision.

Conflicts of Interest

The authors declare no conflict of interest.

References

  1. Lim, M. Full Cost Accounting in Solid Waste Management: The Gap in the Literature on Newly Industrialized Countries. JAMAR 2011, 9, 21–36. [Google Scholar]
  2. Bruntland, G.H. Our Common Future: The World Commission on Environment and Development; Oxford University Press: Oxford, UK, 1987. [Google Scholar]
  3. Mcdougall, F.; White, P.; Franke, M.; Hindle, P. Integrated Solid Waste Management: A Life Cycle Inventory, 2nd ed.; Blackwell Science Ltd.: Oxford, UK, 2001. [Google Scholar]
  4. United Nations Environment Programme. Solid Waste Management; CalRecovery, Inc.: Stanwell Drive Concord, CA, USA, 2005. [Google Scholar]
  5. Asase, M.; Ernest, K.; Yanfu, L.; Mensah, M.; Stanford, J.; Amponsah, S. Comparison of municipal solid waste management systems in Canada and Ghana: A case study of the cities of London, Ontario, and Kumasi, Ghana. Waste Manag. 2009, 29, 2779–2786. [Google Scholar] [CrossRef] [PubMed]
  6. State Council of China. Announcement of the State Council for the Approval and Forwarding of the Suggestions of the Ministry of Housing and Urban-Rural Development and other Departments on the Further Enhancement of Municipal Solid Waste Treatment; Policy No. [2011] 9 of the State Council; State Council of China: Beijing, China, 2011. [Google Scholar]
  7. Chandra, Y.I.; Devi, N.L. Studies on Municipal Solid Waste Management in Mysore City—A case study. Rep. Opin. 2009, 1, 15–21. [Google Scholar]
  8. Ji, D.F.; Xia, X.F.; Liu, J.; Xi, B.D.; Haireti, T. Environmental impact assessment of municipal solid waste disposal in Beijing. Chin. J. Environ. Eng. 2011, 5, 793–799. [Google Scholar]
  9. Lu, K.Y. Scenario Analysis of Municipal Solid Waste Management System in Shanghai. Available online: http://www.jsrsai.jp/Annual_Meeting/PROG_49/Resume1/rA10-6%20LuKeyu.pdf (accessed on 1 January 2015).
  10. Huang, W.Y.; Helmut, Y.; Takeshi, M.; Yoshiro, H. Life cycle Assessment of Municipal Solid Waste Management in Chinese urban areas: Case study in Chongqing City. Available online: http://www.jsrsai.jp/Annual_Meeting/PROG_49/Resume1/rA08-2%20wenyu%20HUANG.pdf (accessed on 10 January 2015).
  11. Zhao, Y.; Wang, H.T.; Lu, W.J.; Damgaard, A.; Christensen, T.H. Life-cycle assessment of the municipal solid waste management system in Hangzhou, China (EASEWASTE). Waste Manag. Res. 2009, 27. Article 399. [Google Scholar]
  12. Wei, B.R.; Wang, J.; Tahara, K.; Kobayashi, K.; Sagisaka, M. Life cycle assessment on disposal methods of municipal solid waste in Suzhou. China Popul. Resour. Environ. 2009, 19, 93–97. [Google Scholar]
  13. Xu, C.; Yang, J.X.; Wang, R.S. Life cycle assessment for municipal solid waste treatment and utilization. J. Environ. Sci. 2000, 12, 225–231. [Google Scholar]
  14. Xu, D.C. Systematic Comparison of Municipal Solid Waste Management Systems: Case Studies of Dalian City, China and the Region of Waterloo, Canada. Master’s Thesis, University of Waterloo, Waterloo, ON, Canada, 2008. [Google Scholar]
  15. Davidson, G. Waste Management Practices: Literature Review Dalhousie University—Office of Sustainability. Available online: https://www.dal.ca/content/dam/dalhousie/pdf/sustainability/Waste%20Management%20Literature%20Review%20Final%20June%202011%20(1.49%20MB).pdf (accessed on 1 January 2015).
  16. Tyskeng, S.; Finnveden, G. Comparing energy use and environmental impacts of recycling and incineration. J. Environ. Eng. 2010, 136, 744–748. [Google Scholar] [CrossRef]
  17. Finnveden, G.; Björklund, A.; Moberg, A.; Ekvall, T. Environmental and economic assessment methods for waste management decision-support: Possibilities and limitations. Waste Manag. Res. 2007, 25, 263–269. [Google Scholar] [CrossRef] [PubMed]
  18. China Academy of Science. China Sustainable Development Strategy Report 2009—China’s Approach towards a Low Carbon Future. Executive Summary. Available online: http://www.world-governance.org/IMG/pdf_China_Sustainable_Development_Strategy_Report_2009_WANG_Yi_english.pdf (accessed on 1 January 2015).
  19. Menikpura, S.N.M.; Gheewala, S.H.; Bonnet, S. Sustainability assessment of municipal solid waste management in Sri Lanka: Problems and prospects. J. Mater. Cycles Waste Manag. 2012, 14, 181–192. [Google Scholar] [CrossRef]
  20. International Organization for Standardization. 14040 International Standards in Environmental Management-Life Cycle Assessment—Principles and Framework; International Organization for Standardization: Geneva, Switzerland, 2006. [Google Scholar]
  21. International Organization for Standardization. 14044 International Standards in Environmental Management-Life Cycle Assessment—Principles and Framework; International Organization for Standardization: Geneva, Switzerland, 2006. [Google Scholar]
  22. United States Environmental Protection Agency (USEPA). Risk Assessment Guidance for Superfund Volume I: Human Health Evaluation Manual (Part F, Supplemental Guidance for Inhalation Risk Assessment); USEPA: Washington, DC, USA, 2009. [Google Scholar]
  23. United States Environmental Protection Agency (USEPA). Full Cost Accounting for Municipal Solid Waste Management: A Handbook; USEPA: Washington, DC, USA, 1997. [Google Scholar]
  24. Saaty, T.L. The Analytic Hierarchy Process; McGraw-Hill International: New York, NY, USA, 1980. [Google Scholar]
  25. Halog, A.; Manik, Y. Advancing integrated systems modelling framework for life cycle sustainability assessment. Sustainability 2011, 3, 469–499. [Google Scholar] [CrossRef]
  26. Kloepffer, W. Life cycle sustainability assessment of products. Int. J. LCA 2008, 13, 89–95. [Google Scholar] [CrossRef]
  27. Kloepffer, W. Life-cycle based sustainability assessment as part of LCM. In Proceedings of the 3rd International Conference on Life Cycle Management, Zurich, Switzerland, 27–29 August 2007.
  28. Shandong Academy of Environmental Science. Zhangqiu Municipal Solid Waste Incineration Power Plant BOT Project Environmental Impact Report; Shandong Academy of Environmental Science: Jinan, China, 2013. [Google Scholar]
  29. China Ministry of Environment. Standard for Pollution Control on the Landfill Site of Municipal Solid Waste; GB 16889-2008; China Environmental Science Press: Beijing, China, 2008. [Google Scholar]
  30. China Ministry of Environment. Environmental Management–Life Cycle Assessment–Goal and Scope Definition and Inventory Analysis; GB/T 24041-2000; China Environmental Science Press: Beijing, China, 2006. [Google Scholar]
  31. China Ministry of Environment. Standard for Pollution Control on the Municipal Solid Waste Incineration; GB18482-2012; China Environmental Science Press: Beijing, China, 2002. [Google Scholar]
  32. China Ministry of Construction. Standard for Construction on the Municipal Solid Waste Compost Project; China Environmental Science Press: Beijing, China, 1994. [Google Scholar]
  33. Hauschild, M.; Potting, J. Spatial Differentiation in Life Cycle Impact Assessment. Available online: http://www2.mst.dk/udgiv/publications/2005/87-7614-579-4/pdf/87-7614-580-8.pdf (accessed on 2 January 2015).
  34. Yang, J.X.; Wang, R.S.; Liu, J.L. Methodology of life cycle impact assessment for Chinese products. Acta Sci. Circumst. 2001, 21, 234–238. [Google Scholar]
  35. China Ministry of Environment. Ambient Air Quality Standards; GB3095-2012; China Environmental Science Press: Beijing, China, 2012. [Google Scholar]
  36. >China Ministry of Environment. Guidelines for the Environmental Impact Assessment of the Atmospheric Environment; HJ2.2-2008; China Environmental Science Press: Beijing, China, 2009. [Google Scholar]
  37. >China Ministry of Environment. Technical Guidelines for Risk Assessment of Contaminated Sites; HJ25.3-2014; China Environmental Science Press: Beijing, China, 2014. [Google Scholar]
  38. Stypka, T. Integrated solid waste management model as a tool of sustainable development. Available online: http://www2.lwr.kth.se/forskningsprojekt/Polishproject/rep12/StypkaSt.pdf (accessed on 2 January 2015).
  39. Halog, A.; Wei, B.; Sagisaka, M.; Inaba, A. A multi-attribute assessment of environmentally-sound electric vehicle battery technologies. J. Ind. Eng. 2004, 1, 40–59. [Google Scholar]
  40. >United States Environmental Protection Agency (USEPA). SCREEN3 Model User’s Guide; EPA-454/B-95-004; USEPA: Research Triangle Park, NC, USA, 1995. [Google Scholar]
  41. Mcdougall, F.R. The use of life cycle assessment tools to develop sustainable municipal solid waste management systems. Available online: http://www.bvsde.paho.org/bvsaidis/mexico2005/McDougall.pdf (accessed on 2 January 2015).
  42. European Commission, DG Environment. A Study on the Economic Valuation of Environmental Externalities from Landfill Disposal and Incineration of Waste. Available online: http://ec.europa.eu/environment/waste/studies/pdf/econ_eva_landfill_annex.pdf (accessed on 2 January 2015).
  43. Gentil, E.C.; Damgaard, A.; Hauschild, M.; Finnveden, G.; Eriksson, O.; Thorneloe, S.; Kaplan, P.O.; Barlaz, M.; Muller, O.; Matsui, Y.; et al. Models for waste Life Cycle Assessment: Review of technical assumptions. Waste Manag. 2010, 30, 2636–2648. [Google Scholar] [CrossRef] [PubMed]
  44. EnHealth. Environmental Health Risk Assessment: Guidelines for Assessing Human Health Risks from Environmental Hazards; Commonwealth of Australia: Canberra, Australia, 2012. [Google Scholar]
  45. Ontario Ministry of the Environment. Environmental Risks of Municipal Non- Hazardous Waste Landfilling and Incineration; Standards Development Branch Ontario Ministry of the Environment: Toronto, Australia, 1999. [Google Scholar]
  46. Finkbeiner, M.; Schau, E.M.; Lehmann, A.; Traverso, M. Towards life cycle sustainability assessment. Sustainability 2010, 2, 3309–3322. [Google Scholar] [CrossRef]
  47. Laurent, A.; Bakas, L.; Clavreul, J.; Bernstad, A.; Niero, M.; Gentil, E.; Hauschild, M.Z.; Christensen, T.H. Review of LCA studies of solid waste management systems—Part I: Lessons learned and perspectives. Waste Manag. 2014, 34, 573–588. [Google Scholar] [CrossRef] [PubMed]
  48. Laurent, A.; Bakas, L.; Clavreul, J.; Bernstad, A.; Niero, M.; Gentil, E.; Hauschild, M.Z.; Christensen, T.H. Review of LCA studies of solid waste management systems—Part II: Methodological guidance for a better practice. Waste Manag. 2014, 34, 589–606. [Google Scholar] [CrossRef] [PubMed]
  49. Pires, A.; Martinho, G.; Chang, N.-B. Solid waste management in European countries: A review of systems analysis techniques. J. Environ. Manag. 2011, 92, 1033–1050. [Google Scholar] [CrossRef]
  50. Franke, I.M.; Garmendia, I.A. The application of experience in European integrated waste management to Latin American conditions. Available online: http://www.bvsde.paho.org/bvsacd/acodal/ii.pdf (accessed on 2 January 2015).

