
Regional Water Footprint Assessment: A Case Study of Leshan City

Abstract
:1. Introduction
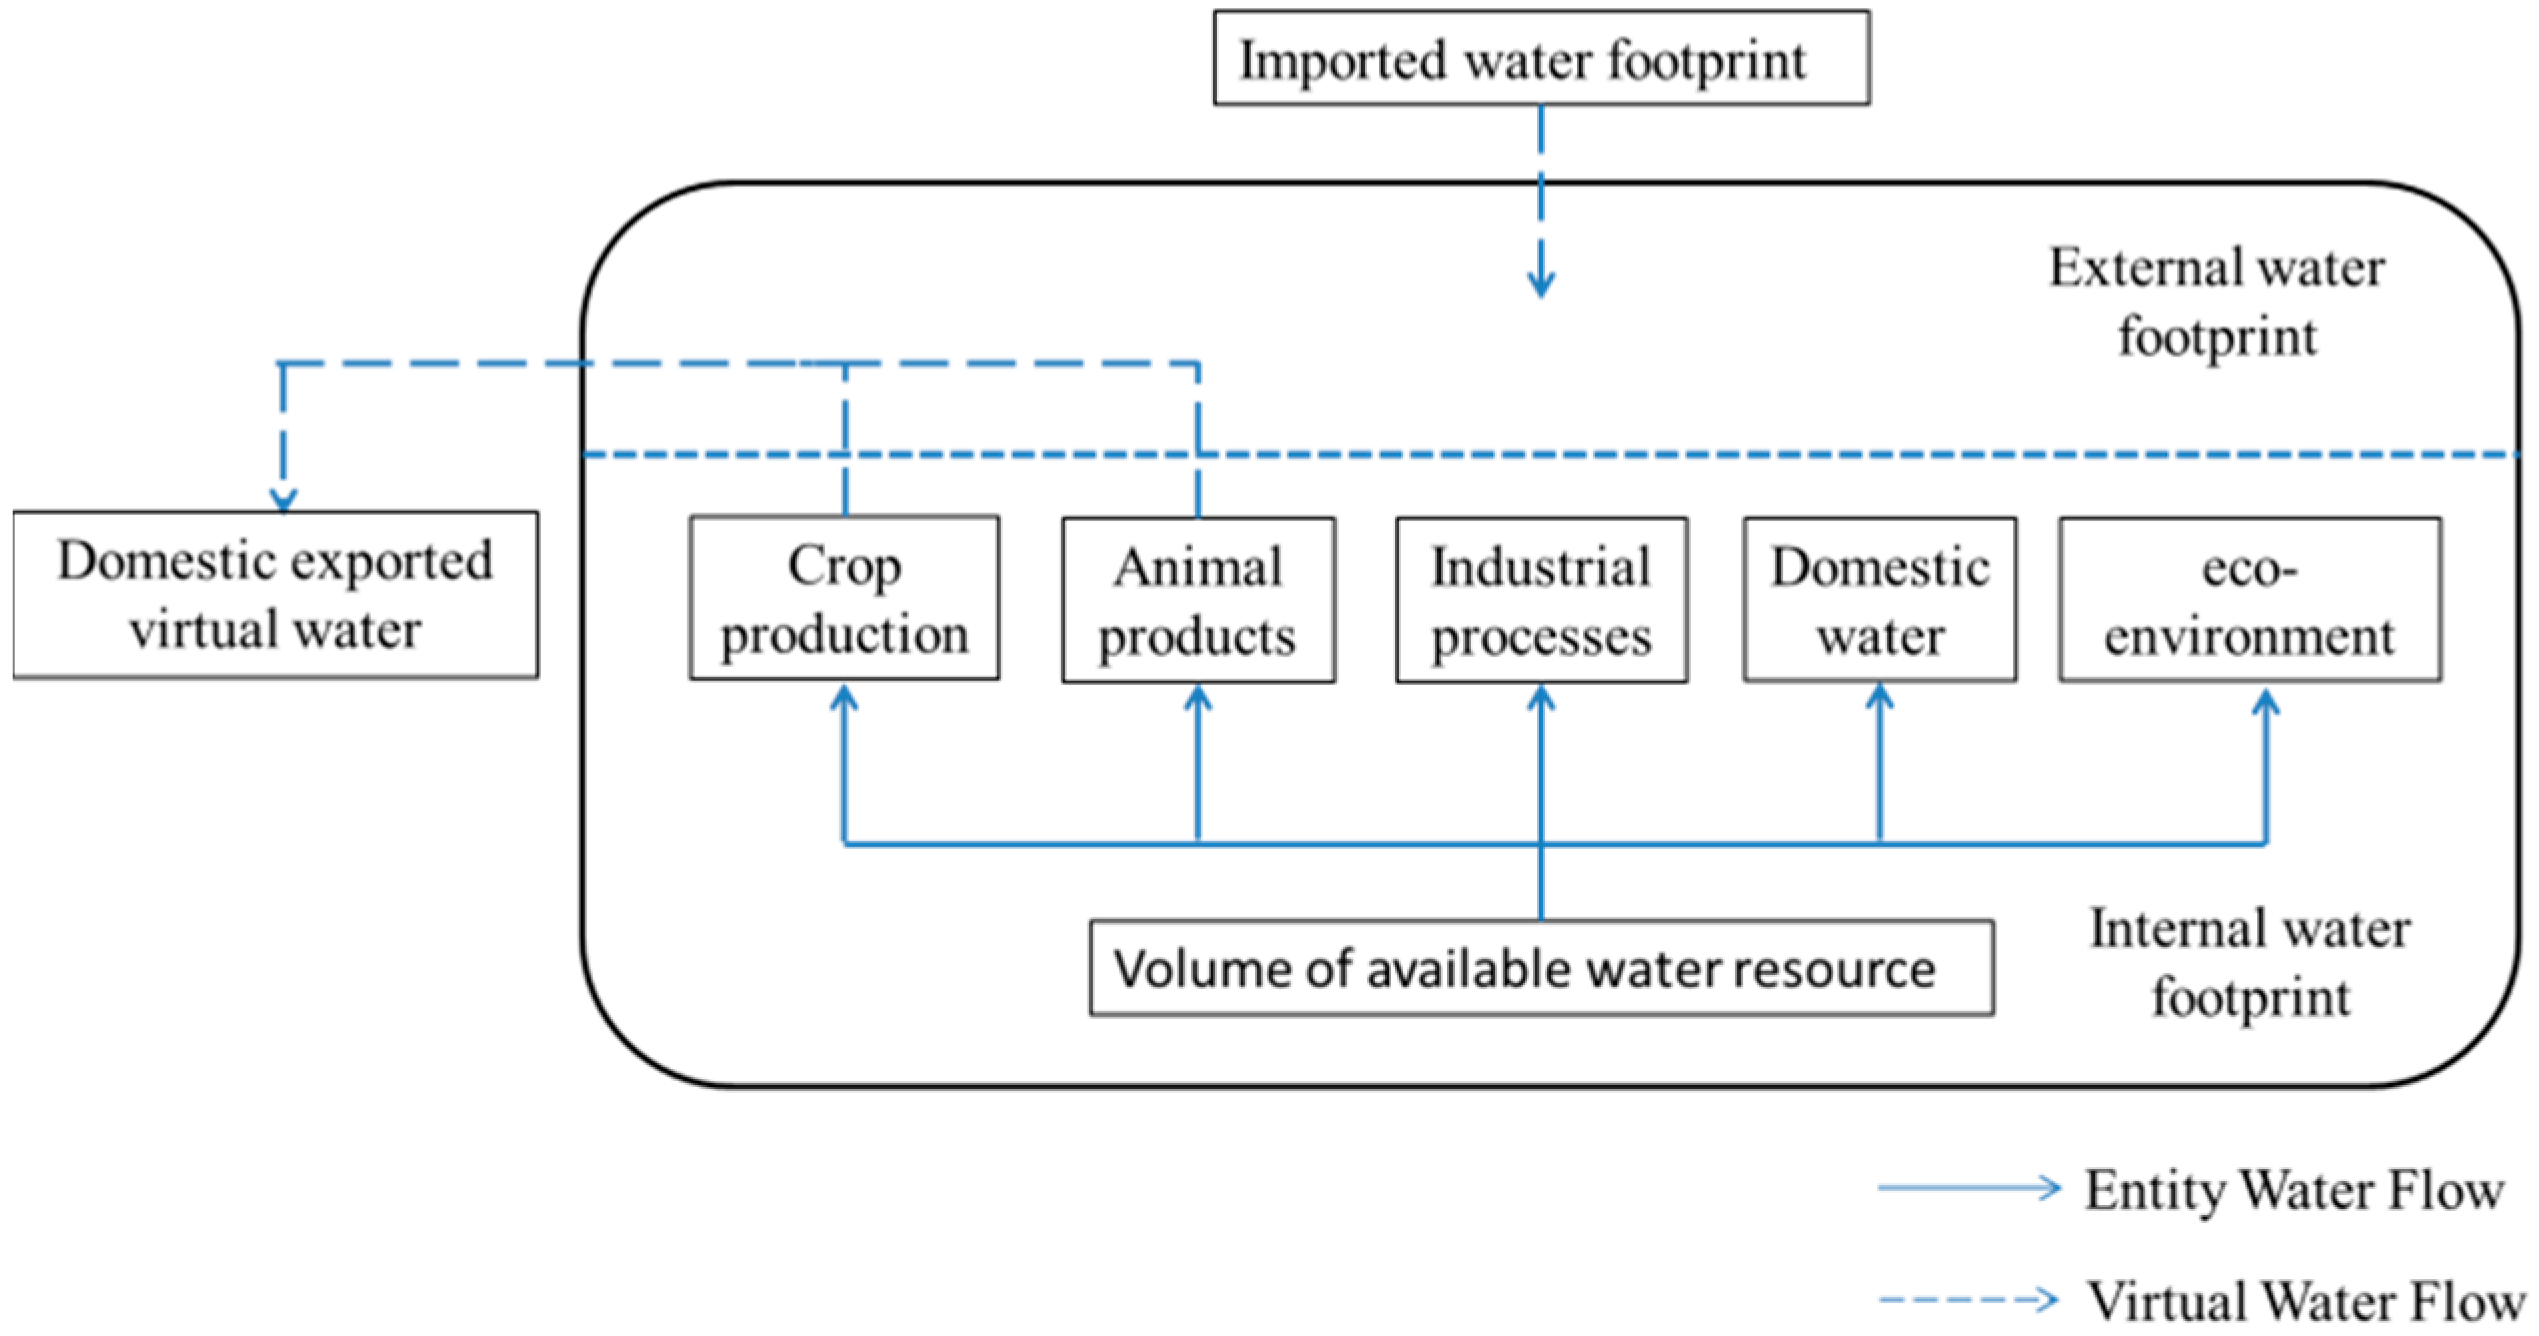
2. Methodology and Data

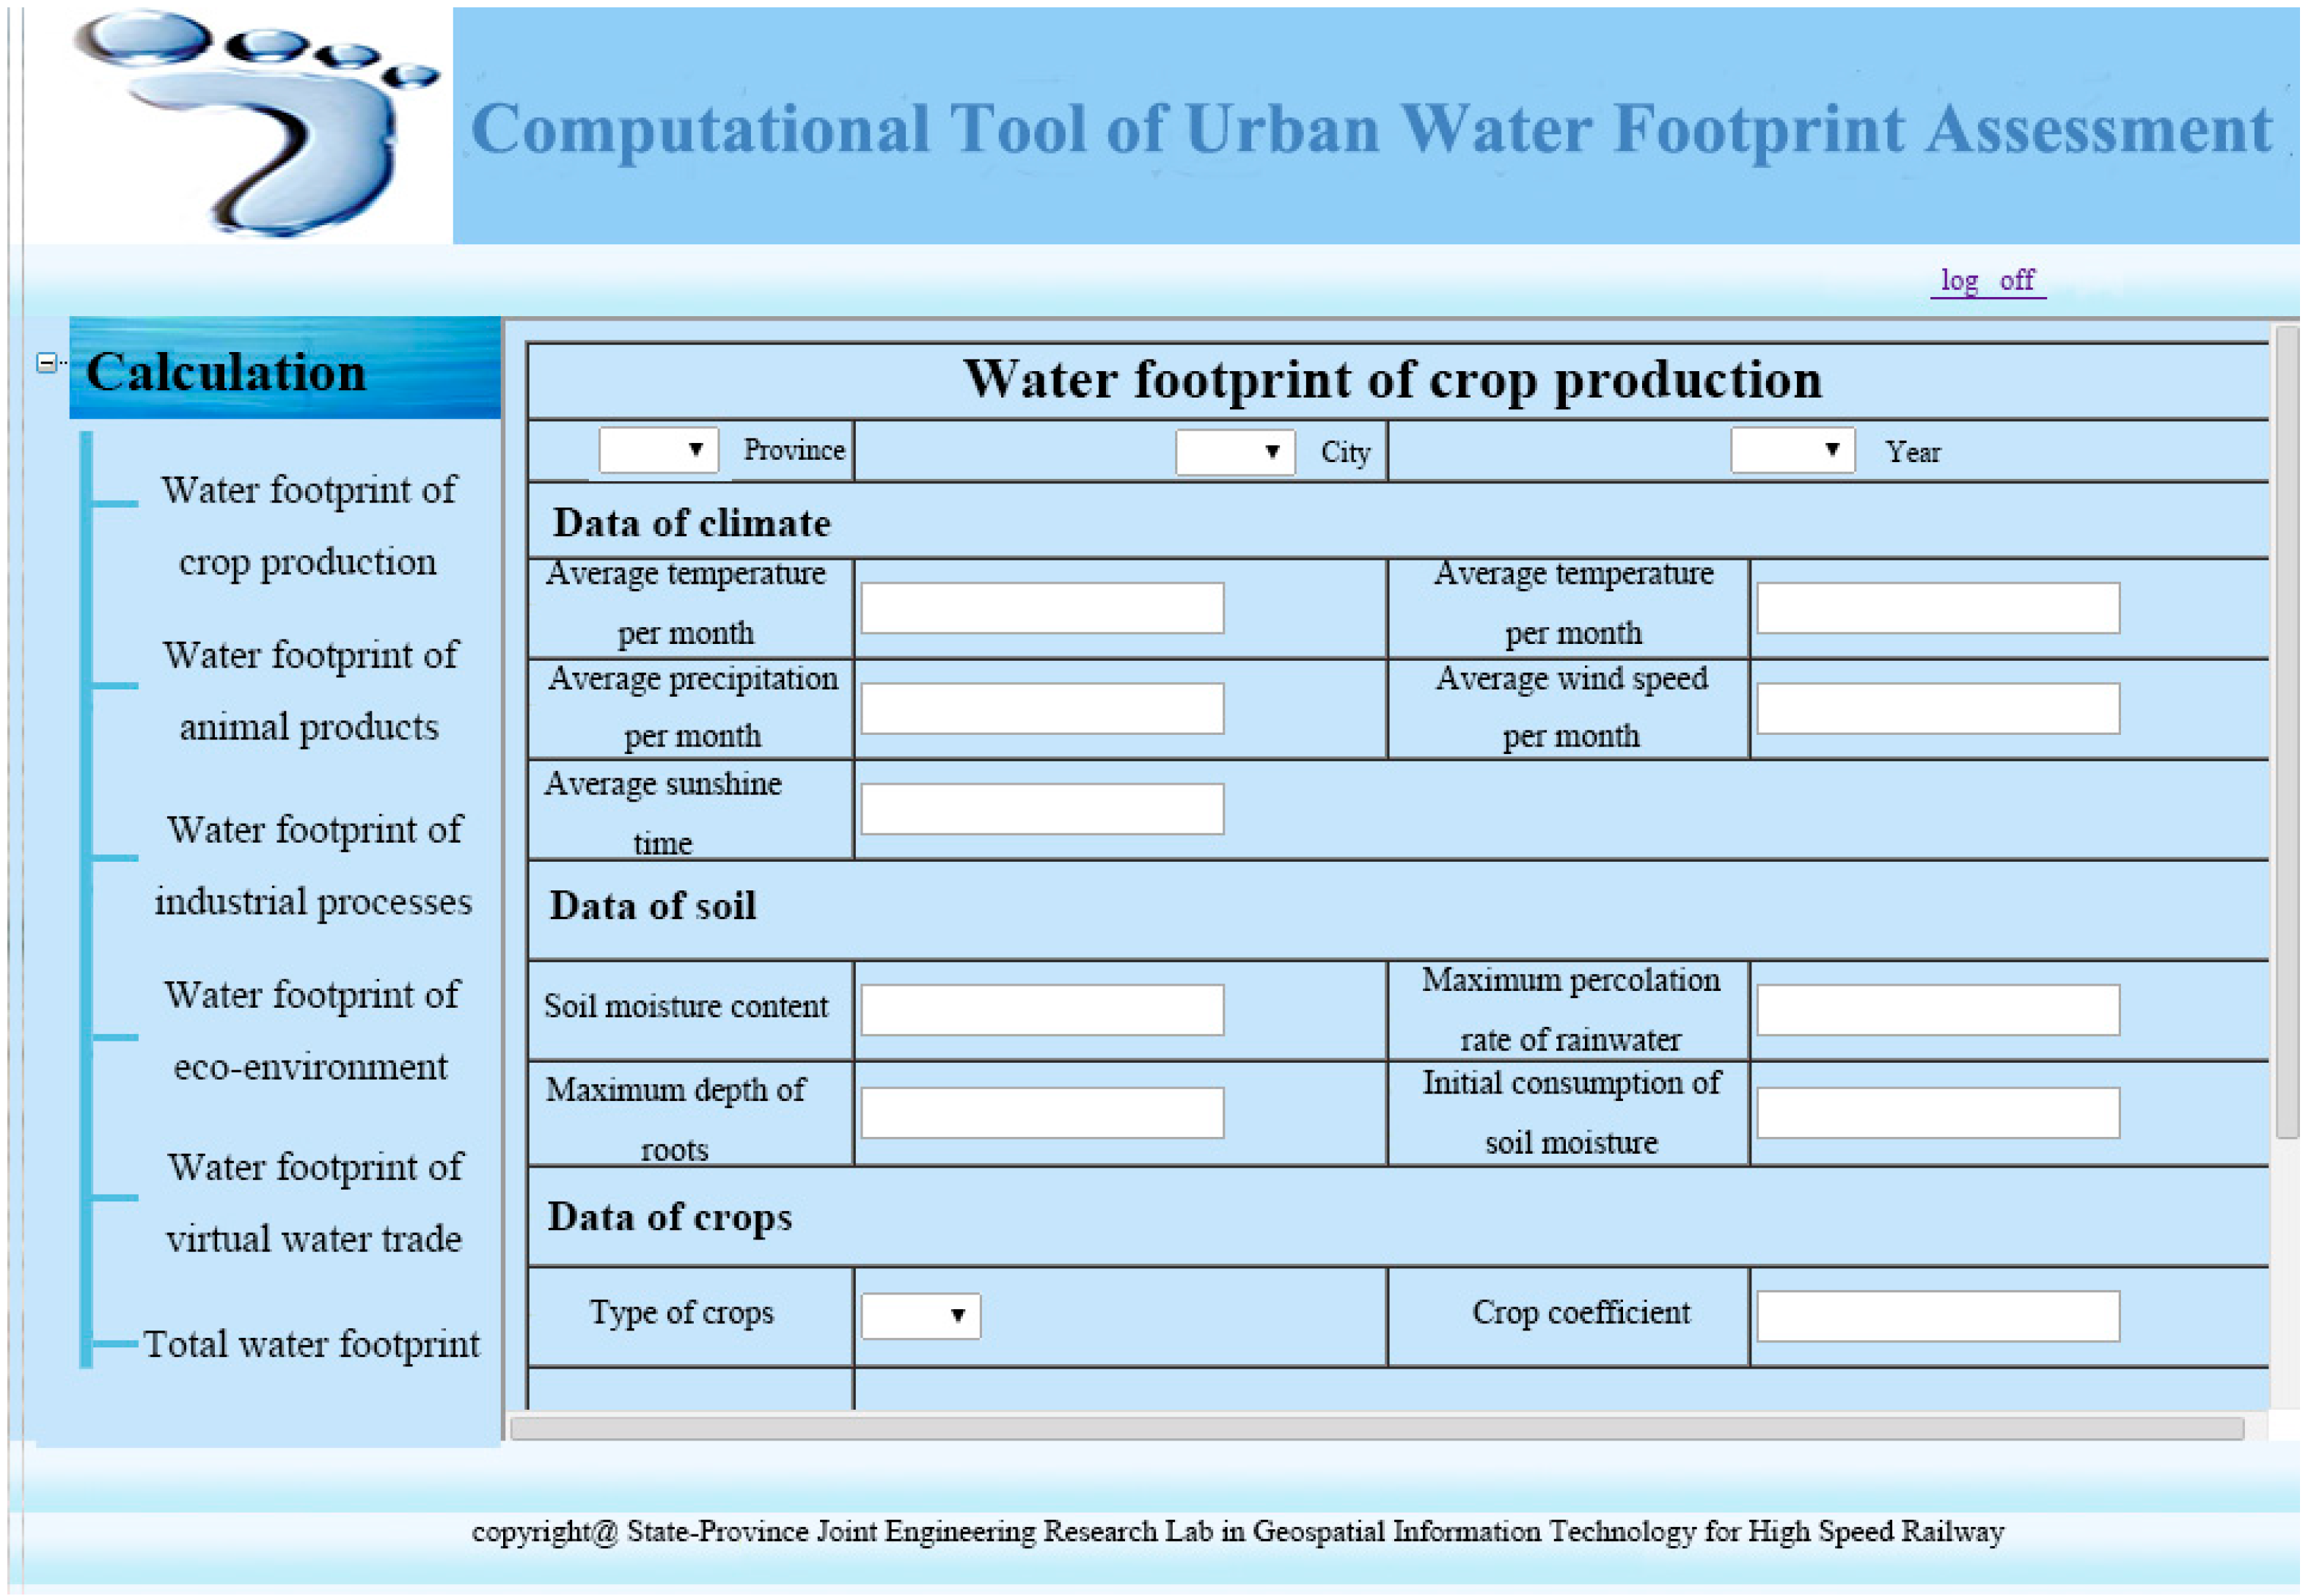
2.1. Water Footprint of Crop Production
- = net radiation at the crop surface, ;
- = flux of soil heat, ;
- = average temperature, ;
- = wind speed while measuring at 2 meters height, ;
- = pressure of saturation vapour ;
- = actual vapour pressure, ;
- = slope of the curve between saturation vapour pressure and temperature,
- = psychrometric constant, .
2.2. Water Footprint of Animal Products
- = water demand of mixing the feed, ;
- = virtual water content of the ith feed crop, ;
- = quantity of feed crop consumed by the animal daily,
- = average live weight of the animal at the end of its lifespan,
- = the daily drinking water consumed by the animal, ;
- = average live weight of the animal at the end of its lifespan,
- = the daily service water requirement of the animal, ;
- = average live weight of the animal at the end of its lifespan,
2.3. Water Footprint of Industrial Processes
- = the waste water emissions, ;
- = the concentration of the typical pollutants, ;
- = the maximum acceptable concentration, ;
- = the natural concentration in the receiving water body, .
2.4. Water Footprint of Domestic Water
2.5. Water Footprint of Eco-Environment
- = the water quota of urban green spaces, ;
- = the urban green coverage, .
- = area of urban water surface, ;
- = urban evaporation potential, ;
- = area of urban water surface, ;
- = depth of seepage, ;
- = the water quota of urban sanitation, ;
- = the urban area, h.
2.6. Water Footprint of Virtual Water Trade
2.7. Case Background and Data Source
3. Results and Discussion
3.1. Results

| Year | 2001 | 2002 | 2003 | 2004 | 2005 | 2006 | 2007 | 2008 | 2009 | 2010 | 2011 | 2012 |
|---|---|---|---|---|---|---|---|---|---|---|---|---|
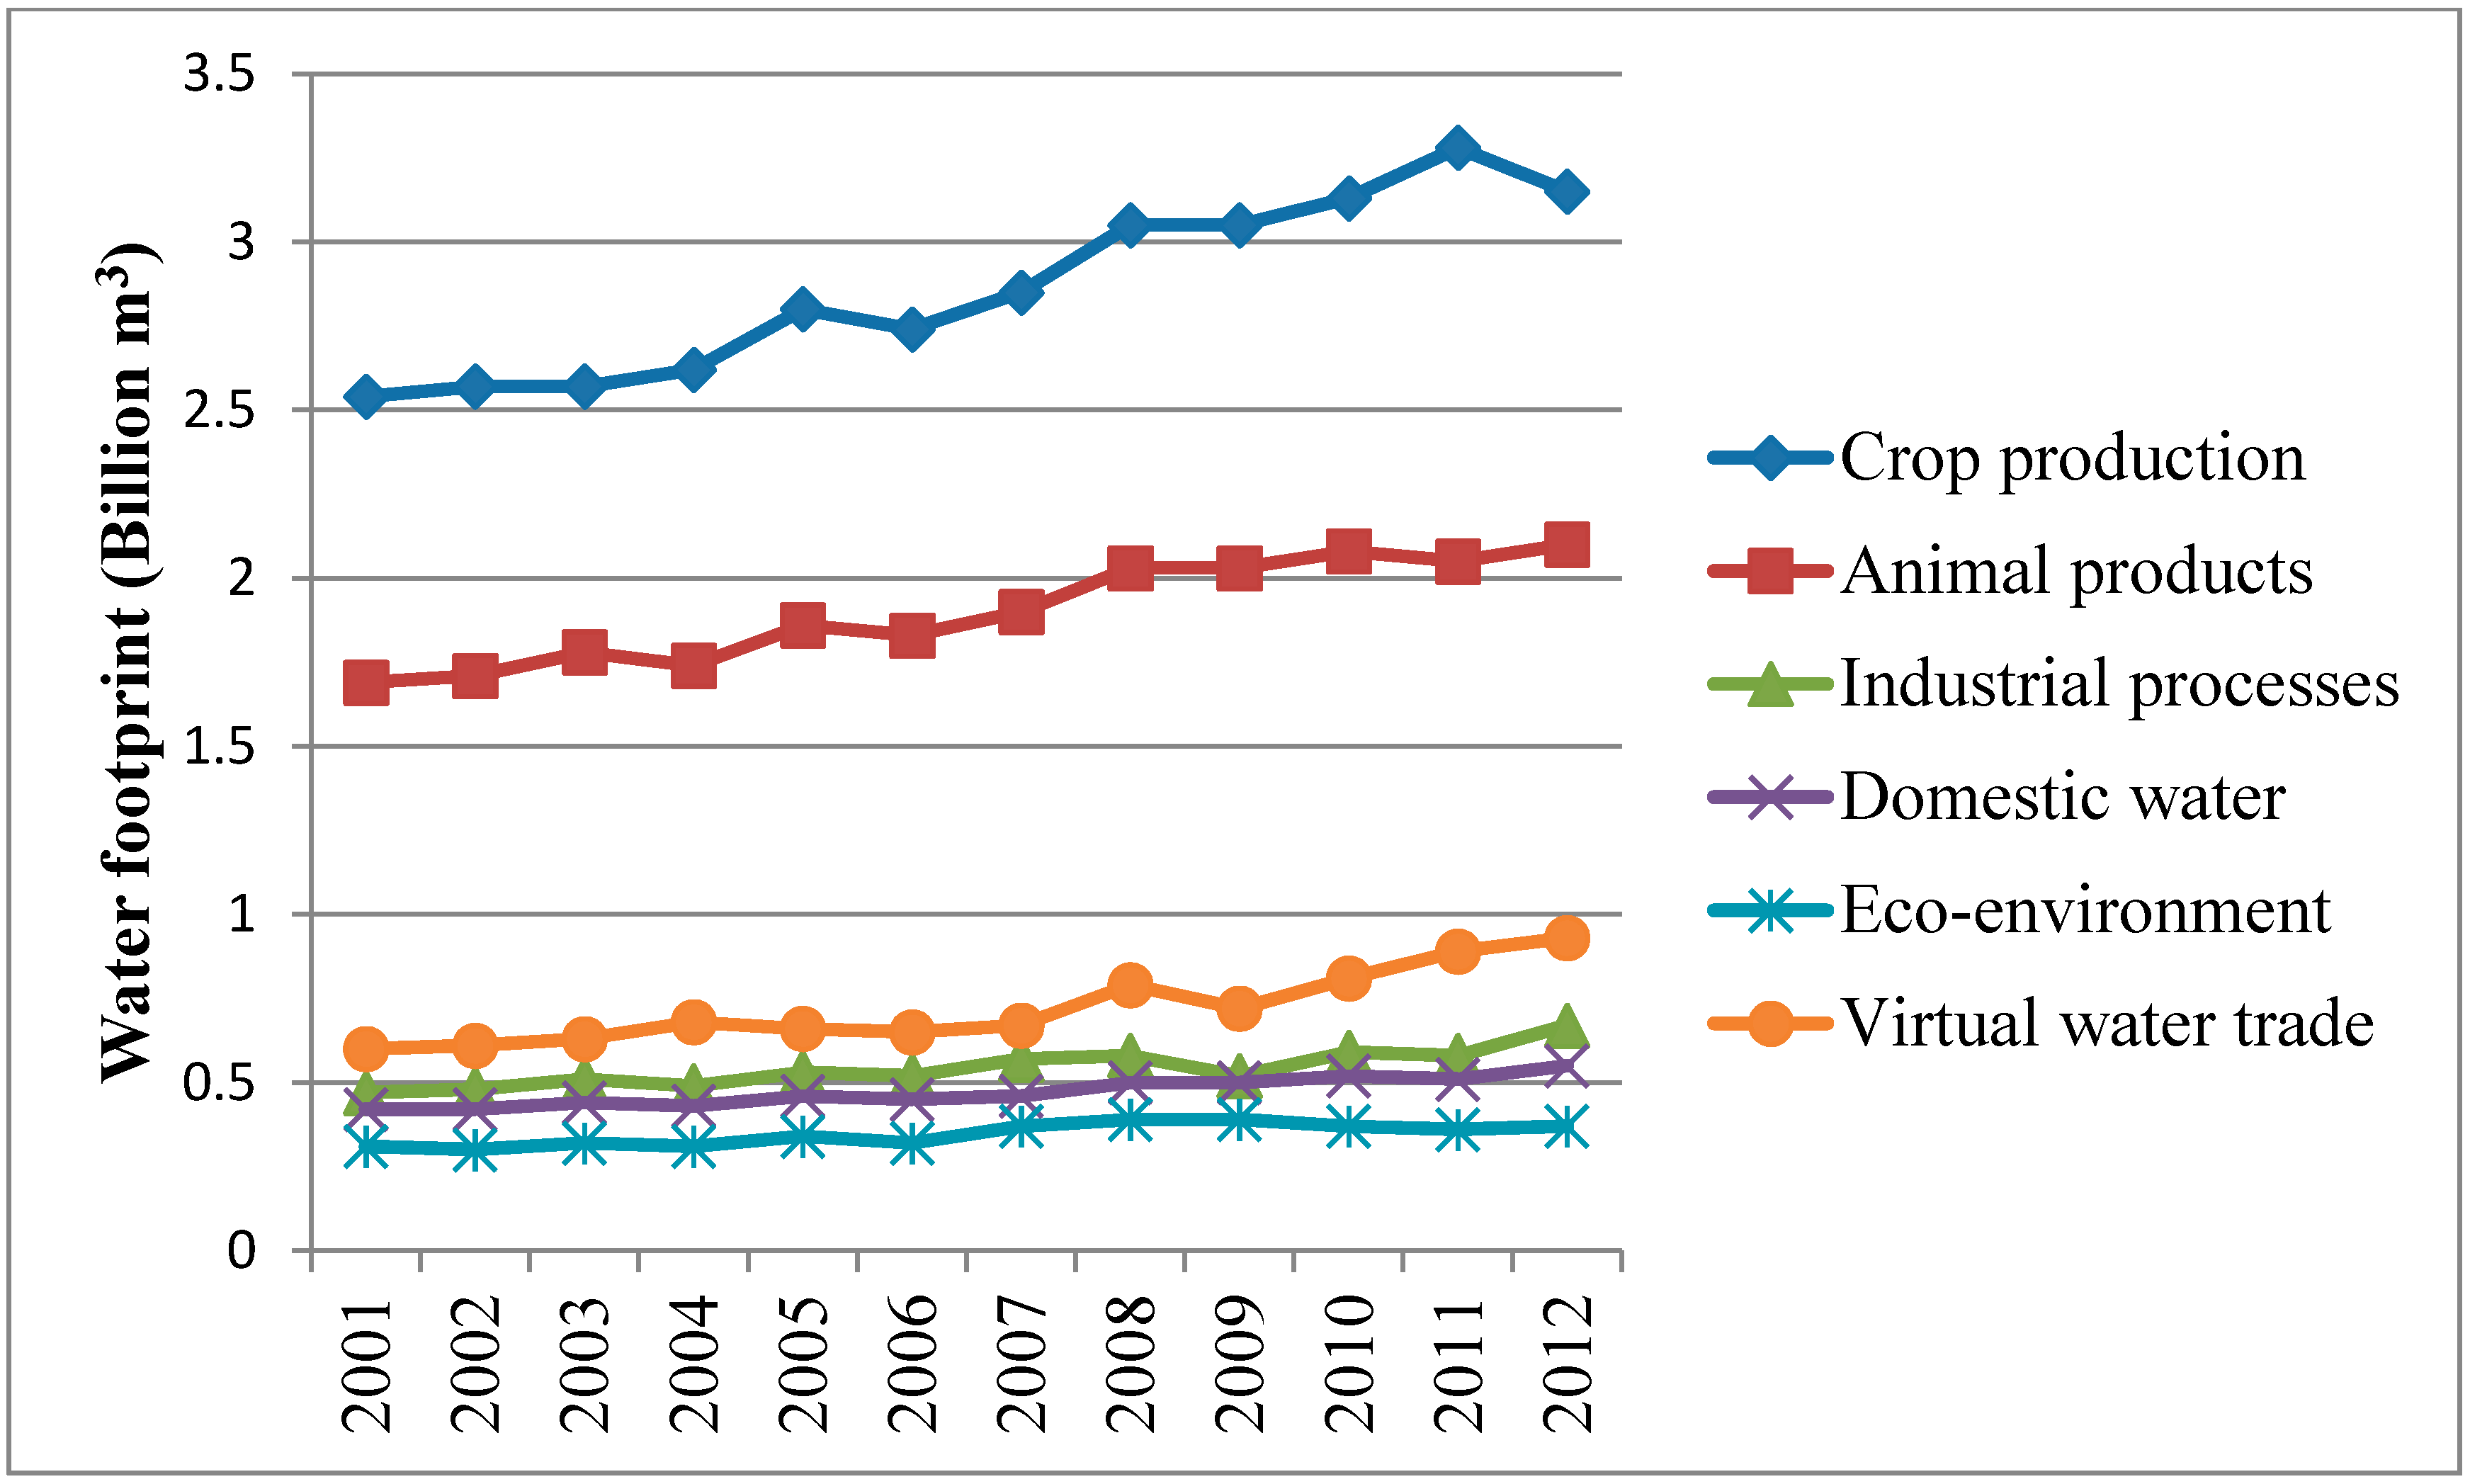
| Crop production | 2.54 | 2.57 | 2.57 | 2.62 | 2.80 | 2.74 | 2.85 | 3.05 | 3.05 | 3.13 | 3.28 | 3.15 |
| Animal products | 1.69 | 1.71 | 1.78 | 1.74 | 1.86 | 1.83 | 1.90 | 2.03 | 2.03 | 2.08 | 2.05 | 2.10 |
| Industrial processes | 0.47 | 0.48 | 0.51 | 0.49 | 0.53 | 0.52 | 0.57 | 0.58 | 0.52 | 0.59 | 0.58 | 0.67 |
| Domestic water | 0.42 | 0.42 | 0.44 | 0.43 | 0.46 | 0.45 | 0.46 | 0.50 | 0.50 | 0.52 | 0.51 | 0.55 |
| Eco-environment | 0.31 | 0.30 | 0.32 | 0.31 | 0.34 | 0.32 | 0.37 | 0.39 | 0.39 | 0.37 | 0.36 | 0.37 |
| Virtual water trade | 0.60 | 0.61 | 0.63 | 0.68 | 0.66 | 0.65 | 0.67 | 0.79 | 0.72 | 0.81 | 0.89 | 0.93 |
| Total water footprint | 6.06 | 6.12 | 6.27 | 6.30 | 6.68 | 6.54 | 6.84 | 7.37 | 7.24 | 7.52 | 7.69 | 7.79 |

- (1)
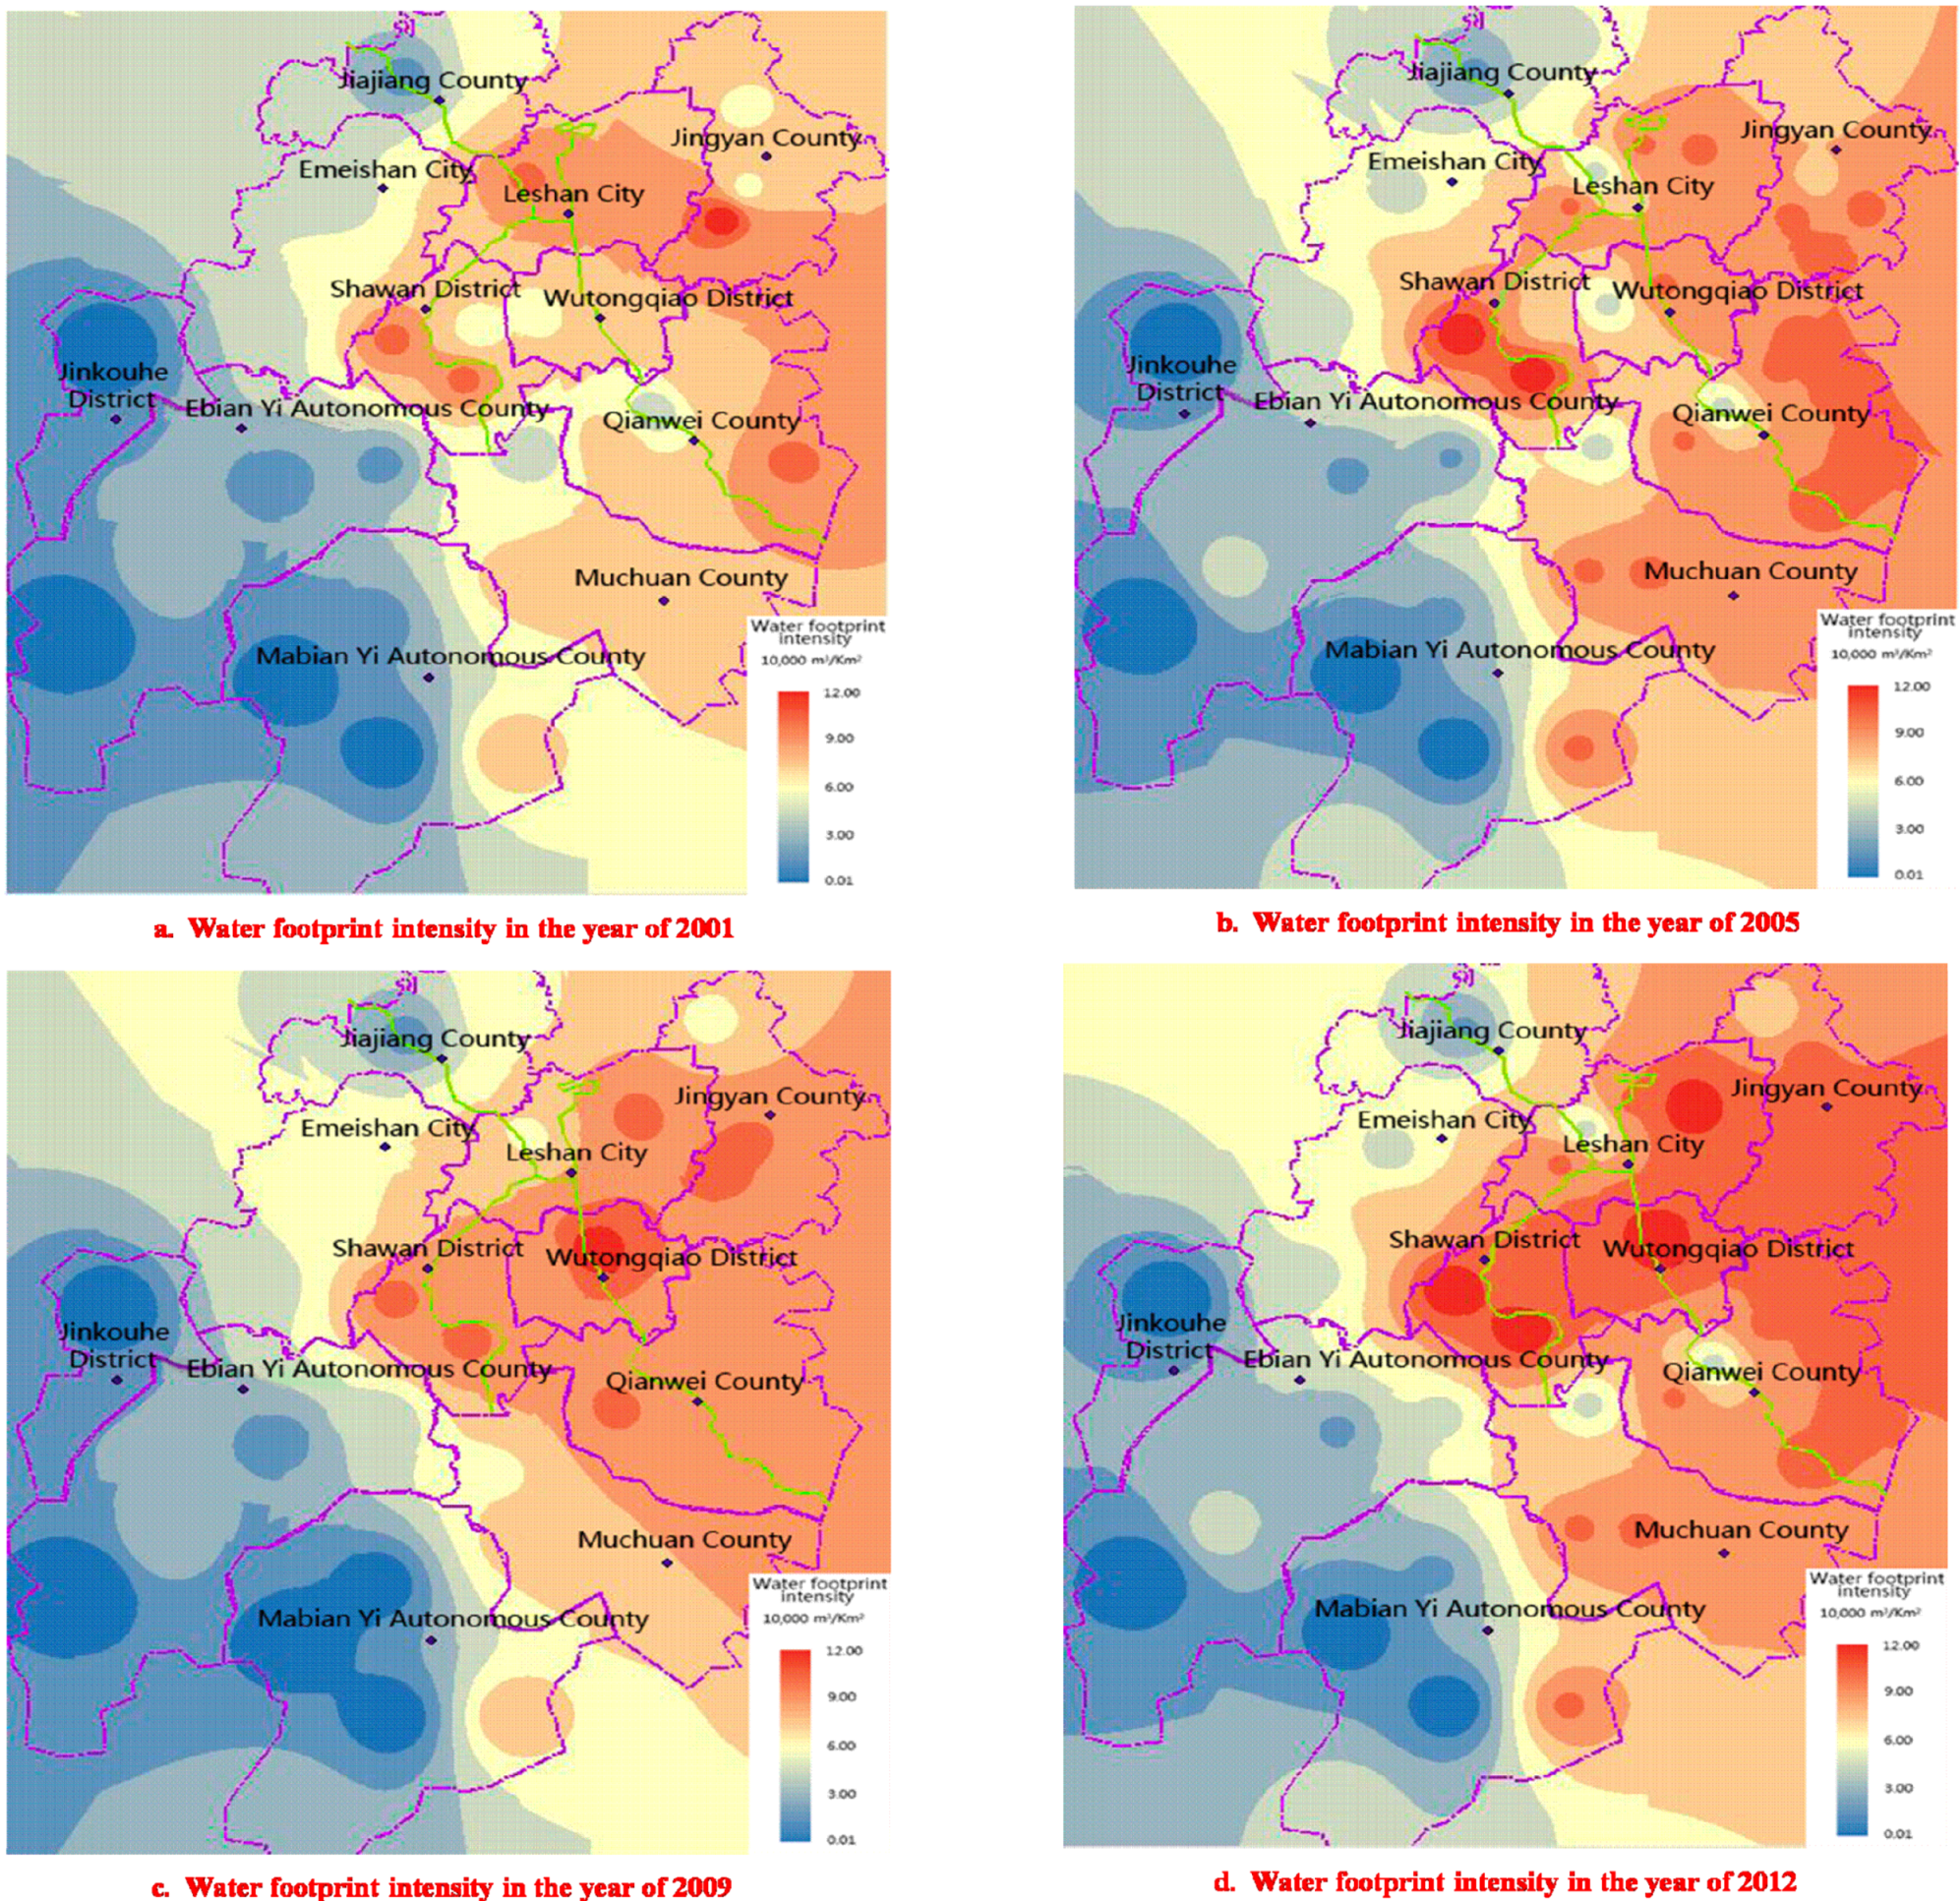
- Variation of spatial distribution: The spatial representation of water usage is helpful in identifying the water scarce area. For instance, the WFI of the Northeastern area is apparently larger than that of the Southwestern area, which is consistent with the regional characteristics of demographic and geographic distribution, i.e., the Northeastern area is the comparatively economic developed area in Leshan City, with dense population and water intensive industries.
- (2)
- Variation of temporal distribution: the distribution of total water footprint has led to an expansion during the period of 2001 to 2012, e.g., the water footprint intensity in Sha Wan and Wu Tongqiao Districts is increased, as shown in Figure 4. This situation is resulted from the development of urbanization, as these districts are gradually incorporated into the central urban areas, which can be verified by “Leshan City Planning in the period 2010–2030”, indicated that Sha Wan and Wu Tongqiao Districts are merged as the central urban areas, with the urban land-use reaching 100 square kilometers in the year of 2020 [62].
3.2. Discussion
4. Conclusions
Acknowledgments
Author Contributions
Conflicts of Interest
References
- Otero, I.; Kallis, G.; Aguilar, R.; Ruiz, V. Water scarcity, social power and the production of an elite suburb: The political ecology of water in Matadepera, Catalonia. Ecol. Econ. 2011, 70, 1297–1308. [Google Scholar]
- Bogardi, J.J.; Dudgeon, D.; Lawford, R.; Flinkerbusch, E.; Meyn, A.; Pahl-Wostl, C.; Viehlhauer, K.; Vörösmarty, C. Water security for a planet under pressure: Interconnected challenges of a changing world call for sustainable solutions. Curr. Opin. Env. Sust. 2012, 4, 35–43. [Google Scholar] [CrossRef]
- Trenberth, K.E.; Dai, A.; van der Schrier, G.; Jones, P.D.; Barichivich, J.; Briffa, K.R.; Sheffield, J. Global warming and changes in drought. Nat. Clim. Chang. 2014, 4, 17–22. [Google Scholar] [CrossRef]
- Jiang, Y. China’s water scarcity. J. Environ. Manag. 2009, 90, 3185–3196. [Google Scholar] [CrossRef] [PubMed]
- Ge, L.; Xie, G.; Zhang, C.; Li, S.; Qi, Y.; Cao, S.; He, T. An evaluation of China’s water footprint. Water Resour. Manag. 2011, 25, 2633–2647. [Google Scholar] [CrossRef]
- Gong, P.; Liang, S.; Carlton, E.; Jiang, Q.; Wu, J.; Wang, L.; Remais, J.V. Urbanisation and health in China. Lancet 2012, 379, 843–852. [Google Scholar] [CrossRef]
- Dong, H.; Geng, Y.; Sarkis, J.; Fujita, T.; Okadera, T.; Xue, B. Regional water footprint evaluation in China: A case of Liaoning. Sci. Total Environ. 2013, 442, 215–224. [Google Scholar] [CrossRef] [PubMed]
- Mao, X.; Yuan, D.; Wei, X.; Chen, Q.; Yan, C.; He, L. Network Analysis for a Better Water Use Configuration in the Baiyangdian Basin, China. Sustainability 2015, 7, 1730–1741. [Google Scholar] [CrossRef]
- Liu, J.; Zang, C.; Tian, S.; Liu, J.; Yang, H.; Jia, S.; You, L.; Liu, B.; Zhang, M. Water conservancy projects in China: Achievements, challenges and way forward. Global Environ. Chang. 2013, 23, 633–643. [Google Scholar] [CrossRef]
- Hoekstra, A.Y.; Hung, P. Virtual Water Trade: A Quantification of Virtual Water flows Between Nations in Relation to International Crop Trade; UNESCO-IHE: Delft, The Netherlands, 2003. [Google Scholar]
- Hubacek, K.; Guan, D.; Barrett, J.; Wiedmann, T. Environmental implications of urbanization and lifestyle change in China: Ecological and Water Footprints. J. Clean. Prod. 2009, 17, 1241–1248. [Google Scholar] [CrossRef]
- Hoekstra, A.Y.; Chapagain, A.K.; Aldaya, M.M.; Mekonnen, M.M. The Water Footprint Assessment Manual: Setting the Global Standard; Earthscan: London, UK, 2011. [Google Scholar]
- Paterson, W.; Rushforth, R.; Ruddell, B.L.; Konar, M.; Ahams, I.C.; Gironás, J.; Mijic, A.; Mejia, A. Water Footprint of Cities: A Review and Suggestions for Future Research. Sustainability 2015, 7, 8461–8490. [Google Scholar] [CrossRef]
- Hoekstra, A.Y.; Chapagain, A.K. Globalization of Water: Sharing the Planet’s Freshwater Resources; Blackwell Publishing: Hoboken, NJ, USA, 2008. [Google Scholar]
- Chapagain, A.K.; Hoekstra, A.Y.; Savenije, H.H.G.; Gautam, R. The water footprint of cotton consumption: An assessment of the impact of worldwide consumption of cotton products on the water resources in the cotton producing countries. Ecol. Econ. 2006, 60, 186–203. [Google Scholar] [CrossRef]
- Ridoutt, B.G.; Eady, S.J.; Sellahewa, J.; Simons, L.; Bektash, R. Water footprinting at the product brand level: Case study and future challenges. J. Clean. Prod. 2009, 17, 1228–1235. [Google Scholar] [CrossRef]
- Mekonnen, M.M.; Hoekstra, A.Y. The green, blue and grey water footprint of crops and derived crop products. Hydrol. Earth Syst. Sci. 2011, 15, 1577–1600. [Google Scholar] [CrossRef]
- Mekonnen, M.M.; Hoekstra, A.Y. A Global Assessment of the Water Footprint of Farm Animal Products. Ecosystems 2012, 15, 401–415. [Google Scholar] [CrossRef]
- Ercin, A.E.; Aldaya, M.M.; Hoekstra, A.Y. The water footprint of soy milk and soy burger and equivalent animal products. Ecol. Indic. 2012, 18, 392–402. [Google Scholar] [CrossRef]
- Gerbens-Leenes, W.; Mekonnen, M.M.; Hoekstra, A.Y. The water footprint of poultry, pork and beef: A comparative study in different countries and production systems. Water Resour. Ind. 2013, 1–2, 25–36. [Google Scholar] [CrossRef]
- Ridoutt, B.G.; Sanguansri, P.; Freer, M.; Harper, G.S. Water footprint of livestock: Comparison of six geographically defined beef production systems. Int. J. Life Cycle Ass. 2012, 17, 165–175. [Google Scholar] [CrossRef]
- Van Oel, P.R.; Hoekstra, A.Y. Towards Quantification of the Water Footprint of Paper: A First Estimate of its Consumptive Component. Water Resour. Manag. 2012, 26, 733–749. [Google Scholar] [CrossRef]
- Chico, D.; Aldaya, M.M.; Garrido, A. A water footprint assessment of a pair of jeans: The influence of agricultural policies on the sustainability of consumer products. J. Clean. Prod. 2013, 57, 238–248. [Google Scholar] [CrossRef]
- Herath, I.; Green, S.; Singh, R.; Horne, D.; van der Zijpp, S.; Clothier, B. Water footprinting of agricultural products: A hydrological assessment for the water footprint of New Zealand's wines. J. Clean. Prod. 2013, 41, 232–243. [Google Scholar] [CrossRef]
- Ene, S.A.; Teodosiu, C.; Robu, B.; Volf, I. Water footprint assessment in the winemaking industry: A case study for a Romanian medium size production plant. J. Clean. Prod. 2013, 43, 122–135. [Google Scholar] [CrossRef]
- ISO (The International Organization for Standardization). ISO 14046 Water Footprint–Principles, Requirements and Guidelines; ISO: Geneva, Switzerland, 2014. [Google Scholar]
- Pfister, S.; Vionnet, S.; Levova, T.; Humbert, S. Ecoinvent 3: Assessing water use in LCA and facilitating water footprinting. Int. J. Life Cycle Assess. 2015. [Google Scholar] [CrossRef]
- Manzardo, A.; Mazzi, A.; Loss, A.; Butler, M.; Williamson, A.; Scipioni, A. Lessons learned from the application of different water footprint approaches to compare different food packaging alternatives. J. Clean. Prod. 2015. [Google Scholar] [CrossRef]
- Ercin, A.E.; Aldaya, M.M.; Hoekstra, A.Y. Corporate Water Footprint Accounting and Impact Assessment: The Case of the Water Footprint of a Sugar-Containing Carbonated Beverage. Water Resour. Manag. 2011, 25, 721–741. [Google Scholar] [CrossRef]
- Ruini, L.; Marino, M.; Pignatelli, S.; Laio, F.; Ridolfi, L. Water footprint of a large-sized food company: The case of Barilla pasta production. Water Resour. Ind. 2013, 1–2, 7–24. [Google Scholar] [CrossRef]
- Li, J.S.; Chen, G.Q. Water footprint assessment for service sector: A case study of gaming industry in water scarce Macao. Ecol. Indic. 2014, 47, 164–170. [Google Scholar] [CrossRef]
- Hoekstra, A.Y.; Chapagain, A.K. Water footprints of nations: Water use by people as a function of their consumption pattern. Water Resour. Manag. 2007, 21, 35–48. [Google Scholar] [CrossRef]
- Turconi, R.; Boldrin, A.; Astrup, T. Life cycle assessment (LCA) of electricity generation technologies: Overview, comparability and limitations. Renew. Sust. Ener. Rev. 2013, 28, 555–565. [Google Scholar] [CrossRef] [Green Version]
- Zhao, X.; Chen, B.; Yang, Z.F. National water footprint in an input–output framework—A case study of China 2002. Ecol. Model. 2009, 220, 245–253. [Google Scholar] [CrossRef]
- Chen, Z.M.; Chen, G.Q. Virtual water accounting for the globalized world economy: National water footprint and international virtual water trade. Ecol. Indic. 2013, 28, 142–149. [Google Scholar] [CrossRef]
- Zhang, C.; Anadon, L.D. A multi-regional input–output analysis of domestic virtual water trade and provincial water footprint in China. Ecol. Econ. 2014, 100, 159–172. [Google Scholar] [CrossRef]
- Zhang, Z.; Shi, M.; Yang, H.; Chapagan, A. An input–output analysis of trends in virtual water trade and the impact on water resources and uses in China. Econ. Syst. Res. 2011, 23, 431–446. [Google Scholar] [CrossRef]
- Zhang, Z.; Shi, M.; Yang, H. Understanding Beijing’s Water Challenge: A Decomposition Analysis of Changes in Beijing’s Water Footprint between 1997 and 2007. Environ. Sci. Technol. 2012, 46, 12373–12380. [Google Scholar] [CrossRef] [PubMed]
- Wang, Z.; Huang, K.; Yang, S.; Yu, Y. An input–output approach to evaluate the water footprint and virtual water trade of Beijing, China. J. Clean. Prod. 2013, 42, 172–179. [Google Scholar] [CrossRef]
- Fiałkiewicz, W.; Czaban, S.; Kolonko, A.; Konieczny, T.; Malinowski, P.; Manzardo, A.; Loss, A.; Scipioni, A.; Leonhardt, G.; Rauch, W.; et al. Water footprint as a new approach to water management in the urban areas. Available online: http://www.researchgate.net/publication/265636445_WATER_FOOTPRINT_AS_A_NEW_APPROACH_TO_WATER_MANAGEMENT_IN_THE_URBAN_AREAS (accessed on 20 November 2015).
- Tague, C.L.; Band, L.E. RHESSys: Regional hydro-ecologic simulation system-an object-oriented approach to spatially distributed modeling of carbon, water, and nutrient cycling. Earth Interact. 2004, 8, 1–42. [Google Scholar] [CrossRef]
- Wardropper, C.B.; Chang, C.; Rissman, A.R. Fragmented water quality governance: Constraints to spatial targeting for nutrient reduction in a Midwestern USA watershed. Landsc. Urban Plan. 2015, 137, 64–75. [Google Scholar] [CrossRef]
- China NPC (National People’s Congress). Discharge Standard of pollutants for municipal wastewater treatment plant. Available online: http://kjs.mep.gov.cn/hjbhbz/bzwb/shjbh/swrwpfbz/200307/W020061027518964575034.pdf (accessed on 24 November 2015). (In Chinese)
- Hoekstra, A.Y.; Hung, P. Globalisation of water resources: international virtual water flows inrelation to crop trade. Global Environ. Chang. 2005, 15, 45–56. [Google Scholar] [CrossRef]
- Chapagain, A.K.; Hoekstra, A.Y. Virtual Water Flows Between Nations in Relation to Trade in Livestock and Livestock Products; UNESCO-IHE: Delft, The Netherlands, 2003. [Google Scholar]
- Allen, R.G.; Smith, M.; Perrier, A.; Pereira, L.S. An Update for the Calculation of Reference Evapotranspiration. ICID Bulletin 1994, 43, 35–92. [Google Scholar]
- Allen, R.G.; Pereira, L.S.; Raes, D.; Smith, M. Crop Evapotranspiration: Guidelines for Computing Crop Water Requirements-FAO Irrigation and Drainage Paper 56; Food and Agriculture Organization of the United Nations: Rome, Italy, 1998. [Google Scholar]
- Chapagain, A.; Orr, S. UK Water Footprint: the impact of the UK’s food and fibre consumption on global water resources. Volume two: appendices. Available online: http://www.waterfootprint.org (accessed on 15 January 2015).
- Jia, J.; Yan, Y.; Wang, C.; Liang, Y.; Zhang, Y.; Wu, G.; Liu, X.; Wang, L.; Du, C. The estimation and application of the water footprint in industrial processes. Acta Ecol. Sin. 2012, 32, 6558–6565. (In Chinese) [Google Scholar] [CrossRef]
- China NPC (National People’s Congress). Environment quality standards for surface water. Available online: http://kjs.mep.gov.cn/hjbhbz/bzwb/shjbh/shjzlbz/200206/W020061027509896672057.pdf (accessed on 24 November 2015). (In Chinese)
- Yang, Z.; Cui, B.; Liu, J. Estimation methods of eco-environmental water requirements: Case study. Sci. China Ser. D 2005, 48, 1280–1292. [Google Scholar] [CrossRef]
- Miao, H.; Wei, Y.; Jiang, L.; Ouyang, Z.; Shi, J.; Wang, X.; Zhao, J. Ecological water use and the estimate method. Acta Ecol. Sin. 2003, 23, 1156–1164. (In Chinese) [Google Scholar]
- Ying, X.; Zeng, G.M.; Chen, G.Q.; Tang, L.; Wang, K.L.; Huang, D.Y. Combining AHP with GIS in synthetic evaluation of eco-environment quality—A case study of Hunan Province, China. Ecol. Model. 2007, 209, 97–109. [Google Scholar] [CrossRef]
- Yang, A.; Tang, K.; Wang, H.; Liu, X. Theory and calculation method of ecological water use. J. Hydraul. Eng-Asce. 2004, 12, 39–44. (In Chinese) [Google Scholar]
- Veličković, B. Colmation as one of the processes in interaction between the groundwater and surface water. Facta universitatis-series 2005, 3, 165–172. [Google Scholar] [CrossRef]
- The Peoples’ Government of Leshan. Overview of Leshan City. Available online: http://www.leshan.gov.cn/LSSQ.aspx (accessed on 15 January 2015). (In Chinese)
- Yao, L.; Xu, J.; Li, Y. Evaluation of the Efficiency of Low Carbon Industrialization in Cultural and Natural Heritage: Taking Leshan as an Example. Sustainability 2014, 6, 3825–3842. [Google Scholar] [CrossRef]
- Zhu, Z.; Hou, L. Shortage appraisal and sustainable utilization of water resource in Sichuan Province. Sci. Soil Water Conserv. 2006, 4, 92–95. (In Chinese) [Google Scholar]
- Wang, W.; He, M.; Pan, K.; Zhu, Q.; Zhou, Y.; Fan, Y.; Hu, Q. Analysis of spatio-temporal characteristics of water resources ecological footprint and ecological carrying capacity in Sichuan province. J. Nat. Resour. 2011, 26, 1555–1565. (In Chinese) [Google Scholar]
- Food and Agriculture Organization (FAO). FAO Statistical Database. Available online: http://faostat.fao.org/ (accessed on 20 November 2014).
- Sichuan Provincial Water Resources Department. Sichuan Water Resources Bulletin; Sichuan Provincial Water Resources Department: Chengdu, China, 2012. (In Chinese) [Google Scholar]
- Leshan Statistical Bureau. Leshan Statistical Year Book; Leshan Statistical Bureau: Leshan, China, 2012. (In Chinese)
- Institute of Geographic Sciences and Natural Resources Research, CAS. Thematic Database for Human-earth System. Available online: http://www.data.ac.cn/ (accessed on 20 November 2014). (In Chinese)
- National Meteorological Information Center. China Meteorological Data Sharing Service System. Available online: http://cdc.cma.gov.cn/ (accessed on 20 November 2014). (In Chinese)
- Department of Plantation Management of Ministry of Agriculture. China Crop Database by Ministry of Agriculture. Available online: http://zzys.agri.gov.cn/nongqing.aspx (accessed on 20 November 2014). (In Chinese)
- Institute of Soil Science, Chinese Academy of Sciences. China Soil Scientific Database. Available online: http://www.soil.csdb.cn/ (accessed on 20 November 2014). (In Chinese)
- Deng, X.; Xie, S.; Qin, T.; Sun, Z.; He, D. Assessment of water resources utilization in Sichuan Province based on water footprint analysis. Yangtze River 2007, 38, 61–63. (In Chinese) [Google Scholar]
- McCarty, J.J. Climate Change 2001: Impacts, Adaptation, and Vulnerability: Contribution of Working Group II to the Third Assessment Report of the Intergovernmental Panel on Climate Change; Cambridge University Press: Cambridge, UK, 2001. [Google Scholar]
- The Peoples’ Government of Leshan. Leshan City Planning in the period 2011–2030. Available online: http://www.leshan.gov.cn/NewsInfo.aspx?id=974E2E332822CBD0 (accessed on 23 January 2015). (In Chinese)
- DiBiase, D.; MacEachren, A.M.; Krygier, J.B.; Reeves, C. Animation and the role of map design in scientific visualization. Cartography Geogr. Inform. Syst. 1992, 19, 201–214. [Google Scholar] [CrossRef]
- Aldaya, M.M.; Garrido, A.; Llamas, M.R.; Varela-Ortega, C.; Novo, P.; Casado, R.R. Water footprint and virtual water trade in Spain. Water policy. 2010, 35, 49–59. [Google Scholar]
- Rui, Q.I.; Geng, Y.; Zhu, Q.H. Evaluation of regional water resources utilization based on water footprint method. J. Nat. Resour. 2011, 26, 486–495. (In Chinese) [Google Scholar]
- Feng, K.; Chapagain, A.; Suh, S.; Pfister, S.; Hubacek, K. Comparison of bottom-up and top-down approaches to calculating the water footprints of nations. Econ. Syst. Res. 2011, 23, 371–385. [Google Scholar] [CrossRef]
- Zhang, Z.; Yang, H.; Shi, M. Analyses of water footprint of Beijing in an interregional input–output framework. Ecol. Econ. 2011, 70, 2494–2502. [Google Scholar] [CrossRef]
- Yang, Y.; Moiwo, J.P.; Hu, Y. Estimation of irrigation requirement for sustainable water resources reallocation in North China. Agr. Water Manag. 2010, 97, 1711–1721. [Google Scholar] [CrossRef]
- Jobbins, G.; Kalpakian, J.; Chriyaa, A.; Legrouri, A.; El Mzouri, E.H. To what end? Drip irrigation and the water-energy-food nexus in Morocco. Int. J. Water Resour. Dev. 2015, 31, 393–460. [Google Scholar] [CrossRef]
- Wang, J.; Rothausen, S.G.S.A.; Conway, D.; Zhang, L.; Xiong, W.; Holman, I.P.; Li, Y. China’s water-energy nexus: Greenhouse-gas emissions from groundwater use for agriculture. Environ. Res. Lett. 2012, 7, 14–35. [Google Scholar] [CrossRef]
- Jaafar, H.H.; Zurayk, R.; King, C.; Ahmad, F.; Al-Outa, R. Impact of the Syrian conflict on irrigated agriculture in the Orontes Basin. Int. J. Water Resour. Dev. 2015, 31. [Google Scholar] [CrossRef]
- Keulertz, M.; Woertz, E. Financial challenges of the nexus: Pathways for investment in water, energy and agriculture in the Arab world. Int. J. Water Resour. Dev. 2015, 31, 312–325. [Google Scholar] [CrossRef]
- Galli, A.; Wiedmann, T.; Ercin, E.; Knoblauch, D.; Ewing, B.; Giljum, S. Integrating ecological, carbon and water footprint into a “footprint family” of indicators: Definition and role in tracking human pressure on the planet. Ecol. Indic. 2012, 16, 100–112. [Google Scholar] [CrossRef]
- Zhang, Y.; Singh, S.; Bakshi, B.R. Accounting for ecosystem services in life cycle assessment, Part I: A critical review. Environ. Sci. Technol. 2010, 44, 2232–2242. [Google Scholar] [CrossRef] [PubMed]
- Zhuo, L.; Mekonnen, M.M.; Hoekstra, A.Y. Sensitivity and uncertainty in crop water footprint accounting: A case study for the Yellow River Basin. Hydrol. Earth. Syst. Sci. 2014, 18, 2219–2234. [Google Scholar] [CrossRef]
- Wang, X.H.; Xu, Z.M.; Li, Y.H. A rough estimate of water footprint of Gansu province in 2003. J. Nat. Resour. 2005, 20, 115–121. (In Chinese) [Google Scholar]
- Wichelns, D. Virtual water and water footprints offer limited insight regarding important policy questions. Int. J. Water Resour. Dev. 2010, 26, 639–651. [Google Scholar] [CrossRef]
- Wichelns, D. Virtual water and water footprints: policy relevant or simply descriptive? Int. J. Water Resour. Dev. 2010, 26, 689–695. [Google Scholar] [CrossRef]
- Wichelns, D. Assessing water footprints will not be helpful in improving water management or ensuring food security. Int. J. Water Resour. Dev. 2011, 27, 607–619. [Google Scholar] [CrossRef]
- Wichelns, D. Do the virtual water and water footprint perspectives enhance policy discussions? Int. J. Water Resour. Dev. 2011, 27, 633–645. [Google Scholar]
© 2015 by the authors; licensee MDPI, Basel, Switzerland. This article is an open access article distributed under the terms and conditions of the Creative Commons by Attribution (CC-BY) license (http://creativecommons.org/licenses/by/4.0/).
Share and Cite
Zhao, R.; He, H.; Zhang, N. Regional Water Footprint Assessment: A Case Study of Leshan City. Sustainability 2015, 7, 16532-16547. https://doi.org/10.3390/su71215829
Zhao R, He H, Zhang N. Regional Water Footprint Assessment: A Case Study of Leshan City. Sustainability. 2015; 7(12):16532-16547. https://doi.org/10.3390/su71215829
Chicago/Turabian StyleZhao, Rui, Hualing He, and Ning Zhang. 2015. "Regional Water Footprint Assessment: A Case Study of Leshan City" Sustainability 7, no. 12: 16532-16547. https://doi.org/10.3390/su71215829