Article

Impact of Electric Vehicles as Distributed Energy Storage in Isolated Systems: The Case of Tenerife

by
Alfredo Ramírez Díaz
1,†,
Francisco J. Ramos-Real
2,†,
Gustavo A. Marrero
3,4,*,† and
Yannick Perez
5,6,†
1
Facultad de Economía, Empresa y Turismo, Universidad de La Laguna, Camino la Hornera, s/n., La Laguna 38071, Spain
2
Dpto. Economía, Contabilidad y Finanzas, Instituto Universitario de Ciencias Políticas y Sociales, Universidad de La Laguna, Camino la Hornera, s/n., La Laguna 38071, Spain
3
Dpto. Economía, Contabilidad y Finanzas, Universidad de La Laguna, La Laguna 38071, Spain
4
Facultad de Económia, Empresa y Turismo, Instituto Universitario de Desarrollo Regional, Universidad de La Laguna, Camino la Hornera, s/n., La Laguna 38071, Spain
5
RITM Research Lab, University Paris-Sud, Sceaux, 92330, France
*
Author to whom correspondence should be addressed.
These authors contributed equally to this work.
Sustainability 2015, 7(11), 15152-15178; https://doi.org/10.3390/su71115152
Submission received: 28 July 2015 / Revised: 28 October 2015 / Accepted: 11 November 2015 / Published: 17 November 2015
(This article belongs to the Section Environmental Sustainability and Applications)

Abstract

:
Isolated regions are highly dependent on fossil fuels. The use of endogenous sources and the improvement in energy efficiency in all of the consumption activities are the two main ways to reduce the dependence of petroleum-derived fuels. Tenerife offers an excellent renewable resource (hours of sun and wind). However, the massive development of these technologies could cause important operational problems within the electric power grids, because of the small size of the system. In this paper, we explore the option of coupling an electric vehicle fleet as a distributed energy storage system to increase the participation of renewables in an isolated power system, i.e., Tenerife Island. A model simulator has been used to evaluate five key outputs, that is the renewable share, the energy spilled, the CO2 emissions, the levelized cost of generating electricity and fuel dependence, under alternative scenarios. Comparing to the current situation, combining a gradual renewable installed capacity and the introduction of an electric vehicle fleet using alternative charging strategies, a total of 30 different scenarios have been evaluated. Results shows that the impact of 50,000 electric vehicles would increase the renewable share in the electricity mix of the island up to 30%, reduce CO2 emissions by 27%, the total cost of electric generation by 6% and the oil internal market by 16%.

1. Introduction

Most of the island regions in the world are extremely dependent on fossil natural energy resources for their socio-economic development [1,2,3]. The Canary Islands are not an exception, and their energy dependence is almost absolute, with petroleum-derived fuels representing almost 98.9% of the total primary energy use in 2013 [4,5,6,7]. Part of the blame for this situation lies with their power generation system, which relies almost completely on the use of fossil fuels [8,9,10,11]: 7.3% of the electric generation comes only from renewable sources (4.1% wind power, 3.2% photovoltaic, 0.1% thermal and 0.03% small-hydro), and the rest of the mix is covered by oil power plants (combined cycle power plants, 34.7%; steam turbines, 29.6%; internal combustion engines, 24.0%; and gas turbines, 4.2%) [4]. Their distance to the Spanish coast (about 2000 km) and the fact that the archipelago is composed of seven islands (off the Moroccan coast) with six differently-sized isolated systems, limit the penetration of renewables and the inclusion of other more traditional sources, such as coal or nuclear.
In addition, the electric generating cost of using fossil fuel plants on the Canaries is higher than for the Spanish continental power system. This additional cost implies that producing electricity on the islands with renewables would be less expensive than producing electricity with fossil fuels [12,13,14,15]: about 47% less expensive for wind; and recently, the cost for the solar photovoltaic (PV) power has reached parity with fossil fuels [16]. Moreover, renewables are clearly less polluting in terms of carbon emissions. Thus, a challenging issue on the Canaries would be to increase the penetration of renewables in the generation of electricity, which would reduce not only the energy dependence, but also the cost of generating electricity and carbon emissions. However, introducing unpredictable energy sources (such as photovoltaic and wind) could generate important operational problems for the grid, especially in isolated systems, such as for islands. One possible solution to reduce these problems is to generate energy storage systems that would drastically reduce the intermittency problems of renewables and facilitate their penetration into the electricity system [17]. In this paper, we explore the option of coupling an electric vehicle (EV) fleet as a distributed energy storage system in order to increase the participation of renewables. This alternative is especially appealing in isolated systems due to the difficulty of integrating a large renewable capacity into such vulnerable systems.
In order to analyze the introduction of renewable energy sources (RES), we use a model simulator of the electric power system for Tenerife in 2013. The baseline setting depends on the observed operation data from the power system operator, as well as the electric demand and the wind and solar time series for 2013 on Tenerife. This scenario uses real-time operation data from the Tenerife electrical system in 2013 and reflects the current situation on the island. Data are taken every 10 min, for all technologies used on the island (combined cycle, steam turbine, gas turbine, diesel engines, wind power and solar photovoltaic) and from the transmission system operator [8]. Next, we use the model simulator under alternative levels of installed power capacity of renewables. The model has been designed for the special situation of an island power system. It includes restrictions on the minimum operation range, the amount of reserves required and the maximum installed capacity, for the conventional units. Thus, this model allows us to evaluate and compare different scenarios (with and without energy stored systems) in a short compilation time. The installed capacity of renewables goes from the 2013 levels of 37 MW for wind and 114 MW for PV up to the 402 MW for wind and 151.2 MW for PV targeted in the government energy strategy (2006–2015), PECAN (Plan Energético de Canarias) [18]. The Canaries (and Tenerife in particular) are nowadays far away from that target. The following set of outputs are obtained from the simulation (all are average for a year): share of renewables, cost of generating electricity, CO2 emissions, energy spilled and fossil fuel saved (in electricity and in road transport). In the second stage, these simulations are repeated for alternative energy storage systems, considering a vehicle-to-grid storage system and assuming different amounts of EV as part of the vehicle fleet on the island.
The comparison of the results under these alternative scenarios allows us to analyze the consequences of introducing energy storage systems in the penetration of renewables, as well as to evaluate their effects in terms of electricity generating cost and carbon emissions. For example, results show that the impact of 50,000 EVs in the Tenerife electrical power system, which is an average amount targeted by local authorities for the medium term for the island in 2024, could achieve an introduction of renewables of up to 29.6% in the electricity mix of the island (greater than the PECAN target), and at the same time, it would help to reduce CO2 emissions by 27% and the total cost of electric generation by 6%.
The rest of the paper is structured as follows. Section 2 shows a brief background about the concept of vehicle to the grid (V2G) and the energy storage systems in island regions. Section 3 describes the situation of the Tenerife electric power system; followed by the methodology of the model simulation and a summary of the alternative scenarios considered in our analysis. Section 4 shows the results of the alternative scenarios in terms of RES share, energy spilled, carbon emissions and cost and oil internal market. Finally, Section 5 is devoted to summarizing the main conclusions and extensions of the work.

2. Vehicle to Grid and Energy Storage in Isolated Systems

This section briefly reviews the literature related to EVs and energy storage systems. Three main issues are treated: The first one introduces the V2G technology. The second set of works studies the role of alternative energy storage systems in isolated areas, paying special attention to EVs. The third focuses on energy storage systems on the Canary Islands.
Kempton and Letendre [19] are some of the pioneers in the study of V2G systems. They analyze the concepts about the interaction between EVs and the electric power grid. These authors emphasize that EVs could provide additional advantages to the electric system operation, such as frequency regulation, backup supply and peak-hour savings. The EVs could help the system in the frequency regulation and demand response, first with the flexibility of loads, disconnecting the EVs instantaneously. In the first reaction, the EVs could contribute by helping the system in the primary frequency regulation and, seconds later, as a secondary reserve support. Sometimes, when the RES production falls unexpectedly, the EVs could help with sending energy into the electrical grids as a fast backup supplier. Finally, when we have a large EV fleet, we can inject energy into the system in peak hours to reduce the peak power and to reduce the contribution of gas turbines, which are more expensive and inefficient [20]. Meanwhile, Kempton and Tomic [21] show the contribution of EVs using a V2G strategy to participate in three different electric markets, the said peak power market, a spinning reserves market and a frequency regulation market. Applied to the U.S., they conclude that injecting energy from V2G in peaks is not competitive; however, using EVs as ancillary services could be profitable for the EV user.
The role of EVs as an energy storage mechanism has been widely explored by multiple researchers during the last five years. Turton and Moura [22] detail the potential of V2G systems over the long term (2100) using energy system modelling. Additionally, they debate the paradigm shift in how the energy and mobility markets are related. Farhoodnea et al. [23] analyze the impact of the high-penetration of EVs combined with renewable energy based on the distribution system. They create a model simulator, the results of which show that the presence of massive EV fleet introduction and distributed renewables could cause severe problems, such as frequency and voltage fluctuations, voltage drop, harmonic distortion and power factor reduction. However, Dang et al. [24] evaluate the impact of photovoltaic power introduction and electric vehicles in the operation of the power transformer within an eco-district. They assume the interaction of an energy management system operator with V2G capabilities. The results show that EVs and photovoltaic power have an important impact on the overloading periods, however mitigating the energy flows and peak power with the operation of the management system. Haidar et al. [25] assess the impact of the grid-integrated vehicles on future smart grids. Their results show that the EV penetration in the grids could reduce the cost of energy to charge. A general conclusion from this recent literature is that EVs could supply energy storage services to the grids, including smart grids. Nowadays, there are some experiments around the world testing the technical feasibility of this interaction (the VtoG project in Delaware, the Nikolai Project in Denmark, Jeju Island in Korea, the U.S. army in California, etc.).
From a technical point of view, the islanded power system is more tightly dimensioned and, therefore, less able to respond to shocks (the loss of a group has a greater impact on the network than in a continental grid); second, the voltage drops have a significant effect in the grids; third, the balance of the system (between the production and demand) is much more difficult to achieve, requiring more reserves to secure the operation of the system; and finally, each isolated system is different from the other ones and depends to a large degree on the weather, the population and the economic activity developed in the region. In this sense, isolated regions have specific characteristics, as emphasized by Rious and Perez [17]. These authors analyze the Island of Reunion and estimate that the level of penetration of unmanaged RES (i.e., PV or wind energy) must be below 30% in order to maintain the security balance between production and demand. They propose alternative energy storage systems in order to increase the level of penetration of renewables, proposing the use of batteries as an appropriate solution to achieve this target in the short run for the island. Following this line of inquiry, [26] concludes that introducing large-scale energy storage systems could help to increase the penetration of renewables in the electric generation mix.
Other works analyze the role of EVs as a distributed energy storage system in isolated regions. One exception is [27], which studies the island of Sao Miguel in the Azores archipelago and combines the introduction of geothermal power plants and wind power supplies with a grid for vehicle (G4V) management system. In the most favorable scenario (5900 EVs, 30% of additional geothermal and 10 MW of wind power), the paper concludes that 52 million Euros can be saved, and this could allow an introduction of 64% of RES on weekdays and 70% on weekends. Another exception is [28], which analyzes Samsoe Island (Denmark). They reach 100% renewable electricity production, and so, the EV could be considered as a well-to-wheels zero emissions vehicle, reducing fossil fuel use and oil imports drastically on the island. Finally, [29] analyzes the situation of Prince Eduard Island, which assumes a total of 18,726 EVs by 2030. They expect an annual CO2 emissions reduction of around 115,000 tonnes by that date. A general conclusion from all of these works shows the capacity of EVs to integrate larger amounts of unmanaged RES into isolated power systems.
For the Canary Islands, there are few works that analyze the impact of alternative energy storage systems. Bueno and Carta [30] focus on the introduction of pumping hydro stations as energy storage systems on El Hierro and Gran Canaria. They use two reservoirs with a difference in height between both of 281 m and a capacity of 5,000,000 m3 used in each. The system includes a 20.4-MW wind power plant, and according to this plant, they propose a 17.8-MW flexible pumping station and a 60-MW hydroelectric power plant. This solution increases by 1.93% the penetration of unmanaged RES on the islands. Marrero, Ramos-Real, Pérez and Petit [15] analyze the introduction of an EV fleet as energy storage in order to evaluate the impact on the electric efficient frontier of the islands. Following a mean-variance portfolio theory, the authors estimate different electric efficient frontiers under alternative scenarios, with and without EVs as a storage system. They conclude that EVs can reduce the use of fossil fuel technologies and increase the maximum feasible share of wind, thus reducing carbon emissions and the electricity generating cost.
Our paper attempts to contribute to this recent literature, which combines the energy storage capacity of EVs with the degree of penetration of renewables and with the peculiarities of isolated systems, such as the Canary Islands.

3. The Electric Power System on Tenerife: Description and Model Simulation

In this section, we first show the basic characteristics of the electric system on Tenerife, and secondly, we present the simulation model used for the electric power system on Tenerife. Regarding the observed data from 2013, two variations will be analyzed mainly. The first one assumes gradual increases of the renewable installed capacity; the second takes into consideration an energy storage system through the use of a fleet of EVs.

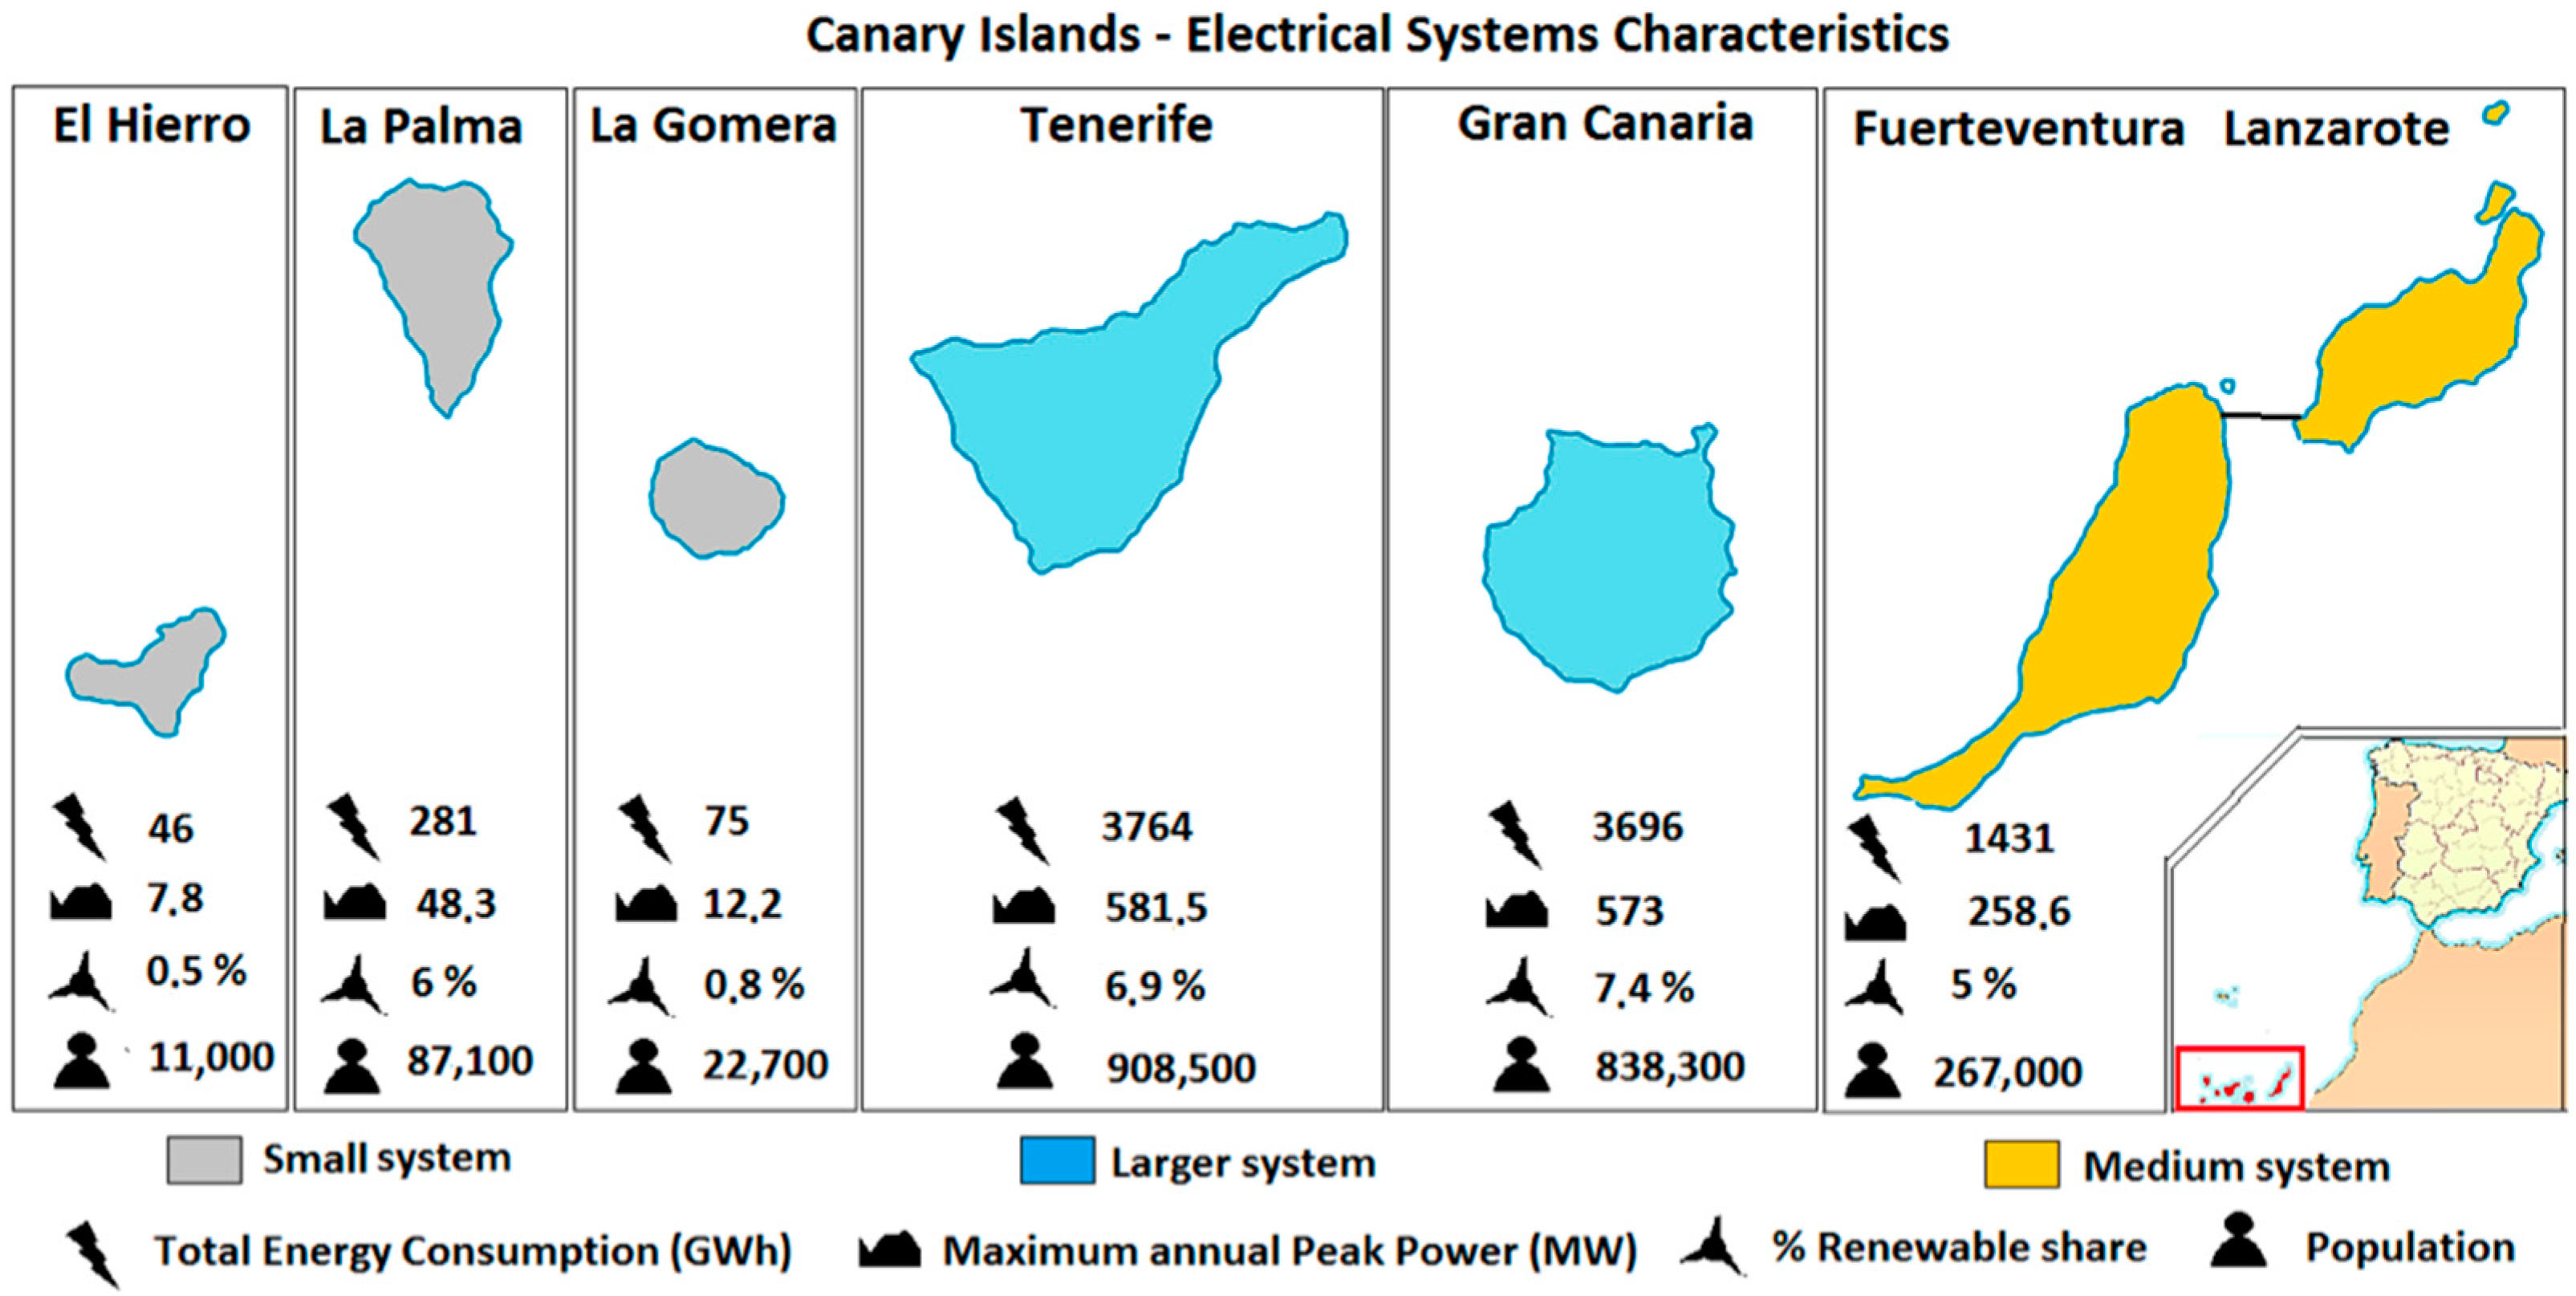
3.1. Tenerife Electric Power System

The Canary Islands archipelago is composed of six-isolated electric systems in which Gran Canaria and Tenerife are the largest in terms of power installed and electricity demand. Figure 1 shows the main characteristics of the different systems on the Canary Islands during 2013 (Anuario Energético de Canarias, 2013) [3]. The islands of Tenerife and Gran Canaria are the two largest isolated systems with a similar maximum demand of around 540 MW. Lanzarote and Fuerteventura represent one electric system (they are connected by an underwater cable), which is medium sized (around 240 MW of maximum power); the rest of the islands have small electric systems (less than 45 MW of maximum demand). All of the conventional power plants use fuel oil, gas oil and diesel oil. Thus, the Canary Islands systems are highly polluting, with overruns, and are also highly inefficient [2]. The two biggest systems have installed combined cycle power plants and steam turbines in order to build the base load of the power production, while the rest of the islands use diesel engines to cover the majority of the electricity demand and offer more flexibility to the demand response.
Figure 1. Main data for the Canary Islands electric power system in 2013.
Sustainability 07 15152 g001
There is neither a wholesale nor a secondary market of electricity generation with hourly biddings on the Canary Islands. Thus, the price of electricity is not determined by a market mechanism. Instead, there exists an “order of merit” for each power plant, giving priority to the generation of renewables (wind and PV for the case of the Canaries). This “merit order dispatch” is managed by the (Transmission System Operator) TSO (Red Eléctrica de España (REE)) and follows Order (Instrucción Técnica Complamentaria) ITC/913/2006 [31]. The Order is mainly based on a set of electricity generation variable costs published by REE. REE only publishes the average cost per hour in the Canary Islands system, but a detailed analysis by technologies is missing, which the comprehension of the entire process difficult. Given these variable costs, companies participating in the production of electricity are remunerated through a particular system, which is supported by the Spanish regulation. On the one hand, fossil fuel (ordinary regimen) technologies are compensated for their higher costs compared to the mainland. The compensation depends on the difference between the declared cost and the average annual price of the Spanish continental region. On the other hand, renewable energies and co-generation (special regime) technologies are remunerated through a feed-in tariff (FIT) device. See [31,32,33,34] for a more detailed discussion about this issue.
We take Tenerife as our case study; first, because it is the biggest island and the one that consumes the most energy on the Canary Islands; second, the system includes all of the possible conventional technologies used in the archipelago; third, we can use data from the travel routines of drivers to calibrate the equations of EVs as energy storage systems [34]. The system on Tenerife is characterized by having two conventional power plants. The first is located in the municipality of Granadilla de Abona, in the south of the island. It has a total installed capacity of 774 MW, including two blocks of combined cycles, which are composed of two gas turbines and one steam turbine. Additionally, we have the Candelaria power plant, which is an old conventional power plant. It is roughly composed of two stream turbines, three diesel engines and six gas turbines. Table 1 shows the most important technical characteristics of the installed power capacity on Tenerife.
Table 1. Summary of the characteristics of the power plants installed on Tenerife in 2013.
TechnologyNo.Power per UnitTotal PowerMinimum Operation RangeLCOEType of Fuel UsedEmissions Rate
MWMWMW€/MWh-KgCO2/MWh
Combined Cycle2220440110169Gas Oil650–700
Steam Turbine38024045165Fuel Oil850–900
Gas Turbine6352108320Gas Oil1200–1250
Diesel Engines3247212130Fuel Oil750–800
Wind Power--37-72--
Photovoltaic--114-118--
In our paper, we consider the minimum operation range as a parameter that covers the minimum capacity range of a power plant that permits secondary reserves downwards around half of their secondary reserve capacity upwards. The minimum operation ranges for the combined cycle, steam turbine, gas turbine and diesel engines are 110 MW, 38 MW, 8 MW and 12 MW, respectively. Additionally, the maximum operation range is limited by the capacity installed. Following the same order, the maximums are 440 MW, 240 MW, 210 MW and 72 MW. For the steam turbine and diesel engines, the capital cost is zero, due to the power plants having an age of more than 25 years on average. However, we consider the double cost on the (Operation and Maintenance) O&M; see Appendix 1 for more details about the Levelized Cost of Energy (LCOE).
The main renewable facilities are located in the south of the island. The wind power plants are obsolete compared to current production technologies, as they have an average age of 12 years. In this period, the technology and the size of the wind turbines have experienced a huge development. However, the photovoltaic power installed is less than seven years old and is relatively modern. Thus, regarding power capacity and the introduction of renewables into the electric grid, the main problem is located in the south area of the island.
In order to have a better understanding of the electric system on Tenerife, two representative days in 2013 have been chosen: one winter weekday with a significant introduction of renewables, but with intermittence (6 February 2013); a second day corresponding to a summer weekend day, with an acceptable renewable introduction and not much intermittence (1 September 2013). Figure 2 shows the renewables load factor (wind and solar) on the selected days. Sharp curves represent summer days, and continuous curves represent winter days. The wind curves represent the usable wind resource in relation to what could be obtained working at a 100% load. The solar resource has a more stable behavior in summer. On the contrary, in winter, the resource intermittence makes the solar resource curve unpredictable.
Figure 2. Load factor for the renewable energy source: (a) 6 February wind power; (b) 6 February photovoltaic; (c) 1 September wind power; (d) 1 September photovoltaic.
Sustainability 07 15152 g002
For the same days, we also show daily demand curves, as well as load curves for each technology that operated on those days (Figure 3, winter; Figure 4 summer). In both cases, the blue curve represents the system’s demand. During the off-peak hours, when demand is low, the system’s core technologies are operating (steam turbine (ST) and combined cycle (CC)), the combined cycle being the one that adjusts in order to balance the system and to keep the introduction of renewables at the maximum (wind power (WP) and photovoltaic (PV)). However, at certain times, the energy produced by renewables is quite high, and the system is unable to insert it into the grid in order to maintain security conditions. This happens during the daytime for the winter graphic and during most of the day in the summer. In those circumstances, a great loss of energy is noticed (energy spilled). Moreover, the gas turbine (GT) would only operate during system peaks, whereas the diesel engines (DE) are at relatively high loads in order to maintain the frequency of the system constant.
Figure 3. Winter operation of the system (Scenario 1, 402 MW wind power and 151 MW photovoltaic). 6 February 2013.
Sustainability 07 15152 g003
Figure 4. Summer operation of the system (Scenario 1, 402 MW wind power and 151 MW photovoltaic). 1 September 2013.
Sustainability 07 15152 g004

3.2. Methodology: Simulation of the Electric Power System on Tenerife

The simulation of an electric power system attempts to characterize the instant operation of alternative power technologies during a particular period of time. The purpose of our exercise is to characterize relevant outputs for energy management—renewable share, generation cost, CO2 emissions, energy spilled and oil internal market—under alternative scenarios and taking into account the particular characteristics of an isolated island, such as Tenerife. Thus, while the application of an optimizing methodology, such as unit commitment [35], will be a natural and promising extension of the paper, our simulation model just attempts to represent the current operation of the power system on Tenerife and the resultant outputs consistent with the real-life conditions of the island.
The scenarios considered attempt to measure the impact of two aspects on the electric power systems on Tenerife: more installed capacity of renewables (wind and PV) and the introduction of EVs as an energy storage system. This way, when comparing the results under different scenarios, we will obtain important conclusions about the changes in the renewable share, electricity production costs, CO2 emissions, energy spilled or internal fuel consumption on the island, which will be of great use for the design of the islands’ energy policy.

3.2.1. Scenarios

The baseline scenario represents the observed data for the current electricity power system on Tenerife during 2013. For the entire year, combined cycles accounted for 42.7% of the mix, steam turbines 35.2%, diesel engines 8.1%, gas turbine 6.4% (with cogeneration) and, finally, renewables 7.6% (5.5 photovoltaic and 2.1% wind power) [4]. For this mix and the data in Table 1, the share of renewables is about 7.5%; LCOE is 165.53 €/MWh; and the emissions rate is about 0.729 kgCO2/kWh. This 7.5% level is far from the 25% targeted by the PECAN in 2006 and to be achieved by 2015. In order to achieve this 25% share, the PECAN predicts that the installed capacity of renewables must increase up to 402 MW for wind and 151 MW for PV.
Thus, we will modify the baseline scenario and simulate the Tenerife electric power system under alternative levels of MW installed for renewables. We will gradually increase the MW from the baseline scenario until the 553 MW targeted by the PECAN is achieved.
In the second stage, two different scenarios will be proposed for the introduction of the electric vehicle to the electric system. A fleet of 10,000 EVs will be included in the first scenario and 25,000 in the second. In these two scenarios, EVs will only be able to receive energy from the grid (G4V). Fleets will be managed by an aggregator (aggregator managing) that will allow an over-night charging in order to increase the off-peak of the system and flatten the total demand curve. In addition, this manager will be able to send spare renewable energy to the batteries of the connected electric vehicles so that the charge energy is cleaner. Government estimates suggest 10,000 EVs in 2019 and 25,000 in 2021–2022 [36].
Finally, another two scenarios with EVs will be analyzed. In these two cases, the V2G system is considered with two fleets of vehicles (25,000 EVs and 50,000 EVs). In the V2G scenarios, besides the over-night charging, a strategy of injecting energy into the grid in peak hours has been added. Therefore, a bidirectional V2G system will be used in order to support the grid, both as a backup for the intermittence of renewables partially replacing the diesel engine and the combined cycle (less than 0.5% of the total year production). The other contribution occurs during peak hours partially replacing the open-cycle gas turbine (less than 2.5% of the total year’s production). The V2G contribution to the system will be analyzed by comparing the results of the 25,000 EV scenario with and without V2G. The amount of 50,000 EVs will be considered as a long-term goal, which could be achieved by 2024 according to [36]. This same number was used in Marrero et al., 2015 [34], to study the impact of an EV fleet on the electricity generating efficient frontier on Tenerife.

3.2.2. The Simulation Strategy

Next, we describe the main features, equations and restrictions on which our strategy to simulate Tenerife's electric system under different levels of installed RES is based. In this first part, we set aside the introduction of EVs as a storage system. We set 2013 as our reference year, taking the electricity demand patterns and the renewables’ load curves as representatives. We also establish the conventional sources’ installed power for each case (combined cycle, steam turbine, gas turbine and diesel engines).
Given these aspects, this interesting simulation exercise consists of increasing the renewables’ installed power on Tenerife, while keeping the installed capacity of conventional power plants constant, but adjusting their use so that certain restrictions of the electric system (the balance of the system, the minimum operation range, the maximum operation range and the secondary reserves condition) remain fulfilled.
D t = n = 1 4 P n , t + P w i n d , t + P p v , t
where Dt is the electricity demand at each time t; Pn,t represents production with conventional energies; and the last two terms are production with wind and PV. As renewables have a priority when entering the grid, the production of those will depend on the installed power and also on their load curves for each time. A set of technical restrictions, which must be fulfilled at each time, will be described below.
Thus, the simulation exercise could be described as follows. For each period of time, we take the demand and the wind and photovoltaic load curves as given. Thus, when the renewable installed power increases (for instance, we go from 37 MW–402 MW of wind and from 99 MW–151 MW of PV), Equation (1) would be unbalanced for most of the periods analyzed in 2013. In fact, balance could only be maintained for periods in which no electricity was generated with renewables or in times with a low penetration of renewables during 2013.
We start by making some adjustments in the conventional energies’ production levels. For simplicity, these adjustments are carried out proportionally and for the whole of 2013. First, we adjust (raise) the diesel engines in order to cover the greater cost of intermittence, as there is more RES installed. Secondly, we reduce the gas turbine production in order to increase the renewable capacity during peaks, as long as the combined cycle is able to cover the shortage in the case of a renewable deficit. Third, we reduce the load of the steam turbine at the base of the system in order to introduce a greater renewable capacity into the mix. Thus, the left-hand side of Equation (2) shows the electricity produced with the combined cycle technology, which is obtained as a residual of existing electricity demand minus the production of the other three conventional technologies and the renewable production under the new scenarios (for example, under the PECAN scenario). The combined cycle technology is used as the buffer in Equation (2), because, in large isolated systems, such as Tenerife, it acts as the base load of the system, but it also shows a high flexibility to adapt to the renewables’ intermittencies.
P c c , t 1 = D t n = 1 3 P n , t 1 + P w i n d , t 1 + P p v , t 1
where, now, the superscript “1” refers to the new situation. In all of these adjustments, we must impose two boundary constraints based on the minimum operation range (Lmin, n) and the maximum operation range (Lmax, n) for each power plant. Additionally, no unit can produce below zero or above its installed capacity (see Table 1).
Lastly, we have to point out that in Equation (2), when the production of renewable is very high, Pcc,t1 could be zero or negative, which is unfeasible. In this situation, the simulation model must additionally cut down the production of electricity with renewables in order to maintain the equilibrium condition Equation (1) under the new circumstances. Thus, some renewable energy produced is lost or spilled out of the system.
For the correct operation of the electric power system, our model accomplishes some additional restrictions and requirements concerning the determination of the primary and secondary reserves. The following production units compose the base load of the system: steam turbines and combined cycle. These are responsible for maintaining the stability and the inertia of the system. According to the TSO requirements for the Canary Islands’ power system (see [31] for more details), the production of these units must be greater than 40% of the instant power generated at each moment of time (every 10 min in our case) in order to guarantee the security and the stability of the power system on the island. This restriction limits the penetration of renewable energies up to 60% of total generation in a particular period of time. Whenever the generation of electricity with renewables exceeds this share, the system cannot absorb the extra energy generated, and the energy is spilled.
While primary reserves are ensured by the operation of the generators in a short period of time (less than 5 min), secondary reserves, which are covered by the combined cycle, the diesel engine and the gas turbine in most of the situations, are the ones used to manage the intermittency of renewables (i.e., to guarantee the aforementioned 40%). Thus, we focus on secondary reserves and leave aside the control of primary reserves, which plays a minor role for our purposes. See the ITC/913/2006 for more details about this point.
Additionally, the spinning reserves are covered by diesel engine technology. It must be constantly connected to the system, and its production must be at least 6% of the total coverage of the system for the entire year. Moreover, two additional percentage points are added to the 6% every 100 MW of installed capacity of renewable energy to cover the extra intermittency impact.
Finally, tertiary reserves, which are used to guarantee reliable grid operation (between 15 min and 1 h), are covered every period in our case. Since Tenerife has 210 MW of gas turbines capacity and 72 MW of diesel engines, we have at least 200 MW offline, but ready to start up in less than 15 min. Since this quantity is more than enough to cover the system requirements in terms of tertiary reserves, tertiary reserves are not explicitly modelled.
For each case, we will obtain yearly values from the following outcomes, which will help us compare each of the considered scenarios. These outcomes are: (i) renewable share (%), which is defined as the total renewable energy introduced into the electric grids compared to the total energy consumed; (ii) the cost (€/MWh) of generating electricity, which is calculated according to the LCOE for each technology (see Table 1), and the average value is the weighted sum of the cost per technology divided by the total energy consumed; (iii) carbon emissions (kgCO2/kWh), which are calculated following an emission rate by technology (see Table 1); the average of the emissions rate is the total emissions produced during the year per each kWh generated; (iv) energy spilled (%), which is the total renewable energy that could not be injected into the system, and it is measured as the total renewable energy that is not injected into the system between the total renewable energy available; (v) oil internal market (%), which is calculated as the total TOE (tonnes of oil equivalent) reduction (in transport due to the EV use plus electricity production) divided by the total oil imports from the internal market of Tenerife.

3.2.3. EV Fleet Characterization

In this section, we describe the impact of the introduction of an EV fleet on the electricity-generating system on Tenerife. Thus, the simulation model for the system operation explained above is complemented by the introduction of electric vehicles with energy storage.
We consider two groups of EVs: first, the type of EVs that are only used for road transport, thus the energy flows only in one direction (grid for vehicle); the second type of EV contains the V2G capability, which could manage the electricity in a bidirectional way (grid for vehicle and vehicle to grid). In both cases, the smart charging management can recover spilling energy from renewables’ overproduction. However the EVs with the V2G function could provide additional services to the system, such as backup supply and peak power shaving.
When the EV is considered, some additional features appear in the model, such as the number of EVs (NEV), the average millage in road transport (ECroad) and the EVs’ total storage capacity (SEV). Moreover, the model also considers a security factor of the minimum operation state of charge (SOCsec) of 15% to refrain from jeopardizing the batteries. The model also contemplates the characterization of the electric vehicle supply equipment (EVSE). We create two groups of EVSE: “at home” and “at the workplace”. For each type of EVSE, the model requires a number of charging points (Nhome, Nwork); the power considered (Phome, Pwork); and the efficiency of the charger (Eff). We use [34] to pick average values for these parameters and others described above, which are all summarized in Table 2.
Table 2. Summary of the EV fleet parameters. V2G, vehicle to grid.
PARAMETERABBREVUNITSQUANTITY
Average millage in road transportECroadkWh/km0.18
Number of EVsNEV-10,000/25,000/50,000
EVs’ total storage capacity (10,000; 25,000; 50,000)SEVMWh204/510/1020
Minimum operation state of chargeSOCsec%15
Efficiency of the chargerEff%86
Number of charging points at homeNhome-10,000/25,000/50,000
Number of charging points at the workplaceNwork-500/1500/3000
Power of the charging point at homePhomekW7
Power of the charging point at the workplacePhomekW22
Total V2G installed capacity (Scenarios 4 and 5)Pv2gMW208/416
Average distance travelled (weekdays/weekends)Dtravkm35/40
Minimum demand required for injection in peaksPmin, peakMW450
Minimum renewable drops for the reservesFmin, backupMW15
Minimum state of charge to inject energySOCmin, V2G%40
Given these parameters, the total installed capacity (in MW) that the V2G fleet can provide to the system at each moment (CV2G,t) is defined in Equation (3): the total number of vehicles connected at period t (NV2G,ON,home, t; NV2G,ON, work, t) multiplied by the average capacity of the charging stations and their charging efficiency,
C V 2 G , t =   ( N E V , O N , h o m e ,   t   P h o m e E f f ) a t   h o m e +   ( N E V , O N ,   w o r k ,   t   P w o r k E f f ) a t   w o r k
In addition, the EV fleet requires energy to charge the batteries according to their use (kilometers driven). Thus, in the scenario where a fleet of EVs is included, the overall demand of electricity in the power system (Dt in Equations (1) and (2)) increases. For simplicity, we focus on an overnight charging strategy, instead of on an uncontrolled charging mode. The over-night charging mode allows raising the off-peak of the system and increasing the penetration of renewables. To represent the over-night charging mode in the model, we create a charge variable (DEV,t), and we also define the efficiency of the charging station and the state of charge of the battery (SOCEV,t). Thus, when simulating the model under the presence of an EV fleet, we must include the new demand in Equations (1) and (2) in substitution of the baseline demand (Dt), composed of the baseline demand plus the EV electricity demand. The energy in the EVs could be consumed in three different ways: road trips, backup supply and peak shavings.
For road trips, the EV energy consumption depends on the particular average distance travelled (Dtrav), the number of vehicles and the average millage of the fleet. This consumption is located outside the charging station. However, for EVs using a V2G capacity, cars provide energy from the batteries to the grid. Thus, in order to keep the reliability of the system stable, the batteries of the EVs could send energy to the system in order to cover drops (Ebackup,t) when the renewable drop is over a reference value (Fmin, backup). Furthermore, the EVs could inject energy into the system in peak hours (Epeak,t) only if the total demand is above a particular limit (Pmin, peak). Additionally, the condition of a minimum state of charge (SOCmin, V2G) must be fulfilled. Thus, we must consider the inclusion of the instant power from the backup (Pbackup,t) and the instant power from peak shavings operations (Ppeak,t) in Equations (1) and (2) as a part of covering the instant demand.
The injection of energy into the system is limited by the capacity of stored energy in the vehicle’s battery at each moment. This restriction is measured by the average SOC of vehicles’ batteries connected to the grid at each moment. Appendix 2 contains the formulas to calculate the stored energy in the batteries at each considered moment, as well as the corresponding state of charge.

4. Results and Discussion

In this section, we describe the results obtained from the simulation model mentioned above. First, we analyze the effect of introducing different levels of renewable installed power in Tenerife’s electric system (wind and photovoltaic). We use the supply and demand conditions that define Tenerife’s system for 2013 [8]. From this starting scenario, progressive increases of renewable power installed are considered until reaching the 402 MW of wind and 151 MW of PV suggested by the PECAN (2006) [18]. Afterward, a second simulation exercise is carried out, which not only considers the current generating technologies and the progressive increase of renewable installed power, but also the presence of EVs as an energy storage system. The four alternative cases that we analyze were already described in detail in the previous section: 10,000 EVs; 25,000 EVs; 25,000 V2G; 50,000 V2G.
As was also mentioned above, the different simulation scenarios are compared in terms of the effect on the RES share, electricity generating cost, carbon emissions, energy spilled and consumed oil in the internal market. These four variables are of great importance when it comes to making decisions in the field of energy policy.

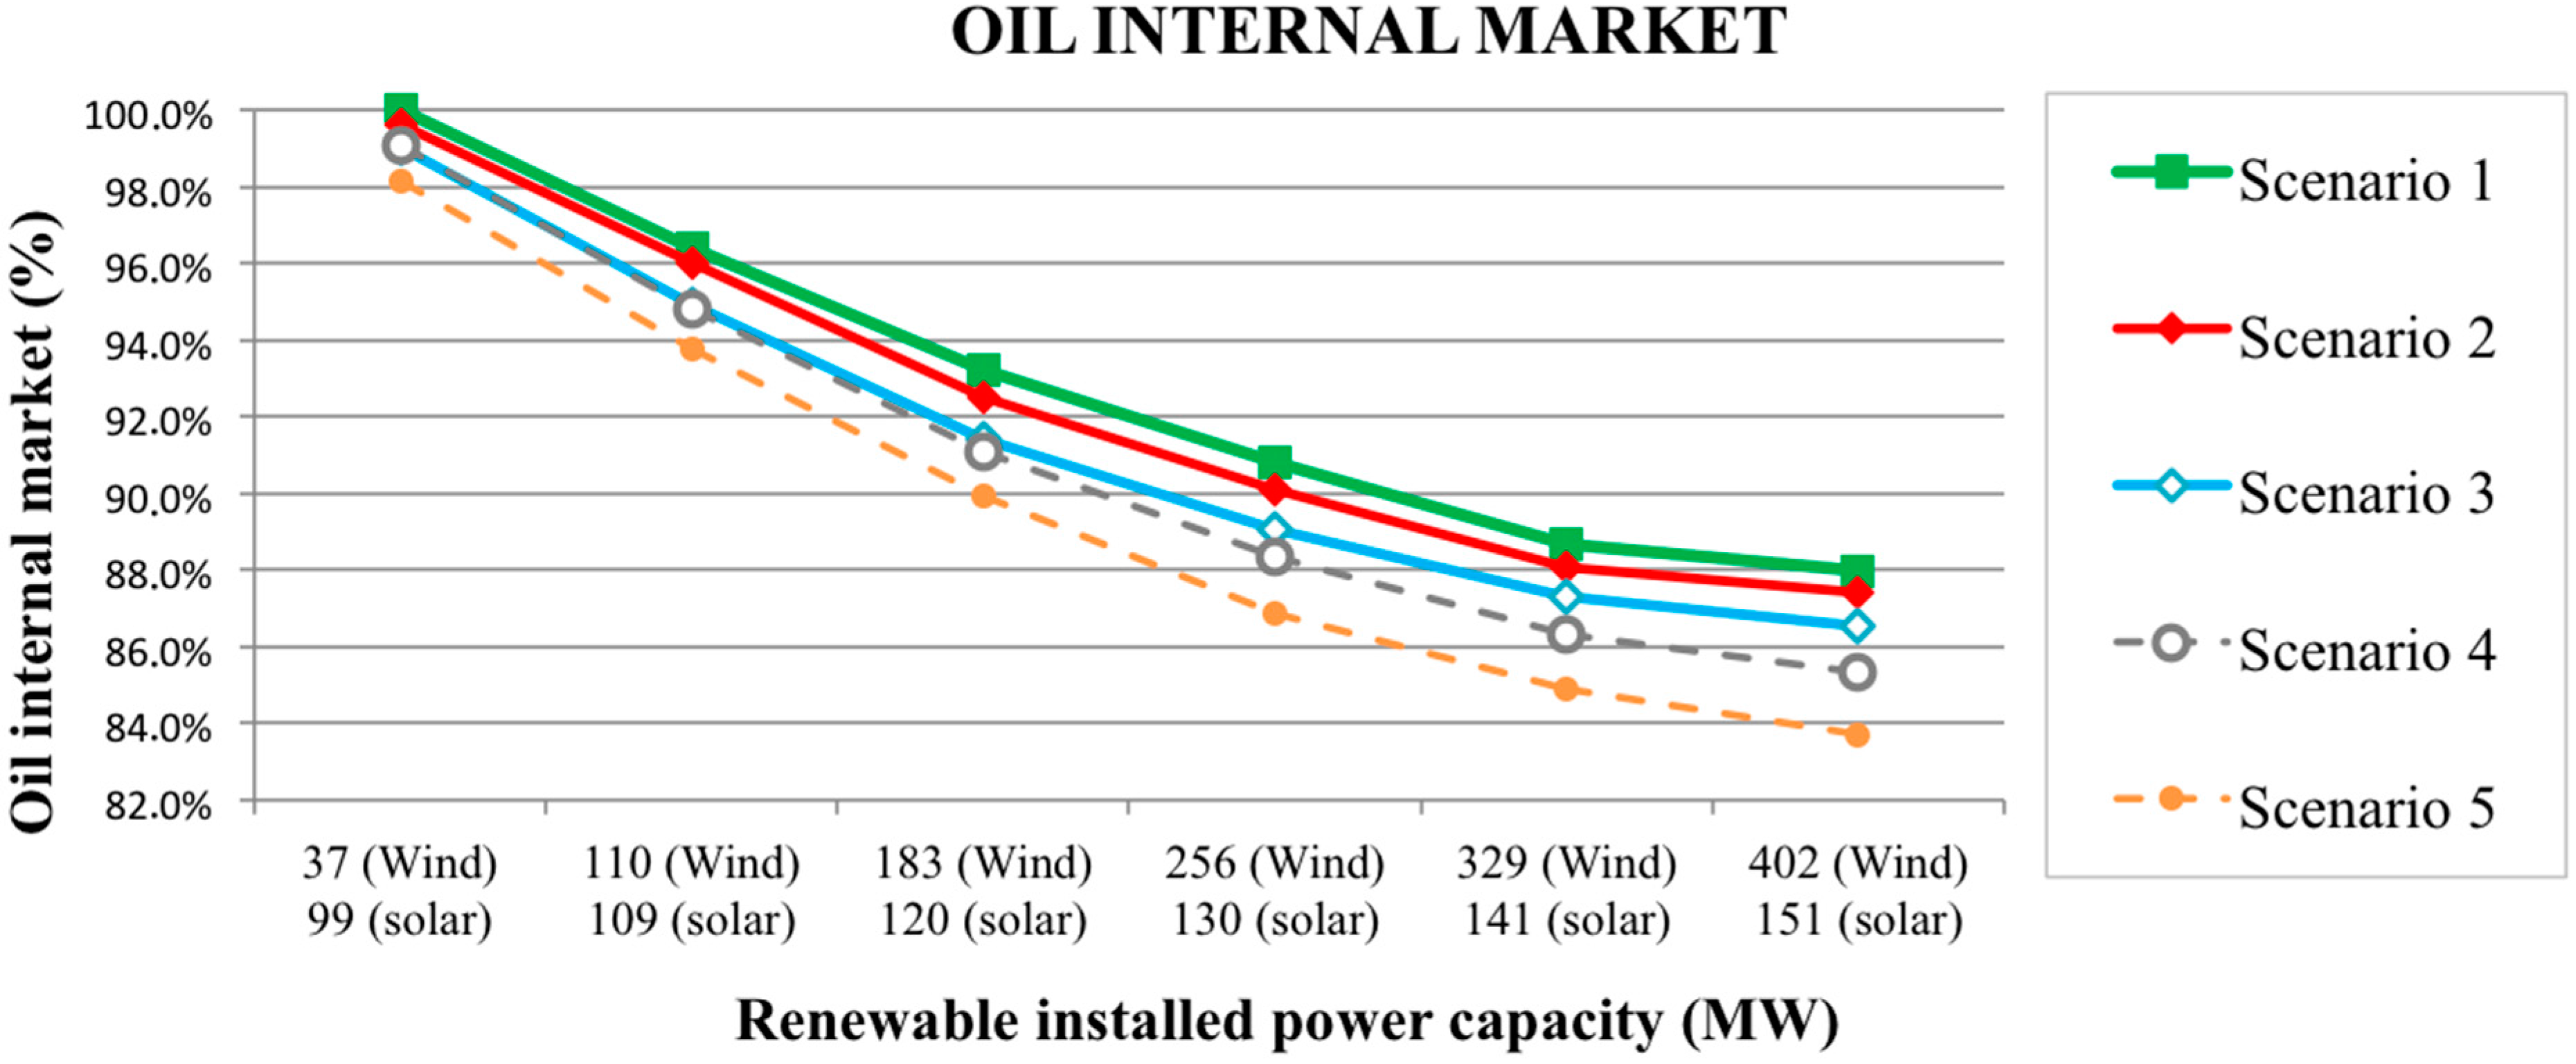
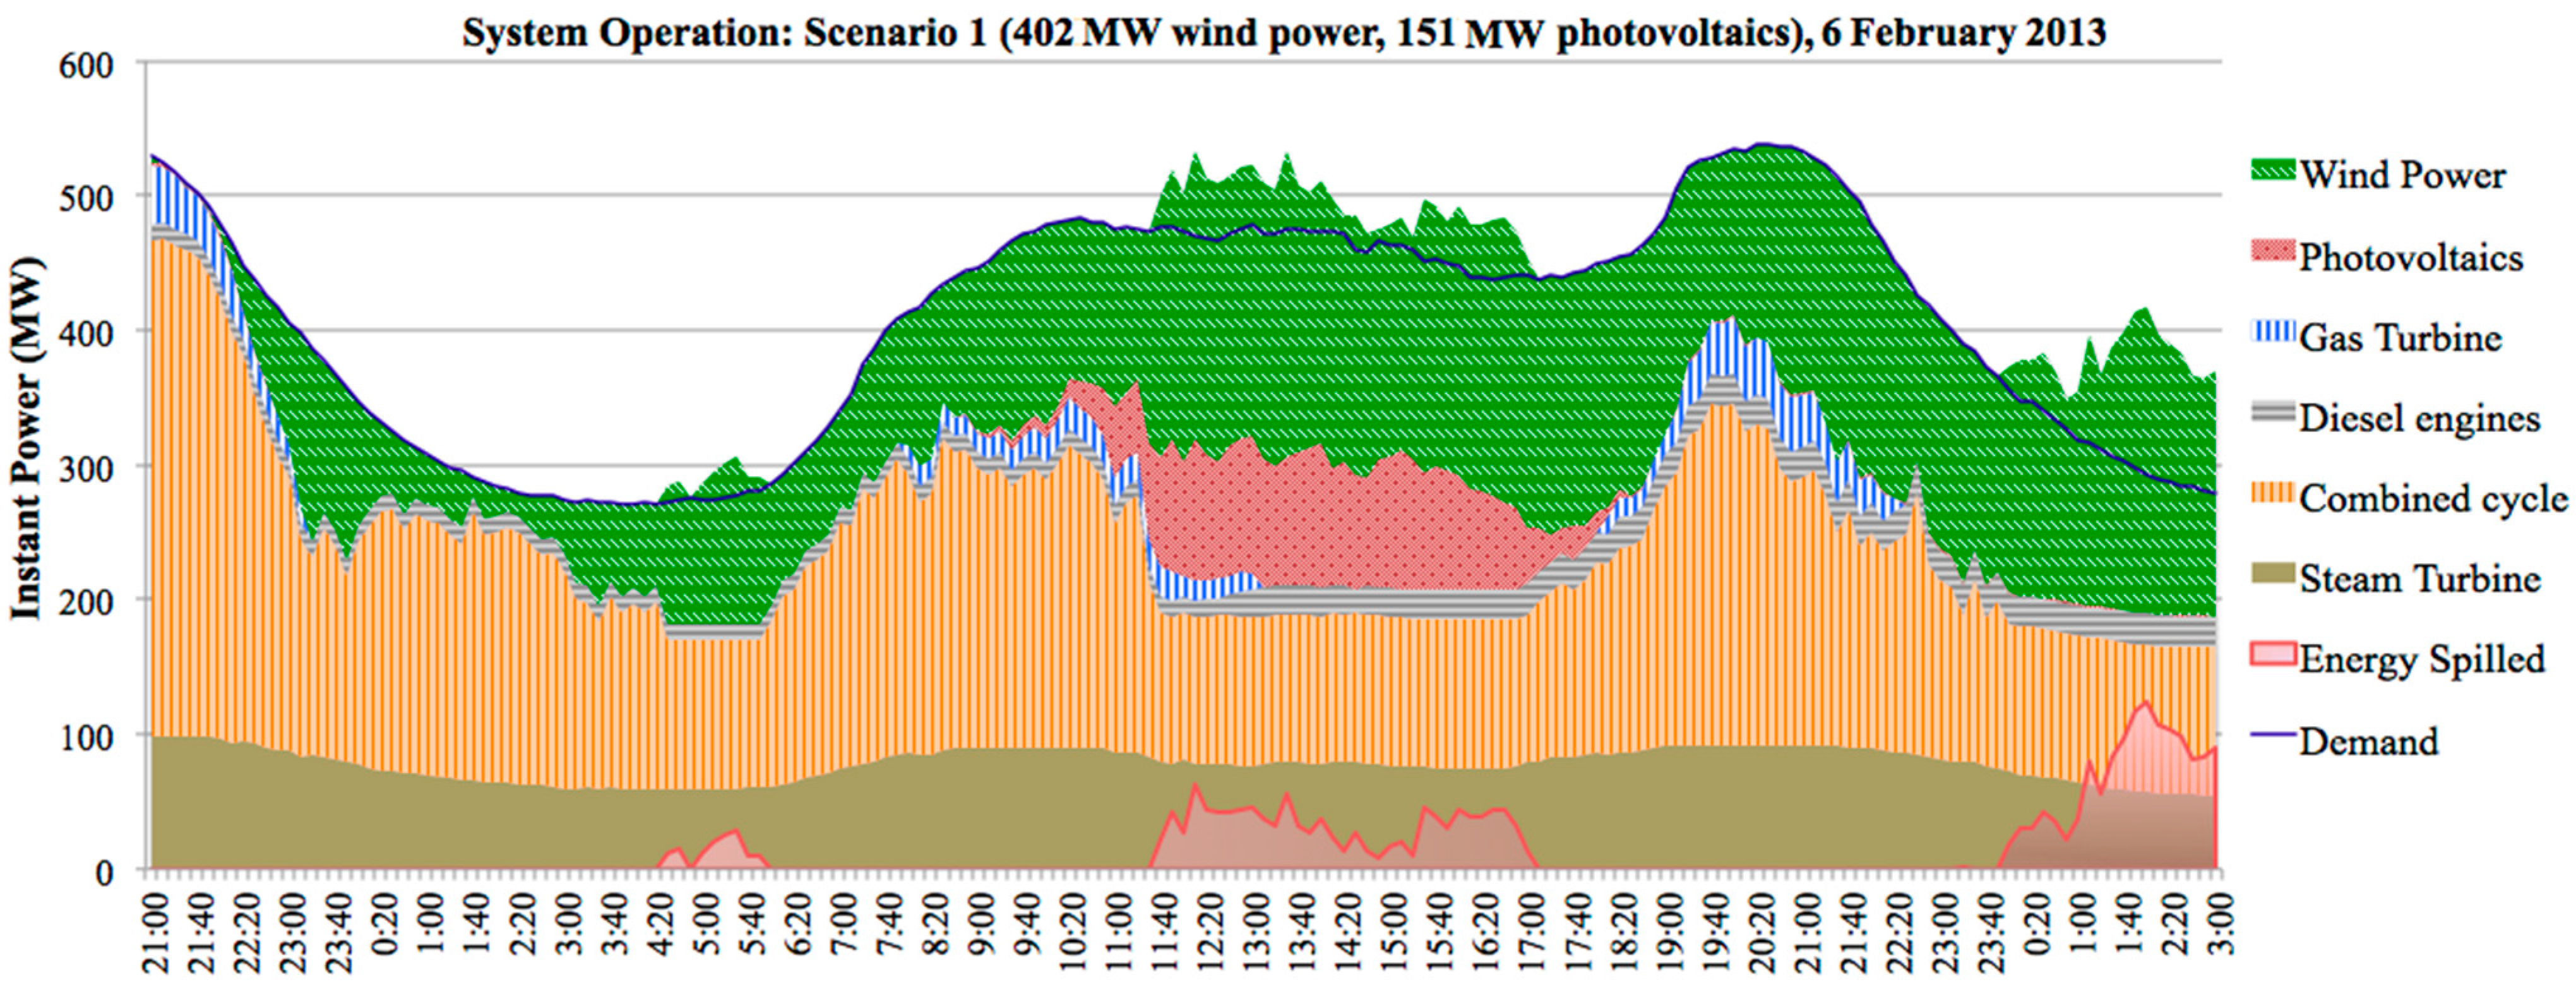
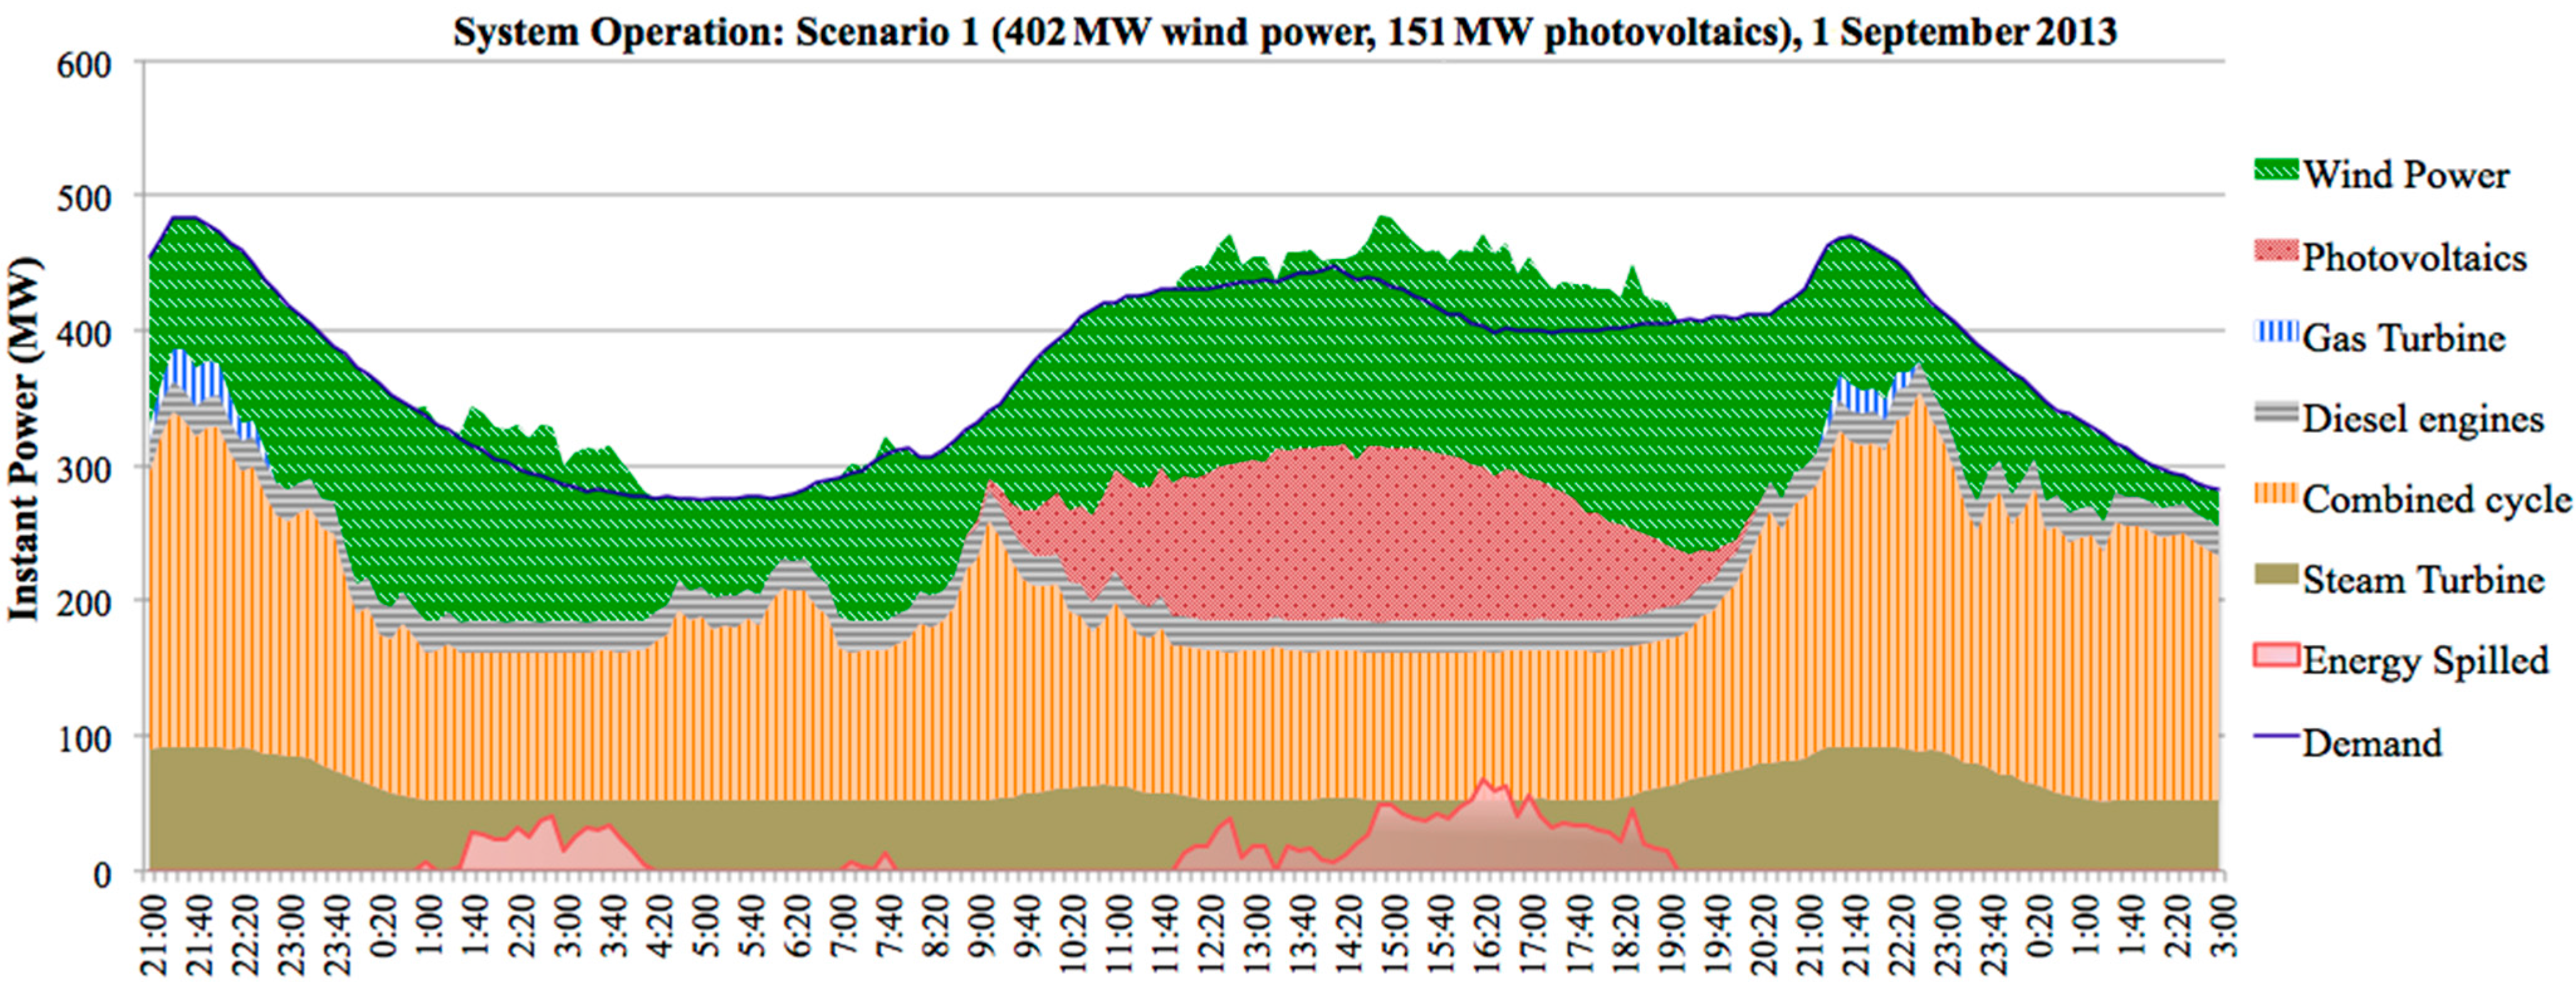
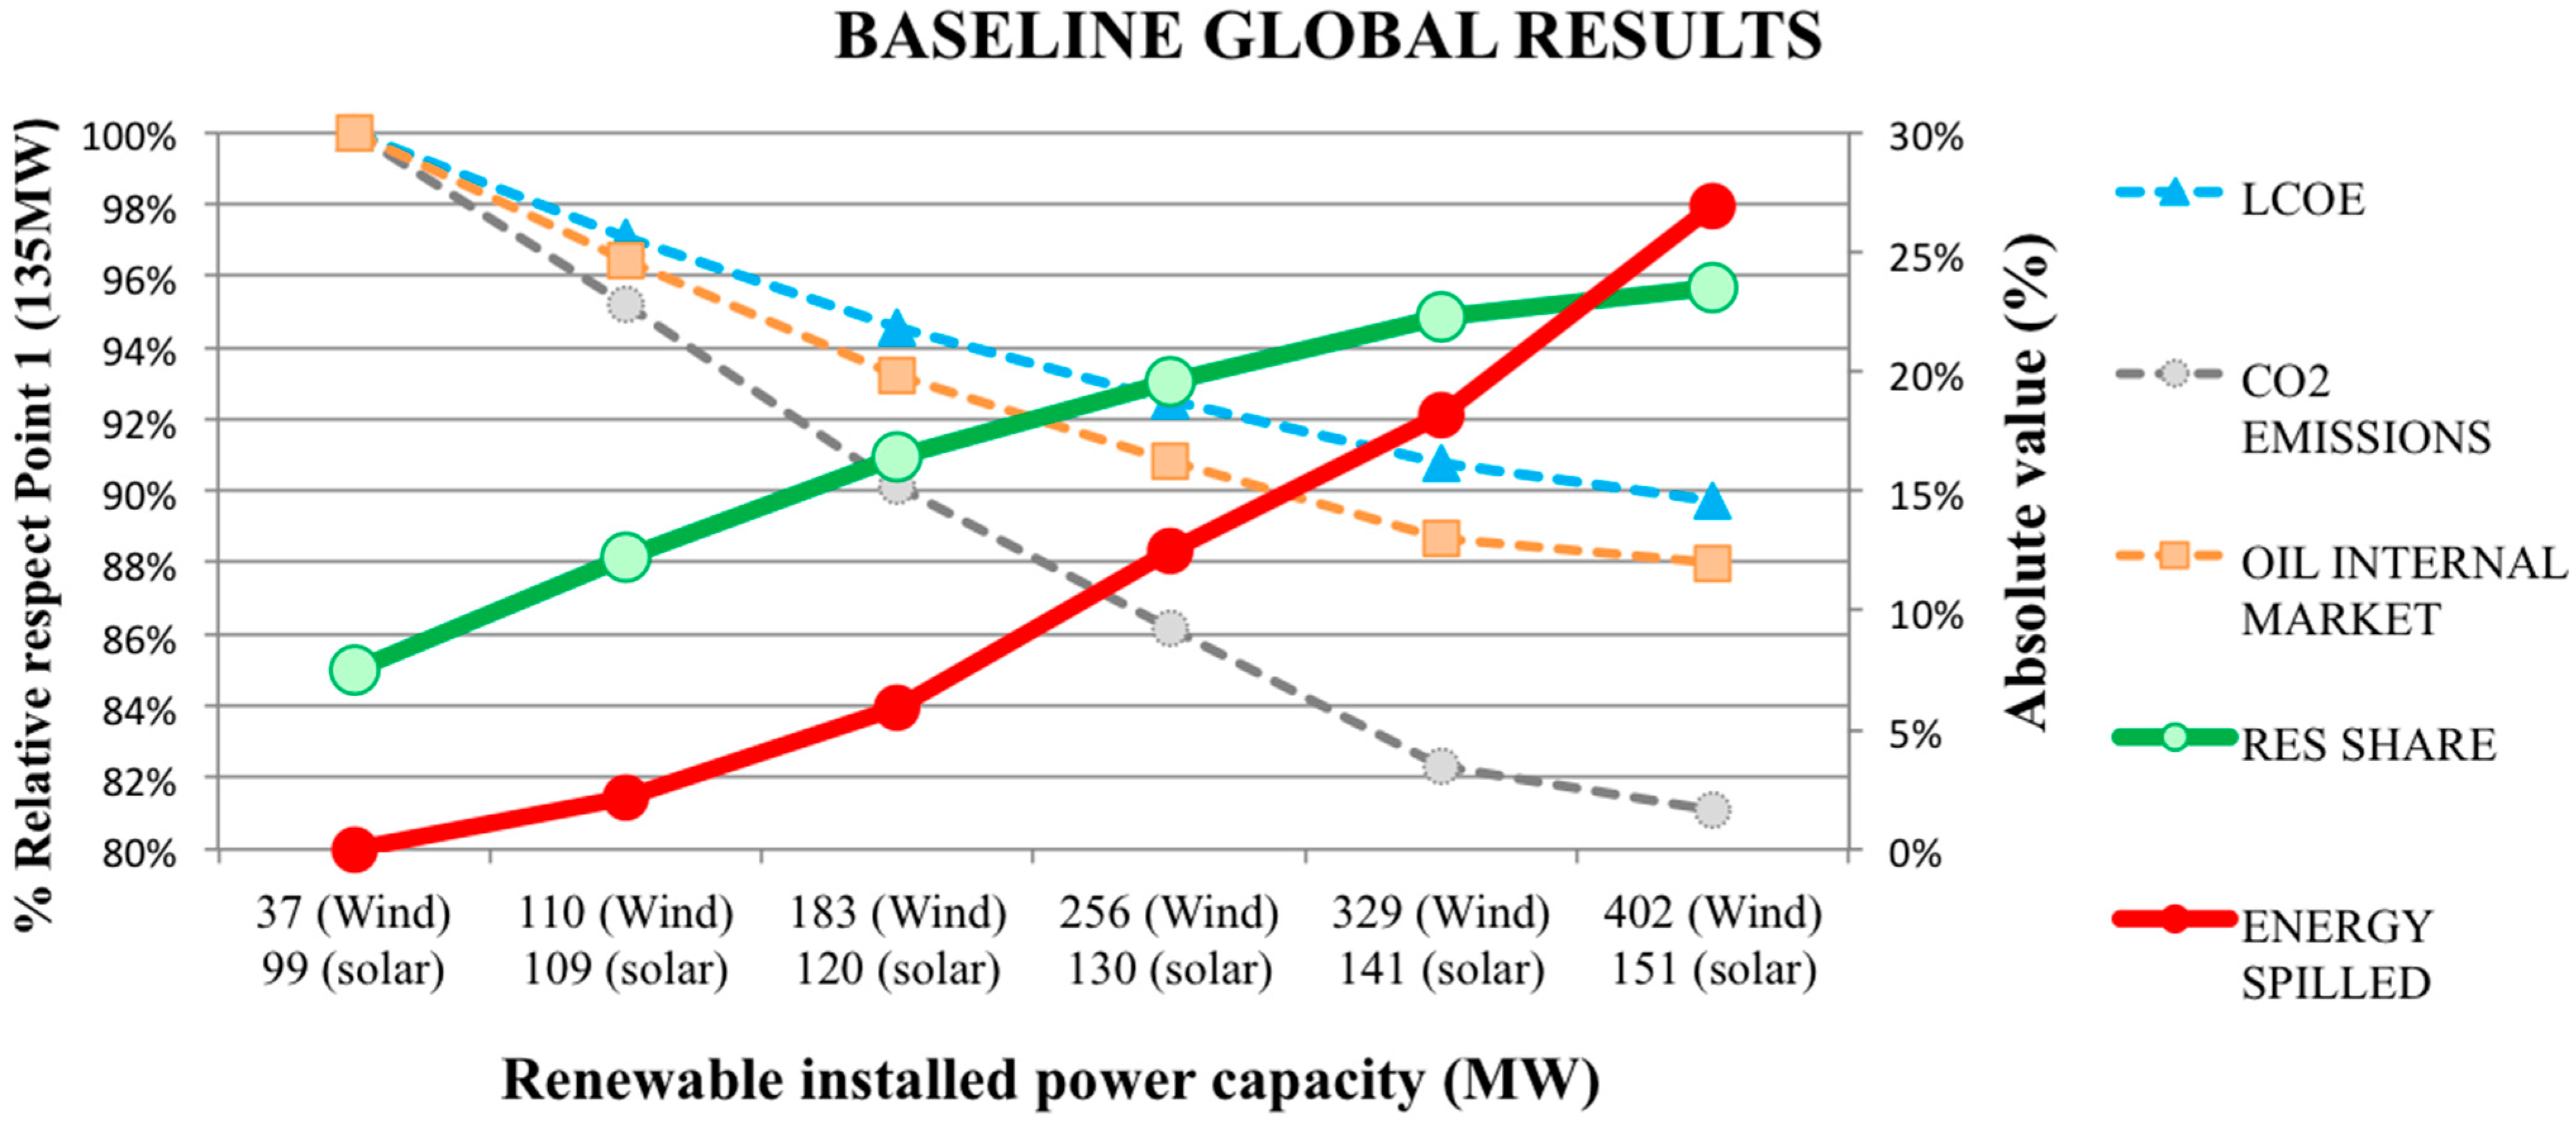
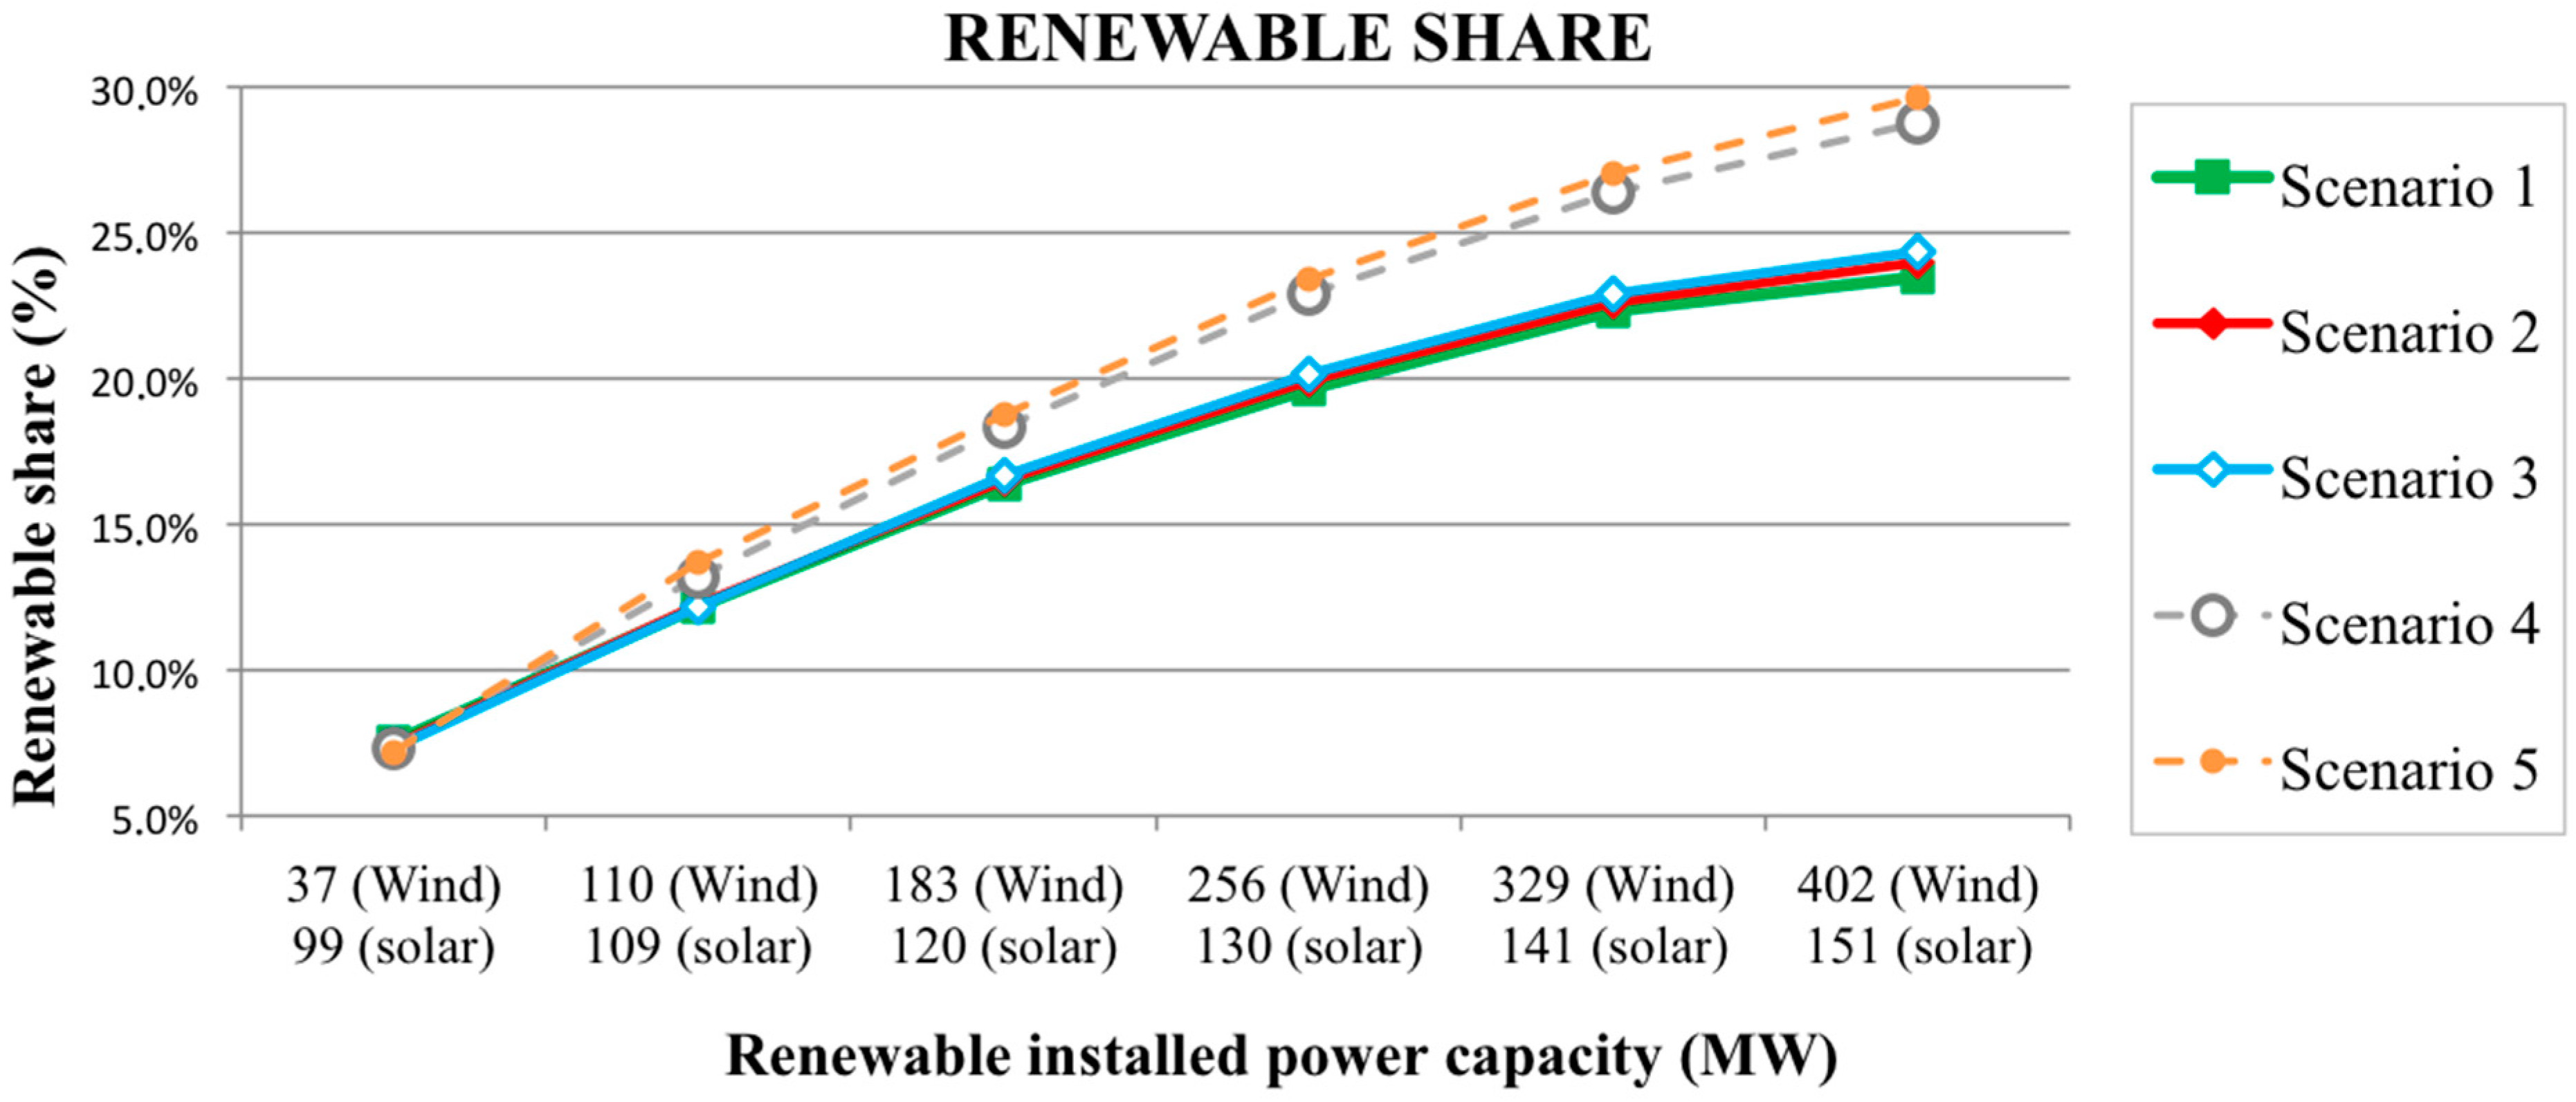
4.1. An Increase of Renewables Installed Capacity on Tenerife

Figure 5 summarizes the main results of the first simulation exercise. It shows the effects on the result variables of the model for different levels of RES installed capacity. The curve representing the RES share shows the total value in the percentage reached by this variable. The same applies to energy spilled, which represents the percentage of renewables loss in relation to the whole resource. However, for the rest of the variables, the percentage reached is represented on the starting point of the base scenario (100%).
The first remarkable fact is the close relationship between the renewable installed capacity, the percentage of renewable energy produced and renewable energy spilled in relation to the total. In the first case, it is shown that as the installed capacity increases, the percentage of renewable energy in the mix rises, but at a decreasing rate, so it shows a concave relationship. However, the increase of the renewable energy losses in relation to the total results in an increasing rate, so the curve is convex. This is due to the starting balance conditions in which the electric system is not able to absorb all of the renewable energy produced. Therefore, the more renewable capacity is installed, the larger the loss level becomes.
Figure 5. Baseline global results. (a) Renewable share; (b) cost; (c) emissions; (d) energy spilled; and (e) oil internal market.
Sustainability 07 15152 g005
This technical relationship between installed capacity and the penetration of renewables also explains the shape (decreasing and concave) of the other three curves. As more renewable capacity is introduced, carbon emissions, electric generating cost and fuel consumption decrease, but each time at a lower rate. This is because of the direct relationship between a larger amount of renewable energy and the lower use of fossil energies. As discussed in Section 3, the cost of renewable energy is lower than the cost of fossil energies on the Canary Islands with the current conventional generation technologies employed as detailed in Table 1 [13,14,15]. For greater detail of the costs, Appendix 1 shows all of the variables involved in calculating the levelized cost of energy.
In short, our model simulation allows us to compare energy and emissions outcomes under the renewable installed capacity of Tenerife at the beginning of 2013 (37 MW of wind and 99 MW of photovoltaic) with outcomes generated under the renewable installed capacity targeted by the PECAN (402 MW of wind power and 151 MW of photovoltaic). To focus on the role of renewable energies and make these two scenarios comparable, we use in both cases the same installed capacity for conventional technologies, the same demand of electricity and equal weather conditions, taking 2013 as our reference year. Electric vehicles are still not considered under these two scenarios. According to our simulation results, installing the capacity of renewables proposed by the PECAN would allow one to achieve almost 23.5% of renewables in electricity generation, to reduce around 10.3% the cost of generation, as well as the consumption of fuel to generate electricity, to reduce carbon emissions up to 18.9%; however, that supposes a waste of energy (coming from renewable sources) of almost 27%. As we will see next, scenarios including EVs will reduce the energy spilled by a significant amount.

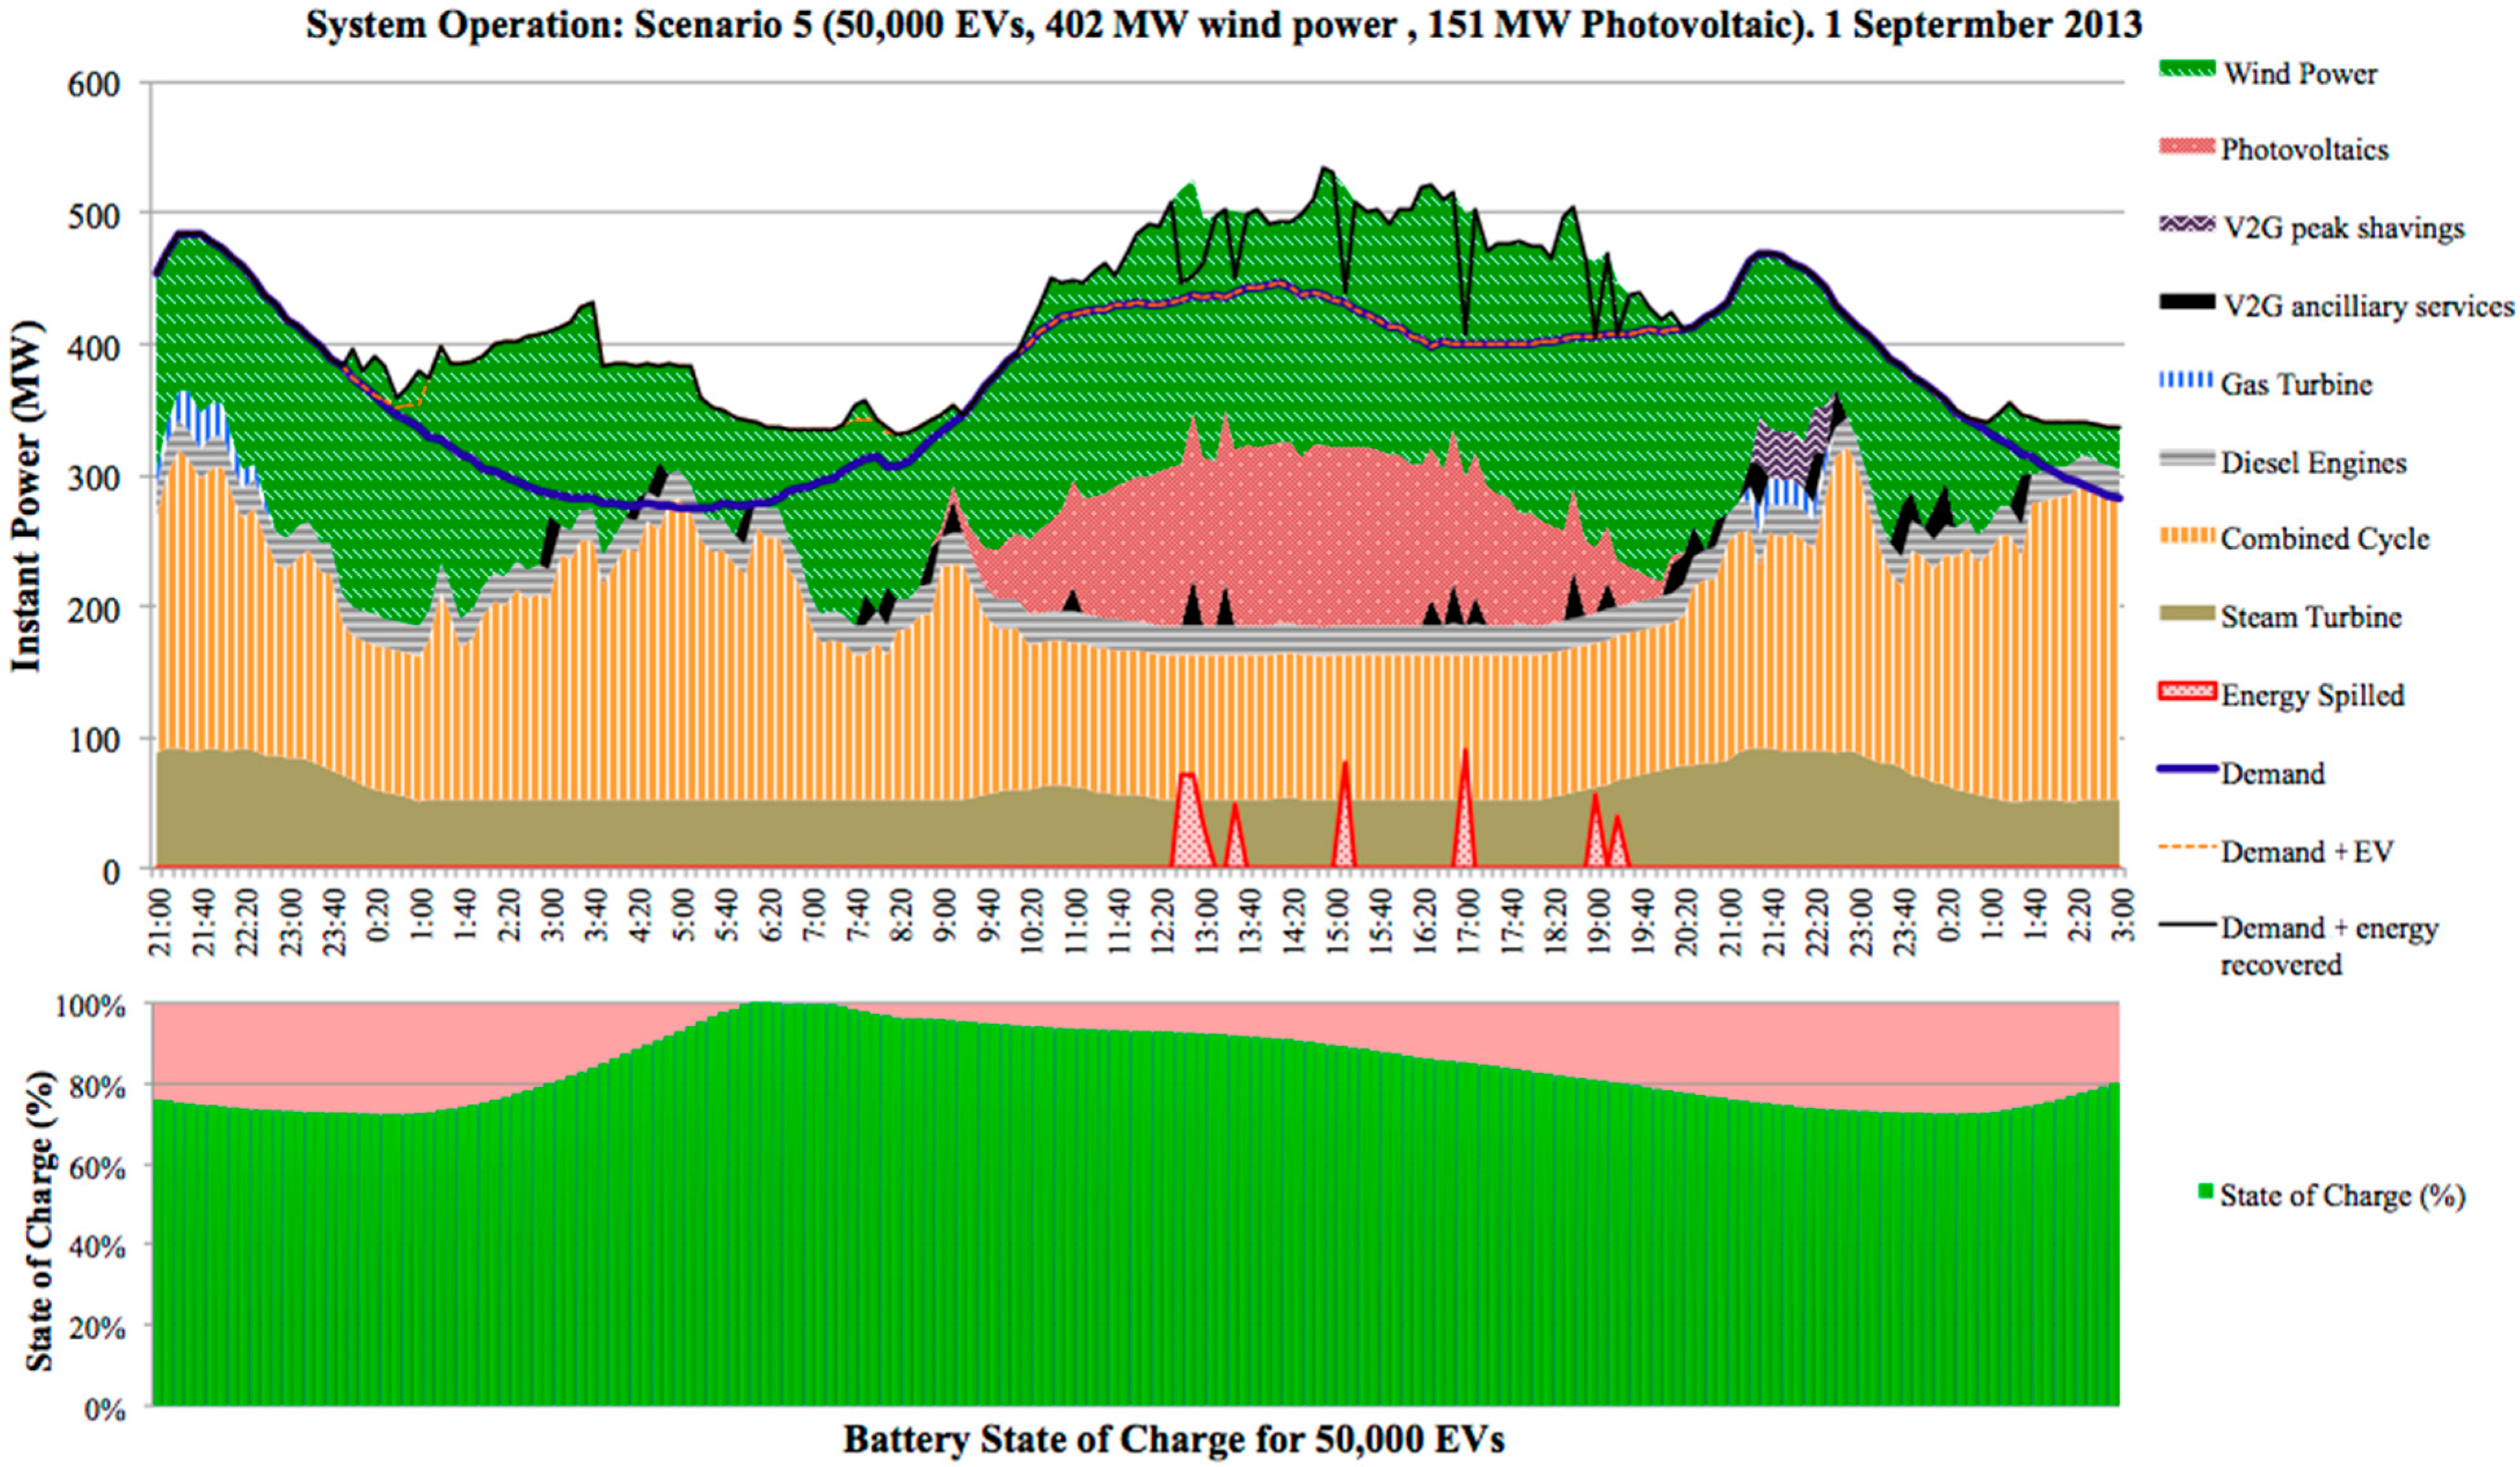
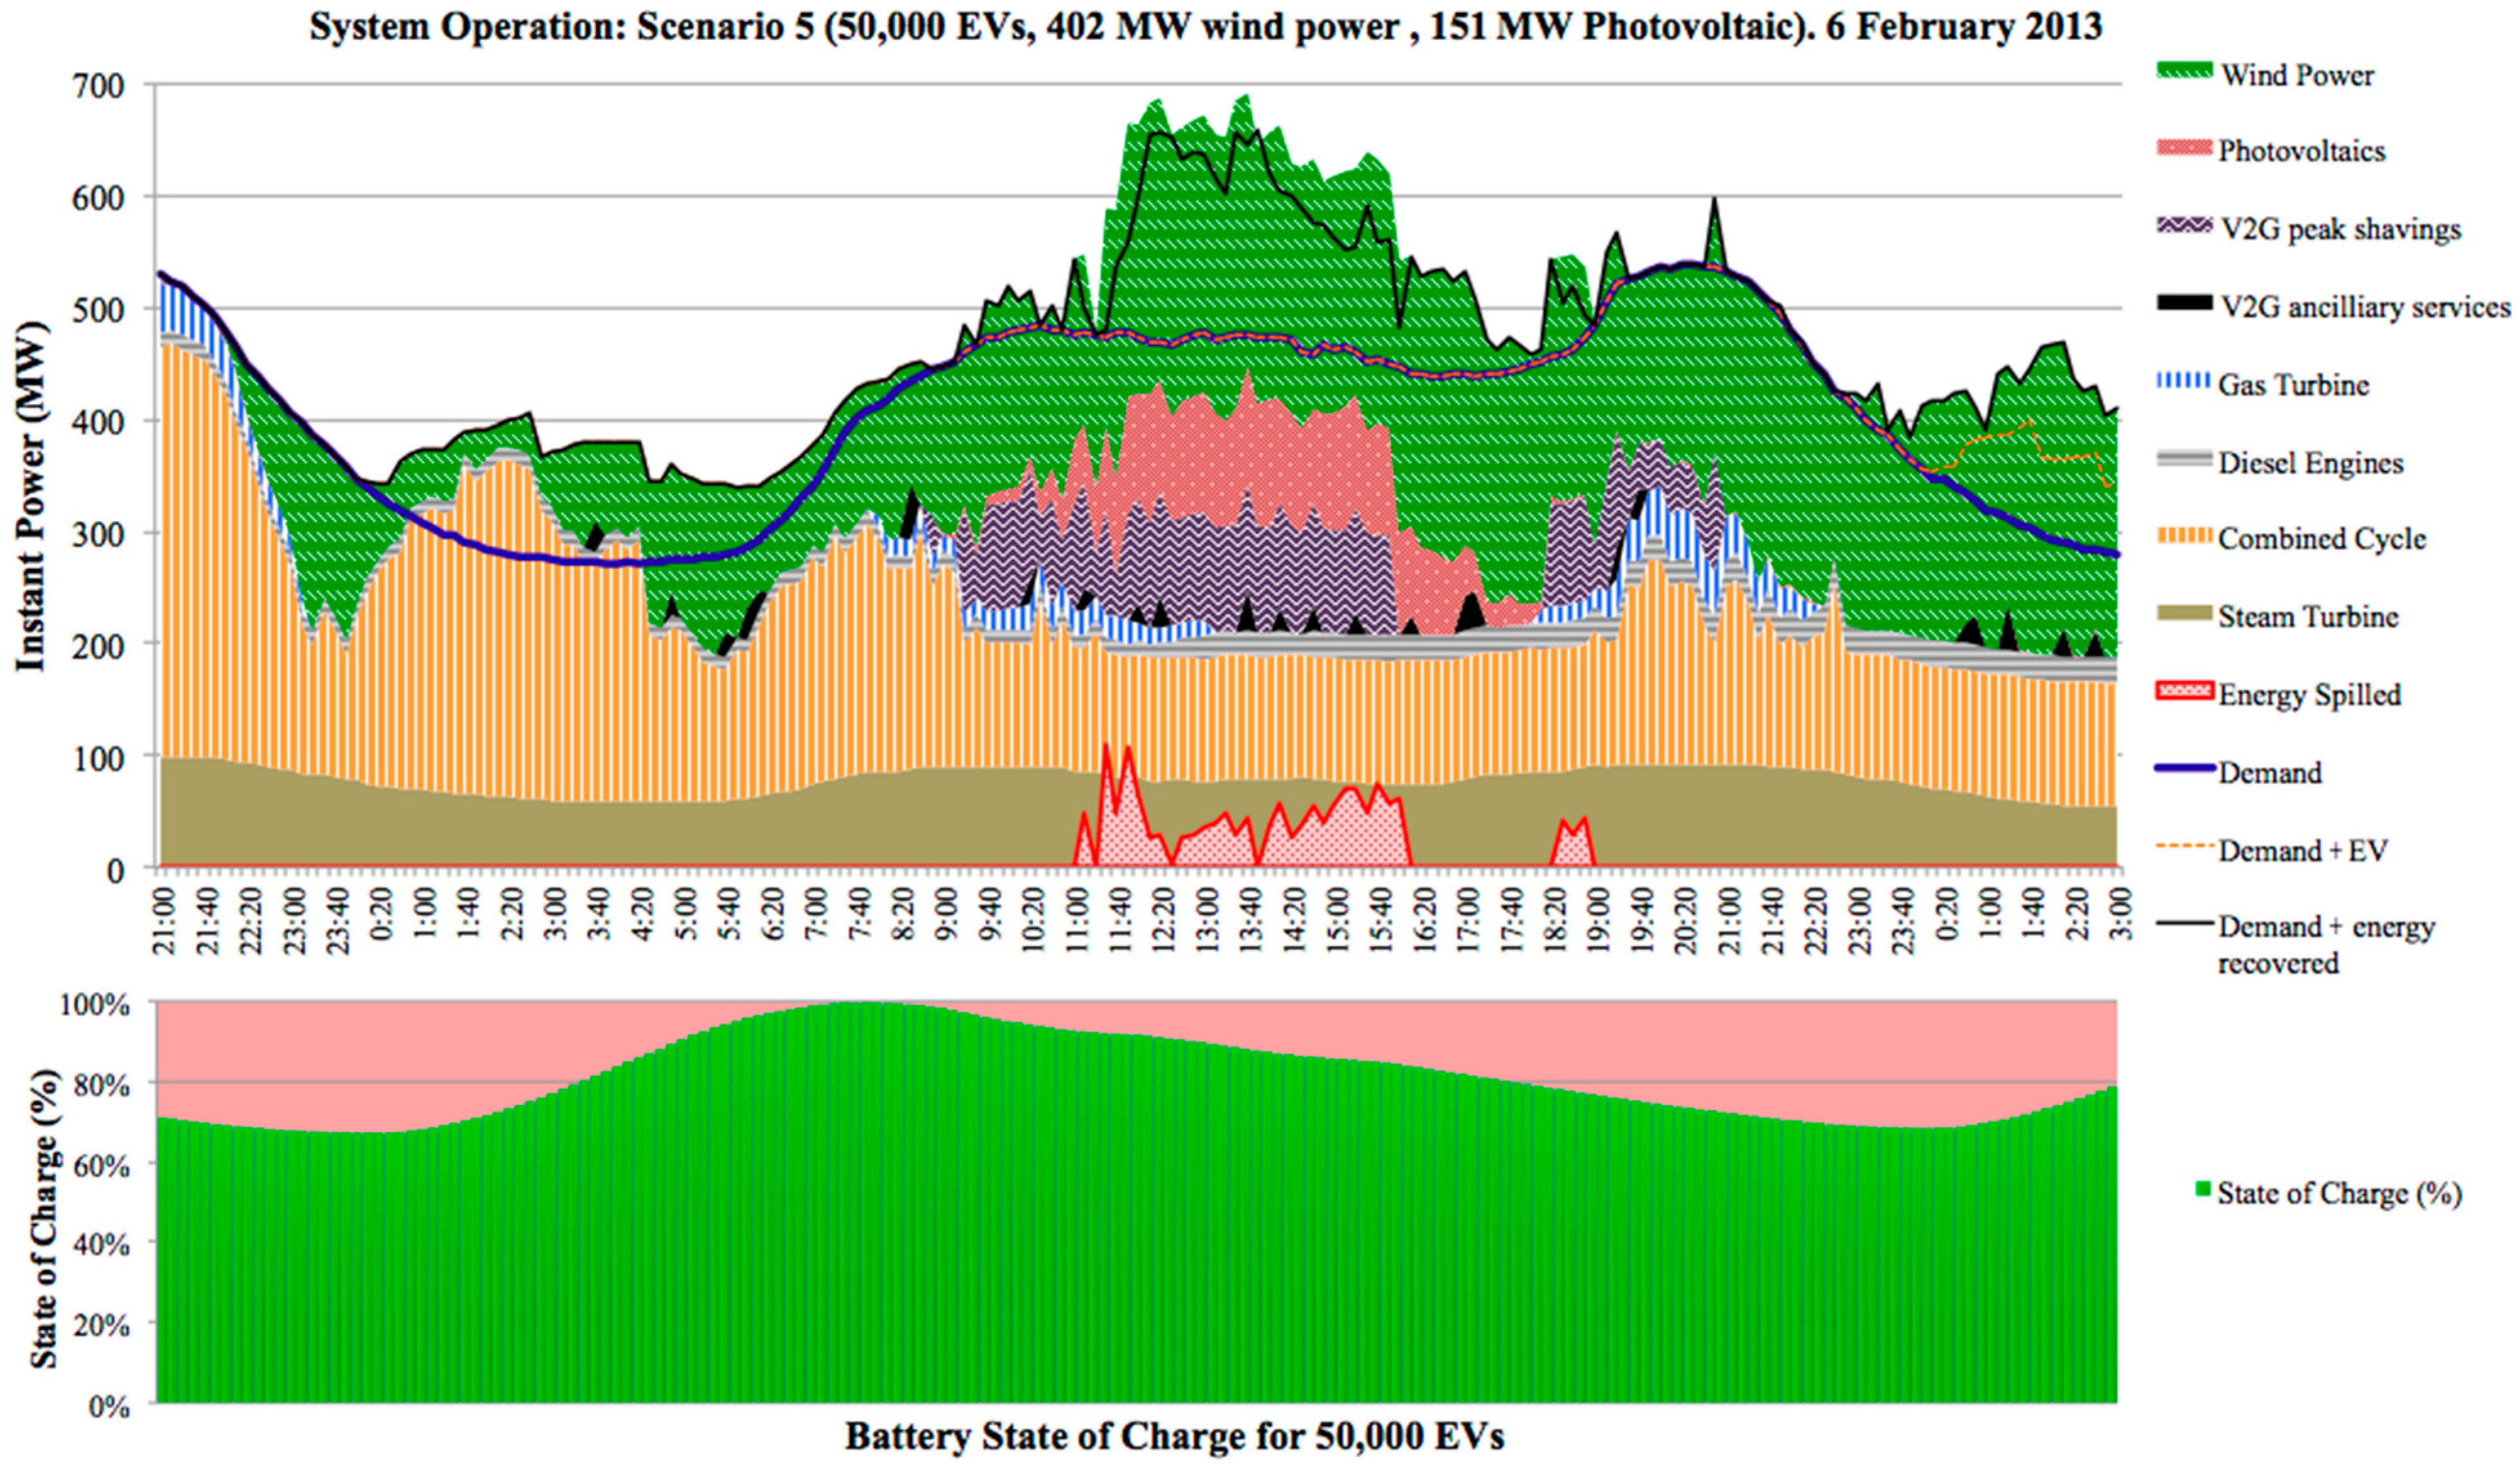
4.2. Scenarios Using an EV Fleet
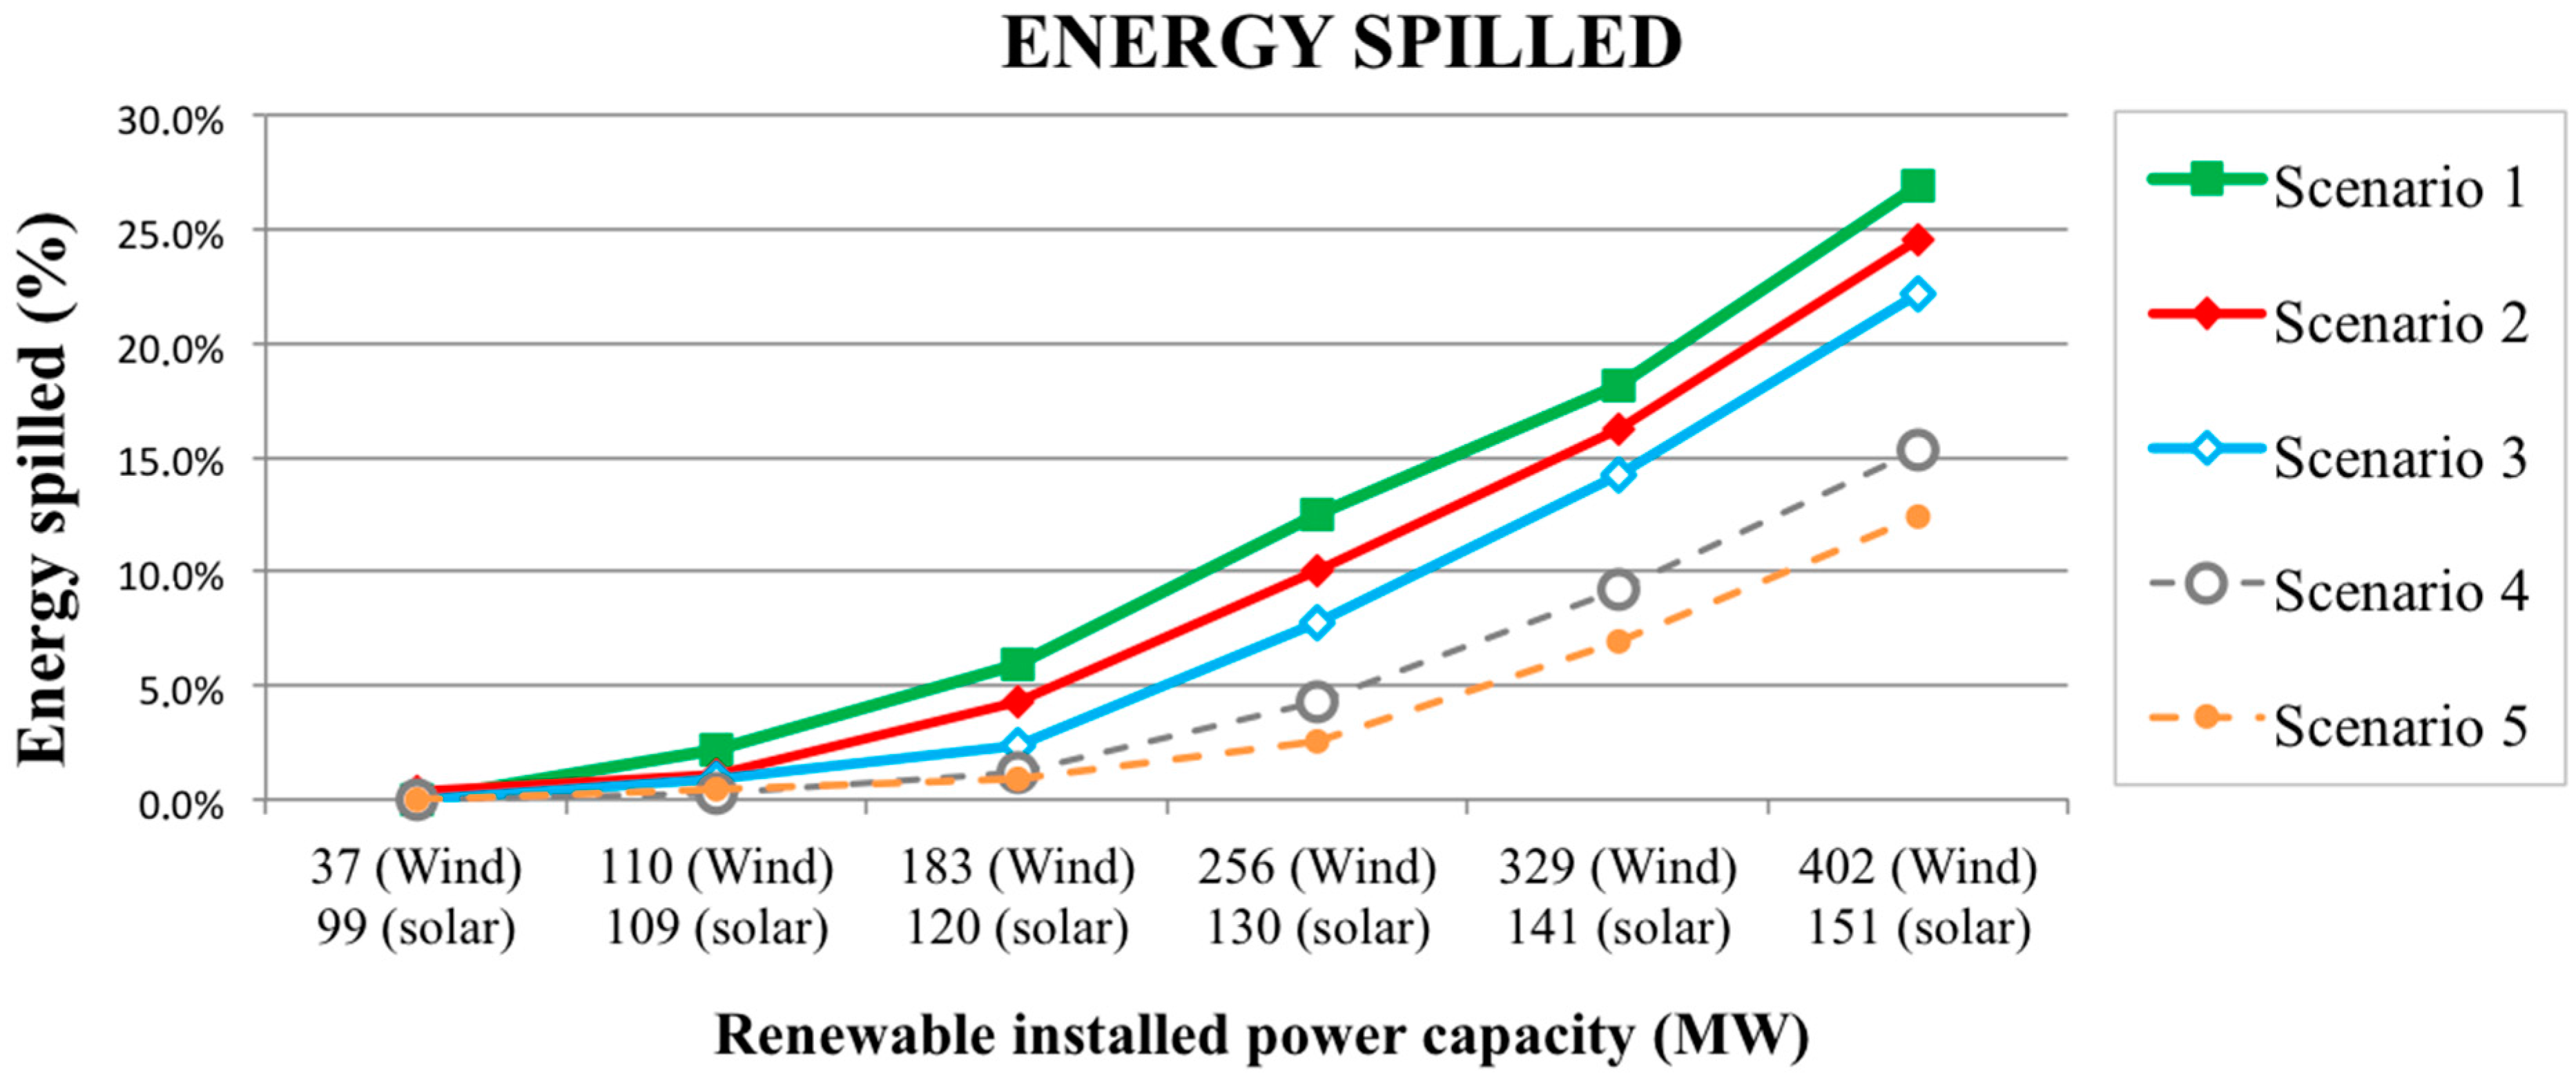
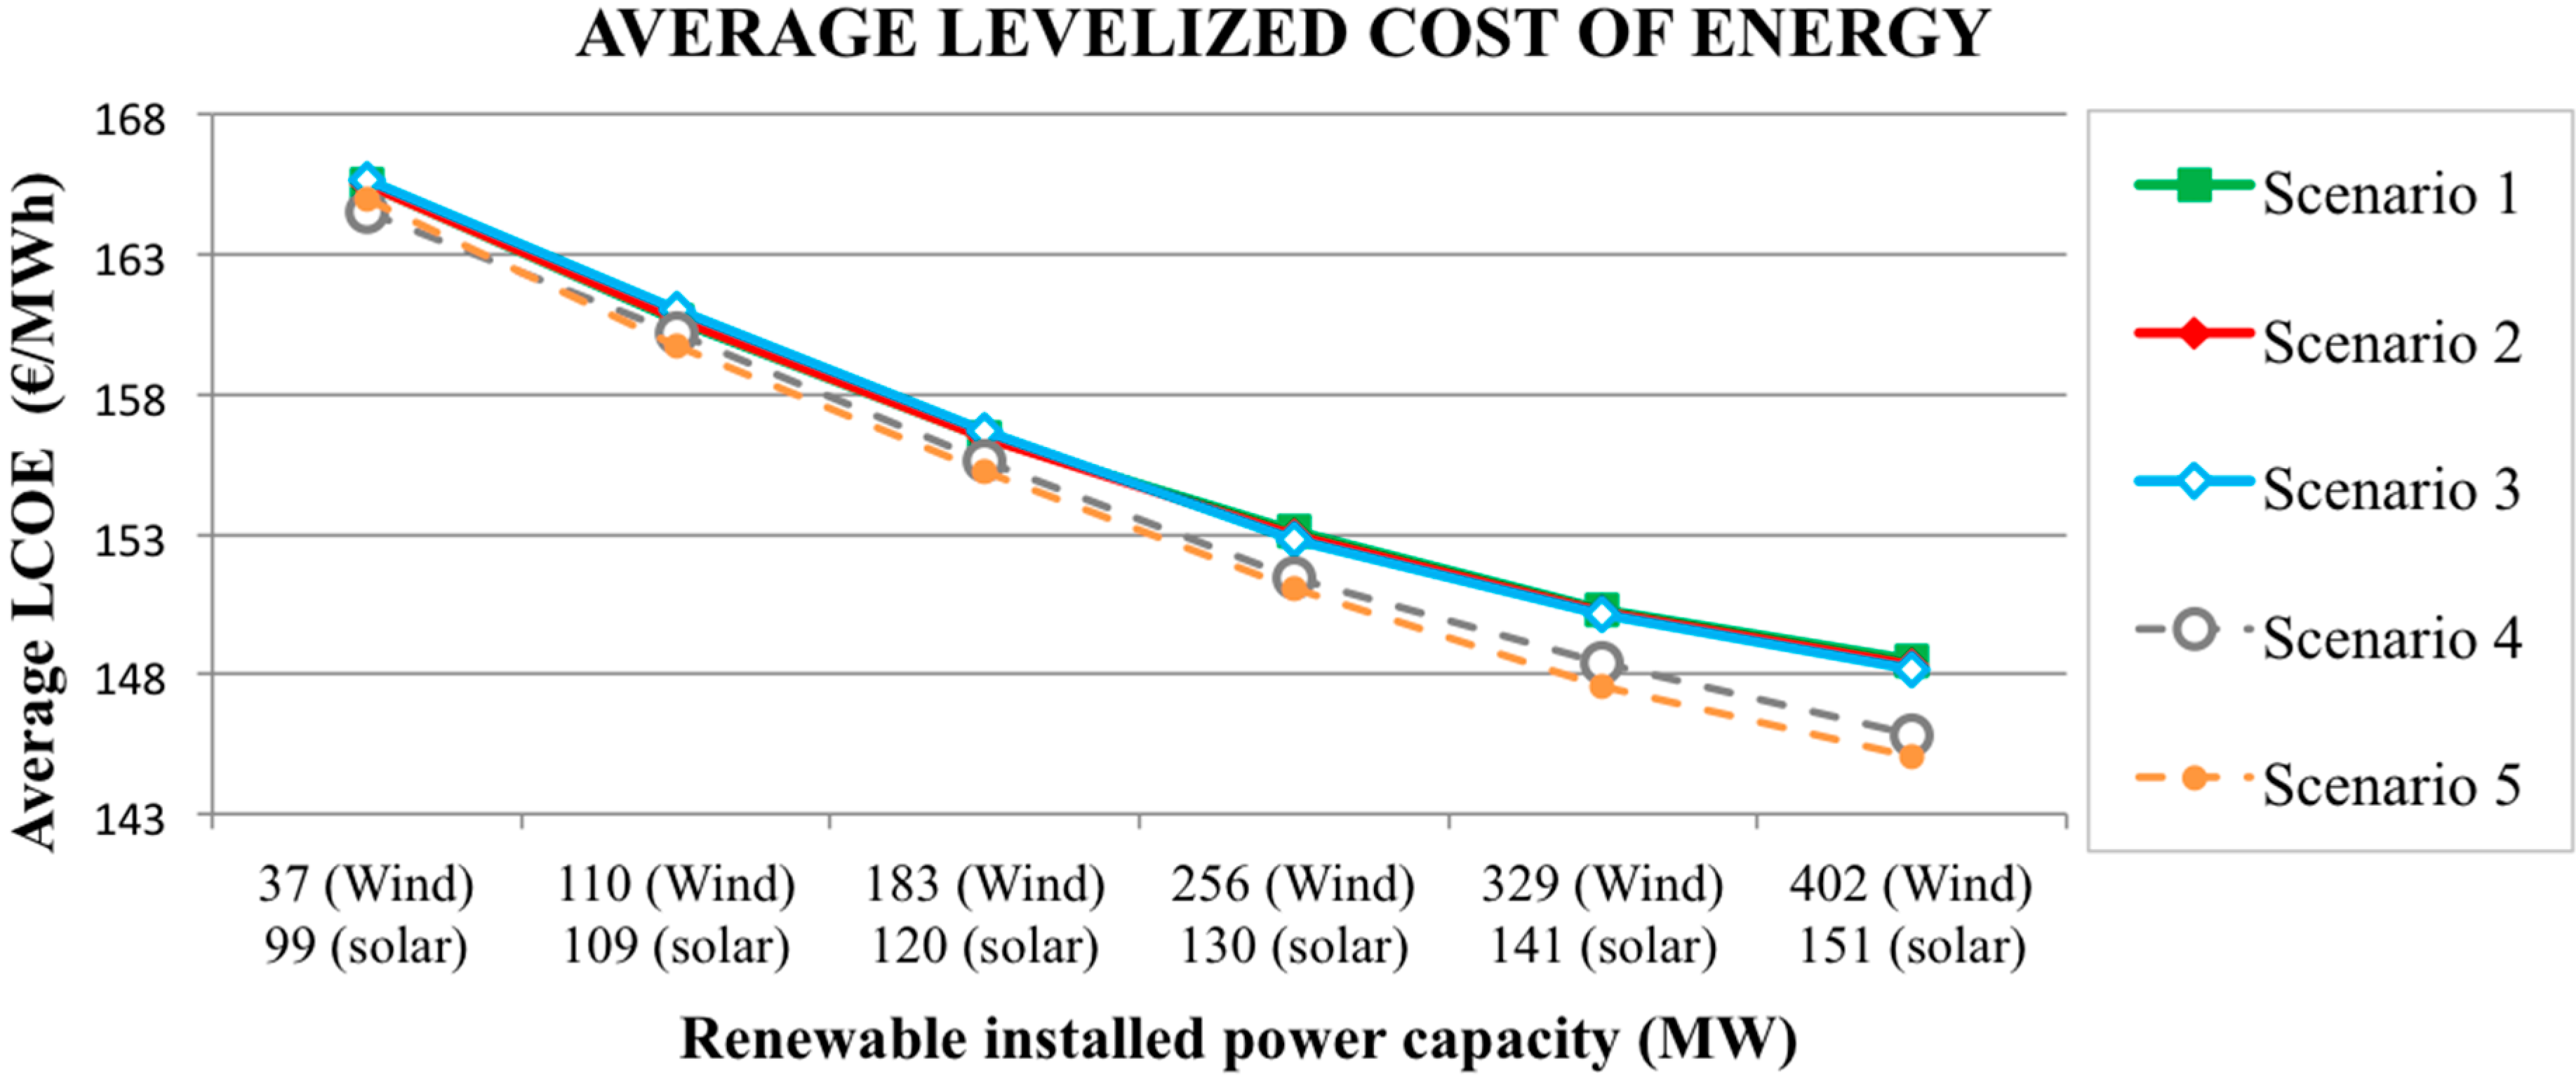
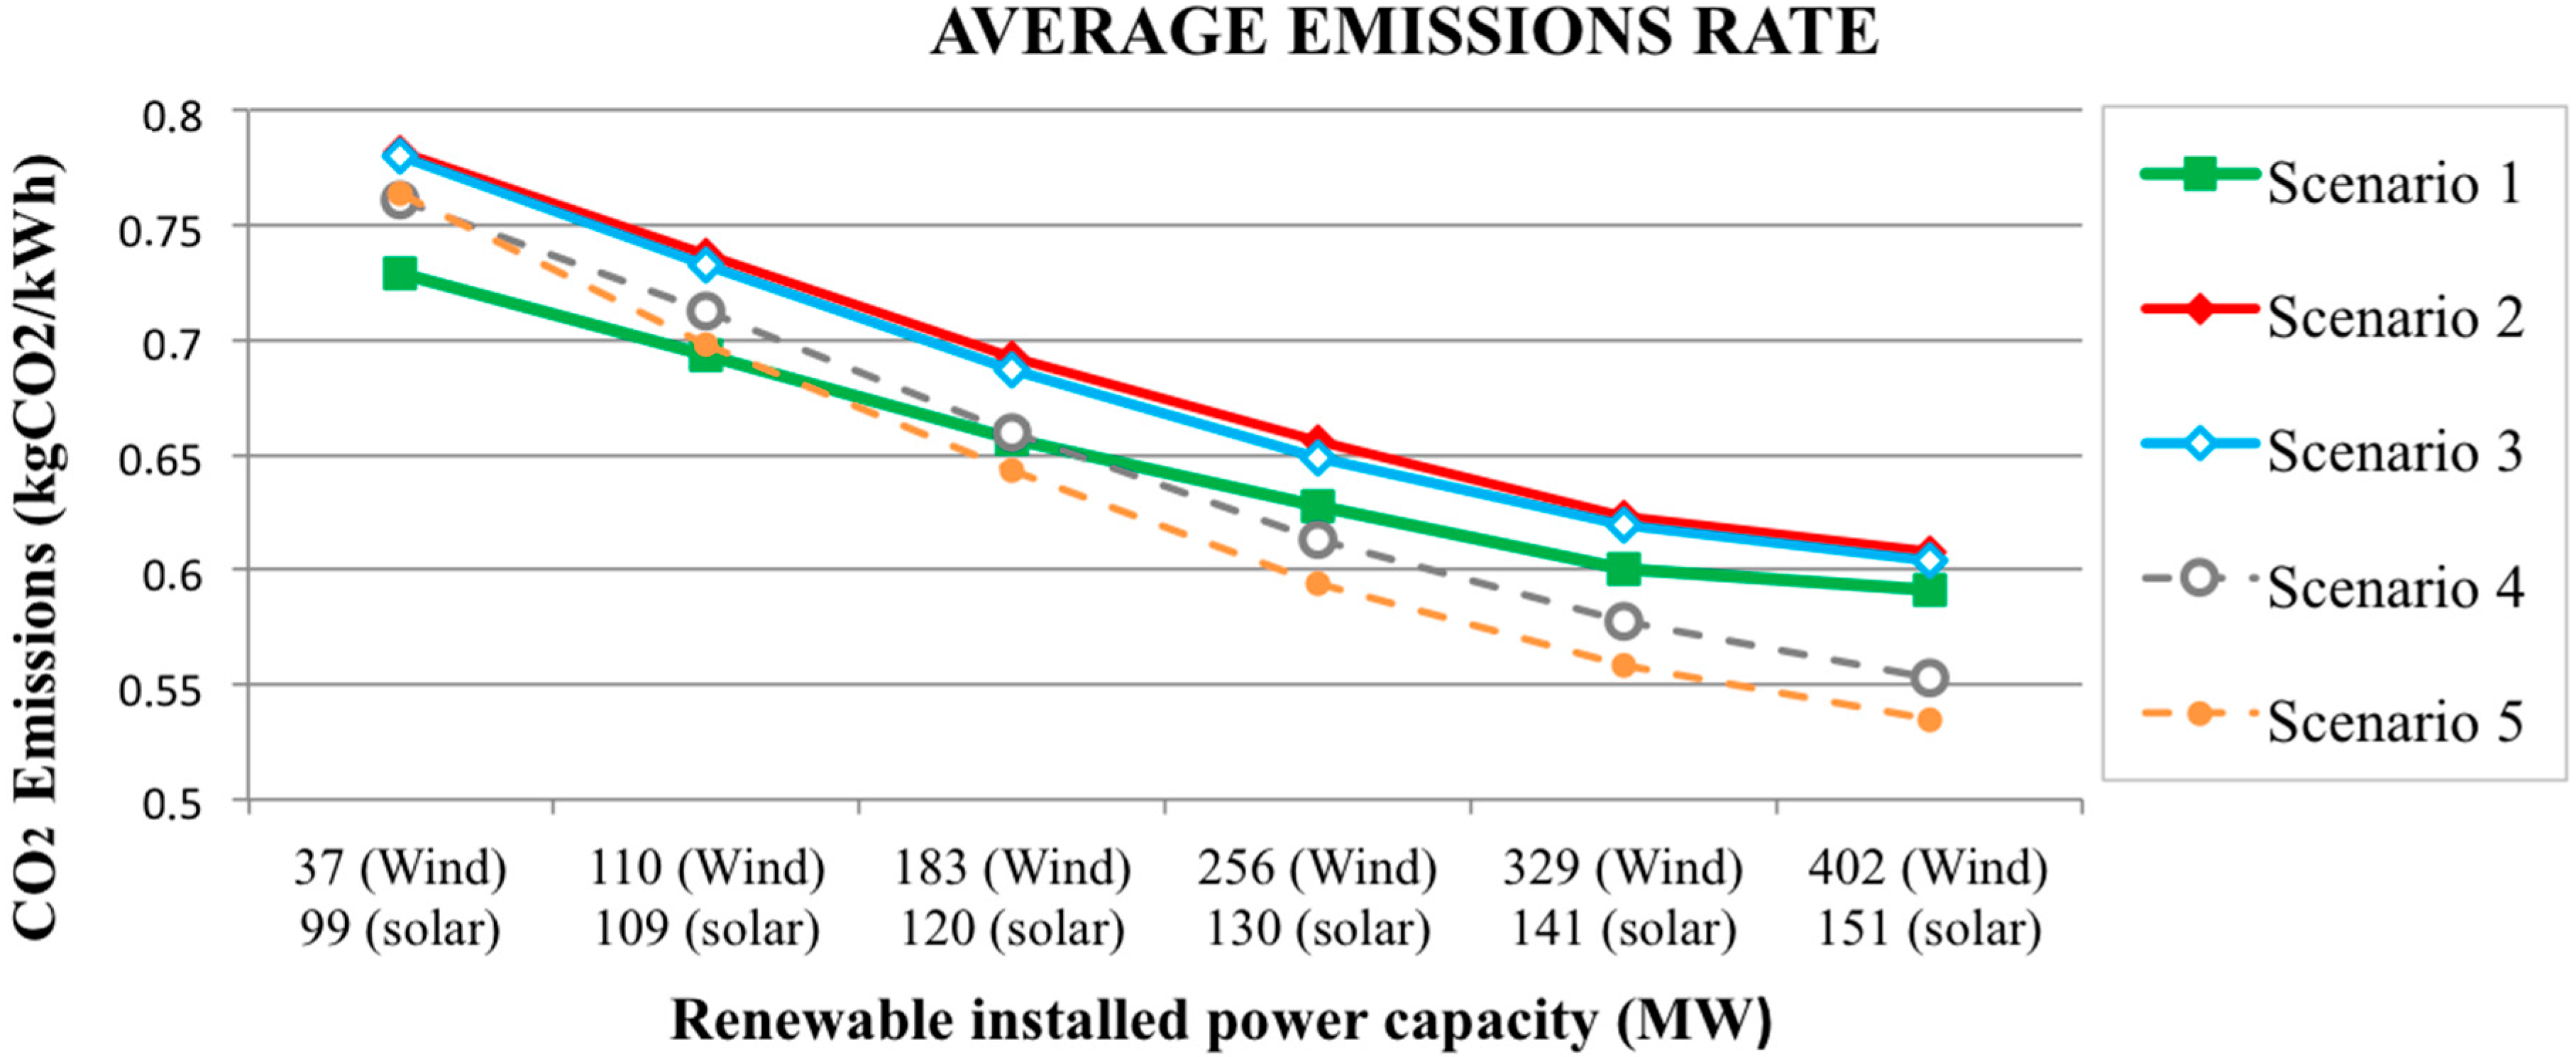
This section shows the results obtained from the simulation of the electrical system on Tenerife under the four EV alternative scenarios described in Section 3. To analyze the effect of the progressive introduction of EVs and for illustrative purposes, we will analyze the results focusing on each outcome considered individually. Thus, Figure 6 compares the results of the renewable share; Figure 7 compares those of energy spilled; Figure 8 those of electric generating cost; Figure 9 those of carbon emission; and lastly, Figure 10 shows the results of the fuel consumed considering the use for electricity generation and road transport.
Figure 6. Renewable share. (a) Scenario 1 (baseline); (b) Scenario 2 (10,000 EVs); (c) Scenario 3 (25,000 EVs); (d) Scenario 4 (25,000 EVs using V2G); and (e) Scenario 5 (50,000 EVs using V2G).
Sustainability 07 15152 g006
Figure 7. Energy spilled. (a) Scenario 1 (baseline); (b) Scenario 2 (10,000 EVs); (c) Scenario 3 (25,000 EVs); (d) Scenario 4 (25,000 EVs using V2G); and (e) Scenario 5 (50,000 EVs using V2G).
Sustainability 07 15152 g007
Figure 8. Levelized cost of energy. (a) Scenario 1 (baseline); (b) Scenario 2 (10,000 EVs); (c) Scenario 3 (25,000 EVs); (d) Scenario 4 (25,000 EVs using V2G); and (e) Scenario 5 (50,000 EVs using V2G).
Sustainability 07 15152 g008
Figure 9. CO2 emissions. (a) Scenario 1 (baseline); (b) Scenario 2 (10,000 EVs); (c) Scenario 3 (25,000 EVs); (d) Scenario 4 (25,000 EVs using V2G); and (e) Scenario 5 (50,000 EVs using V2G).
Sustainability 07 15152 g009
In general, we can highlight two important facts. First, it is observed that the introduction of the EV as a storage system allows for an improvement in all dimensions and in absolute terms. The greatest benefits are noticed especially in Scenarios 4 and 5 in which V2G technology is used. Once we are in a V2G system, doubling the fleet (from 25 thousand in Scenario 4 to 50 thousand in Scenario 5) offers benefits in all dimensions, but they are lower than those observed when moving from EV to the V2G technology. Secondly, the degree of concavity and convexity of the curves is also reduced in general terms. This means that the introduction of the EV attenuates the decreasing rate of marginal improvements as a larger renewable capacity is installed in terms of the different variables considered. In short, the process by which improvements are increasingly less important is delayed. Table 3 summarizes the percentages of improvement as renewable capacity increases by comparing Scenarios 1 (S1) and Scenario 5 (S5).
Figure 10. Oil internal market. (a) Scenario 1 (baseline); (b) Scenario 2 (10,000 EVs); (c) Scenario 3 (25,000 EVs); (d) Scenario 4 (25,000 EVs using V2G) and (e) Scenario 5 (50,000 EVs using V2G).
Sustainability 07 15152 g010
Table 3. Rate of change of the variables in Scenarios 1 and 5. RES, renewable energy source.
RESRenewable ShareLCOECO2 EmissionsEnergy SpilledOil Internal Market
MWS1S5S1S5S1S5S1S5S1S5
11350.0%0.0%0.0%0.0%0.0%0.0%0.0%0.0%0.0%0.0%
22194.7%6.5%−2.9%−3.2%−4.8%−9.1%2.2%0.5%−3.6%−4.3%
33034.2%5.1%−2.5%−2.7%−5.1%−7.5%3.7%0.4%−3.2%−3.8%
43863.2%4.6%−2.0%−2.5%−4.0%−6.7%6.6%1.6%−2.4%−3.1%
54702.7%3.6%−1.7%−2.1%−3.8%−4.9%5.6%4.4%−2.2%−1.9%
65531.2%2.6%−1.1%−1.5%−1.2%−3.2%8.8%5.5%−0.7%−1.2%
Regarding the renewable share achieved, it can be seen that the use of EVs as a storage system allows larger shares for the same renewable installed power than Scenario 1. As discussed in the above paragraph, the greatest difference can be seen when using the V2G systems (Scenarios 4 and 5). For Level 6 of renewable power (553 MW), we would move from 23.5% in Scenario 1 to almost 28.7% and 29.6% in Scenarios 4 and 5; whereas in Scenarios 2 and 3 without the V2G charging technology, the increase is very small (24.2%). Then, it is mainly the V2G charging technology what allows the introduction of the electric car to increase the share of renewable energy in the generation mix. This can be confirmed by the fact that in Scenario 5, the goal of 25% of renewables could be achieved with an installed power of about 420 MW (285 MW of wind power and 135 MW of photovoltaic), which represents approximately 24% below the 553 MW suggested by the PECAN.
This greater penetration of renewables due to the introduction of EVs as a storage system is closely related to a lower renewable energy losses. Thus, for the two scenarios using the V2G system, the energy losses with 553 MW of installed renewable energy is 15.3% in Scenario 4 and 12.4% in Scenario 5; whereas it is above 25% in the baseline scenario. The difference between the baseline scenario and Scenarios 2 and 3 with the introduction of EV is very small, being 0.5% and 1% higher in renewable energy injected into the system, respectively.
Once again, it is made clear that, given a certain size of EV fleet (for example 25 thousand) and the characteristics and size of Tenerife, the charging system (V2G) is more important than increasing the fleet.
With regard to the costs of electricity generation, the average difference between Scenarios 1 and 5 is about 7%, and it increases as more renewable capacity is installed (see Appendix 1 for more cost details). The difference between these two scenarios in the last level of renewable capacity is 12.4%, representing 20.5 Euros/MWh and 26.4 million for the generation system of the island. The same as in the case of the renewable share and energy losses, Scenarios 4 and 5 are clearly different from the other three in the cost of generation. The reason is that a greater use of renewable capacity allows for a lower average cost, because a larger amount of fossil energy, which is more expensive, is being replaced. Regarding these costs, only the electricity generation is being considered. However, there are other important costs derived from the fuel import savings on the part of the vehicle fleet that is powered from the grid. The costs for automotive gasoline imports is 0.45 €/L [37]. Furthermore, we consider average fuel consumption (gasoline) of 8.5L/100 km for pre-2002 vehicles. This reduction is equivalent to 5.4 M€ for 10,000 EVs, 13.3 M€ for 25,000 EVs and 26.5 M€ for 50,000 EVs. Therefore, for Scenario 5, the total savings for the island would reach 52.9 M€ per year comparing to the current scenario (135 MW of renewables). If we compare to the scenario without EVs, the total cost reduction in fossil fuel imports is around 23.72M€.
In the case of emissions, we highlight that, when there is little renewable capacity, scenarios with the introduction of EV produce a higher level of emissions per kWh generated. This is because vehicles generate a greater demand for electricity that cannot be covered by renewables. This is corrected as more renewable capacity is installed. In fact, for 553 MW, Scenarios 4 and 5 reduce emissions per kWh significantly (26.6% between 5 and 1). This savings is only considering the electrical system. However, a very important reduction of emissions occurs on roads. This reduction is equivalent to 24,960 (Million Tonnes of CO2) MtCO2 for 10,000 EVs, 62,410 MtCO2 for 25,000 EVs and 124,830 MtCO2 for 50,000 EVs.
Regarding total fuel consumption, the most remarkable fact is that the introduction of EV produces greater savings due to the combined effect of a lower consumption in power generation and transportation. When comparing Scenarios 1 and 5, the difference for the higher level of capacity is 4% (the difference between 12% and 16%).
To end this section of results, and in order to better understand the role of EVs as an energy storage system, we replicate Figure 3 and Figure 4 shown in Subsection 3.1 but, in this case, we consider the introduction of a fleet of 50,000 EVs (V2G) for the same dates.
Thus, Figure 11 represents 6 February, in which it can be seen how the EVs support covering the required energy at peaks (filler waves, purple) maintaining conventional technologies at the minimum. In addition, despite the amount of spare renewables (energy above the dashed line, orange), the EV is able to capture much of that energy and incorporate it into the batteries (narrow curve, black). The effect on the batteries is observed in the second graphic, where the SOC of vehicles connected to the grid is represented.
In Figure 12, representing 1 September 2013, the SOC of batteries is very low during night peak hours. This is due to the fact that, in these hours, users come to their homes with a flat battery. In addition, possible injections to the system as a backup for conventional energy (dashed line, orange) have reduced its capacity. To conclude, if we compare both curves with respect to the previous case, we can see that the energy spilled has been significantly reduced, also adding extra renewable energy to the system. However, it can be seen how energy demand rises mainly in the off-peak hours.
Figure 11. Winter operation of the system (Scenario 5, 402 MW wind power, 151 MW photovoltaic and 50,000 EVs using V2G). 6 February 2013.
Sustainability 07 15152 g011
Figure 12. Summer operation of the system (Scenario 5, 402 MW wind power, 151 MW photovoltaic and 50,000 EVs using V2G). 1 September 2013.
Sustainability 07 15152 g012

5. Conclusions

In this paper, we have used a model simulator to evaluate the introduction of renewable energy and an energy storage system based on EVs, both unidirectional (grid for vehicle) and bidirectional (vehicle to grid), in the Tenerife electric power system. The installation of renewables reduces the cost, the carbon emissions and the fossil fuel importations on Tenerife. However, when a massive amount of renewables is introduced, the reduction rate decreases, and more importantly, exponential increases of energy spilled are observed. These problems are significantly reduced when a fleet of EVs is introduced into the system.
Summing up, the introduction of an EV fleet shows two main benefits: (i) in the electrical system; (ii) in road transport. First, the EVs increase the limit of the penetration of renewables in the electric power system. Because of that, using the same capacity installed, the share of renewables can increase, and the amount of energy spilled is reduced. This impact is more important when a V2G strategy (bidirectional) is used. The second set of benefits refers to the impact on road transport, such as the reduction of noise, fuel consumption and emissions in road transport. With respect to the baseline scenario (no EVs), the cost reduction in fossil fuel imports when introducing 50,000 EVs is around 23.72 M€. Additionally, the reduction of carbon emissions in urban areas could be around 124,830 MtCO2.
From the point of view of the energy policy, the PECAN objectives are very ambitious. Since the PECAN was approved in 2006, no new wind turbines have been installed on Tenerife. Thus, to meet the target in PECAN, the island needs the current 37 MW to be refurbished and an additional 365 MW installed. According to our results, the EV fleet with the V2G system could help to fulfill the 25% of renewables share with less installed capacity of renewables (about 133 MW lower).
An alternative energy storage system proposed on Tenerife (and not analyzed in this paper) is the pumping hydro station. This technology is much more mature than the V2G system. Furthermore, this technology has been tested on the island of El Hierro with great success by achieving an 80% of renewables share for some periods of time. However, a big amount of fuel is still consumed on El Hierro (28% of total energy) in road transport. Thus, the solution to reduce this share is the introduction of plug-in electric vehicles.
The introduction of EVs as energy storage could provide some additional advantages with respect to the pumping hydro stations. First, the EVs reduce the environmental impact caused by these huge power plants, which is an important issue, because 50% of the total surface of the Canary Islands is protected. In addition, the storage system through EV charging reduces problems by reducing the requirements of the nodes and the burden-sharing network. However, the most important feature is that the EVs reduce noise and carbon emissions in urban areas and replace conventional vehicles, which consume fossil fuels in transportation.
A promising extension of this paper would be to enter into detail the operation of the system and its security requirements using a unit commitment model. Indeed, it is important to study in detail the uncontrolled charge in comparison with other charging strategies. Additionally, it would be interesting to evaluate the complementarity between the V2G technology and pumping hydro stations.

Acknowledgments

The authors gratefully acknowledge the valuable comments of four anonymous referees and the Chaire Armand Peugeot for its financial and logistic support to conduct this research. They also thank the comments from members of the Energy Department of Centrale-Supélec (Paris, France). Marrero and Ramos-Real also thanks the financial support of the Ministerio de Economía y Competitividad of Spain through Project ECO2013-48884-C3-3-P. Ramirez acknowledges the University of La Laguna for its financial support through its young research support program.

Author Contributions

The authors declare equity in the process of developing the article. Gustavo A. Marrero was responsible for writing the bulk of the article along with Francisco J. Ramos-Real. Yannick Perez proposed the scenarios of the electric vehicle study and actively participated in the collection of references. Subsequently, all members of the group discussed the layout of the paper and the scenarios. Finally, Alfredo Ramírez Díaz was responsible for the model design and the generation of the results. All authors have read and approved the final manuscript.

Conflicts of Interest

The authors declare no conflict of interest.

Appendix 1. Levelized Cost of Energy of the Different Technologies on Tenerife

The Levelized Cost of Energy (LCOE) is calculated following the formula shown in the Open Energy Information Data 2015 [38]. The capital cost of each Tenerife power plant is shown in ITC/913/2006 [31]. However, the steam turbines and gas turbines are considered to have a cost of zero, due to being at the end of their life cycle, and the inversion is completely covered. In the case of renewables, we use the Lazard 2014 report [35]. Finally, we assess the capital cost of V2G as 800–1200 €/MWh. On the other hand, the capacity factor is estimated with the relationship between the total energy generated in a year and the total power capacity generating during 8760 h. The fixed and variable (Operation and Maintenance) O&M costs are from the Lazard 2014 report [39], except the cost of V2G. We assume a cost of around 40 €/MWh injected into the grid. Finally, the cost of fuel price includes the logistic price in terms of €/MWh. The reference is the ITC/914/2006 [32], where it is explained that the fuel cost is shown in the European Marketscan, and it is 2.96 €/MWh for gas oil and 5.53 €/MWh for fuel oil [40]. We assume the investment in cars as a private user expenditure. The discount Rate (D) is fixed as the 7%, and the Capital Cost Recovery factor (CRF) is 0.094. The main parameters covered by the LCOE are detailed in Table A1.
Table A1. Levelized cost of energy parameters.
VariableCapital CostNDCRFCapacity FactorTInvestment Cost (Overnight)Fixed Cost O&MVariable Cost O&MPlant EfficiencyFuel PriceIntermittency PriceCO2/PriceLevelized Cost of Energy
Units€/kWyears%L/years%%%€/MWh€/MWh€/MWh%%€/MWh€/MWh€/MWh€/MWh
minmaxaverage minmax minmaxaverageaverageaverageminmaxminmaxaverageaverageaverageminmaxaverage
Combined Cycle1000109210462070.09445600.39223.233.828.51.133.24247103.3160.6131.104.55134.3204.4169.38
Steam Turbine0002070.09418240.3920.00.0020.2811.223035107.7159.3124.107.7127.4202.8165.12
Gas Turbine32577054752070.09420250.39217.752.335.07.197.02026186.8337.3275.308.75220.6419.5320.01
Diesel Engines0002070.09440500.3920.00.0013.3515.02384682.0125.898.005.6104.3156.0130.17
Wind Power950120010752070.09429330.39234.449.441.913.92010010000016062.581.271.84
Photovoltaic1300160014502070.09416180.39286.3119.5102.911.2501001000004098.5137.7118.12
V2G800120010002070.09416160.39253.980.867.3440.2001001000000074.9140.2107.55

Appendix 2. Energy Storage Formulation

The model needs also to assess the battery energy balance. The features used in the evaluation of the battery energy balance are the total energy composition in road transport, the energy load in charging stations at night and the energy recovered by the overproduction of renewables (Espill, rec,t). Furthermore, in the case of V2G capacity, the model adds the energy consumption in the peak-hour shavings (Epeak) and the backup loads (Ebackup). Thus, the total energy in the batteries of the EVs connected each timestamp (BEV,t) is defined by the energy in the batteries in the last timestamp (BEV,t-1), plus the energy charged in batteries, minus the energy consumption on the road.
B E V , t =   B E V , t 1 +   E s p i l l ,   r e c , t + E E V , t   E f f   D w d , w k , t   N E V E C r o a d 1000 E b a c k u p , t   E p e a k , t E f f  
The energy charged for the EVs (EEV,t) is the energy required for the EVs in the charging process. Finally, the third summand is the energy consumed in road transport each moment. This is composed by the distance travelled each timestamp (Dwd,wk,t) depending on weekdays or weekend, the number of vehicles in the fleet (NEV) and the average rate of energy consumption in road transport [24]. For the energy exchange between the battery and the network and vice versa, this has taken into account by the average efficiency of the charger (Eff). All summands are expressed in MWh.
Finally, the real-time state of charge (SOC) of the EVs’ batteries are shown in Equation (5). This formula expresses the energy storage in the batteries divided by the total energy storage capacity, defined as a percentage.
S O C E V , t = B E V , t S E V × 100 %
where: SOCEV, t: state of charge (%) of the batteries (V2G) connected each timestamp (t); SEV: total battery capacity (V2G) since 15%–95% of the state of charge (MWh).

References

  1. Lynge, J.T. Renewable Energy on Small Islands, 2nd ed.; Forum for Energy and Development (FED): Copenhagen, Denmark, 2000; ISBN 87-90502-03-5. [Google Scholar]
  2. Perez, Y.; Ramos-Real, F.J. How to make a European integrated market in small and isolated electricity systems? The case of Canary Islands. Energy Policy 2008, 36, 4159–4167. [Google Scholar] [CrossRef]
  3. United Nations Developing Programme (UNDP). Barbados Declaration on Achieving Sustainable Energy for All in Small Island Developing States (SIDS); UN Publication: Bridgetown, Barbados, 2012. [Google Scholar]
  4. Anuario Energético de Canarias, 2013. Consejería de Empleo, Industria y Turismo del Gobierno de Canarias. Available online: http://www.gobcan.es/ceic/energia/galerias/ficheros/20141125-A-ENERGETICO-CANARIAS-2013.pdf (accessed on 12 November 2015).
  5. IRENA: Renewable Energy Opportunities for Island Tourism. Available online: http://www.irena.org/DocumentDownloads/Publications/IRENA_RE_Island_Tourism_report_2014.pdf (accessed on 12 November 2015).
  6. Dornan, M. Renewable energy development in small island developing states of the pacific resources. Resources 2015, 4, 490–506. [Google Scholar] [CrossRef]
  7. Weisser, D. Power sector reform in small island developing states: What role for renewable energy technologies? Renew. Sustain. Energy Rev. 2004, 8, 107–127. [Google Scholar] [CrossRef]
  8. REE (Red Electrica de España). Aplicación demanda en tiempo real (Tenerife) año 2013. Available online: https://demanda.ree.es/visionaCan/VisionaTenerife.html (accessed on 12 November 2015).
  9. IRENA: Renewable Energy Country Profiles—Special edition on islands. Available online: http://www.irena.org/DocumentDownloads/Publications/Country_profiles_special_edition-islands.pdf (accessed on 12 November 2015).
  10. Elahee, M.K. Sustainable energy policy for small-island developing state: Mauritius. Utility Policy 2011, 19, 71–79. [Google Scholar] [CrossRef]
  11. Szabo, S.; Kougias, I.; Moner-Girona, M.; Bódis, K. Sustainable energy portfolios for small island states. Sustainability 2015, 7, 12340–12358. [Google Scholar] [CrossRef] [Green Version]
  12. Red Eléctrica de España. E-sios, 2013. Costes de producción en las Islas Canarias año 2013. Available online: http://www.esios.ree.es/web-publica/ (accessed on 12 November 2015).
  13. Marrero, G.A.; Ramos-Real, F.J. Electricity generation cost in isolated system: The complementarities of natural gas and renewables in the Canary Islands. Sustain. Energy Rev. 2010, 14, 2808–2818. [Google Scholar] [CrossRef]
  14. Ramos-Real, F.J.; Moreno-Piquero, J.C.; Ramos-Henríquez, J.M. The effects of introducing natural gas in the Canary Islands for electricity generation. Energy Policy 2007, 35, 3925–3935. [Google Scholar] [CrossRef]
  15. Marrero, G.A.; Perez, Y.; Petit, M.; Ramos-Real, F.J. Electric vehicle fleet contributions for isolated systems. The case of Canary Islands. Int. J. Automot. Technol. Manag. 2015, 15, 171–193. [Google Scholar] [CrossRef]
  16. Guerrero-Lemus, R.; Benjamin, S. Study of the new Spanish legislation applied to an insular system that has achieved grid parity on PV and wind energy. Renew. Sustain. Energy Rev. 2015, 49, 426–436. [Google Scholar] [CrossRef]
  17. Rious, V.; Perez, Y. Review of supporting scheme for island power system storage. Renew. Sustain. Energy Rev. 2014, 29, 754–765. [Google Scholar] [CrossRef]
  18. PECAN, Plan Energético de Canarias 2006. Consejería de Industria, Comercio y Nuevas Tecnologías. Dirección General de Industria y Energía. Available online: http://www.gobcan.es/ceic/energia/doc/planificacion/pecan/DOCUMENTO_REVISION_PECAN2006.pdf (accessed on 12 November 2015).
  19. Kempton, W.; Letendre, S. The V2G concept: A new for model power? Connecting utility infrastructure and automobiles. Public Util. Fortn. 1996, 140, 16–26. [Google Scholar]
  20. Dietrich, K.; Latorre, J.M.; Olmos, L.; Ramos, A. Demand response in an isolated system with high wind integration. IEEE Trans. Power Syst. 2012, 27, 20–29. [Google Scholar] [CrossRef]
  21. Kempton, W.; Tomic, J. Vehicle-to-grid power fundamentals: Calculating capacity and net revenue. J. Power Sources 2005, 144, 268–279. [Google Scholar] [CrossRef]
  22. Turton, H.; Moura, F. Vehicle to grid systems for sustainable development: An integrated energy analisys. Technol. Forecast. Soc. Chang. 2008, 75, 1091–1108. [Google Scholar] [CrossRef]
  23. Farhoodnea, M.; Mohamed, A.; Shareef, H.; Zayandehrodi, H. Power quality impacts of high-penetration electric vehicle stations an renewable energy-based generators on power distribution systems. Measurement 2013, 46, 2423–2434. [Google Scholar] [CrossRef]
  24. Dang, X.L.; Petit, M.; Codani, P. Transformer operation conditions under introduction of PV and EVs in an eco-district. In Proceedings of the 2015 IEEE Power & Energy Society General Meeting, Denver, CO, USA, 26–30 July 2015; pp. 1–5.
  25. Haidar, A.M.A.; Muttaqi, K.M.; Sutanto, D. Technical challenges for electric power industries due to grid-integrated electric vehicles in low voltage distributions: A review. Energy Convers. Manag. 2014, 86, 689–700. [Google Scholar] [CrossRef]
  26. Rodrigues, E.M.G.; Godina, R.; Santos, S.F.; Bizuayehu, A.W.; Contreras, J.; Catalao, J.P.S. Energy storage systems supporting increased penetration of renewables in islanded systems. Energy 2014, 75, 265–280. [Google Scholar] [CrossRef]
  27. Camus, C.; Farias, T. The electric vehicles as a mean to reduce co2 emissions and energy cost in isolated regions. The Sao Miguel (Azores) case study. Energy Policy 2012, 43, 153–165. [Google Scholar] [CrossRef]
  28. Blyth, P.L. Electric Cars on the 100% Renewable Energy Island of Samsoe. February 2011. Available online: http://projekter.aau.dk/projekter/files/52872570/SEPM4_2011_8.pdf (accessed on 12 November 2015).
  29. McCarville, M. The Emergence of Electric Vehicles on Prince Edward Island and Potential Scenarios to 2030. A Guide for Policy Development. August 2009. Working Paper. Available online: http://www.ecopei.ca/The_Emergence_of_Electric_Vehicles_on_Prince_Edward_Island_v1.1 (accessed on 12 November 2015).
  30. Bueno, C.; Carta, J.A. Wind powered pumped hydro storage systems, a means of increasing the penetration of renewable energy in the canary islands. Renew. Sustain. Energy Rev. 2006, 10, 312–340. [Google Scholar] [CrossRef]
  31. Orden ITC/913/2006, de 30 de marzo, por la que se Aprueban el Método de Cálculo del Coste de Cada uno de los Combustibles Utiliza-dos y el Procedimiento de Despacho y Liquidación de la Energía en los Sistemas Eléctricos Insulares y Extrapeninsulares. Available online: http://www.boe.es/boe/dias/2006/03/31/pdfs/A12484-12556.pdf (accessed on 16 November 2015).
  32. Orden ITC/914/2006, de 20 de Marzo. “Se Establece el Método de Cálculo de la Retribución de Garantía de Potencia Para las Instalaciones de Generación en Régimen Ordinario de los Sistemas Eléctricos Insulares y Extrapeninsulares”. Ministerio de Industria, Turismo y Comercio. Available online: https://www.boe.es/buscar/pdf/2006/BOE-A-2006-5808-consolidado.pdf (accessed on 16 November 2015).
  33. Orden ITC/1559/2010, de 11 de Junio, Por la Que se Regulan Diferentes Aspectos de la Normativa de los Sistemas Eléctricos Insulares y Extrapeninsulares. Available online: http://www.boe.es/boe/dias/2010/06/15/pdfs/BOE-A-2010-9417.pdf (accessed on 16 November 2015).
  34. Marrero, G.; Ramos-Real, F.J.; Perez, Y.; Ramirez, A. Willingness to Pay for the Electric Vehicles and Their Attributes in Canary Islands. Chaire Armand Peugeot. In Proceedings of the Second International Conference: “Electromobility: Challenging Issues”, Paris, France, 18–19 December 2014.
  35. Soliman, A.S.; Mantawy, A.H. Modern Optimization Techniques with Applications in Electric Power Systems; Springer: New York, NY, USA, 2012; ISBN 978-1-4614-1751-4. [Google Scholar]
  36. Estudio Para la Implantación del Vehículo Electric en Canarias. Instituto Tecnológico de Canarias. Gobierno de Canarias. Noviembre de 2013. Available online: http://ve.renovae.org/files/Estudio_Implantacin_Vehculo_Elctrico_-_Noviembre_2013.pdf (accessed on 12 November 2015).
  37. Comisión Nacional de los Mercados y la Competencia. Estudio Sobre el Mercado Mayorista de Carburantes de Automoción en España. Available online: http://www.cnmc.es/Portals/0/Ficheros/Promocion/Informes_y_Estudios_Sectoriales/2015/150714_E_CNMC_002_Estudio_carburantes.pdf (accessed on 12 November 2015).
  38. Open Energy Information Data 2015. Available online: http://en.openei.org/apps/TCDB/levelized_cost_calculations.html#lcoe (accessed on 12 November 2015).
  39. Lazard’s Levelized Cost of Energy Analysis-Version 8.0. September 2014. Available online: http://www.lazard.com/media/1777/levelized_cost_of_energy_-_version_80.pdf (accessed on 12 November 2015).
  40. Platts, 2014. Mercado CIF Mediterráneo (Génova/Lavera) Publicada en el Platts European Marketscan. Available online: http://www.platts.com (accessed on 12 November 2015).

