Article

Measuring Resilience to Natural Hazards: Towards Sustainable Hazard Mitigation

1
Department of Research and Development, Research Institute of Korea Appraisal Board, 291, Innovalley-ro, Dong-gu, Daegu Metropolitan City 701-870, Korea
2
M.I.T. Department of Urban Studies and Planning, 77 Massachusetts Avenue, Room 9-238, Cambridge, MA 02139-4307, USA
*
Author to whom correspondence should be addressed.
Sustainability 2015, 7(10), 14153-14185; https://doi.org/10.3390/su71014153
Submission received: 29 April 2015 / Revised: 1 October 2015 / Accepted: 7 October 2015 / Published: 20 October 2015
(This article belongs to the Special Issue Sustainability Strategies to Adapt to Climate Change)

Abstract

:
Measuring resilience to natural hazards is a central issue in the hazard mitigation sciences. This paper applied a confirmatory factor methodology to operationalize the biophysical, built-environment, and socioeconomic resilience dimensions for local jurisdictions in large urban metropolitan areas in South Korea. Mapping the factor scores of the dimensions revealed great spatial variations. The factor covariances showed a trade-off relationship between natural infrastructure and human activities. A hierarchical cluster analysis was used to classify the localities into heterogeneous groups with respect to the identified resilience dimensions. Densely developed and affluent urban areas tend to lack biophysical resilience. Some local governments, sorted into the same groups, turn out to be located in different metropolitan areas. The spatial variation and inequality in the resilience dimensions suggest the necessity of integrated and flexible governance for sustainable hazard mitigation.

1. Introduction

The increase in intensity of natural hazards is a global phenomenon, and their impact has no national boundaries. According to the Annual Disaster Statistical Review 2013 [1], 330 natural disasters claimed more than 21,610 people’s lives all over the world in 2013. Also, seven out of the top 10 ranking countries are located in Asia. As for the hazard type, meteorological disasters were the highest since 2003 in Asia. Due to the uncertainty about the size and distribution of the impacts of natural hazards, international cooperation, such as the establishment of the World Meteorological Organization (WMO), takes place at the global scale. The Association of Southeast Asian Nations (ASEAN) also declared the Agreement on Disaster Management and Emergency Response in 2005 to enhance cooperation in the region [2].
The integration and cooperation mechanism is also a central issue within a country to promote the effective emergency response. Rabbon et al. [3] point out that while the U.S. Army Corps of Engineers (USACE) and the Federal Emergency Management Agency (FEMA) have played a major role in managing and mitigating flood risks, multiple layers of government are responsible for the flood risk management via a variety of programs and authorities in the United States. In the Philippines, the role of the National Disaster Coordinating Council (NDCC) had not been effective at the early-warning and prevention stage. In response to the need for integrated governance, the new National Disaster Risk Reduction and Management (DRRM) law has been launched since 2010 to set up the intergovernmental cooperation mechanism from the regional to the municipal level [4]. The central government of China established the national Emergency Management Office of the State Council in 2006, which intended to integrate governments of all levels for the unification of emergency management—under the catch phrase of “give priority to disaster prevention, and combine disaster prevention with disaster resistance and relief” [5]. Countries seem to have well recognized that the establishment of the flexible and integrated governance system is pivotal to minimize the negative impact of natural hazards.
South Korea has also experienced significant changes in its emergency management system and disaster governance. Since the “Basic Law for Disaster and Safety Management” enacted in 2004, South Korea has made substantial progress in the devolution of the environmental governance system [6]. As the Roh administration (2003–2008) emphasized the importance of the role of civil society and local activism and enhanced the bottom-up movement for decentralization in the general political arena [7], the paradigm of disaster management has been changed from the defense for national security to the enhancement of comprehensive decentralization [6]. The Lee administration (2008–2013) put stronger emphasis on the enhancement of local government’s autonomy in the decision-making process and on the integration of communication channels between the central and the local governments in dealing with natural disasters. The current Park administration pushes forward the application of information technology for disaster management in the pursuit of decentralized governance [6].
As human society is becoming fragile and vulnerable to the consequences of negative natural events, such as earthquakes, floods, hurricanes, landslides, tsunamis, volcanos, wildfires, and other disasters, the necessity of sustaining resilience to natural hazards has well been documented in the natural hazards sciences. Cutter et al. [8] claimed that fostering resilience is a national imperative at the state and local level in order to reduce the disaster risk. While resilience is considered a desired system property in hazard mitigation and management [9], the concept of resilience is too vague to be useful in informing the disaster risk reduction agenda [10]. In line with the proposed community resilience indicators by Cutter et al. [11], academics have tried to measure the environmental, social, economic, physical, institutional, other resilience dimensions. However, resilience is an abstract concept so that the elements of resilience and their indicators vary with context.
The purpose of this study is two-fold. Focusing on major urban metropolitan areas in South Korea, we present a more advanced measurement model that operationalizes and measures the theoretic resilience concepts from indicators that constitute the physical, built-environment, and socioeconomic dimensions. Also, the decision-making unit of observation is local government in our quantitative evaluation. Further, from the identification of the resilience dimensions, the study classifies all the jurisdictions into distinctive sub-groups. This two-step quantitative approach provides useful answers for policy formulation to increase the intergovernmental cohesion and to enhance the recovery potential in response to natural hazards.

2. The Concept of Resilience to Natural Hazards and Disasters

2.1. Resilience and Its Linkage to Persistence and Dynamism of Systems

Throughout the natural hazards studies, there is no single definition of resilience [12]. Resilience originally arises from ecology, but is also associated with social systems and the socio-ecological system [13]. The concept of resilience is a common knowledge in physics, engineering, economics, ecology, psychology, sociology, anthropology, public health, geography, and disaster management [14]. In a generic terminology, resilience implies “spring back from” disturbances. After a shock occurs in a system, the processes of response and recovery can happen subsequently or can be overlapped. While Pelling’s definition for resilience (“Resilience to natural hazard is the ability of an actor to cope with or adapt to hazard stress.”) is useful [15], Holling [16] provides a more rigorous definition: “Resilience is a measure of the persistence of systems and of their ability to absorb change and disturbance and still maintain the same relationships between populations or state variables”. Holling’s definition is more relevant to the domain of time and space in the hazard mitigation sciences. Holling clarifies the difference between resilience and stability. Very resilient systems can still fluctuate greatly in that resilience is related to the domain of attraction and the need for persistence, while stability addresses the equilibrium and the maintenance of a system. The attractor can be a trajectory, which indicates that current conditions (or states) will tend to be directed toward the attractor. In a mathematical sense, the concept of resilience reflects the fixed point theorem in a dynamical system. In response to external factors (or disturbances), resilient systems can maintain constant state values within the domain of attraction [13]. Furthermore, they also have the ability to advance these values through learning and adaption [9,17,18].
Gunderson and Holling [19] introduced a panarchical view of ecological and socio-ecological systems. The panarchy framework encompasses resilience and adaptive cycles of growth, reorganization, accumulation, and renewal. Also, this reciprocal feedback loop could be applicable to a landscape scale. The hierarchy is not static but transitory. This nature is in line with the dynamic mechanism in Holling [16]. This metaphor clearly states that understanding the cyclical linkage between human and environmental systems is of critical importance to enhance resilience and sustainability within a system. A part of our quantitative approach is designed to explain the relationship between the human element and the natural infrastructure.

2.2. Linkages among Vulnerability, Resilience, and Adaptive Capacity

Even though Adger et al. [17] and Folke et al. [20] considered resilience the opposite concept to vulnerability, the nature of dynamism in resilience suggests that resilience is in fact not just the flip side of vulnerability because resilience is linked to the “capacity of response component” of vulnerability [13]. We know that resilience is defined with respect to state shifts between domains of attractions, while vulnerability reflects structural changes of the whole system [13]. The conceptual linkages among resilience, vulnerability, and adaptive capacity are well articulated by the recent research by Yoon et al. [12] through their extensive literature review in the disaster management discipline.
When it comes to the relationship between resilience and adaptive capacity, resilience is nested to adaptive capacity [17,18,21], or vice versa [22,23,24]. Manyena [10] provided the common elements between vulnerability and resilience, while some elements for the two concepts are distinctive. For example, resistance in vulnerability is different from recovery in resilience. Vulnerability focuses on outcome whereas resilience addresses process. Safety in vulnerability differs from “bounce back” in resilience. These contrasts correspond to the dynamic nature of the resilience framework. According to Cutter et al. [11], resilience and vulnerability are separated from each other but often linked together. Resilience and vulnerability are not the opposite, but simply separated from each other when resilience acts as a set of adaptive capacities [25]. Or, a community can be highly vulnerable and highly resilient at the same time [25]. In detail, “socioeconomic characteristics may indicate vulnerability, but do not necessarily have anything to do with lack of cyclone knowledge or preparation. Similarly, resilience indicators were a different set of measures to those of vulnerability” [25].

2.3. Community Resilience

Departing from the theoretical and systematical approach in defining the concept of resilience, a large strand of literature has aimed to refine the resilience dimensions at the community level. This approach is closely related to Cutter [26] that proposed the concept of place vulnerability. Following the notion that the hazardousness of places is made up of geographical context and social fabric by Cutter [26], Cutter et al. [27] first quantified a variety of social indicators of vulnerability to shrink them into a single composite index (SoVI). In the framework of social-ecological systems, resilience refers to the capacity of the system to change, adapt, and yet to be stable within certain thresholds [28]. We can refine this concept down more specifically to communities in regard to the spatial context. The resilience of a community pertains to the capacity to cope with hazards and disasters by (1) reducing its vulnerability elements, (2) mobilizing socio-economic resources, and (3) utilizing the existing biophysical infrastructure. Indeed, demographic, social, economic, physical, and environmental dimensions are linked to community resilience [12]. It seems that the biophysical dimension tends to attract less attention in today’s resilience sciences.
Coles and Buckle [29] suggested that communities influenced by negative natural events should actively participate in the recovery process. In detail, cooperative capacity, social skills, and knowledge should be fostered within the process. Bruneau et al. [14] proposed the following four elements to boost community resilience: robustness, redundancy, rapidity, and resourcefulness. Robust communities have the ability to stand still in the face of natural disasters. Redundancy means the ability to swiftly replace deteriorated assets with new functioning components. This redundancy component can be enhanced by industry diversification [30]. Communities with diverse economic sectors would have a higher level of capability to shift resources from one sector to another. Resourcefulness pertains to the capacity to establish priorities, identify problems, and mobilize resources. Lastly, rapidity refers to the capability to respond quickly to natural disasters in order to achieve goals and minimize the losses.
In their seminal paper, Norris et al. [31] viewed the concept of resilience as a set of capacities. The components of the capacities are economic development; social capital; network structures and linkages; social support; community bonds, roots, and commitments; information and communication; and community competence. The notion of information and communication is related to the systems and infrastructure for informing the public. Community competence comprises (1) collective action and decision-making, and (2) collective efficacy and empowerment. These elements overlap the elements of good governance toward resilient systems, reviewed by Djalante et al. [32]. The linkage between resilience and adaptive capacity has been further studied by Engle [33] and Aldrich [34], which described adaptive capacity as the ability of actors to manage limited resources in order to respond to stress factors appropriately. By analyzing megadisasters around the world, Aldrich [34] argued that social capital is one of the key elements in the process of recovery. Turning to the relationship between resilience and vulnerability, resilience is in general negatively associated with vulnerability [33].

3. Research Methodology

The existing resilience theories reviewed in the previous section seem to emphasize the social ecology paradigm, which addresses the multidimensionality of social, economic, political and institutional components. However, our analysis does not completely tilt toward the “soft” dimensions. Rather, we consider both the environmental and social aspects in order to observe how they are correlated and how their mapping reveals distinctive geographic variations across local jurisdictions. Using a confirmatory factor analytic framework, this study reduces the conceptual dimensions of resilience to the following three components: biophysical, built-environment, and socioeconomic resilience. With the factor scores of the three latent variables, a hierarchical cluster analysis classifies the local governments into several groups.

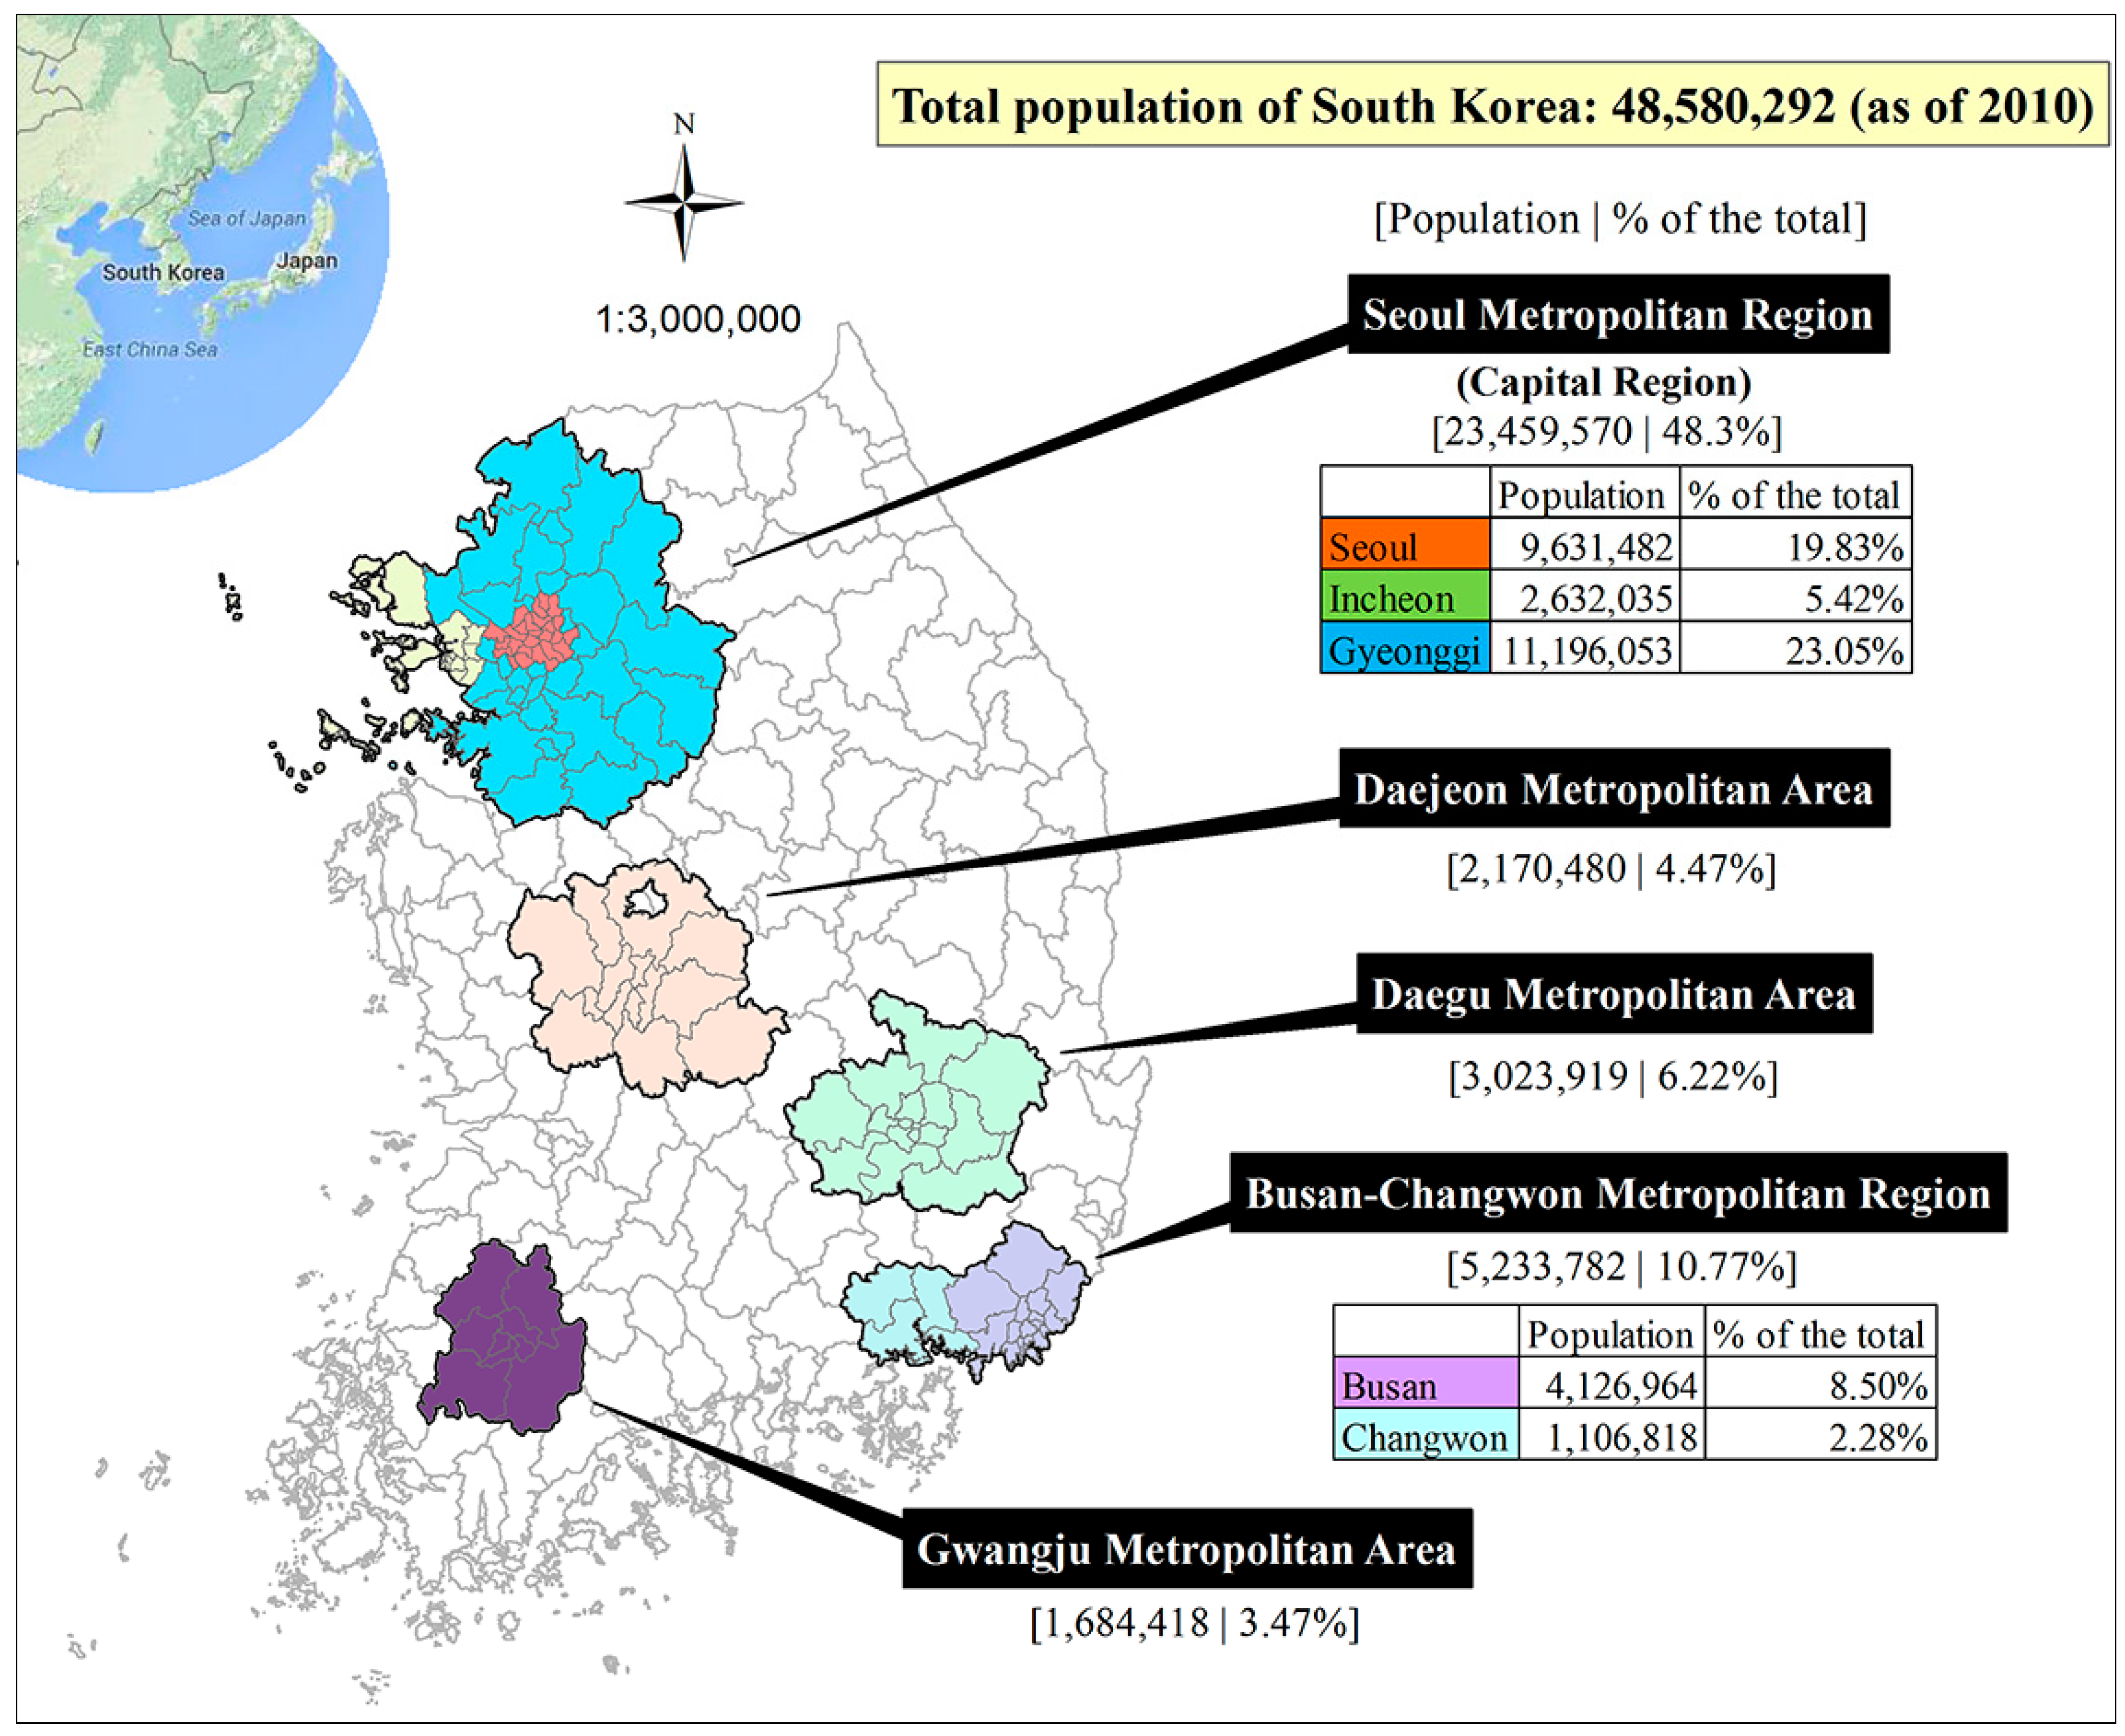
3.1. Study Area: Geography and Local Government System

South Korea is located in Eastern Asia (37°18′42″ N/37°22′43″ N, 124°19′30″ E/130°52′31″ E) on the second half of the Korean Peninsula, surrounded by the Yellow Sea, Korea Strait, and the East Sea (“Donghae” in Korean). Approximately 70 percent of its 99,274 square kilometers of land is mountainous. This includes Korea’s two major ranges, the Taebeak and Sobaek Mountains, which produce diverse climatic events within the relatively small country. South Korea has a long history of being prone to snowfalls, tidal waves, lightning strikes, and high winds and floods from occasional typhoons [35,36]. According to the CIA World Factbook [37], South Korea is slightly smaller than Pennsylvania; thus, even a small- or a medium-sized climatic event can affect the entire country. Recent natural disasters have included floods, tropical storms, land-slides, typhoons, and large waves [35]. Figure 1 illustrates the geospatial location of the Korean Peninsula, and the populations of the metropolitan areas of interest in South Korea.
Figure 1. Study area: large urban areas in South Korea.
Sustainability 07 14153 g001
According to the United Nations, South Korea has 16 provincial-level governments, and 235 lower-level local governments [38]. When a natural event, such as a tropical cyclone, hits South Korea’s territory, the impact typically affects most of these jurisdictions. This homogenous influence enables us to observe all the relevant characteristics of the consequences of certain natural hazards, which makes our analysis both academically and practically useful. Among those jurisdictions, the geographical units of interest are 126 localities of the five metropolitan areas/regions, which contained 73.2% of South Korea’s total population as of 2010.
Another reason for our case selection is that in reality, the government system has not been fully decentralized, and autonomy at the local level is not complete, although all local “self” governments are currently functioning as legally and administratively autonomous institutions with elected local councils and executives. Indeed, the Local Autonomy Act (LAA) limits the local functions through the conditional clause of Article 9, which reads, “Despite the functions specified in this law, the central government may exercise its own power and control over any function, if other laws define them as the functions of the central government”. In other words, a large portion of the local government’s functions is still concentrated in the central government. In particular, some of the localities are severely dependent on the central government for local public finance and budget management. Furthermore, the central and local government functions (particularly, in the labor, environment, and construction sectors) overlap significantly [39]. We expect that this study will provide policy implications for hazard mitigation as South Korea moves toward the devolution and reorganization of planning functions from the central to the local level.

3.2. Resilience Index Creation Using Confirmatory Factor Analysis

3.2.1. Critique on the Existing Methodologies

Confirmatory factor analysis (CFA) is a type of structural equation modeling (SEM) that analyzes a priori measurement models [40]. In the CFA framework, both the number of resilience dimensions and the corresponding indicators are explicitly specified from the existing theoretical support [41]. From the perspective of the model specification, there are critical differences between principal component analysis (PCA) and CFA [42].
In the principal component approach, all the observed variables are connected with all the resilience factor variables. For example, in the research by Cutter et al. [27], the MED_AGE90 indicator is intended to measure the Age vulnerability dimension, but this indicator is also linked to all the other factors, including, for example, the Occupation factor and the Infrastructure Dependence factor. The error terms for the indicators are uncorrelated. In addition, researchers who use PCA cannot impose any restriction or modification on the factor loadings or the error covariance structure.
Our major concern with the principal component methodology comes from the exploratory nature in deriving the resilience factors. Researchers who use PCA collect indicators, conduct an initial PCA, investigate the pattern of factor loadings, specify different alternative models, and end up “grinding it” through iterative post-hoc exploratory procedures, hoping the selected indicators fall into the hypothesized structure [43]. In other words, researchers have little control over the operationalization of resilience concepts. Our purpose for the resilience assessment in this study is not to categorize indicators into the factor structure that is believed to be appropriate. We want to test whether or not the data satisfactorily measure the theoretical concepts and at what degree of statistical significance. PCA does not provide any statistical test for the factor loadings. Also, we care about the reliability and validity of the resilience dimensions, which are not well addressed in the PCA literature.
The practice of rotation in PCA is also an issue. Most of the existing PCA studies use the orthogonal varimax rotation in order to obtain larger loadings for indicators to the targeted factors. In order to address this issue, let us take an example of the seminal vulnerability study by Cutter [26]. The paper provides a theoretical model that synthesizes the concepts of risk, mitigation, hazard potential, biophysical, and social vulnerability. The paper in fact argues that the interaction of both the social vulnerability and biophysical vulnerability generates the place vulnerability. We hardly believe that there are no correlations among the substantiated vulnerability concepts. Does the built-environment factor have no association with the elderly and disabled factor? The lack of consideration given to the covariance structure among the hypothesized resilience dimensions also applies to the work by Burton [44], which used a multidimensional scaling (MDS) analysis as an alternative to the PCA approach to cluster the underlying dimensions of resilience.
In addition, our CFA approach should be distinguished from summation and aggregation methodologies, conducted by Cutter et al. [45], Peacock et al. [46], and Cutter et al. [47]. Those studies construct resilience dimensions by summing or averaging the indicators after checking the level of internal consistency for the sets of variables. The summing of indicators to calculate the composite index does not address their relative importance [48]. Also, the “non-refined” methods do not use the underlying structure of the relationships among the observed indicators and among the hypothesized factors [49]. Furthermore, we take full advantage of the CFA method for inspecting the reliability and validity of resilience dimensions, which is a more advanced approach than the previous Cronbach’s alpha and correlation analyses.
Another focus in our resilience study is to understand whether or not jurisdictions with a high level of built-environment resilience show a more or lesser degree of biophysical capacity. If we could map out the degree and direction of the correlation (or the trade-off relationship) between the derived resilience indices, the result could provide implications on policy design for resource allocation to enhance adaptive capacity to natural hazards. In this regard, our quantitative investigation on the resilience factor structure utilizes the confirmatory factor approach as an alternative to the exploratory methods.
In contrast to PCA’s exploratory and inflexible nature, CFA ensures some indicators will only be associated with pre-specified resilience dimensions. For a hypothetical example, the Road Length indicator can be connected to the Infrastructure, to the Economic Activity factor, or to both factors. The second difference is that some error terms are allowed to be correlated. Finally, researchers can constrain some of the loadings to certain values.

3.2.2. Operationalization

With an emphasis on setting the confirmatory procedure, this study operationalizes the model that specifies the relationships between the unobserved resilience dimensions and the corresponding indicators a priori on the basis of theoretical and empirical knowledge from the existing resilience studies. The recent study by Yoon et al. [12], which is most relevant to our study area, proposed the six resilience dimensions: human, social, economic, institutional, physical, and environmental factors. Our study shrinks those to the following three dimensions: biophysical, built-environment, and socioeconomic. This is because we feel that the six dimensions still conceptually and statistically overlap significantly although the literature suggests that they are conceptually distinct from each other. We want to obtain a satisfactory level of discriminant validity among the dimensions. To that end, we start our analysis with the three aforementioned dimensions, which are designed to be as distinctive as possible.
In addition, we do not consider the institutional dimension because a significant part of the planning functions in each locality is highly centralized to its upper level metropolitan government and to the central government of South Korea. This reality hinders us from measuring the level of preparedness at the local level. Even though the Korean National Emergency Management Agency (NEMA) evaluates the performance of local governments on a yearly basis [12], the Agency provides the performance indicator as the form of composite score only. If we could observe the detailed components behind the evaluation, we might be able to extract each local government’s competence and performance in regard to the level of preparedness. However, the Agency’s survey instrument was not publicly available. Therefore, we could not determine which part of the planning capacity comes from which level of government. Also, we tried to collect some institutional variables from the local governments’ and the upper-level metropolitan governments’ statistical yearbooks, but the data quality was not satisfactory for our analysis. For example, the data for the number of firefighters were available for only 101 localities out of the total 126 communities. In our study, there are 16 indicators with three resilience dimensions being hypothesized (Table 1).
Table 1. Hypothesized resilience dimensions and the corresponding observed indicators.
Resilience Dimension aIndicator aDescriptionSource
Biophysical resilienceSLOPEAverage degree of slope of land (°, degree)Digital Topographic Map, National Geographic Information Institute
ELEVATIONAverage elevation of land (meter)Digital Topographic Map, National Geographic Information Institute
WATERLANDPercentage of river or stream areas (%)Land Cover Map, Ministry of Environment
LOWLANDPercentage of land 10 meters below sea level (%)Digital topographic map, National Geographic Information Institute
INTENSITYDaily precipitation intensity (0.1 mm/day)Annual Climatological Report, Korea Meteorological Administration
Built-environment resilienceRESIDENTIALPercentage of residential area (%)Land Cover Map, Ministry of Environment
INDUSTRIALPercentage of industrial area (%)Land Cover Map, Ministry of Environment
COMMERCIALPercentage of commercial area (%)Land Cover Map, Ministry of Environment
DENSITYPopulation density (1000 people/ km2 land area)Korea Statistical Information Service, Statistics Korea
DILAPIDATEDPercentage of housing that is permitted before 1985 (%)Korea Statistical Information Service, Statistics Korea
FACILITIESPercentage of area with facilities and installations for disaster prevention (%)Korea Statistical Information Service, Statistics Korea
Socioeconomic resiliencePOPULATIONCensus population (1000 people)2010 Population and Housing Census, Statistics Korea
FIRFinancial independence ratio (%) bKorea Statistical Information Service, Statistics Korea
TAXREVENUELocal tax revenue (million dollars) cKorea Statistical Information Service, Statistics Korea
ACTIVELABORPercentage of economically active population (%)Korea Statistical Information Service, Statistics Korea
ELDERLYPercentage of populations whose ages are over 65.2010 Population and Housing Census, Statistics Korea
The data are as of 2010. a: We use upper-case and italic abbreviation for the indicators, and denote the factors in lower-case in order for readers to distinguish them easily from one another. b: Computed by dividing the local tax and non-tax revenues by the local expenditures. c: 1 dollar ($) is roughly equal to 1000 Korean Won (₩).

(1) Biophysical Resilience

Biophysical resilience in this study is distinguished from the frequency or magnitude of ex-post hazard events as in Cutter et al. [50], Leichenko and O’Brien [51], and Tate et al. [52]. It reflects the natural resource systems and climatic characteristics of the territory, which are barely controlled by human forces, at least in the short term. Our conceptualization is associated with the carrying capacity of “assimilation” or “absorption”, and is relevant to the three U.S. coastal cases by Boruff et al. [53], the vulnerability-resilience index for ecosystems in India by Brenkert et al. [54], the geomorphological characteristics of the Veneto shoreline in Italy [55], the measurement of system vulnerability in China by Yin et al. [56], and the natural barrier in the Mississippi coastal counties by Burton [44].
For indicators of the biophysical dimension, we take five available variables that are associated with the amount of natural infrastructure and the local climatic conditions: the average degree of slope of land (SLOPE), the average elevation of land (ELEVATION), the percentage of river and stream areas (WATERLAND), the percentage of land 10 m below sea level (LOWLAND), and daily precipitation intensity (INTENSITY). While it may reflect the consequences of a climatic event, precipitation intensity acts as a repetitive stressor and should thus be dealt with over time to enhance the soundness of biophysical capacity.
All of the geomorphic and biophysical indicators mentioned above are closely related to floods and typhoons, which are the most common types of natural hazards in South Korea [57]. The 2011 heavy rain incident, which has been recorded as the heaviest in 100 years, triggered the malfunction of drainage system and result in a massive evacuation in Seoul. More important is that low-lying areas are affected more significantly in comparison with elevated areas when frequent flooding hit urban areas in South Korea [57]. We hypothesize that SLOPE and ELEVATION are positively associated with biophysical resilience, particularly in the context of urban settings in South Korea. On the contrary, urban areas with a significant amount of lowland and water areas are hypothesized to be less resilient. The INTENSITY variable is measured as the yearly total amount of rainfall divided by the days of rainfall in 2010, gauging not just the overall level of precipitation, but its intensity and concentration. Excessive torrential rainfall that happens unexpectedly in a short time period is hypothesized to be negatively correlated with biophysical resilience.
Using the Geographical Information System (GIS) tools in ArcGIS 10.2, we carefully extracted the degree of slope, elevation, and lowland from the Digital Topographic Map, provided by the Korea’s National Geographic Information Institute. The original digitized contour lines (the width of which is 10 m) were converted to elevation points using the TIN (triangulated irregular network) interpolation method. This procedure makes the elevation points spaced in a regular gridded fashion. Then, the gridded elevation values were converted to a DEM (digital elevation model). These digitized surveying technique output the geomorphic information into the rectangular 10 m × 10 m sized cells. Finally, the gridded metrics for slope, elevation, and lowland were averaged up to the territory of each local government.
Table 2 illustrates the spatial distribution of the biophysical resilience indicators. The Seoul Metropolitan Region (or the Capital Region), South Korea’s largest and most highly populated area, shows a lower level of slope and a higher level of land below sea level. The two largest metropolises (Seoul and Busan) have large amounts of water area, most of which correspond to the Han River in Seoul and the Nakdong River in Busan.
Table 2. Mean values of indicators for the biophysical dimension by metropolitan area.
MetroSLOPEELEVATIONWATERLANDLOWLANDINTENSITY
Busan (n = 18)11.474110.7286.1983.304169.086
Changwon (n = 4)14.870127.3294.8943.682162.657
Daegu (n = 15)12.701175.5801.7961.608120.391
Daejeon (n = 14)14.015176.5272.9311.454107.947
Gwangju (n = 9)11.217129.6642.2474.623134.491
Gyeonggi (n = 31)10.032116.3112.97016.522146.625
Incheon (n = 10)4.88830.1025.0229.881154.613
Seoul (n = 25)6.16461.5655.46116.297162.013
Total (n = 126)10.061112.8593.9549.355145.742

(2) Built-Environment Resilience

The built-environment is an artificial asset constructed by human labor. It comprises (1) materials and commodities, (2) interior spaces, (3) composite structures, (4) landscapes, and (5) cities, regions, and the earth itself [58]. We note that manufactured structures in turn affect the daily activities of human beings. This study considers the built-environment as “hardware” that is generally fixed in location in the short term, but shows a higher degree of flexibility and modifiability than biophysical capacity. The built-environment itself is a means of containment for natural hazards, while it also creates loss and the need for recovery when an event’s severity exceeds the tipping point of durability and tolerance at a particular time and location.
The following six indicators represent built-environment resilience: the percentage of residential land use (RESIDENTIAL), the percentage of industrial land use (INDUSTRIAL), the percentage of commercial land use (COMMERCIAL), population density (DENSITY), the percentage of old housing (DILAPIDATED), and the percentage of natural and artificial areas for disaster prevention (FACILITIES). While literature on the direct linkage between urbanization and resilience is thin, Choi [59] argued that properly-managed urbanization can contribute to the reduction in urban disaster damages in the case of Gyeonggi province, South Korea. Also, Vale and Campanella [60] showed evidence that populated areas are durable and resilient to natural hazards in some U.S. cities. We argue that high-density areas with centralized built-environment in fact have a larger capacity to recover from natural disasters through the concentrated communication channels and inter-linked infrastructure. Accordingly, we hypothesize that urbanization is positively related to resiliency. Thus, we anticipate that the path coefficients for RESIDENTIAL, COMMERCIAL, DENSITY, and FACILITIES are positive. According to Shim and Kim [61], industrial land use is attributable to the increase in the damages from natural hazards in South Korea, possibly due to the large amount of impervious surfaces and obnoxious chemical wastes. Thus, we expect a negative coefficient for the INDUSTRIAL variable. The disaster prevention installation (FACILITIES) includes embankment, dam, reservoir, fire extinguishment equipment, and earthquake-resistant structures. In South Korea, the Act on the Maintenance and Improvement of Urban Areas and Dwelling Conditions for Residents stipulates that residential structures whose service life is over 20 years are considered “old”, and are eligible to be demolished and reconstructed. Following the Act, we consider 20 years the cut-off value for judging housing as dilapidated.
Seoul and Busan are characterized as the cores of residential and commercial activities, while the Gyeonggi and Changwon areas adjacent to these large cities provide manufacturing jobs. Gwangju has fallen behind in terms of urban development and economic growth. The large stock of old housing in Busan and Daegu is in part due to the sudden increase in the stock of informal and temporal housing by refugees during the Korean War and lagging urban redevelopment (Table 3).
Table 3. Mean values of indicators for the built-environment dimension by metropolitan area.
MetroRESIDENTIALINDUSTRIALCOMMERCIALDENSITYDILAPIDATEDFACILITIES
Busan (n = 18)21.5972.7243.67418.31125.8210.036
Changwon (n = 4)5.2132.9640.7438.14622.8430.022
Daegu (n = 15)12.4262.9912.9429.21429.2620.028
Daejeon (n = 14)5.6600.9950.9706.99725.2240.071
Gwangju (n = 9)8.3461.3131.2479.02131.8630.013
Gyeonggi (n = 31)9.0333.2011.65010.86912.0980.142
Incheon (n = 10)17.9359.0873.07813.58018.5930.505
Seoul (n = 25)30.4291.0279.00627.10018.4850.301
Total (n = 126)15.6382.7563.53314.52221.0960.153

(3) Socioeconomic Resilience

Socioeconomic resilience refers to the adaptive infrastructure for mobilizing societal and financial resources to prevent and respond to natural hazards and disasters. The strength of labor markets, which is indicated by labor market participation [44,45,47,62,63], may be related to the speed of recovery. Local government earnings are negatively associated with social vulnerability [64]. Thus, we posit the earnings might enhance resiliency. Elderly populations are more susceptible to the impact of natural hazards [12,44,45,47,65].
The five indicators (Table 4) represent the socioeconomic dimension of the size of the economy (POPULATION), labor market activities (ACTIVELABOR), local public finance (FIR, TAXREVENUE), and the number of the population in the extreme age spectrum (ELDERLY). Among these, the financial independence ratio (FIR) indicator is context-specific. This indicator measures the capacity of a local government to collect taxes to finance local services [66]. According to OECD, the level of local public financing and implementation capabilities varies drastically across provinces and metropolitan areas [39]. While existing literature mainly focus on the employed and unemployed dichotomy in explaining labor market activities, we use the indicator (ACTIVELABOR) that is measured by the sum of the employed and the unemployed divided by population whose ages are over 15. This indicator is officially used to illustrate the activities in the labor markets in South Korea. It is clear that the unemployed are not away from the labor markets and a fraction of unemployed keeps searching for jobs. The data do not provide the segmentation for who choose to permanently leave the labor market, and the behavior is hard to observe. As for the fragile elderly population, we choose the age of 65 as the cut-off value in line with traditional age profile categories shown in Statistics Korea, U.S. Department of Health and Human Services, and other international organizations. In accordance with the literature and the context of South Korea, we anticipate that the size and activities of the economy are positively related to socioeconomic resilience while fragile populations make localities less resilient.
Table 4. Mean values of indicators for the socioeconomic dimension by metropolitan area.
MetroPOPULATIONFIRTAXREVENUEACTIVELABORELDERLY
Busan (n = 18)229.27624.078161.54673.76912.297
Changwon (n = 4)276.70540.425305.08971.07311.754
Daegu (n = 15)201.59521.433121.64068.42817.891
Daejeon (n = 14)155.03421.57999.54667.58816.813
Gwangju (n = =9)187.15816.856108.82466.46518.030
Gyeonggi (n = 31)361.16348.832403.36071.53710.673
Incheon (n = 10)263.20429.190190.26372.13812.313
Seoul (n = 25)385.25948.884416.48876.15010.022
Total (n = 126)282.31934.906263.05471.63313.007
The Seoul Metropolitan Region, which includes three metropolitan areas, shows the highest financial independence, whereas Jeonnam Province, which includes the Gwangju area, shows the lowest. Local governments that are highly dependent on the central government for the allocation of local financial resources might be less swift to cope with the occurrence of natural events at the local level.
We observe a high level of heterogeneity across the areas in terms of financial and economic status. The Capital Region, which has been the engine of Korea’s rapid economic growth, hosts the largest portion of the country’s population and exerts a high degree of financial flexibility. While Busan and Changwon have portions of manufacturing jobs and act as hubs for the export goods in the southeastern part of the nation, other areas, such as Deagu, Deajeon, and Gwangju, are relatively sluggish in economic development.

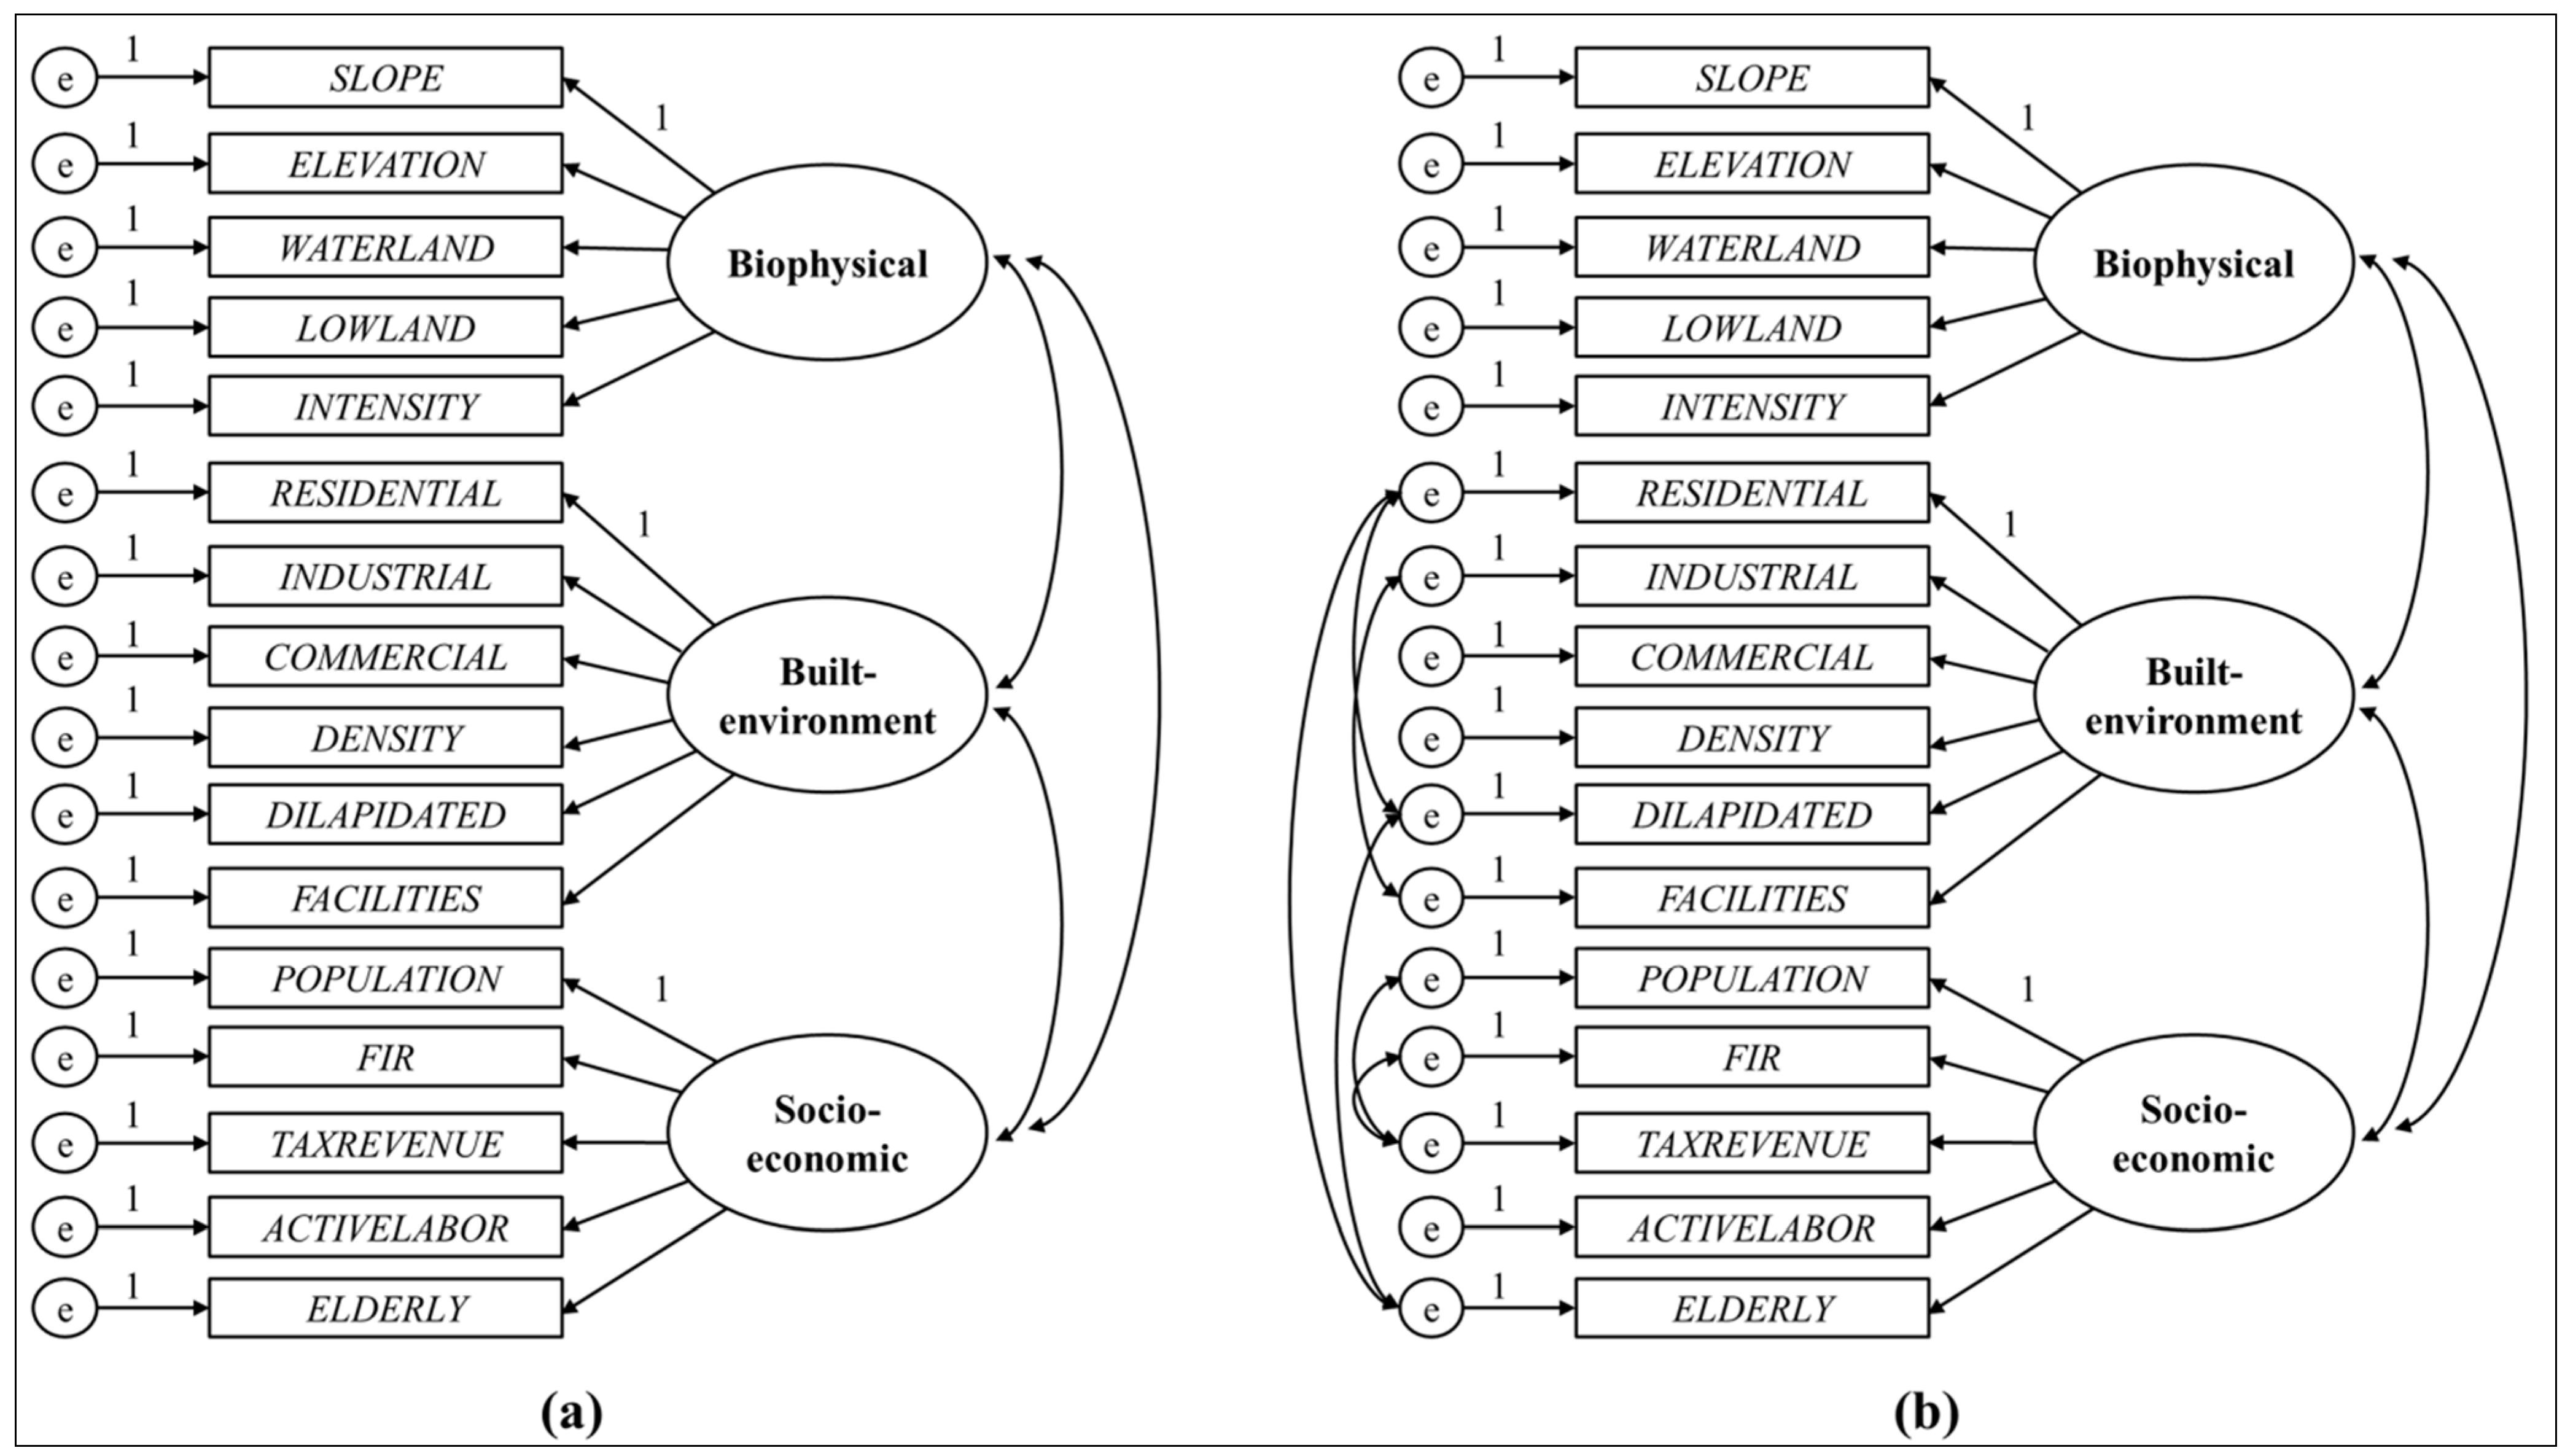
(4) Specification, Estimation, and Modification

The initial CFA model is diagramed in Figure 2a. The model tests the hypothesis that the indicators from SLOPE through INTENSITY measure the biophysical resilience factor, the indicators from RESIDENTIAL through FACILITIES measure the built-environment resilience factor, and the indicators from POPULATION through ELDERLY measure the socioeconomic resilience factor. The causal effects are represented by the lines with single arrowheads from a factor to an indicator. We interpret the effects as regression coefficients that are estimated either in unstandardized or standardized form. A resilience dimension represents the common variation among a set of the relevant indicators. In addition, there are three covariances (and correlations in standardized form) among the three resilience factors that are not estimated in PCA. Each indicator has a measurement error term, and the fixed parameters numbered 1 are scaling constants that are necessary to identify the model. The error variances, the factor loadings, the factor variances, and the factor covariances are estimated via the maximum likelihood procedure. After estimating the initial model, we inspect the fit of the model. The fit measures can be improved by modifying the model through the modification index (M.I.), which represents the expected value to which the chi-square statistic (χ2) would decrease if a particular free parameter were included in the model. Our modification to the initial model is shown in Figure 2b. The confirmatory factor analysis is performed using the “sem” package in Stata 13.1.
Figure 2. Path diagrams for confirmatory factor analysis: (a) Initial model; (b) Modified model.
Sustainability 07 14153 g002
Finally, the factor scores provide us with the estimates of the latent resilience dimensions based on the measurement model. The calculation method corresponds to the regression scoring [67]. Next, the standardized scores of the resilience dimensions serve as input variables in categorizing the 126 localities into distinctive groups in the cluster analysis. We do not need to calculate the SoVI-type composite index because the post-hoc simple sum or weighted sum method results in the loss of information on the factor covariance structure.

3.3. Cluster Analysis

Cluster analysis is a multivariate statistical technique for identifying homogenous groups of units of observation. Local governments in a specific group (or cluster) have in common the identified resilience dimensions that are estimated from the confirmatory factor analysis, but they are dissimilar to localities not classified in that group. In general, the cluster analysis procedure involves the following two steps: the similarity or dissimilarity measure is first calculated to determine the degree of similarity between observations, and the hierarchical or non-hierarchical algorithm is then chosen to perform the classification. Instead of the Euclidean distance used in Shahriar et al. [68], we take the square of the Euclidean distance as the dissimilarity measure to emphasize the far-off local governments in the multidimensional domain of the estimated latent resilience variables. For the classification algorithm, we use the hierarchical technique to observe how distinctive groups are formed sequentially. We did not consider non-hierarchical methods because the number of clusters should be specified a priori.
As for the linkage criteria, we tried several linkage methods widely used in the social sciences, which encompass the complete, single, average, median, and centroid linkages, along with the Ward’s method. For each criterion, we derived the 26 clustering validity indices using the “NbClust” package in R 3.2.0. The detailed explanation on each index for cluster validation can be found in Charrad et al. [69]. We ended up with choosing the solution derived by the Ward’s minimum variance method, by which all possible pairs of clusters are combined at the initial stage and the squared distance to the cluster mean is calculated within each cluster. These distances are summed for all the observations. Then, the combination that produces the lowest sum of squares is selected. We present how we get to the final solution in the later section of the paper.

4. Results

4.1. Reliability, Validity, and Fitness

Resilience dimensions are the underlying latent constructs measured by observed indicators. Thus, we should evaluate whether or not the measurement model obtains a satisfactory level of reliability and validity, which is not well addressed in the existing vulnerability-resilience studies. Reliability reflects the internal consistency, precision, and accuracy of a measurement model, while validity refers to the credibility and soundness of the inferences.
In our confirmatory factor analysis, the composite reliability (C.R.) index can be computed to address the internal consistency of observed indicators measuring a given resilience dimension [70]. We consider 0.70 the minimally acceptable level [71]. As for the validity, convergence validity (or internal validity) is evaluated by looking at the t statistics for the factor loadings for each factor. Discriminant validity (or external validity) is obtained if the estimated intercorrelations are not excessively high (e.g., <0.90 in absolute value) [41,71]. These results suggest that our measurement model shows reliability, convergence validity, and discriminant validity for all the resilience dimensions.
There are several fit indices in CFA. Chi-square describes discrepancy between the observed and estimated models. Although we report the chi-square statistic as a matter of convention, the metric is very susceptible to the sample size and the distributions of the observed indicators. Thus, it is no longer considered a determining goodness-of-fit statistic [71]. The initial model (shown in Figure 2a) is re-estimated using the modification indices. We are not unsatisfied with the fit indices of the modified model even though CFI values greater than 0.90 and RMSEA values less than 0.09 are suggestive of good fit [72,73]. We argue that the “rules of thumb” cut-off values are too restrictive. The criteria are derived from simulation studies, which assume that samples are drawn from a large population of individuals, while our sample is from a finite geographic domain. In fact, after modifying the initial model, RMSEA decreased by 30.4% from 0.224−0.156, and CFI increased by 33.8% from 0.582−0.808. Notice that our purpose here is to test for statistical significance of each factor loading and to understand the covariance structure among the resilience factors. Suppose a typical linear regression analysis with a low R-squared. Even though the overall fit is not very satisfactory, the regression equation is still valid if the purpose of the analysis is to test the causal effects of some independent variables of interest. We support the notion by Reise et al. [74] that “no CFA model should be accepted or rejected on statistical grounds alone; theory, judgement, and persuasive argument should play a key role in defending the adequacy of any estimated CFA model”. The results from the confirmatory factor analysis for the initial and modified model are presented in Table 5 and Table 6.
Table 5. CFA results (initial model).
FactorIndicatorUnstandardizedStandardized
Coef.S.E.pCoef.S.E.p
Biophysical resilienceSLOPE1 (constrained)0.9280.0240.000
ELEVATION16.4310.9510.0000.9880.0220.000
WATERLAND−0.3180.0900.000−0.3120.0820.000
LOWLAND−0.5430.2900.061−0.1680.0890.059
INTENSITY−1.6110.4960.001−0.2860.0830.001
Built-environment resilienceRESIDENTIAL1 (constrained)0.8680.0320.000
INDUSTRIAL0.0350.0380.3510.0890.0950.350
COMMERCIAL0.2490.0330.0000.6090.0630.000
DENSITY0.8200.0660.0000.9080.0290.000
DILAPIDATED−0.2970.1180.012−0.2490.0930.007
FACILITIES0.0090.0030.0070.2500.0890.005
Socioeconomic resiliencePOPULATION1 (constrained)0.6000.0690.000
FIR0.0650.0140.0000.4650.0800.000
TAXREVENUE0.9490.2190.0000.4180.0840.000
ACTIVELABOR0.0420.0060.0000.9850.0200.000
ELDERLY−0.0480.0070.000−0.9070.0220.000
Factor Covariance
cov(Biophysical,Built-environment)−31.2776.6070.000−0.5920.0730.000
cov(Biophysical,Socioecononomic)−344.44482.0670.000−0.5830.0630.000
cov(Built-environment,Socioeconomic)1098.698219.6840.0000.7750.0520.000
Modification IndicesM.I.
cov(e.RESIDENTIAL,e.DILAPIDATED)40.041
cov(e.RESIDENTIAL,e.ELDERLY)28.798
cov(e.INDUSTRIAL,e.FACILITIES)38.713
cov(e.DILAPIDATED,e.ELDERLY)66.021
cov(e.POPULATION,e.TAXREVENUE)38.567
cov(e.FIR,e.TAXREVENUE)65.652
χ2 = 739.40 (df = 101, p = 0.000); RMSEA = 0.224; CFI = 0.582.
Table 6. CFA results (modified model).
FactorIndicatorUnstandardizedStandardizedC.R.
Coef.S.E.pCoef.S.E.p
Biophysical resilienceSLOPE1 (constrained)0.9340.0230.0000.708
ELEVATION16.2170.9340.0000.9810.0220.000
WATERLAND−0.3130.0900.000−0.3090.0830.000
LOWLAND−0.5550.2880.054−0.1730.0890.052
INTENSITY−1.5870.4970.001−0.2830.0840.001
Built-environment resilienceRESIDENTIAL1 (constrained)0.8600.0330.0000.779
INDUSTRIAL0.0540.0380.1620.1290.0910.158
COMMERCIAL0.2450.0350.0000.5730.0630.000
DENSITY0.8440.0660.0000.8930.0240.000
DILAPIDATED−0.6340.1360.000−0.4800.0700.000
FACILITIES0.0100.0030.0040.2560.0860.003
Socioeconomic resiliencePOPULATION1 (constrained)0.5700.0620.0000.813
FIR0.0640.0140.0000.4380.0740.000
TAXREVENUE0.9280.1720.0000.4130.0740.000
ACTIVELABOR0.0450.0060.0000.9990.0110.000
ELDERLY−0.0490.0070.000−0.8920.0210.000
Factor Covariance
cov(Biophysical,Built-environment)−31.1366.1720.000−0.6130.0650.000
cov(Biophysical,Socioecononomic)−326.66176.3780.000−0.5780.0640.000
cov(Built-environment,Socioeconomic)1041.721207.1430.0000.8100.0360.000
Error Covariance
cov(e.RESIDENTIAL,e.DILAPIDATED)61.49510.2530.0000.7750.0850.000
cov(e.RESIDENTIAL,e.ELDERLY)10.6482.3690.0000.5650.1010.000
cov(e.INDUSTRIAL,e.FACILITIES)0.9510.1780.0000.5440.0630.000
cov(e.DILAPIDATED,e.ELDERLY)29.4654.3010.0000.8000.0460.000
cov(e.POPULATION,e.TAXREVENUE)17,633.2503322.9140.0000.4170.0610.000
cov(e.FIR,e.TAXREVENUE)2555.555393.7560.0000.6610.0500.000
χ2 = 388.03 (df = 95, p = 0.000); RMSEA = 0.156; CFI = 0.808.

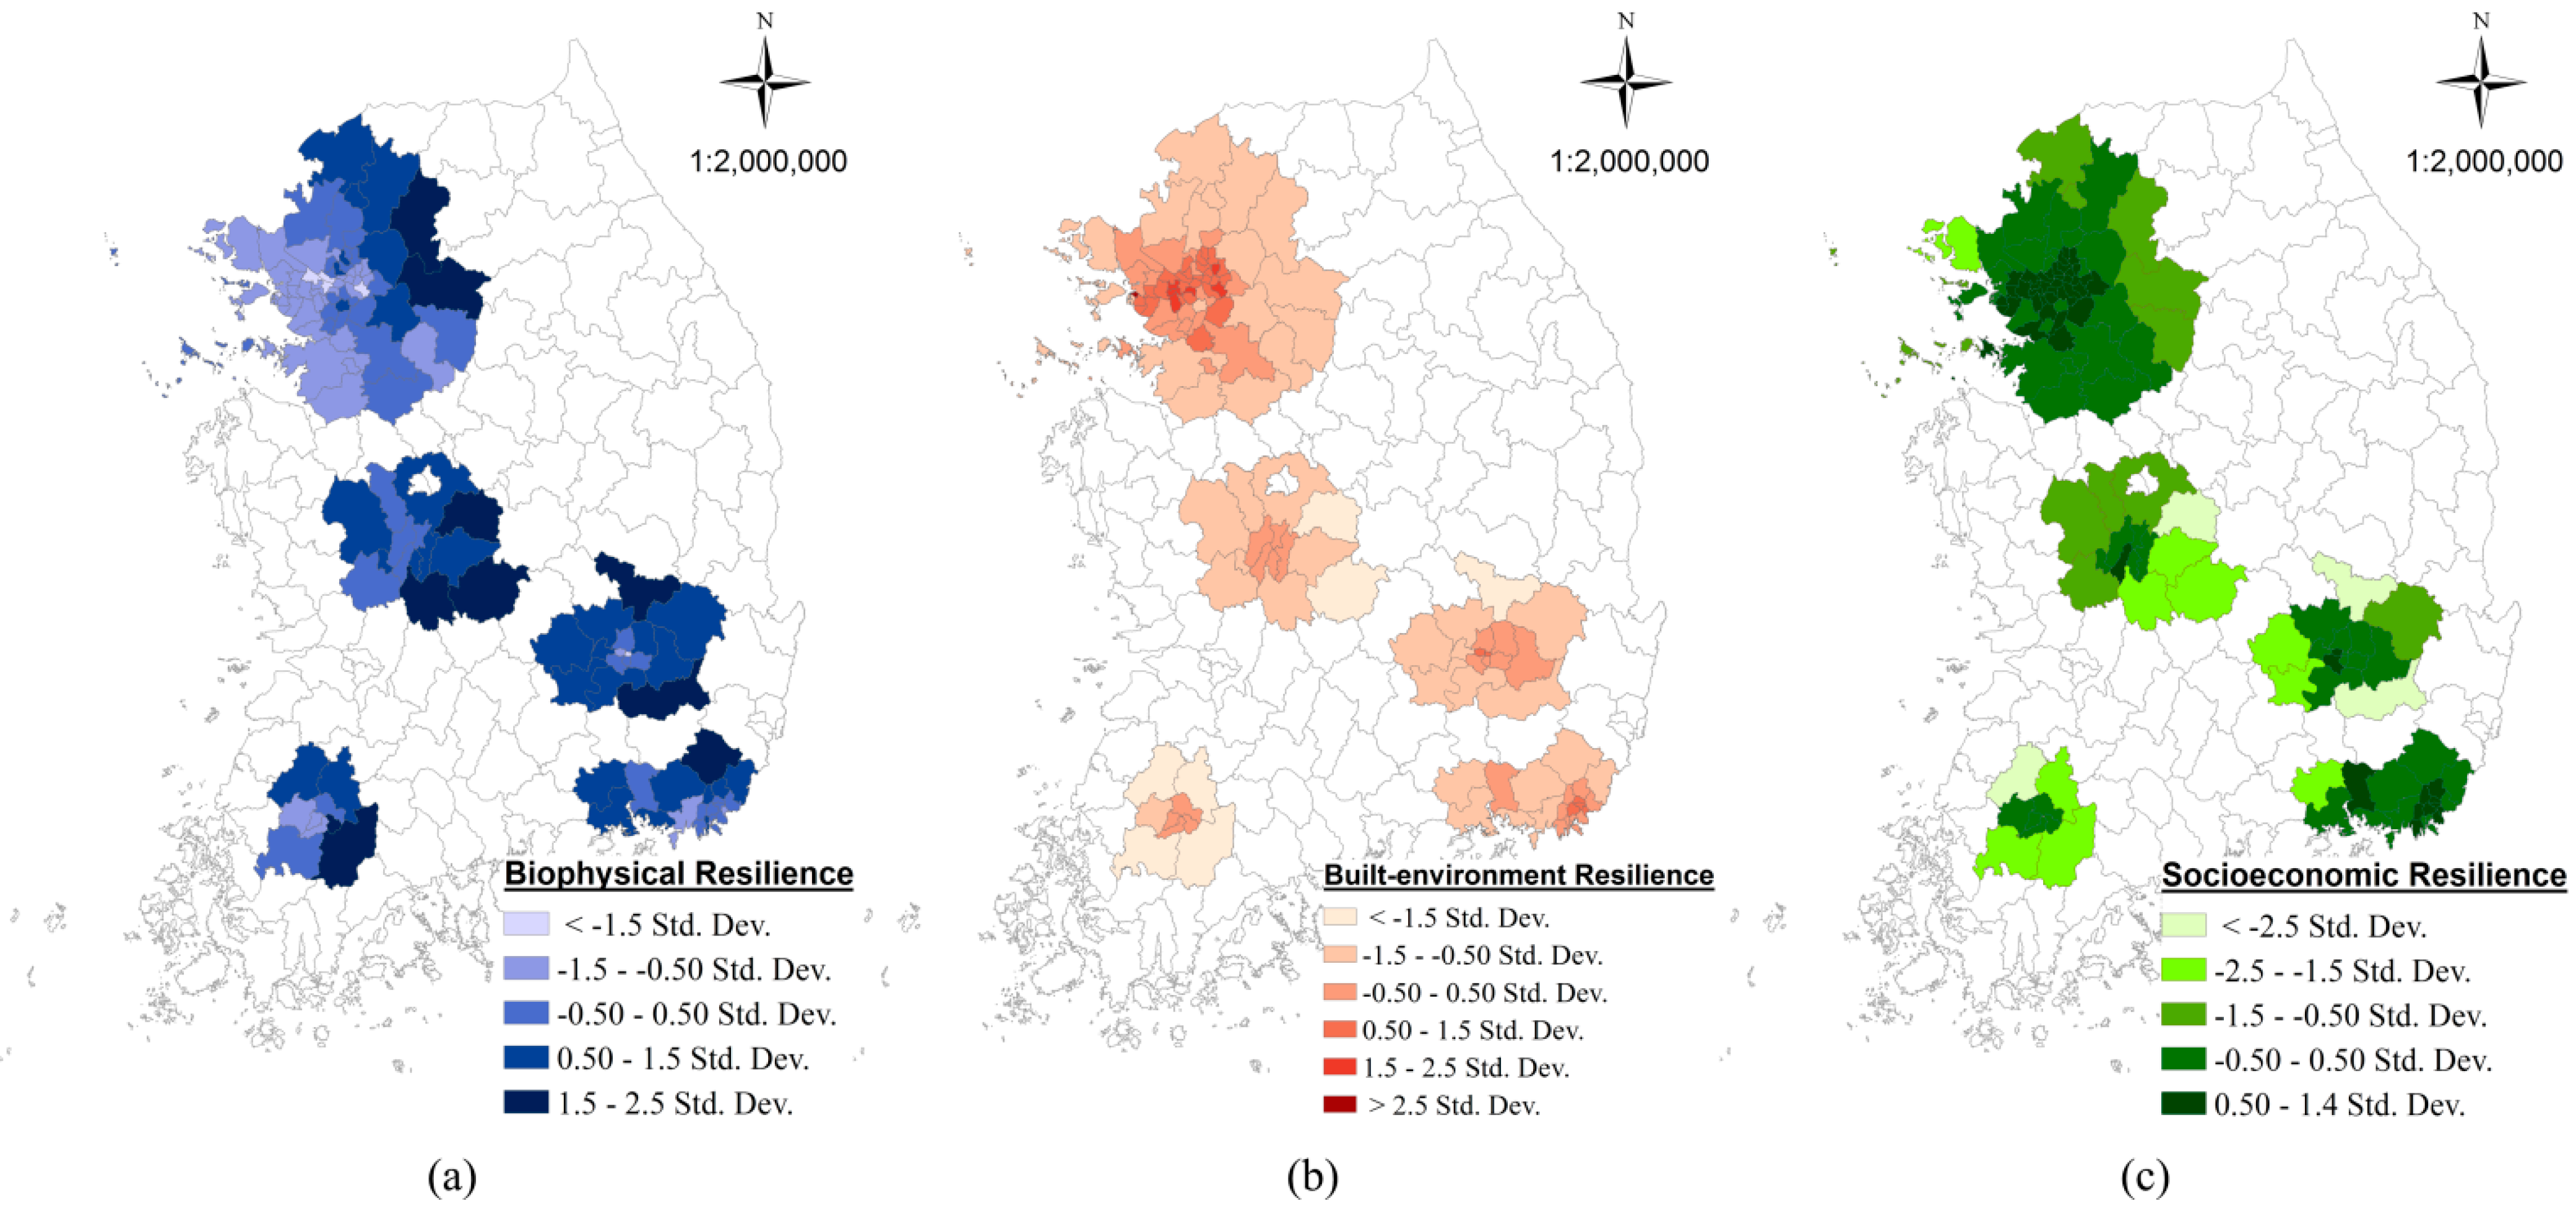
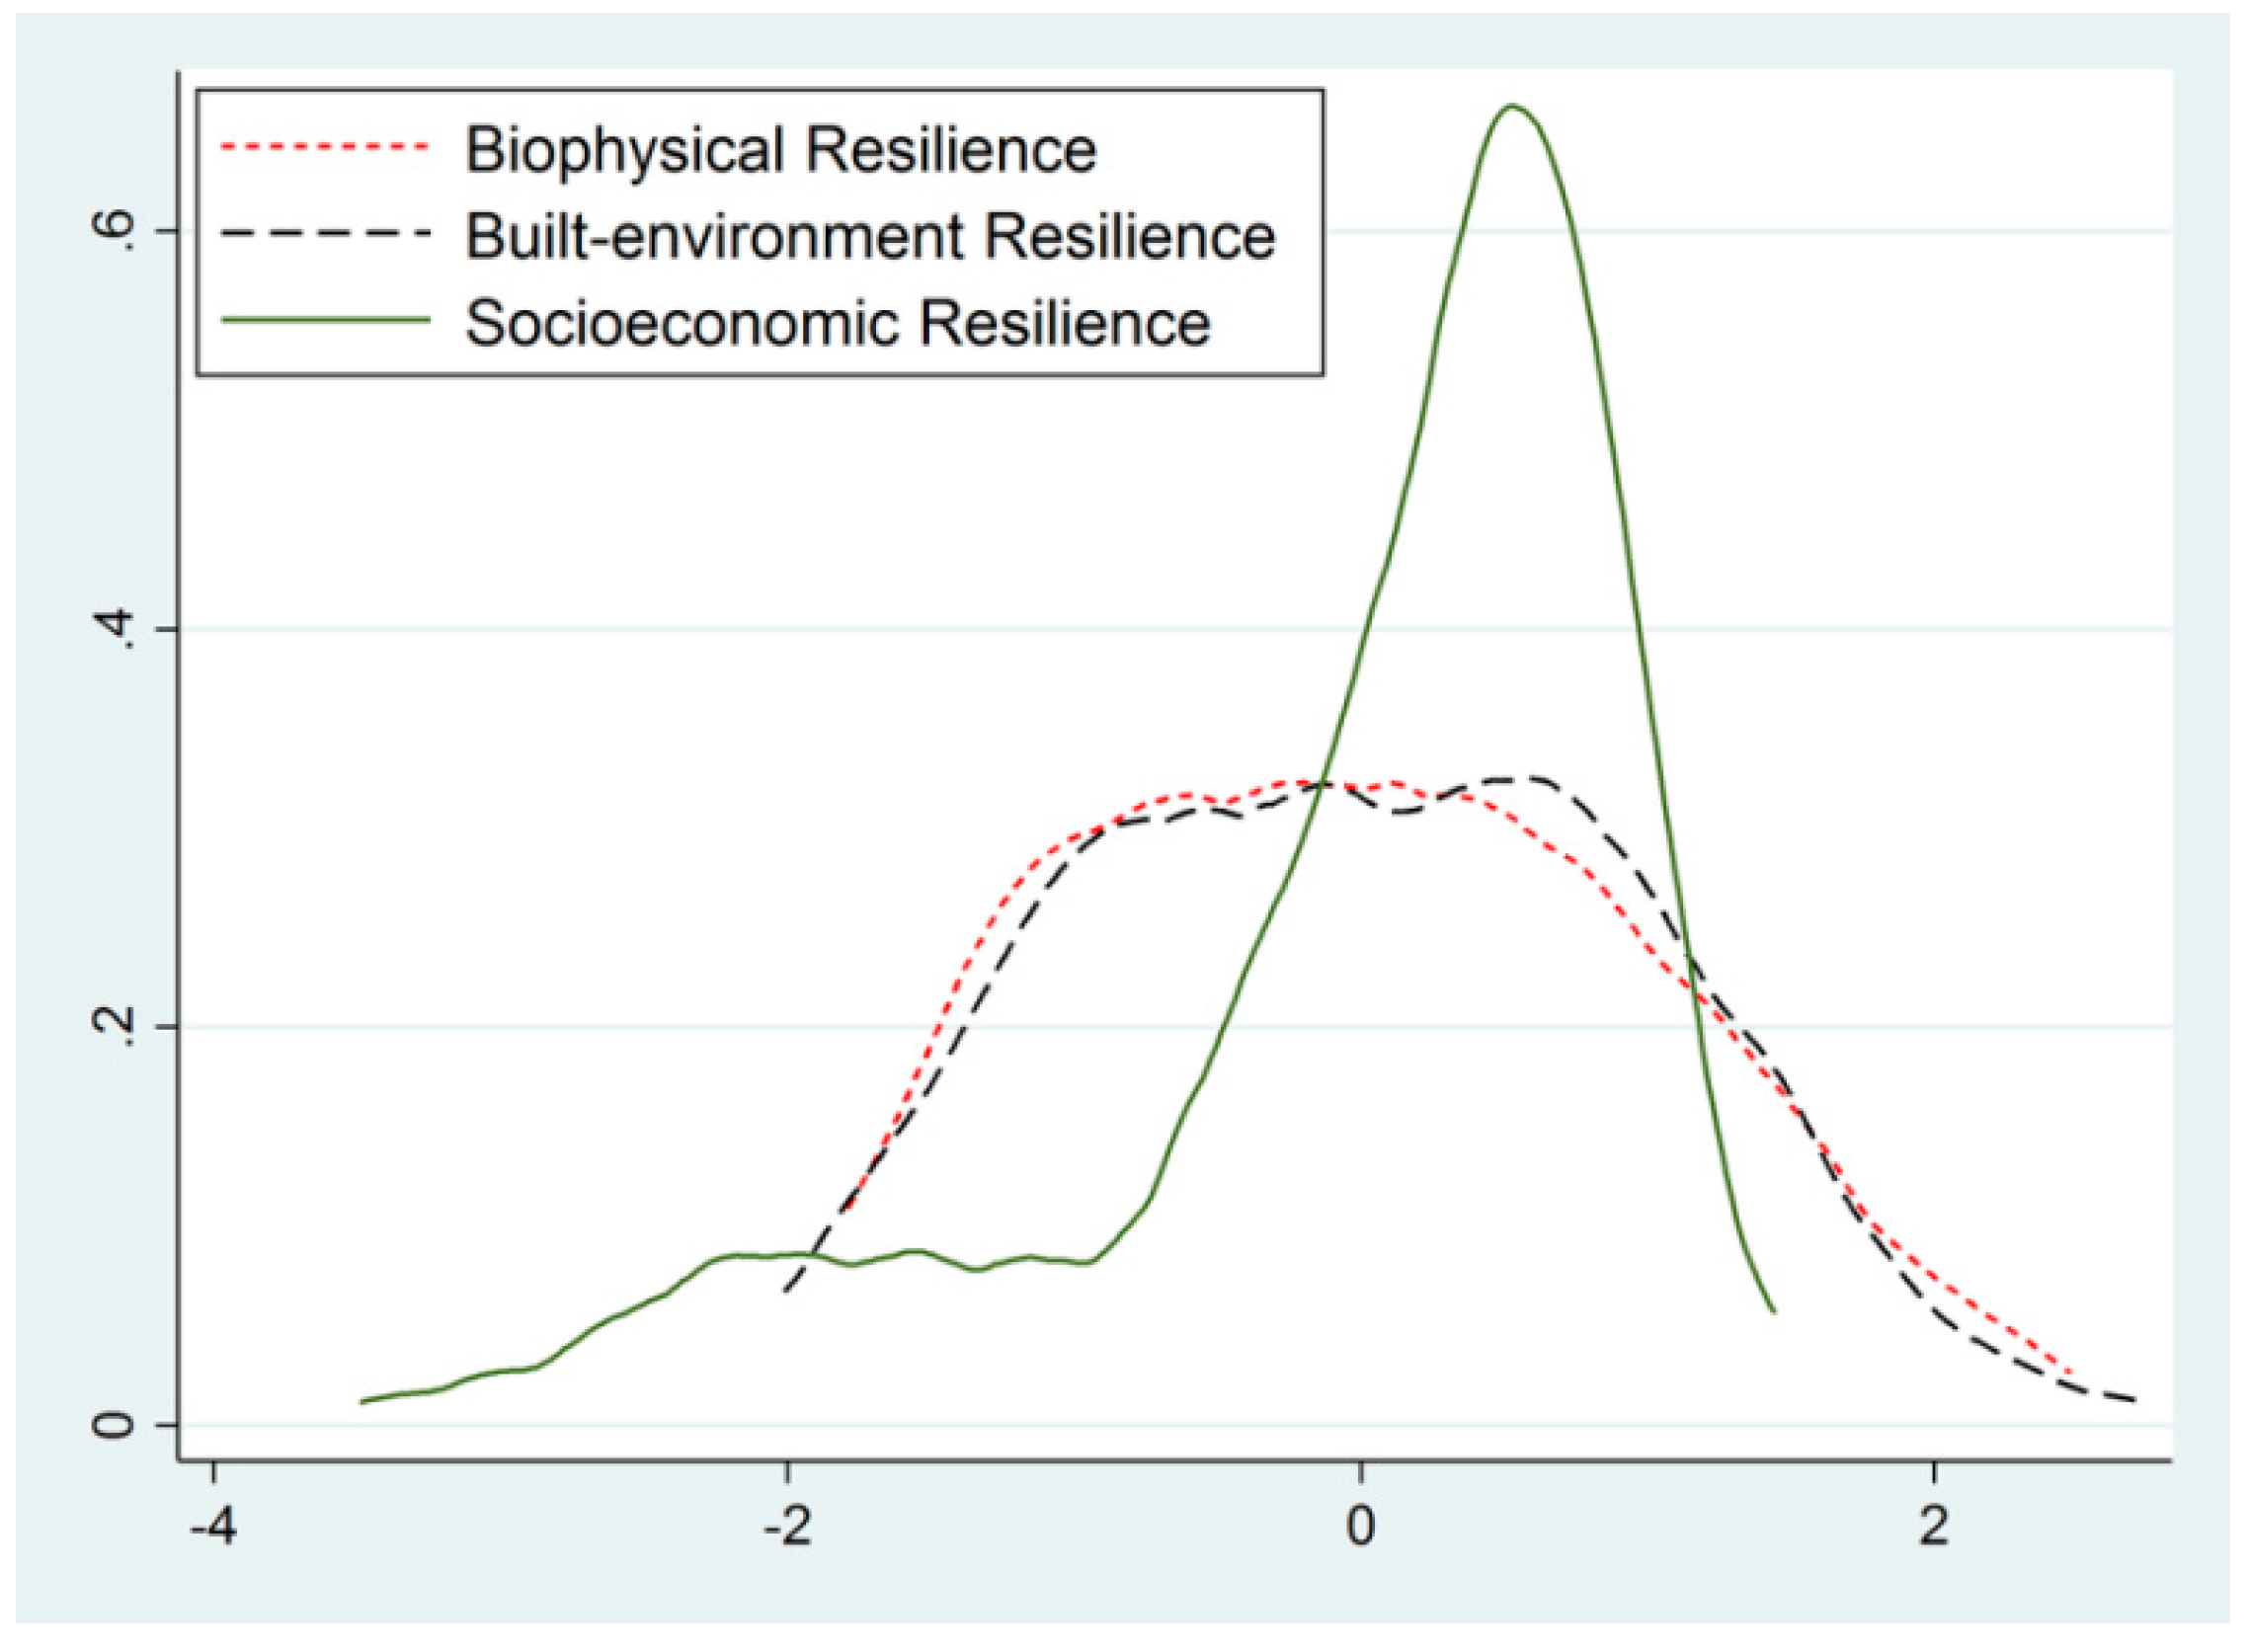
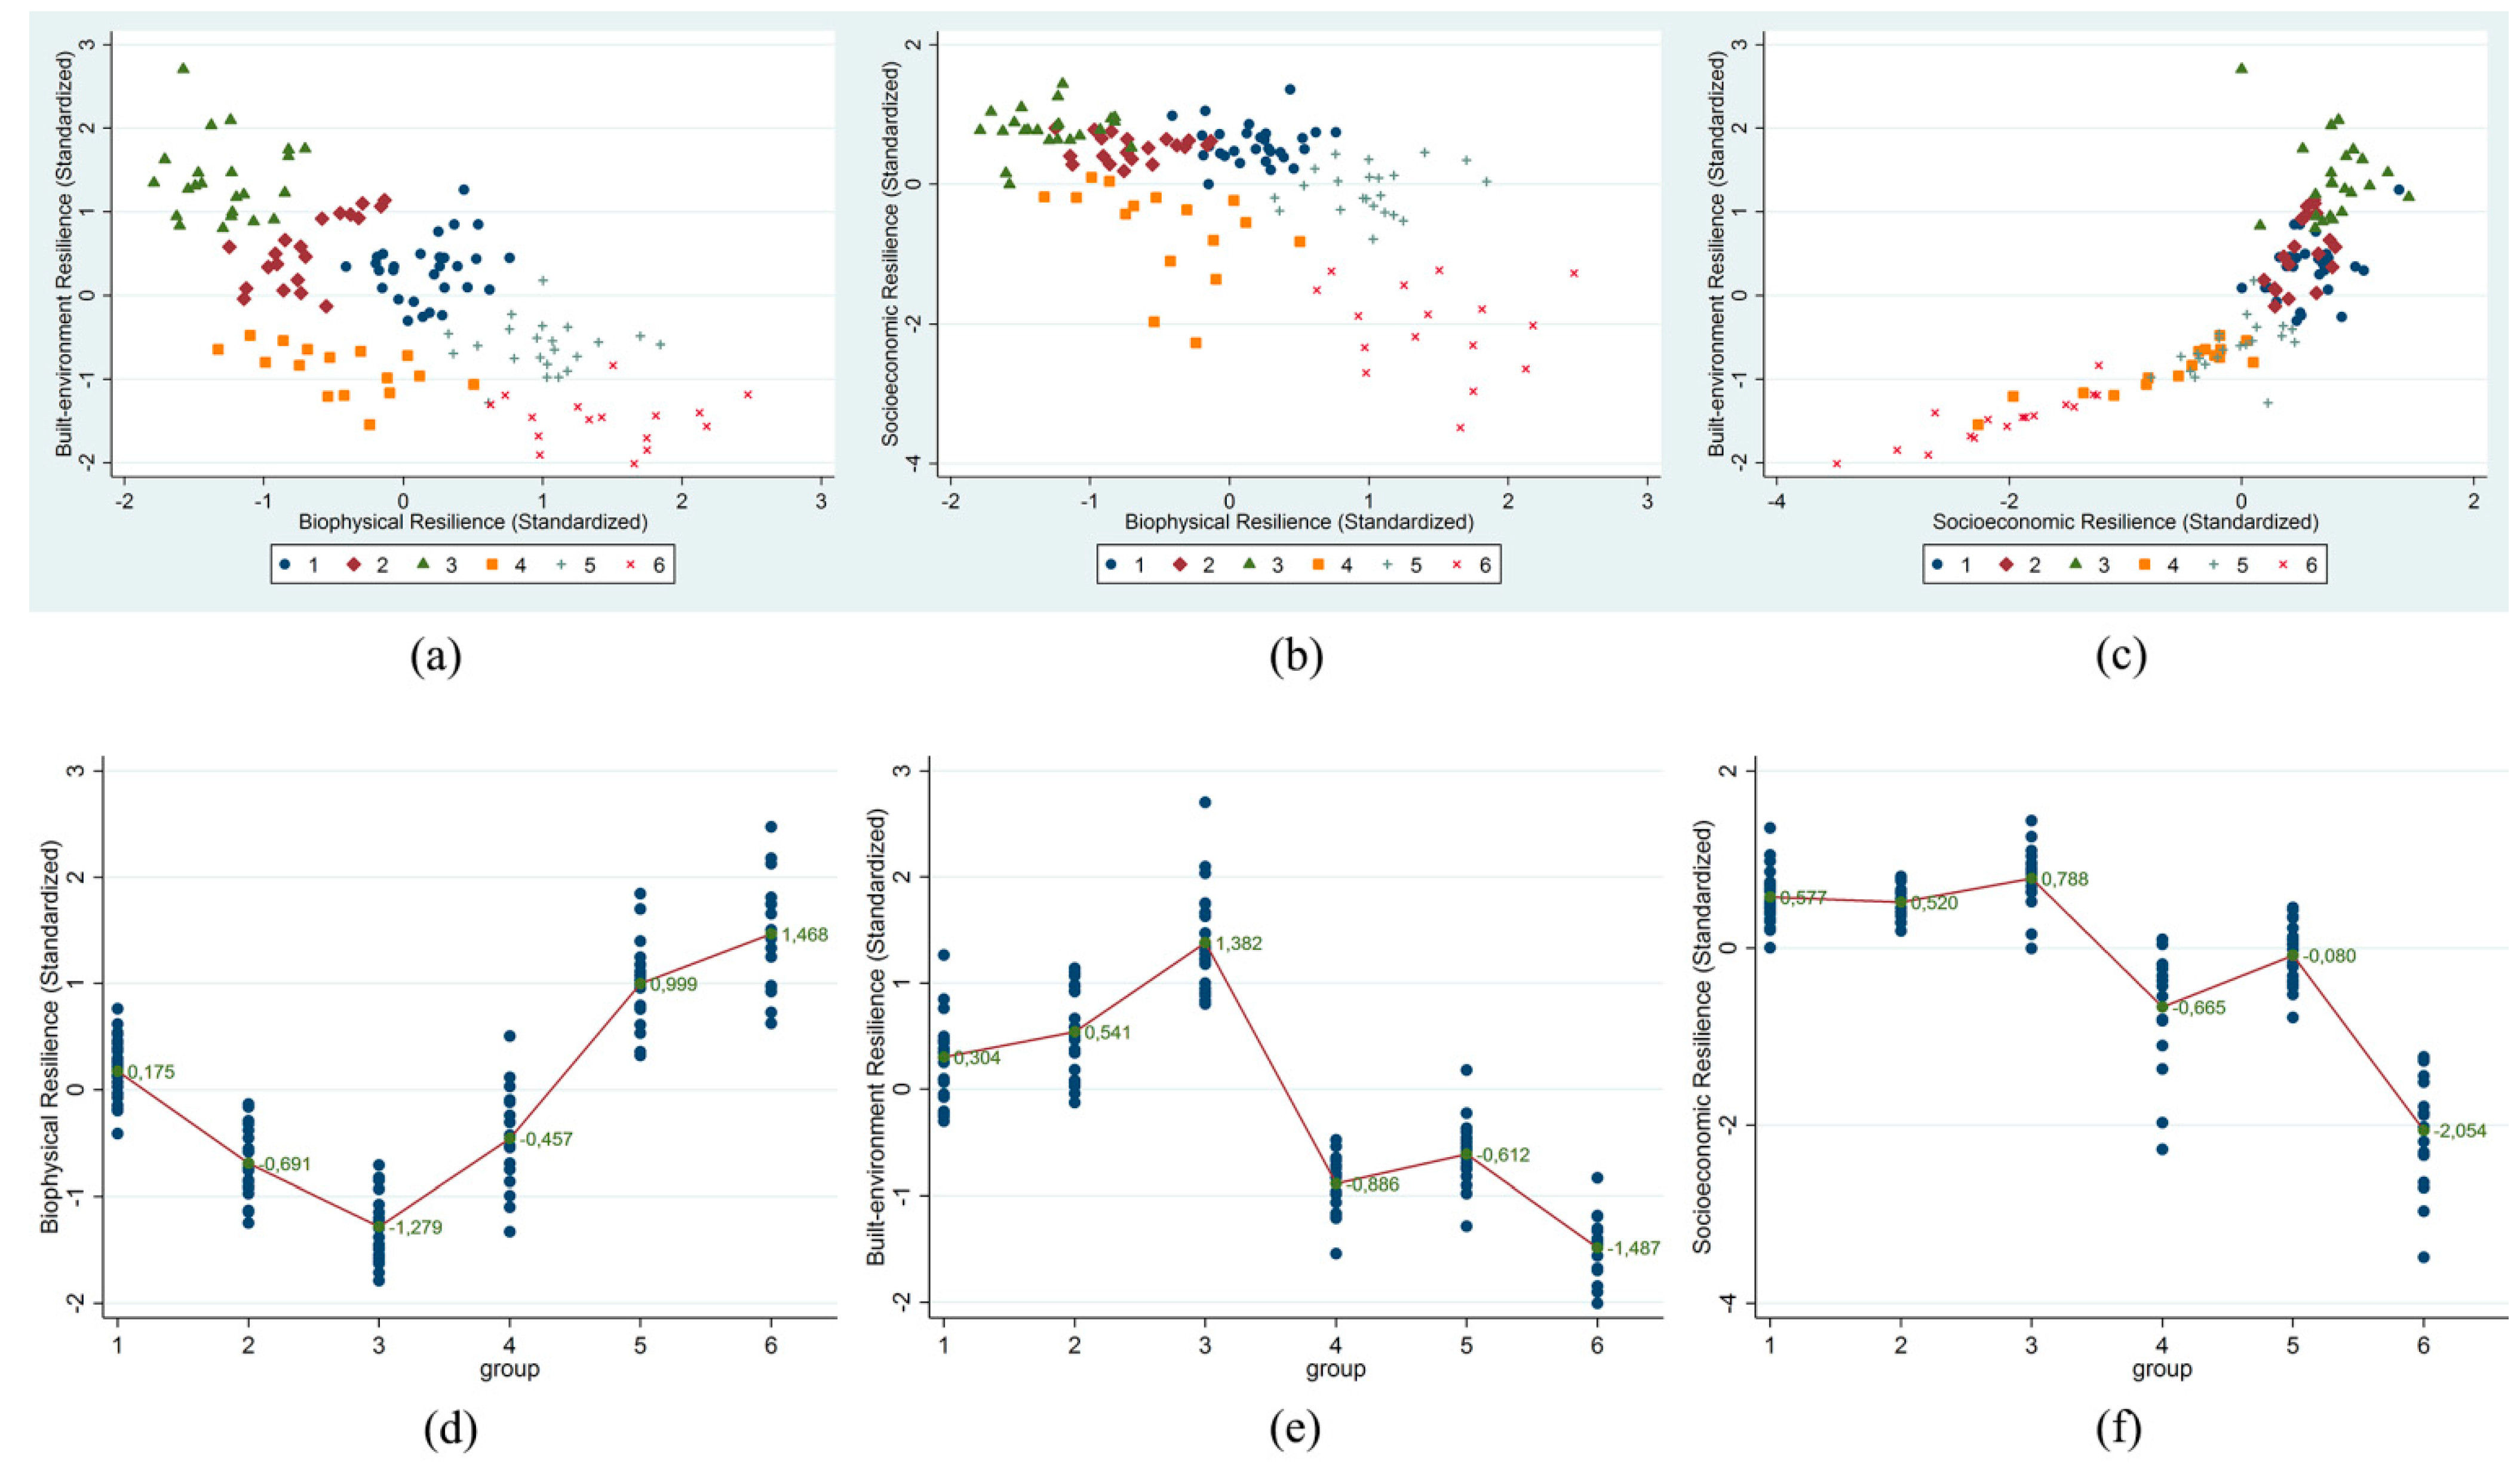
4.2. Dimensions of Resilience to Natural Hazards

All the factor loadings (except for LOWLAND and INDUSTRIAL) are highly statistically significant at the 5% level. The signs of the effects are also as expected. One exception is the one of the industrial land use. However, the coefficient is not statistically significant so that we cannot conclude whether the effect is actually positive or not. In theory, while slope and elevation in tandem probably enhance resilience to tsunamis, they probably decrease resilience to landslides and mudslides. Our biophysical resilience is mostly relevant to hydrological disasters. The positive signs for SLOPE and ELEVATION reflect the reality that low-lying areas are more susceptible to floods and typhoon rainfall. The slope and elevation are the elements of natural infrastructure to coping with negative natural (hydrological, in particular) events in the metropolitan urban areas in South Korea.
Water areas and lowland areas exacerbate the impact of hazards within and beyond the localities. A high level of daily precipitation intensity would weaken the biophysical resilience. The residential and commercial land use provides the “urbanness” of a place to increase the adaptive capacity whereas a high level of old housing stock adds to the vulnerability. The economic and financial resources should be promptly mobilized to mitigate the impact of natural hazards and disasters. Local governments also have to pay more attention to the frail populations who are susceptible to undesirable natural events.
The mapping of each resilience dimension clearly addresses the spatial variability in each resilience dimension (Figure 3). With regard to each metropolitan area, biophysically-resilient localities tend to be located in urban periphery, coinciding with a lower level of urban development and economic resources. In contrast, local governments in urban core have the advantage over the ones in urban fringe with respect to urban infrastructure and the socioeconomic system.
Figure 3. Clustering local governments and mapping resilience: (a) Biophysical resilience; (b) Built-environment resilience; (c) Socioeconomic resilience.
Sustainability 07 14153 g003
The error covariances from the modification indices are also statistically significant and have proper signs. In our study area, local governments with a high level of residential land use tend to have more old housing units and more elderly people. Furthermore, elderly populations typically live in old housing. The industrial jurisdictions tend to be more sensible to utilize the preventive installations. Tax revenue rises with population, and a high level of local public financial and budgetary independence against the central government corresponds to the ability to raise more tax revenues.
The kernel density estimates for the standardized factor scores are plotted in Figure 4. As opposed to the biophysical and the built-environment resilience that are centered at zero and quite evenly distributed, the socioeconomic resilience is skewed to the left, and a large portion of local governments falls into the negative side. This distributional pattern suggests that the existence of inequality should be recognized with a higher priority in natural disaster management.
Figure 4. Kernel density estimates of the standardized resilience scores.
Sustainability 07 14153 g004

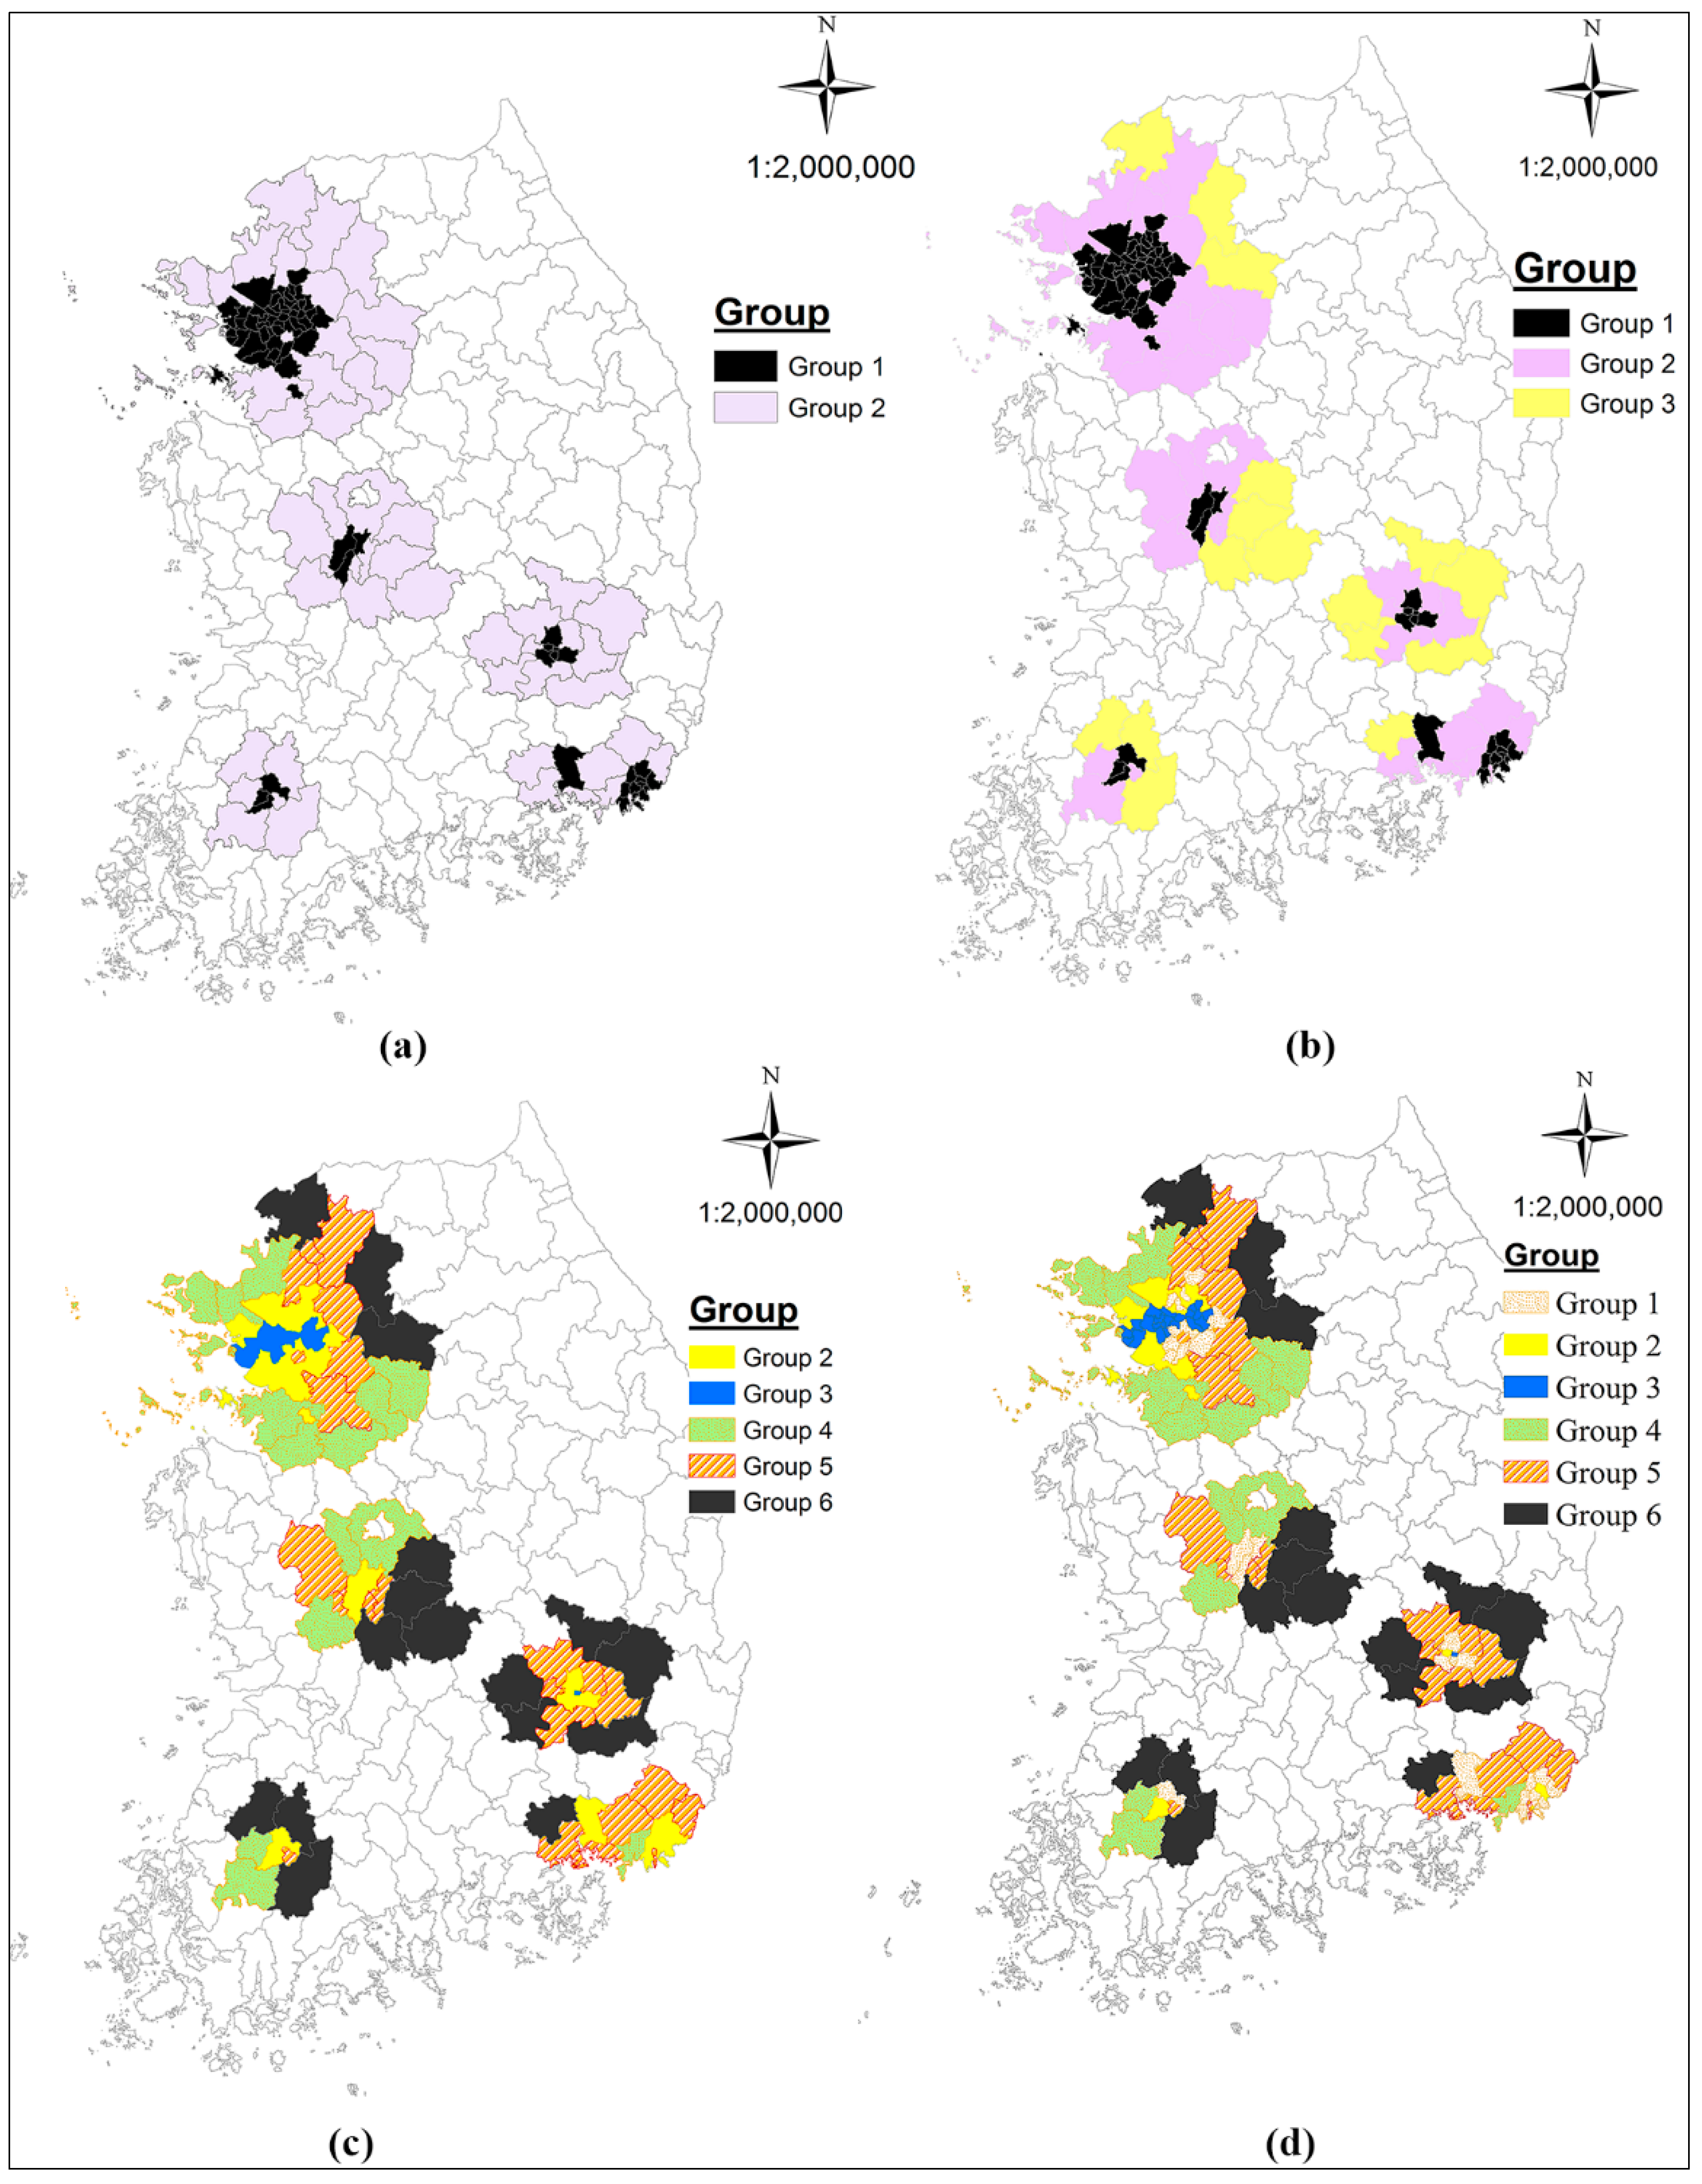
4.3. Clusters of Local Governments

4.3.1. Determining the Optimal Number of Clusters

We calculated the 26 validity indices for the optimal number of clusters for the six linkage criteria (Table 7). For the Ward’s method, six indices out of the 26 indices proposed two as the best number of clusters, and five indices proposed five as the best number of clusters. Except for the centroid linkage (in which seven indices proposed seven as the best number of clusters), the validity analysis tends to propose two or three as the best number of clusters. The next optimal solution seems to be five from the Ward’s and the average linkages.
Table 7. Optimal number of clusters by validity criteria and linkage methods.
CriteriaWard’sCompleteSingleAverageMedianCentroid
KL756247
CH5514227
Hartigan5513533
CCC1515213117
Scott33145107
Marriot43145107
Trcovw3314344
Tracew3314544
Friedman1031413107
Rubin551413107
C-index1125229
DB572933
Silhouette222222
Duda222222
Pseudot2222222
Beale222222
Ratkowsky2214222
Ball333333
Ptbiserial3314333
Frey1121NA6
McClain232222
Dunn15921346
Hubert000000
SD-index575733
Dindex000000
SDbw151415151515
Results6 proposed 2.8 proposed 3.9 proposed 2.9 proposed 2.8 proposed 2.7 proposed 7.
5 proposed 5.6 proposed 2.9 proposed 14.4 proposed 5.5 proposed 3.6 proposed 2.
“X proposed Y.” means that X validity indices among the 26 criteria proposed Y as the best number of clusters.
We inspected the dendrograms from the Ward’s, complete, average, and median linkages to observe how the two-cluster and five-cluster solutions are formed. The dendrograms from the Ward’s and the average linkages are presented in Figure 5. Except for the Ward’s linkage (Figure 5a), all the other methods did not produce contextually acceptable solutions: they produced clusters that contain very small number of observations at the relatively early stages of clustering. For example, the average linkage created only one observation (Dong-gu in Incheon metropolitan city) as the sub-cluster at the fourth round of grouping. Similarly, it created only one observation (Gwanak in Seoul metropolitan city) as the sub-cluster at the fifth round of grouping. This behavior that produces the very small number of observations as the sub-clusters happened throughout the linkage methods from the top to the bottom, with an exception of the Ward’s. Consequently, we opt for the Ward’s as the linkage criterion.
Figure 5. Dendrograms (n = 2 in green; n = 5 in blue; n = 6 in red): (a) Ward’s linkage; (b) Average linkage.
Sustainability 07 14153 g005
The two-cluster, three-cluster, and five-cluster solutions are mapped onto the study area (Figure 6a,b,c). The two-cluster solution identifies (1) the high-density core areas, and (2) the surrounding areas. The three-cluster solution divides the surrounding areas into (1) localities adjacent to the core areas, and (2) the remaining peripheral territories. However, we were not comfortable with the result that all the localities in Seoul form a single cluster. There exists a significant level of intra-urban variation in Seoul, a megacity with a population of 10 million people. Turning to the five-cluster solution, the Seoul Metropolitan Region is divided into the five distinct areas, which better reflects the reality of spatial heterogeneity in population and job density. In addition, we again divided the core areas (Group 2 in the five-cluster solution in Figure 6c) into the two sub-clusters in order to accommodate the spatial heterogeneity in the city of Busan, the second largest metropolitan city in South Korea. Finally, we determine six as the best number of clusters from the statistical and contextual perspectives.
Figure 6. Clusters of local governments: (a) n = 2; (b) n = 3; (c) n = 5; (d) n = 6.
Sustainability 07 14153 g006

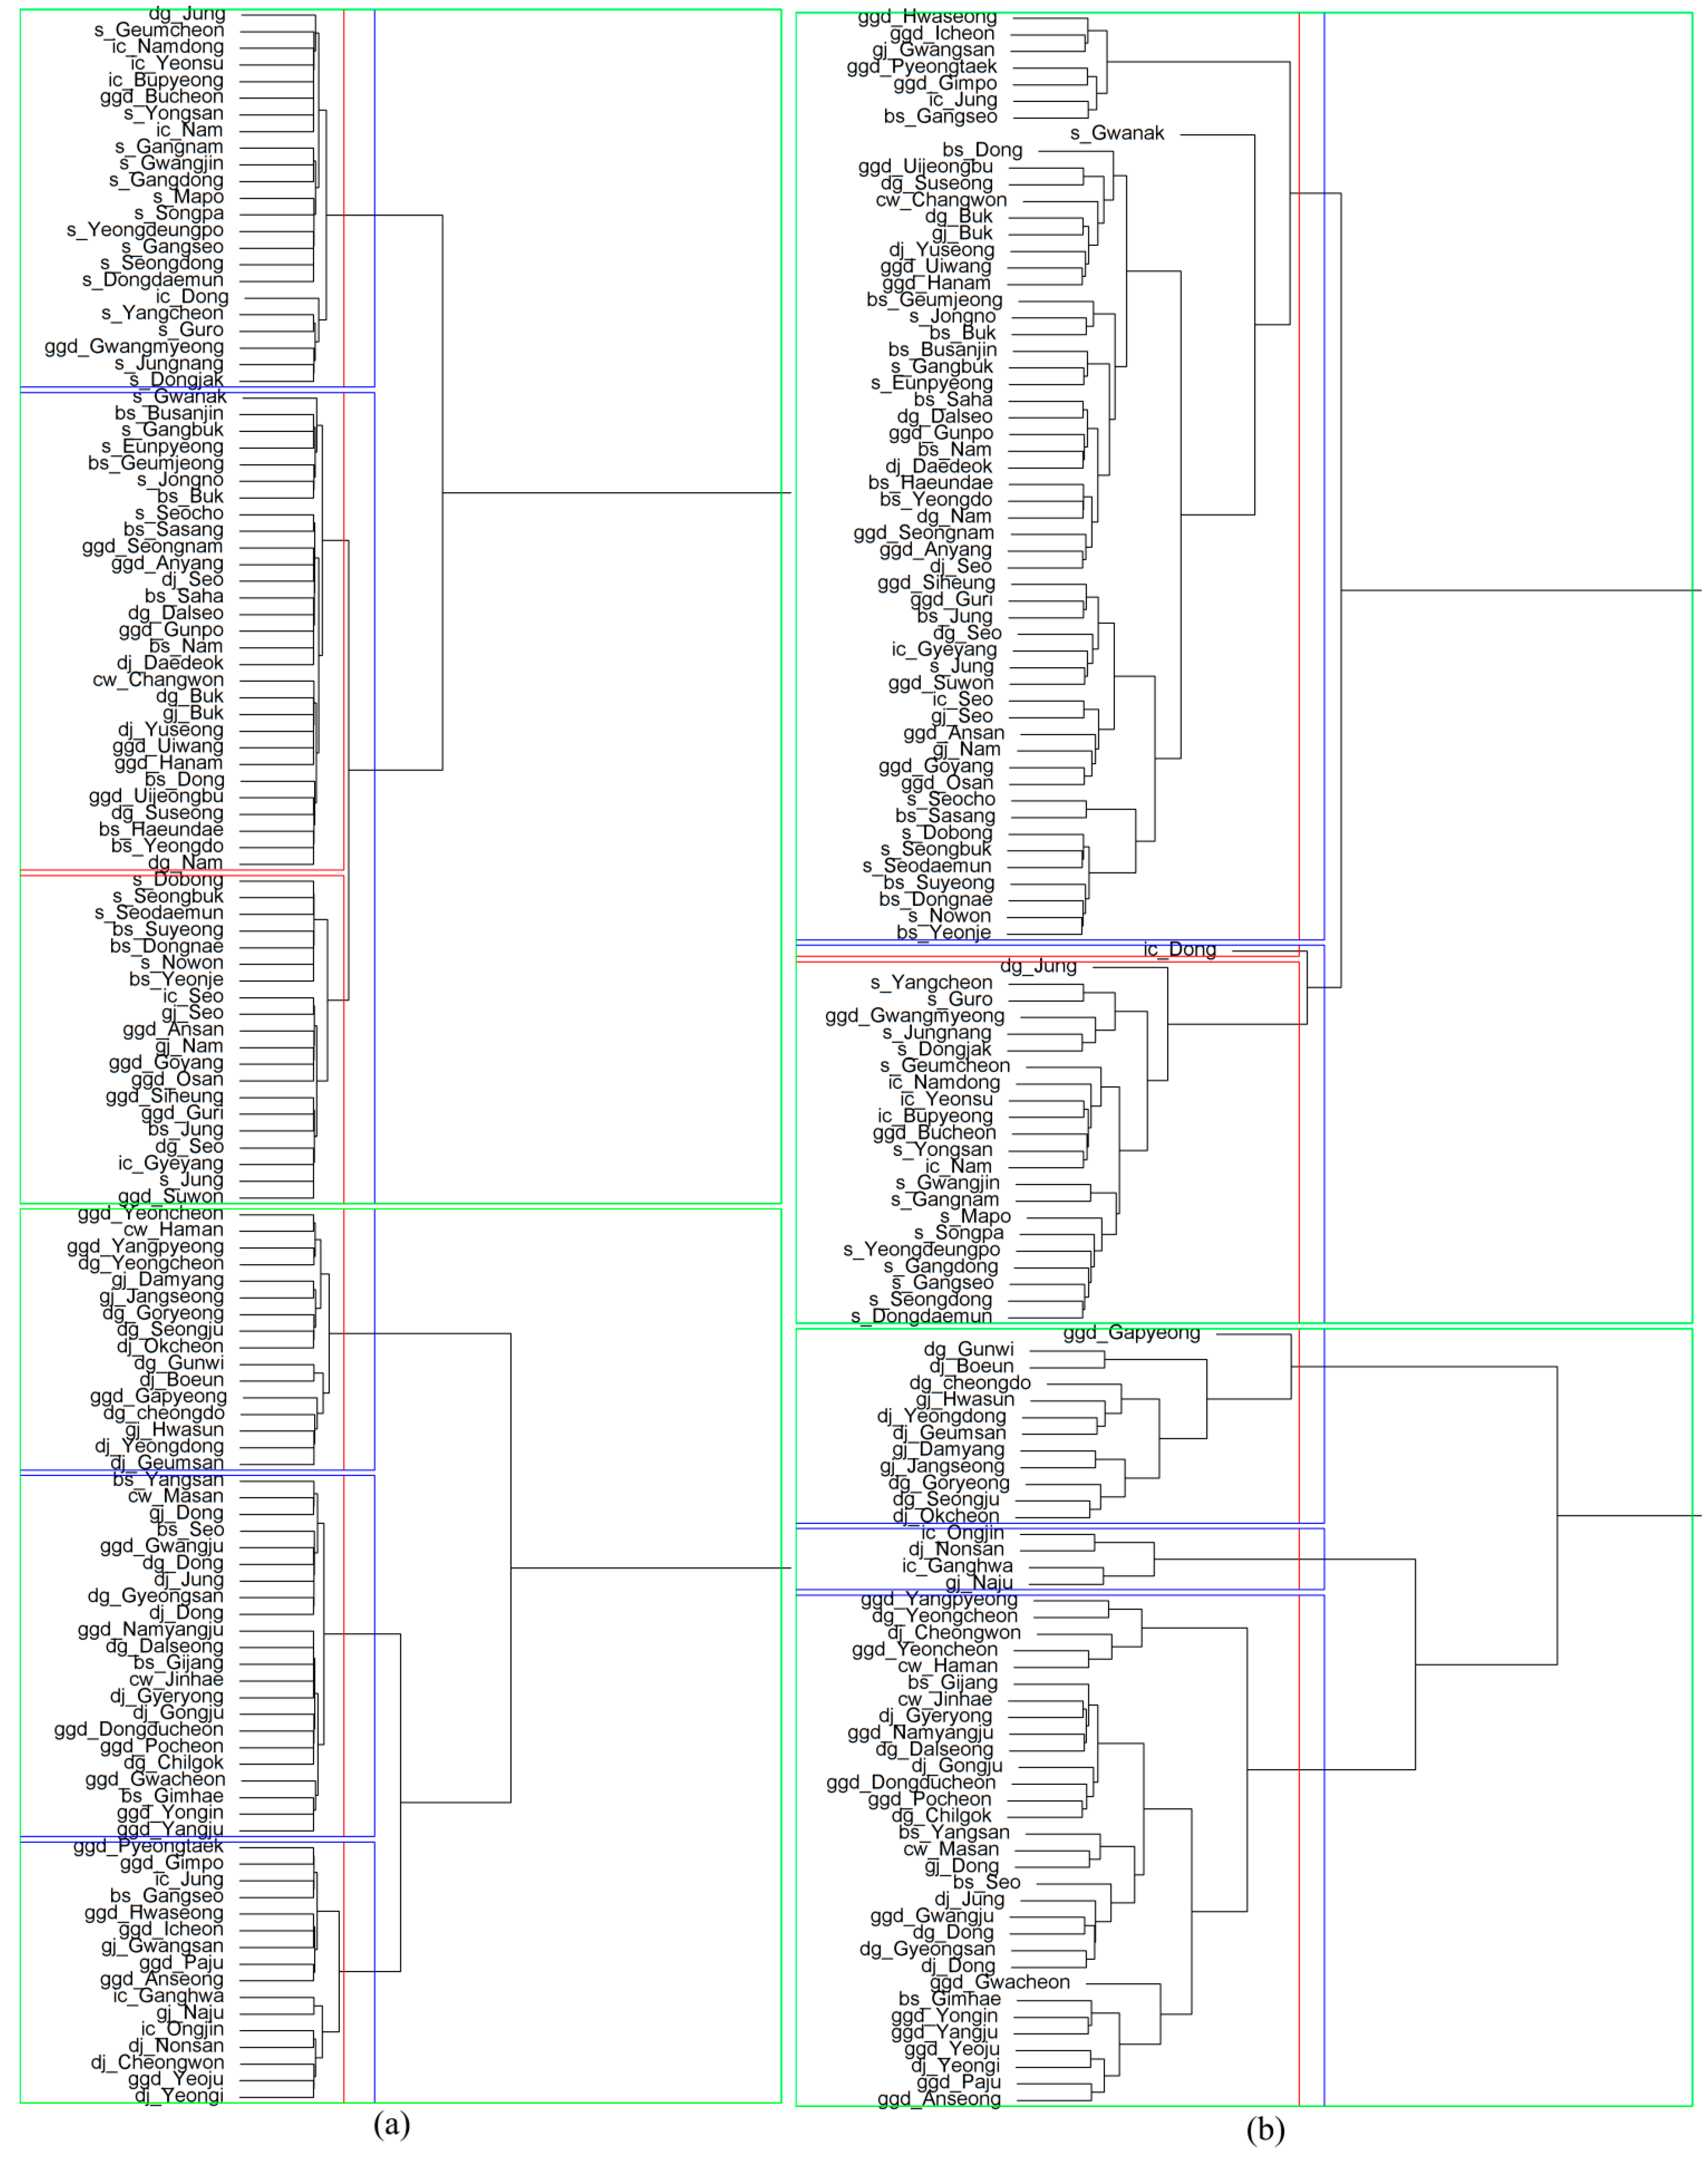
4.3.2. Interpreting the Clusters of Local Governments

The six heterogeneous clusters of local governments are mapped throughout the study area (Figure 6d). Clearly, the clusters are not binding to the particular metropolitan areas: some local governments from different metropolitan areas are classified into the same group. As for the Seoul metropolitan area, which consists of 25 local jurisdictions, five local governments fall into the first group (Group 1), another five into the second (Group 2), and the other 10 into the third (Group 3). A quick look into the spatial pattern of the clusters suggests that Group 3 comprises the geographically contiguous local governments in the Capital Region (except the one that is covering the downtown area of Daegu) that are economically viable but biophysically vulnerable to natural hazards. On the other hand, localities in Group 6 retain a high level of natural infrastructure, having fallen behind in urban and economic development.
We analyze this discrepancy in depth through (multivariate) analysis of variance for the resilience dimensions (Table 8 and Table 9). The ANOVA table shows that the mean differentials for the clusters are statistically significant for each resilience dimension at the 1% level. Our classification of local governments alone explains 86.3% of the total variation in the biophysical dimension (87.0% for the built-environment, and 83.3% for the socioeconomic). Furthermore, MANOVA attests the difference in two or three vectors of mean values of the resilience scores.
Table 8. ANOVA.
Table 8. ANOVA.
FactorPartial SSdfMSFpR-squaredAdj R-squared
Biophysical107.834521.567150.7700.0000.8630.857
Built-environment108.681521.736159.8400.0000.8700.864
Socioeconomic104.090520.818119.4700.0000.8330.826
Table 9. MANOVA.
Table 9. MANOVA.
FactorWilks’ Lambda aFp
Biophysical & Built-environment0.0346104.120.000
Biophysical & Socioeconomic0.0353102.940.000
Built-environment & Socioeconomic0.056076.790.000
Biophysical, Built-environment, & Socioeconomic0.014678.900.000
a: The other test statistics, such as Lawley-Hotelling trace, Pillai’s trace, and Roy’s largest root, are not reported here. All the statistics are large enough to reject the null hypothesis (p < 0.000).
The scatter plots for each pair of the standardized resilience scores address the negative correlations between the biophysical and the built-environment; and between the biophysical and the socioeconomic resilience (Figure 7a,b). Group 1 and Group 2 tend to reside in the middle in the three graphs, while two extremes are Group 3 and Group 6. The mean values of the resilience dimensions clearly indicate the distinguishable nature of the clusters (Figure 7d–f). In particular, the mean value of the biophysical resilience for Group 6 is positive and highest, while the built-environment and the socioeconomic resilience values for Group 6 are the lowest. This pattern is reversed for Group 3. Note that the scatter plots with the biophysical factor perform better in demonstrating the clusters distinctively, suggesting that considering biophysical dimension should be an imperative in deriving geospatial variability in the mitigation capacity even though turning to the notion of social ecology and political economy seems to gain momentum in recent natural hazards studies.
Figure 7. Scatter plots and mean plots for the resilience dimensions: (a) Scatter plot for biophysical vs. built-environment; (b) Scatter plot for biophysical vs. socioeconomic; (c) Scatter plot for socioeconomic vs. built-environment; (d) Mean plot for biophysical; (e) Mean plot for built-environment; (f) Mean plot for socioeconomic.
Sustainability 07 14153 g007
We derive descriptive characteristics of each cluster of local governments by inspecting the mean values of representative indicators (Table 10). The first group (Group 1) of local governments can be characterized as economically active with relatively modern urban development and a moderate level of elevated land and budgetary resources. This group includes one of the downtown districts of Seoul, that is Jongno, a portion of local governments in Busan, some localities in Gyeonggi that are adjacent to Seoul, and some parts of Daegu and Daejeon.
Table 10. Mean values of selected indicators for clusters of local governments.
IndicatorGroup 1Group 2Group 3Group 4Group 5Group 6
SLOPE11.3316.5823.5517.40515.30116.915
ELEVATION119.07958.55832.10768.484185.588229.918
RESIDENTIAL17.78324.18331.4274.9706.2371.971
DENSITY19.83020.01424.7353.6138.8262.096
DILAPIDATED17.48817.58518.39022.18219.58636.905
FIR34.11438.59044.43037.63832.75018.281
TAXREVENUE297.648306.399381.370238.763226.58550.531
ACTIVELABOR74.76374.43075.86968.03471.18860.583
ELDERLY10.0439.8269.62915.27211.57926.912
The second group (Group 2) of local governments is located on relatively flat land. Its residential density is high (20,014 people/km2), and houses are not very old. This group enjoys a satisfactory level of flexibility in local public finance (FIR = 38.59%) and a high level of tax revenues on average (306.4 million dollars). The group includes some parts of Seoul and Gyeonggi that are relatively close to the center of Seoul. It also contains a portion of localities in Busan, Incheon, Daegu, and Gwangju that are not far from the urban centers of the corresponding metropolitan areas.
The third group (Group 3) outstands in regard to its strong economic and financial status. Among the 25 local governments, 15 in Seoul are classified as being in this cluster. The group includes urban centers of jobs and housing in Seoul, such as Gangnam, Mapo, Songpa, and Yongsan. This group, however, is most vulnerable in terms of biophysical resilience because of the large portion of impervious surfaces (such as concrete or asphalt) and the scarcity of natural environment.
The fourth group (Group 4) does not contain any localities in Seoul and Daegu. The local governments in this group are located in the peripheral areas of each metropolitan area. The one included from Busan is Gangseo lying on the west side of Nakdong River in Busan. Residences are less dense and quite old because urban development has been limited by topographic conditions. Populations are relatively aged, and labor market activities are slowed. This group is ranked second lowest in the built-environment and the socioeconomic resilience dimensions.
The fifth group (Group 5) is also lagging in the urban and socioeconomic development, but shows a high level of biophysical resilience. In comparison with Group 4, people live closer to each other in less old houses. They are economically active and less aged. The amount of tax revenues and the degree of financial autonomy are low, relative to other local governments in Group 1 to Group 4.
Local governments in the final group (Group 6) dominantly lie in metropolitan fringe areas. Topographic constrains in tandem with the relative inability to handle financial resources to carry out urban economic development have prohibited them from obtaining the appropriate levels of built-environment and socioeconomic capacity, whereas they appear to be biophysically resilient.

5. Discussion: Implications for Sustainable Hazard Mitigation

5.1. Resilience Dimensions

We presented a confirmatory factor approach to measure the resilience dimensions. The important strength of the methodology is that CFA provides statistical tests for each factor loading, which is not addressed in PCA and summation/aggregation methods. As for the biophysical resilience, the degree of slope and elevation functions as a preventive mechanism rather than as threats in our study area. Also, the standardized estimates of the biophysical resilience dimension (presented in Table 6) clearly reveal that those two indicators are relatively important in determining the level of resilience dimension (The standardized coefficients for SLOPE and ELEVATION are 0.934 and 0.981, respectively). The next two important indicators turn out to be the percentage of river or stream areas (WATERLAND) and the daily precipitation intensity (INTENSITY). The standardized coefficients are −0.309 and −0.283, respectively, and these two indicators are negatively associated with the biophysical resilience. Finally, the percentage of land 10 meters below sea level (LOWLAND) is least important and marginally significant. These results clearly lead to the policy implications on the sustainable and smart protection and management for the natural environment. Localities (particularly, urbanized communities) should minimize construction activities that could result in the degradation of environmental capacity and quality. Also, targeted hydrological management systems should be set up to control floods and heavy precipitation events.
As for the built-environment resilience, the residential density (DENSITY) and the commercial land use (COMMERCIAL) are the most important indicators (The standardized coefficients are 0.893 and 0.573, respectively). The reason that the factor loading for INDUSTRIAL is not statistically significant seems originate from the historical context. The central government had allocated most of the industrial resources to the capital region, which causes less variation across the localities in South Korea. Indeed, South Korea has experienced a large influx of population from rural to urban areas, which triggered the inequality of residential and commercial development between city centers and peripheral areas. To enhance the built-environment resilience, South Korea should keep up with the reconstruction of jobs and housing locations in order to promote the jobs-housing balance.
Economic viability and activity is the most important factor to enhance the socioeconomic resilience. The indicator for the percentage of economically active population (ACTIVELABOR) takes the standardized coefficient of 0.999, and the percentage of populations whose ages are over 65 (ELDERLY) is the second important indicator (the standardized coefficient of −0.892). The job creation and targeted employment policies towards particular age groups could lead to the enhancement of socioeconomic resilience, which will further help local governments expand the financial resources through the larger taxation capacity.

5.2. Trade-off between Biophysical Resilience and Human Activities

One of the critical questions in this study is how much and in what direction the estimated resilience dimensions are correlated. For example, is a jurisdiction which has a high level of natural capacity more socioeconomically resilient? The confirmatory factor analysis reveals that the magnitude of the negative correlations between the biophysical resilience and the built-environment; or between the biophysical and the socioeconomic is not trivial and statistically significant (−0.613, p = 0.000 and −0.578, p = 0.000, respectively). Human and natural systems are “coupled” [75], and the biophysical resilience moves in the opposite direction to built-environment resilience or socioeconomic resilience, meaning that there is a trade-off between the natural infrastructure and the social capacity in coping with natural hazards. Urban fabric and social cohesion may increase the societal adaptive capacity. When it comes to the human–nature interaction, however, human modification of and human expansion into the environment could result in the degradation of natural capital and ecosystems.

5.3. Establishment of Flexible Governance System

From the perspective of the spatial context of the study area, we focus on the establishment of integrated and flexible governance systems in order to enhance environmental quality, to promote local resiliency and responsibility, and to eventually bridge the center-to-local and local-to-local gaps in the biophysical infrastructure, urban services, and economic resources. The notion of “governance” refers to a complex web of actors, structures, and processes for collective decision-making as well as to the framework for organizing and managing society [76,77]. Governance matters in expanding adaptive capacity to natural hazards [78], endeavors have been undertaken to integrate and coordinate approaches to flexible governance to mitigate vulnerability and enhance resilience at the local and global levels. Effective multilevel governance is critical in disaster management beyond the centralization and decentralization framework [17].
In an extensive literature review of the management of resilience to natural hazards, Djalante et al. [32] classified the concept of adaptive governance into four elements. Firstly and most importantly, the polycentric governance system implies the establishment of a variety of governing authorities across different layers of government systems. Whereas inefficiently overlapping multilevel institutions incur transaction costs and administrative delays, these flaws could be overcome by introducing an adequate incentive mechanism from higher to lower levels of governmental bodies. Secondly, in line with the modern planning paradigm [79], the concept of participation and collaboration is related to the collective and voluntary management of resilience capacity, which is undertaken by all the relevant stakeholders and actors. The free-riding problem and conflicts of interest may arise, but as in the Kobe earthquake case, the participatory mechanism could work under a strong neighborhood-based civil society with an abundance of social capital. Thirdly, informal bodies emerge as alternative government systems based on networking and self-organization [78]. Those entities are active at the local and global levels. Finally, learning and innovation promote social memory for monitoring and coping with future natural hazards.
We notice that local government’s planning functions and governance structure are typically captured by the institutional indicators [47]. Even though we did not consider the institutional dimension, our analysis towards our multi-layered governance is still valid in the South Korean context because implications on the flexible governance come from the spatial variation and inequality in the resilience dimensions that are related to cross-level interactions and cooperation. It is through some form of flexible governance that local governments or clusters of local governments can communicate and cooperate with each other. Our mapping of local governments in metropolitan areas onto the identified resilience dimensions clearly illustrates that the level of resilience varies systematically across spatial contexts. As we find evidence to show that groups of local governments from different metropolitan areas share common characteristics, a top-down approach for resource allocation and emergency management led by the central and metropolitan governments alone cannot be an efficient and effective measure for preparedness and recovery. In accordance with the aforementioned four components of adaptive governance, local governments should devise new layers of intermediary institutions that have exclusive responsibility for disaster management beyond the center-periphery framework. Indeed, the vertical risk governance system institutionalized by the central government seems to be strong, but fragmentation and lack of coordination within and between relevant organizations at the local level are a real threat to sustainable hazard mitigation in South Korea [57]. This innovation could allow all interested stakeholders and community agencies (regardless of whether they are adjacent or remote) to create opportunities to (1) leverage resources for specific hazards, (2) set up communication channels, and (3) share experiences and knowledge on environment protection, development regulations, and local economic development tools. We conjecture that this is possible even without a great deal of financial incentives if actors learn that localized adaptive co-management and networking could result in the protection of their property values against natural disasters.
The balance of fiscal decentralization and federalization is of critical importance for sustainable governance mechanisms in South Korea, which has suffered from dual problems in its local public finance and taxation system. Firstly, the vertical imbalance between the central government and local governments is severe. Most local governments are highly dependent on national and metropolitan subsidies, and the central government exerts more power in collecting taxes than do the local authorities [39]. More problematic is that the level of dependence varies significantly across localities. This inter-local disparity, coupled with socio-spatial inequalities, could have a negative impact on the integration of mitigation systems. Competition may ensure efficiency, and fiscal decentralization could be a factor in lowering the natural disaster fatality rate [80]. However, natural disasters cross borders, and hence the market alone cannot fully absorb the externalities. Therefore, some level of fiscal federalism and intervention is also required in the local-to-local relation. Flexible and polycentric governance for fiscal policies should be designed in a way that guarantees that the proposed intermediary institutions have greater power and responsibility for taxes and spending.

6. Conclusions and Recommendations for Future Research

This paper applied a confirmatory factor methodology to assess resilience to natural hazards in the metropolitan areas of South Korea. Our measurement model satisfactorily achieved reliability and validity for the three resilience dimensions, which are of biophysical, built-environment, and socioeconomic conditions. Among them, the distribution of factor score for the socioeconomic dimension revealed that the economic and financial resources are highly concentrated in the urban core areas in the Capital Region, which in part explains the historical context of South Korea’s rapid urbanization and industrialization towards the capital city. Unlike the canonical principal component analysis and the summation approach, our confirmatory method further revealed the trade-off relationships between the biophysical and built-environment; and between the biophysical and socioeconomic resilience. The result clearly suggests that we need to devise sustainable urban planning tools to balance the human-made and natural environment.
The classification of local jurisdictions in the metropolitan areas onto the domain of the identified resilience dimensions produced six heterogeneous groups, which are statistically distinct with respect to each resilience factor and the combinations of the factors. Our classification also explained a large portion of the total variation of each dimension, which ranges from 83.3%–87.0%. The cluster analysis showed the reality of polarization in space. Clusters of local jurisdictions with a high level of the built-environment and socioeconomic resilience suffer from the lack of natural infrastructure. One unexpected finding from the visual inspection of the scatter plots for the factors was that the biophysical dimension works better in distinguishing the localities from one another. While the tendency of switching from biophysical and climatic components to economic and political aspects prevails in recent natural hazards and disasters studies, the natural infrastructure deserves an equal attention in the future studies.
We hope this project to shed some light on the sustainable hazard mitigation. The unequal distribution of natural asset and the inequality of urban development and wealth accumulation in space trigger the necessity of innovative forms of policy intervention and modification in the existing natural hazard and disaster management system in South Korea. The functions and power, along with the corresponding administrative and financial resources, should be redirected and reallocated to the local level. In addition, there should an intergovernmental incentive mechanism in which local governments that share common resilience characteristics can establish more localized institutions and management systems under the integrated and flexible governance framework.
This study mainly focused on the local governments in the large metropolitan areas with an emphasis on the metropolitan-to-metropolitan and the local-to-metropolitan cooperation. The quality of the data (particularly, the land use indicators) for the remaining rural jurisdictions was not satisfactory for our analysis. Also, including some indicators (such as population density, housing age, and disaster facilities) for the rural areas distorted the quantitative results, causing the data distributions and the covariance structures to be highly skewed. We hope future studies could derive policy implications on the rural-to-urban relationship by expanding the analysis to the entire territory with finer data sources.
The main purposes of this study are to provide an alternative model for measuring resilience dimensions and to illustrate the resilience characteristics for the heterogeneous groups of communities by focusing on the pre-conditions of the resilience components. Future studies could provide much more fruitful implications for hazard mitigation strategies if they investigate causal relationships between the resilience dimensions and the actual local damages caused by natural disasters.
We notice that some indicators for each resilience dimension used by other researchers are not included in our model. There are three reasons: Firstly, variables, such as race/ethnicity groups and international migrants, are not very relevant in the context of South Korea. Secondly, due to the limitation in acquiring relevant data sources, we could not consider some important variables, such as income, accessibility to transportation nodes, and so on. In particular, Korea’s Census does not collect the income data. Finally, CFA models sometimes are not identified and are therefore not estimable. In the simple summation method, the number of variables is not a critical issue: researchers can sum up all the relevant indicators to create resilience scores. However, in the CFA model, there are cases where including some less important control variables causes the existing indicators of interest not to be significant and/or the signs of their coefficients to be changed. Also, when two or more indicators are highly correlated, the final error variances may be calculated as negative. This anomaly is referred to as a Heywood case. Hence, we structured our model as parsimonious as possible by omitting some basic variables (for example, gender and groups of population by age). We look forward to future research that adopts more sophisticated indexing methodologies for scaling latent resilience dimensions to achieve a desired level of statistical accuracy as well as a desired number of relevant indicators.

Acknowledgments

This research was supported by Basic Science Research Program through the National Research Foundation of Korea (NRF) funded by the Ministry of Education (NRF-2013R1A1A2013676).

Author Contributions

All authors contributed equally to this work for drafting the paper, reviewing relevant studies, compiling and analyzing the data. All authors wrote, reviewed and commented on the manuscript. All authors have read and approved the final manuscript.

Conflicts of Interest

The authors declare no conflict of interest.

References

  1. Guha-Sapir, D.; Hoyois, P.; Below, R. Annual Disaster Statistical Review 2013: The Numbers and Trends; CRED: Brussels, Belgium, 2014. [Google Scholar]
  2. ASEAN Agreement on Disaster Management and Emergency Response Vientiane, 26 July 2005. Available online: http://www.asean.org/news/item/asean-agreement-on-disaster-management-and-emergency-response-vientiane-26-july-2005-2 (accessed on 16 October 2015).
  3. Rabbon, P.D.; Zepp, L.J.; Olsen, J.R. Flood risk management in the context of United States governance. In Proceedings of International Policy-Oriented Discussions, International Flood Risk Management Approaches: From Theory to Practice, Washington, DC, USA, November 30–December 1 2010; Available online: http://www.nfrmp.us/IFRMA/ (accessed on 12 July 2015).
  4. Tabios, G.Q.I. Flood risk management in the Philippines: Governance and institutional framework. In Proceedings of International Policy-Oriented Discussions, International Flood Risk Management Approaches: From Theory to Practice, Washington, DC, USA, November 30–December 1 2010; Available online: http://www.nfrmp.us/IFRMA/ (accessed on 12 July 2015).
  5. Wei, Y.-M.; Jin, J.-L.; Wang, Q. Impacts of natural disasters and disasters risk management in China: The case of China’s experience in Wenchuan earthquake. In Resilience and Recovery in Asian Disasters; Sawada, Y., Oum, S., Eds.; Springer: Berlin, Germany, 2014; pp. 287–307. [Google Scholar]
  6. Bae, Y.; Joo, Y.-M.; Won, S.-Y. Decentralization and collaborative disaster governance: Evidence from South Korea. Habitat Int. 2015, in press. [Google Scholar]
  7. Bae, Y.; Kim, S. Civil society and local activism in South Korea’s local democratization. Democratization 2013, 20, 260–286. [Google Scholar] [CrossRef]
  8. Cutter, S.L.; Ahearn, J.A.; Amadei, B.; Crawford, P.; Eide, E.A.; Galloway, G.E.; Goodchild, M.F.; Kunreuther, H.C.; Li-Vollmer, M.; Schoch-Spana, M. Disaster resilience: A national imperative. Environ. Sci. Policy Sustain. Dev. 2013, 55, 25–29. [Google Scholar] [CrossRef]
  9. Klein, R.J.; Nicholls, R.J.; Thomalla, F. Resilience to natural hazards: How useful is this concept? Global Environ. Chang. B Environ. Hazards 2003, 5, 35–45. [Google Scholar] [CrossRef]
  10. Manyena, S.B. The concept of resilience revisited. Disasters 2006, 30, 434–450. [Google Scholar] [CrossRef] [PubMed]
  11. Cutter, S.L.; Barnes, L.; Berry, M.; Burton, C.; Evans, E.; Tate, E.; Webb, J. A place-based model for understanding community resilience to natural disasters. Global Environ. Chang. 2008, 18, 598–606. [Google Scholar] [CrossRef]
  12. Yoon, D.; Kang, J.E.; Brody, S.D. A measurement of community disaster resilience in Korea. J. Environ. Plan. Manag. 2015. [Google Scholar] [CrossRef]
  13. Gallopín, G.C. Linkages between vulnerability, resilience, and adaptive capacity. Global Environ. Chang. 2006, 16, 293–303. [Google Scholar] [CrossRef]
  14. Bruneau, M.; Chang, S.E.; Eguchi, R.T.; Lee, G.C.; O’Rourke, T.D.; Reinhorn, A.M.; Shinozuka, M.; Tierney, K.; Wallace, W.A.; von Winterfeldt, D. A framework to quantitatively assess and enhance the seismic resilience of communities. Earthq. Spectra 2003, 19, 733–752. [Google Scholar] [CrossRef]
  15. Pelling, M. The Vulnerability of Cities: Natural Disasters and Social Resilience; Earthscan: London, UK, 2003; p. 48. [Google Scholar]
  16. Holling, C.S. Resilience and stability of ecological systems. Annu. Rev. Ecol. Syst. 1973, 4, 1–23. [Google Scholar] [CrossRef]
  17. Adger, W.N.; Hughes, T.P.; Folke, C.; Carpenter, S.R.; Rockström, J. Social-ecological resilience to coastal disasters. Science 2005, 309, 1036–1039. [Google Scholar] [CrossRef] [PubMed]
  18. Folke, C. Resilience: The emergence of a perspective for social-ecological systems analyses. Global Environ. Chang. 2006, 16, 253–267. [Google Scholar] [CrossRef]
  19. Gunderson, L.H.; Holling, C.S. Panarchy: Understanding Transformations in Human and Natural Systems; Island Press: Washington, DC, USA, 2001; pp. 40–41. [Google Scholar]
  20. Folke, C.; Carpenter, S.; Elmqvist, T.; Gunderson, L.; Holling, C.S.; Walker, B. Resilience and sustainable development: Building adaptive capacity in a world of transformations. AMBIO J. Hum. Environ. 2002, 31, 437–440. [Google Scholar] [CrossRef]
  21. Birkmann, J.; Cardona, O.; Carreño, M.; Barbat, A.; Pelling, M.; Schneiderbauer, S.; Kienberger, S.; Keiler, M.; Alexander, D.; Zeil, P. Framing vulnerability, risk and societal responses: The move framework. Nat. Hazards 2013, 67, 193–211. [Google Scholar] [CrossRef]
  22. Burton, I.; Huq, S.; Lim, B.; Pilifosova, O.; Schipper, E.L. From impacts assessment to adaptation priorities: The shaping of adaptation policy. Clim. Policy 2002, 2, 145–159. [Google Scholar] [CrossRef]
  23. O’Brien, K.; Leichenko, R.; Kelkar, U.; Venema, H.; Aandahl, G.; Tompkins, H.; Javed, A.; Bhadwal, S.; Barg, S.; Nygaard, L. Mapping vulnerability to multiple stressors: Climate change and globalization in India. Glob. Environ. Chang. 2004, 14, 303–313. [Google Scholar] [CrossRef]
  24. Smit, B.; Burton, I.; Klein, R.J.; Street, R. The science of adaptation: A framework for assessment. Mitig. Adapt. Strateg. Global Chang. 1999, 4, 199–213. [Google Scholar] [CrossRef]
  25. King, D. Planning for hazard resilient communities. In Disaster Resilience: An Integrated Approach; Paton, D., Johnston, D., Eds.; Charles C Thomas: Springfield, IL, USA, 2006; pp. 288–304. [Google Scholar]
  26. Cutter, S.L. Vulnerability to environmental hazards. Prog. Hum. Geogr. 1996, 20, 529–539. [Google Scholar] [CrossRef]
  27. Cutter, S.L.; Boruff, B.J.; Shirley, W.L. Social vulnerability to environmental hazards. Soc. Sci. Q. 2003, 84, 242–261. [Google Scholar] [CrossRef]
  28. Berkes, F.; Ross, H. Community resilience: Toward an integrated approach. Soc. Nat. Resour. 2013, 26, 5–20. [Google Scholar] [CrossRef]
  29. Coles, E.; Buckle, P. Developing community resilience as a foundation for effective disaster recovery. Aust. J. Emerg. Manag. 2004, 19, 6–15. [Google Scholar]
  30. Walker, B.; Salt, D. Resilience Thinking: Sustaining Ecosystems and People in a Changing World; Island Press: Washington, DC, USA, 2006; p. 85. [Google Scholar]
  31. Norris, F.H.; Stevens, S.P.; Pfefferbaum, B.; Wyche, K.F.; Pfefferbaum, R.L. Community resilience as a metaphor, theory, set of capacities, and strategy for disaster readiness. Am. J. Commun. Psychol. 2008, 41, 127–150. [Google Scholar] [CrossRef] [PubMed]
  32. Djalante, R.; Holley, C.; Thomalla, F. Adaptive governance and managing resilience to natural hazards. Int. J. Disaster Risk Sci. 2012, 2, 1–14. [Google Scholar] [CrossRef]
  33. Engle, N.L. Adaptive capacity and its assessment. Global Environ. Chang. 2011, 21, 647–656. [Google Scholar] [CrossRef]
  34. Aldrich, D.P. Building Resilience: Social Capital in Post-Disaster Recovery; University of Chicago Press: Chicago, IL, USA, 2012. [Google Scholar]
  35. Asian Disaster Reduction Center (ADRC). Available online: http://www.adrc.asia/nationinformation.php?NationCode=410&Lang=en&NationNum=21 (accessed on 16 October 2015).
  36. Kim, W. Natural Disaster Management in Korea: An Analytic Study with Policy Implications; Natural Hazard Research Working Paper 88; Natural Hazards Center, University of Colorado at Boulder: Boulder, CO, USA, 1994. [Google Scholar]
  37. Central Intelligence Agency (CIA). The World Factbook. Available online: https://www.cia.gov/library/publications/the-world-factbook/geos/ks.html (accessed on 16 October 2015).
  38. United Nations. Republic of Korea Public Administration Country Profile; Division for Public Administration and Development Management (DPADM), Department of Economic and Social Affairs (DESA): New York, NY, USA, 2007. [Google Scholar]
  39. Organisation for Economic Co-operation and Development (OECD). OECD Economic Survey Korea 2005; OECD Publishing: Paris, France, 2005. [Google Scholar]
  40. Brown, T.A.; Moore, M.T. Confirmatory factor analysis. In Handbook of Structural Equation Modeling; Hoyle, R.H., Ed.; The Guilford Press: New York, NY, USA, 2012; pp. 361–379. [Google Scholar]
  41. Kline, R.B. Principles and Practice of Structural Equation Modeling, 3rd ed.; The Guilford Press: New York, NY, USA, 2010. [Google Scholar]
  42. Blunch, N. Introduction to Structural Equation Modeling Using IBM SPSS Statistics and AMOS, 2nd ed.; SAGE Publications Ltd.: London, UK, 2013. [Google Scholar]
  43. Hurley, A.E.; Scandura, T.A.; Schriesheim, C.A.; Brannick, M.T.; Seers, A.; Vandenberg, R.J.; Williams, L.J. Exploratory and confirmatory factor analysis: Guidelines, issues, and alternatives. J. Organ. Behav. 1997, 18, 667–683. [Google Scholar] [CrossRef]
  44. Burton, C.G. A validation of metrics for community resilience to natural hazards and disasters using the recovery from Hurricane Katrina as a case study. Ann. Assoc. Am. Geogr. 2015, 105, 67–86. [Google Scholar] [CrossRef]
  45. Cutter, S.L.; Burton, C.G.; Emrich, C.T. Disaster resilience indicators for benchmarking baseline conditions. J. Homel. Secur. Emerg. Manag. 2010, 7. Article 51. [Google Scholar] [CrossRef]
  46. Peacock, W.G.; Brody, S.; Seitz, W.; Merrell, W.; Vedlitz, A.; Zahran, S.; Harriss, R.; Stickney, R. Advancing Resilience of Coastal Localities: Developing, Implementing, and Sustaining the Use of Coastal Resilience Indicators: A Final Report; Hazard Reduction and Recovery Center: College Station, TX, USA, 2010. [Google Scholar]
  47. Cutter, S.L.; Ash, K.D.; Emrich, C.T. The geographies of community disaster resilience. Glob. Environ. Chang. 2014, 29, 65–77. [Google Scholar] [CrossRef]
  48. Tate, E. Social vulnerability indices: A comparative assessment using uncertainty and sensitivity analysis. Nat. Hazards 2012, 63, 325–347. [Google Scholar] [CrossRef]
  49. DiStefano, C.; Zhu, M.; Mindrila, D. Understanding and using factor scores: Considerations for the applied researcher. Pract. Assess. Res. Evaluation 2009, 14, 1–11. [Google Scholar]
  50. Cutter, S.L.; Mitchell, J.T.; Scott, M.S. Revealing the vulnerability of people and places: A case study of Georgetown County, South Carolina. Ann. Assoc. Am. Geogr. 2000, 90, 713–737. [Google Scholar] [CrossRef]
  51. Leichenko, R.M.; O’Brien, K.L. The dynamics of rural vulnerability to global change: The case of Southern Africa. Mitig. Adapt. Strateg. Glob. Chang. 2002, 7, 1–18. [Google Scholar] [CrossRef]
  52. Tate, E.; Cutter, S.L.; Berry, M. Integrated multihazard mapping. Environ. Plan. B Plan. Des. 2010, 37, 646–663. [Google Scholar] [CrossRef]
  53. Boruff, B.J.; Emrich, C.; Cutter, S.L. Erosion hazard vulnerability of U.S. Coastal counties. J. Coast. Res. 2005, 215, 932–942. [Google Scholar] [CrossRef]
  54. Brenkert, A.L.; Malone, E.L. Modeling vulnerability and resilience to climate change: A case study of India and Indian states. Clim. Chang. 2005, 72, 57–102. [Google Scholar] [CrossRef]
  55. Torresan, S.; Critto, A.; Dalla Valle, M.; Harvey, N.; Marcomini, A. Assessing coastal vulnerability to climate change: Comparing segmentation at global and regional scales. Sustain. Sci. 2008, 3, 45–65. [Google Scholar] [CrossRef]
  56. Yin, H.; Li, B.; Guo, T.; Zhu, J. Measurement method and empirical research on systemic vulnerability of environmental sustainable development capability. Pol. J. Environ. Stud. 2014, 23, 243–253. [Google Scholar]
  57. Yoon, D.K. Disaster policies and emergency management in Korea. In Disaster and Development: Examining Global Issues and Cases; Naim Kapucu, K.T.L., Ed.; Springer: New York, NY, USA, 2014; pp. 149–164. [Google Scholar]
  58. Bartuska, T.J. The built environment: Definition and scope. In The Built Environment: A Collaborative Inquiry into Design and Planning, 2nd ed.; McClure, W.R., Bartuska, T.J., Eds.; Wiley: Chichster, UK, 2007; pp. 3–14. [Google Scholar]
  59. Choi, C.-I. Does urbanization indeed increase disaster damages?: Lessons from Gyeonggi province, South Korea. J. Environ. Policy 2010, 9, 3–27. (In Korean) [Google Scholar] [CrossRef]
  60. Vale, L.J.; Campanella, T.J. The Resilient City: How Modern Cities Recover from Disaster; Oxford University Press: New York, NY, USA, 2005. [Google Scholar]
  61. Shim, J.H.; Kim, J.E. An analysis on the interrelationship between land-use characteristics and damages caused by natural hazards. J. Korea Acad. Ind. Coop. Soc. 2012, 13, 4319–4325. (In Korean) [Google Scholar] [CrossRef]
  62. Sherrieb, K.; Norris, F.H.; Galea, S. Measuring capacities for community resilience. Soc. Indic. Res. 2010, 99, 227–247. [Google Scholar] [CrossRef]
  63. Rose, A.; Krausmann, E. An economic framework for the development of a resilience index for business recovery. Int. J. Dis. Risk Reduct. 2013, 5, 73–83. [Google Scholar] [CrossRef]
  64. Myers, C.A.; Slack, T.; Singelmann, J. Social vulnerability and migration in the wake of disaster: The case of Hurricanes Katrina and Rita. Popul. Environ. 2008, 29, 271–291. [Google Scholar] [CrossRef]
  65. Morrow, B.H. Community Resilience: A Social Justice Perspective; CARRI Research Report No. 4; Community & Regional Resilience Institute: Oak Ridge, TN, USA, 2008. [Google Scholar]
  66. Organisation for Economic Co-operation and Development (OECD). Industrial Policy and Territorial Development: Lessons from Korea; OECD Publishing: Paris, France, 2012. [Google Scholar]
  67. Thurstone, L.L. The Vectors of Mind; University of Chicago Press: Chicago, IL, USA, 1935. [Google Scholar]
  68. Shahriar, F.; Montazeri, M.; Momeni, M.; Freidooni, A. Regionalization of the climatic areas of Qazvin province using multivariate statistical methods. Modern Appl. Sci. 2015, 9, 123–138. [Google Scholar] [CrossRef]
  69. Charrad, M.; Ghazzali, N.; Boiteau, V.; Niknafs, A. Nbclust: An R package for determining the relevant number of clusters in a data set. J. Stat. Softw. 2014, 61, 1–36. [Google Scholar] [CrossRef]
  70. Fornell, C.; Larcker, D.F. Structural equation models with unobservable variables and measurement error: Algebra and statistics. J. Mark. Res. 1981, 382–388. [Google Scholar] [CrossRef]
  71. O’Rourke, N.; Hatcher, L. A Step-by-Step Approach to Using SAS for Factor Analysis and Structural Equation Modeling, 2nd ed.; SAS Institute: Cary, NC, USA, 2014. [Google Scholar]
  72. Hu, L.-T.; Bentler, P.M. Evaluating model fit. In Structural Equation Modeling. Concepts, Issues, and Applications; Hoyle, R.H., Ed.; Sage: London, UK, 1995; pp. 76–99. [Google Scholar]
  73. Hu, L.-T.; Bentler, P.M. Cutoff criteria for fit indexes in covariance structure analysis: Conventional criteria versus new alternatives. Struct. Equ. Model. 1999, 6, 1–55. [Google Scholar] [CrossRef]
  74. Reise, S.P.; Widaman, K.F.; Pugh, R.H. Confirmatory factor analysis and item response theory: Two approaches for exploring measurement invariance. Psychol. Bull. 1993, 114, 552–566. [Google Scholar] [CrossRef] [PubMed]
  75. Liu, J.; Dietz, T.; Carpenter, S.R.; Folke, C.; Alberti, M.; Redman, C.L.; Schneider, S.H.; Ostrom, E.; Pell, A.N.; Lubchenco, J. Coupled human and natural systems. AMBIO J. Hum. Environ. 2007, 36, 639–649. [Google Scholar] [CrossRef]
  76. Asselt, M.B.A.V.; Renn, O. Risk governance. J. Risk Res. 2011, 14, 431–449. [Google Scholar] [CrossRef]
  77. Jones, S.; Oven, K.J.; Manyena, B.; Aryal, K. Governance struggles and policy processes in disaster risk reduction: A case study from Nepal. Geoforum 2014, 57, 78–90. [Google Scholar] [CrossRef]
  78. Adger, W.N. Social capital, collective action, and adaptation to climate change. Econ. Geogr. 2003, 79, 387–404. [Google Scholar] [CrossRef]
  79. Hall, P. Cities of Tomorrow: An Intellectual History of Urban Planning and Design in the Twentieth Century, 3rd ed.; Wiley-Blackwell: Malden, MA, USA, 2002. [Google Scholar]
  80. Escaleras, M.; Register, C.A. Fiscal decentralization and natural hazard risks. Public Choice 2012, 151, 165–183. [Google Scholar] [CrossRef]

