Article

A Study on the Estimation Method of Risk Based Area for Jetty Safety Monitoring

Department of Naval Architecture and Ocean Engineering, Inha University, 100 Inha-Ro, Nam-Gu, Incheon 22212, Korea
*
Author to whom correspondence should be addressed.
Sustainability 2015, 7(10), 13154-13168; https://doi.org/10.3390/su71013154
Submission received: 13 August 2015 / Revised: 21 September 2015 / Accepted: 22 September 2015 / Published: 25 September 2015

Abstract

:
Recently, the importance of safety-monitoring systems was highlighted by the unprecedented collision between a ship and a jetty in Yeosu. Accordingly, in this study, we introduce the concept of risk based area and develop a methodology for a jetty safety-monitoring system. By calculating the risk based areas for a ship and a jetty, the risk of collision was evaluated. To calculate the risk based areas, we employed an automatic identification system for the ship, stopping-distance equations, and the regulation velocity near the jetty. In this paper, we suggest a risk calculation method for jetty safety monitoring that can determine the collision probability in real time and predict collisions using the amount of overlap between the two calculated risk based areas. A test was conducted at a jetty control center at GS Caltex, and the effectiveness of the proposed risk calculation method was verified. The method is currently applied to the jetty-monitoring system at GS Caltex in Yeosu for the prevention of collisions.

1. Introduction

Although technologies that support sailing ships, such as electronic chart display information systems (ECDISs) and automatic identification systems (AISs), have been developed, various maritime accidents—including collision sinking, running aground, and fires—continue to occur. These accidents have a large impact on the marine environment and incur economic losses. There have been continual efforts to avoid such accidents. In Korea, ~16,000 reported maritime accidents occurred from 1981 to 2009. Approximately 23% of these accidents were caused by collisions [1]. Additionally, ~20% occurred at the harbor or near coastlines [2]. In international cases, a report on merchant ship accidents in UK, protection and indemnity club (P&I) analyzed ~6000 cases that caused over 100,000 dollars in damages; ~62% of these accidents were caused by human error [3]. In January 2014, an unprecedented collision occurred between a WUYISAN ship and a jetty at GS Caltex in Yeosu. The state after this collision accident of a WUYISAN ship and a jetty is shown in Figure 1. Owing to this accident, ~1000 barrels of oil leaked, causing enormous economic losses and environmental pollution. The accident was due to human error and occurred during an attempt to berth at the jetty while exceeding the regulation speed. Consequently, the importance of safety-monitoring systems, which have been widely demanded, has emerged.
In this paper, we suggest a risk calculation method for pier safety monitoring and accident avoidance. The method identifies risk based areas for sailing ships and jetties, assesses the risks in these areas, and judges potential collisions. AIS data, principal particulars, Akira’s equation, and other factors were used to compose a module for calculating the risk based areas. We developed a prototype and applied it to the pier safety-monitoring system. The effectiveness of the method was verified using the prototype.
Figure 1. Photographs taken after the collision between the ship WUYISAN and the oil pier of GS Caltex Co. (Yeosu, South Korea).
Sustainability 07 13154 g001

2. Related Works

Interest in safety monitoring has recently increased. Studies on maritime safety have been performed at pier control centers, as well as shipyards, laboratories, and universities. In particular, collision avoidance—the topic of this paper—has been addressed by many authors [4,5,6,7,8,9,10,11,12,13,14,15]. Researchers have studied systems to avoid collisions between ships by predicting collisions using fuzzy theories [4,5,6,7,8,9,10], introducing the concept of the ship domain [11,12,13], and improving existing systems [14,15].
Fuzzy inference, which was introduced by Zadiah, obtains a result corresponding to the input, according to the fuzzy rules [16]. This method has the advantage of describing expert knowledge intuitively. Factors related to the operation of the ship are employed in collision prediction using fuzzy inference. A collision-avoidance system using Mamdani-type fuzzy inference to predict ship collisions was introduced by Perera et al. [4]. Andrzej et al. suggested a collision-avoidance system that calculated the change in the prediction time and route of the ships [5]. Later, Yalei et al. developed a system for avoiding and preventing collisions between ships by using the time of the closest point of approach (TCPA), the distance of the closest point of approach (DCPA), and encounter angle [6]. Bukhari et al. devised a method for calculating the degree of collision risk using the DCPA, TCPA, and vessel traffic system (VTS) [7]. In addition to simple marine collisions, Simsir et al. proposed an artificial neural network using the Levenberg–Marquardt learning algorithm to prevent collisions when ships passed through a narrow strait [8]. A collision-avoidance system based on fuzzy rules and an ordered probit regression method was introduced by Chin et al. [9]. This system makes it easier to understand the collision risk by using a framework based on a probabilistic risk assessment model. The avoidance action can be defined at the appropriate level by using this system. Recently, a framework for risk-informed maritime collision avoidance system (CAS) was proposed by Goerlandt et al. [10]. This framework was developed to understand ship–ship encounter processes and their relation to collision risk.
The ship domain, which represents the virtual area of the ship, was introduced by Fujii [11]. It supports the avoidance of collisions by keeping the clean area from entering the other ships. The ship domain was later redefined by Goodwin [12]. Static objects, including ships, were added as detection targets in the domain. In addition, several researchers have proposed various methods employing the definition of the shape and size of the domain to increase the safety of the collision-avoidance support system. In particular, Mazaheri et al. defined a domain that is not limited to the collision and can be applied to the running-aground scenario [13]. The domain was expanded downdraft, and a system was developed to avoid collisions as well as running aground.
A system supporting collision avoidance was developed by improving existing systems, including navigation equipment such as electronic chart display & information system (ECDIS) [14,15]. A collision-avoidance system developed by Kim et al. based on ECDIS was linked with various navigation communication equipment and calculated the collision risk [14]. The system creates a collision avoidance route for when the risk is greater than the reference value. Kim et al. changed the existing system into an integrated linkage-monitoring system that recognizes and provides warnings of dangerous situations and indicates a method for reaching a safe berth [15]. They tried to enhance the safety monitoring by improving the existing system.
The introduced systems detect collisions between ships as well as instances of running aground, and they support avoidance. However, they do not prevent collisions between a ship and a jetty, such as the WUYISAN accident. Therefore, we introduce the concept of the risk based area, which employs the concept of the marine domain. We suggest a method that predicts and avoids collisions between a ship and a jetty by assessing the collision risk using risk based areas.

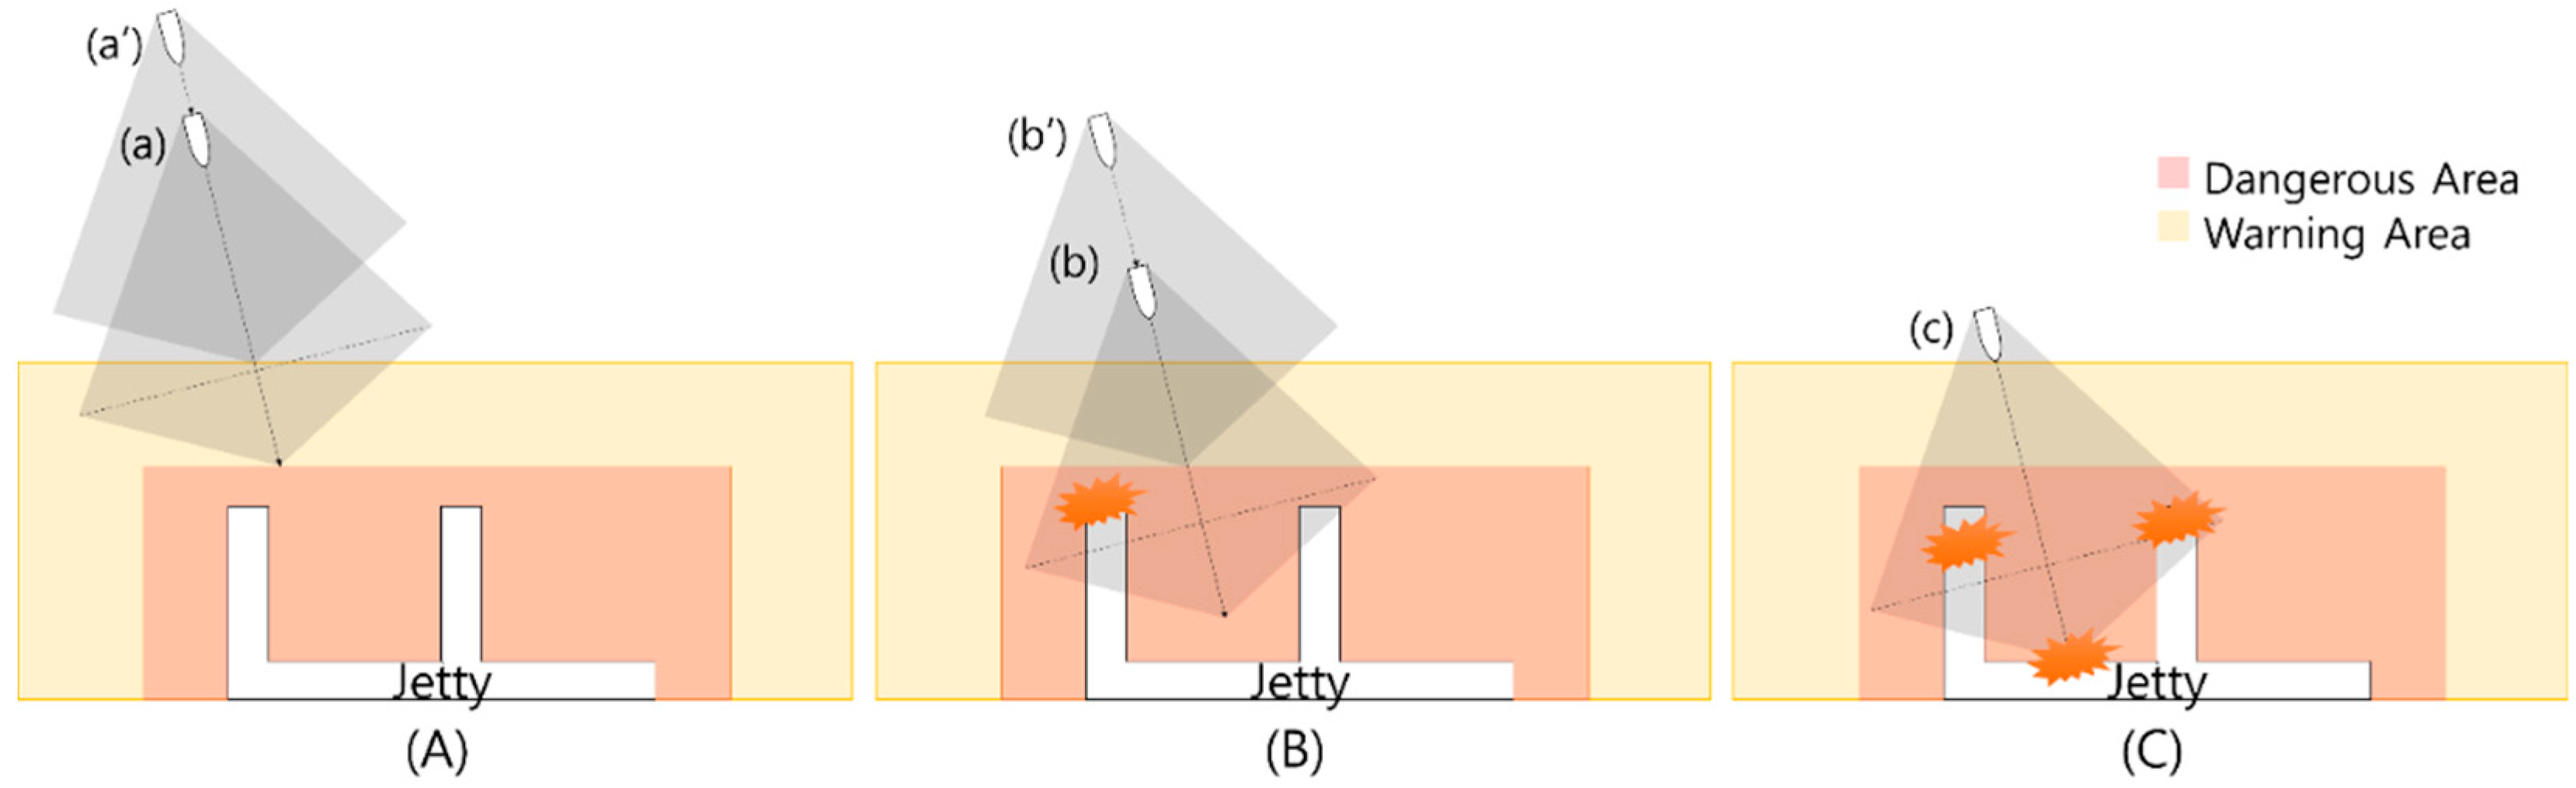
3. Method for the Calculation of the Risk Based Area

The risk based area is divided into those of the ship and jetty. Collisions between ships or between a ship and a jetty are predicted using these two areas. The calculation method for each risk based area is as follows.

3.1. Calculation of the Risk Based Area of a Ship

Researchers have proposed various methods employing the definition of the shape and size of the domain. Collision prediction by using ship-maneuvering data was first proposed by Montewka et al. [17]. They predicted a collision between two ships by calculating the shortest distance between them. Later, this concept was further extended. Göhler defined the expectation area according to the route of the ship [18]. In particular, Baldauf et al. defined an umbrella-shaped ship domain by using the turning and stopping performances [19]. In this paper, the risk based area of a ship is calculated by using the shortest stopping distance and the turning stopping distance of the ship. The risk based area of the ship is pentagonal, with five vertices that are determined according to the shortest stopped location, turning stopped location, and stern.

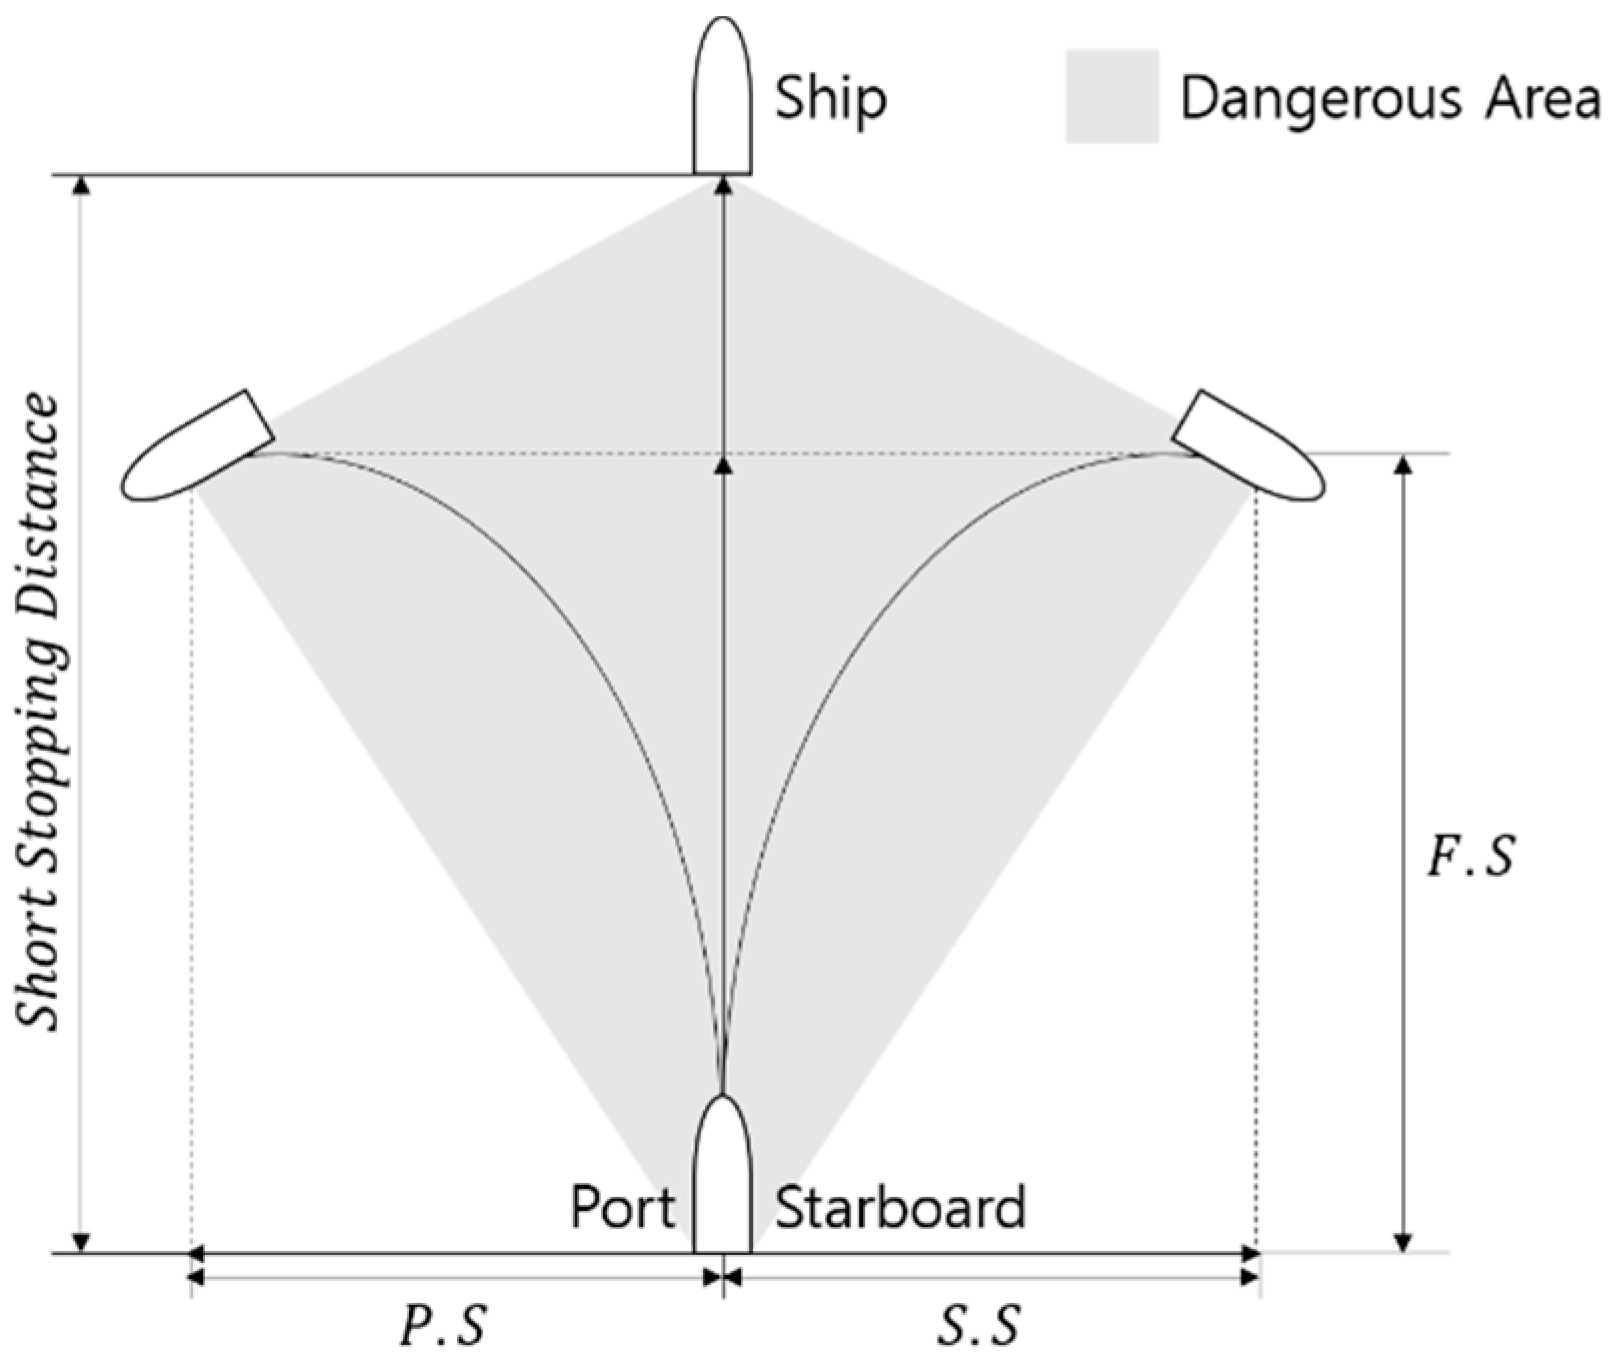
3.1.1. Shortest Stopping Distance of a Ship

Because a ship is a dynamic object, the velocity of the ship, the shortest stopping distance, and the turning stopping distance are considered in calculating the risk based area. The shortest stopping distance is the distance between the current ship location and the ship location when the hull is completely stopped, after starting full astern. The factors affecting the shortest stopping distance are as follows [20].
  • Astern engine power: The stopping distance is inversely proportional to the magnitude of the astern power.
  • Propeller type: The time required to go astern is shorter for ships with controllable pitch propellers than for those with fixed pitch propellers.
  • Displacement: The time required to go astern is proportional to the displacement.
  • Velocity: The stopping distance is proportional to the velocity before the engines go astern.
  • Wind, hull form, ocean and tidal currents, etc.
There are two representative equations for calculating the shortest stopping distance: Knight’s equation and Akira’s equation [20]. Knight’s equation represents the relationship between the astern stopping distance and time required and was obtained by the experience of Knight. Akira’s equation represents the relationship between the full astern state and the velocity of the ship [20]. The two equations can be expressed as follows:
S = 1 5 v t
S = 0.0135 v 2 W Ta
Ta = 0.095 B H P v
where S is the stopping distance (m), v is the velocity before the engines go astern (knot), t is the braking time (s), W is the displacement (ton), Ta is the astern power, and BHP is the brake horsepower.
Because Knight’s equation calculates the distance through a test of the shortest stopping distance of the ship, Akira’s equation—which can calculate the shortest stopping distance using the current velocity—was used in this study. Table 1 shows an example of the shortest stopping distance when a fully loaded very large crude carrier (VLCC) went full astern during navigation at a normal harbor speed of 12 knots.
Table 1. Relationship between the length of a ship and the shortest stopping distance for a fully loaded VLCC under sail at 12 knots.
Ship length (m)Shortest Stopping Distance of Ship
21010 times the length
25013 times the length
30015 times the length
The shortest stopping distance is calculated using Akira’s equation. If the velocity is as low as 2.5 knots, the stopping distance is very small compared with the ship’s length. Therefore, the shortest stopping distance is not calculated when the velocity is as low as 2.5 knots.

3.1.2. Turning Stopping Distance of a Ship

The turning stopping distance of a ship is the distance between the location where the braking started and the location where the ship stopped after turning into port or starboard, as illustrated in Figure 2. The turning stopping distance is expressed for two directions, in contrast to the shortest stopping distance. These two directions are based on the direction of the bow immediately before starting the turn and the turning direction. The stopping distance is calculated for each direction. The equations for calculating the port or starboard turning stopping distance are as follows:
F . S =   3 4 S
P . S = S . S =   1 2 S
where F.S is the forward component of the turning stopping distance (m), S is the shortest stopping distance as calculated in the previous section (m), P.S is the lateral component of the turning stopping distance in the port direction (m), and S.S is the lateral component of the turning stopping distance in the starboard direction (m).
The forward component of the turning stopping distance is 0.75 times the shortest stopping distance, and the lateral component of the stopping distance is 0.5 times the shortest stopping distance [21]. For the uncertainty, the variable α was used. The stopping distance obtained by adding the calculated distance to α was used. The risk based area was drawn using the locations corresponding to the shortest stopping distance, the port or starboard turning stopping distances, and the end of the stern. The risk based area of the ship was pentagonal in shape, as shown in the shaded region of Figure 2.
Figure 2. Set of risk based area and turning stopping distance of a ship.
Sustainability 07 13154 g002

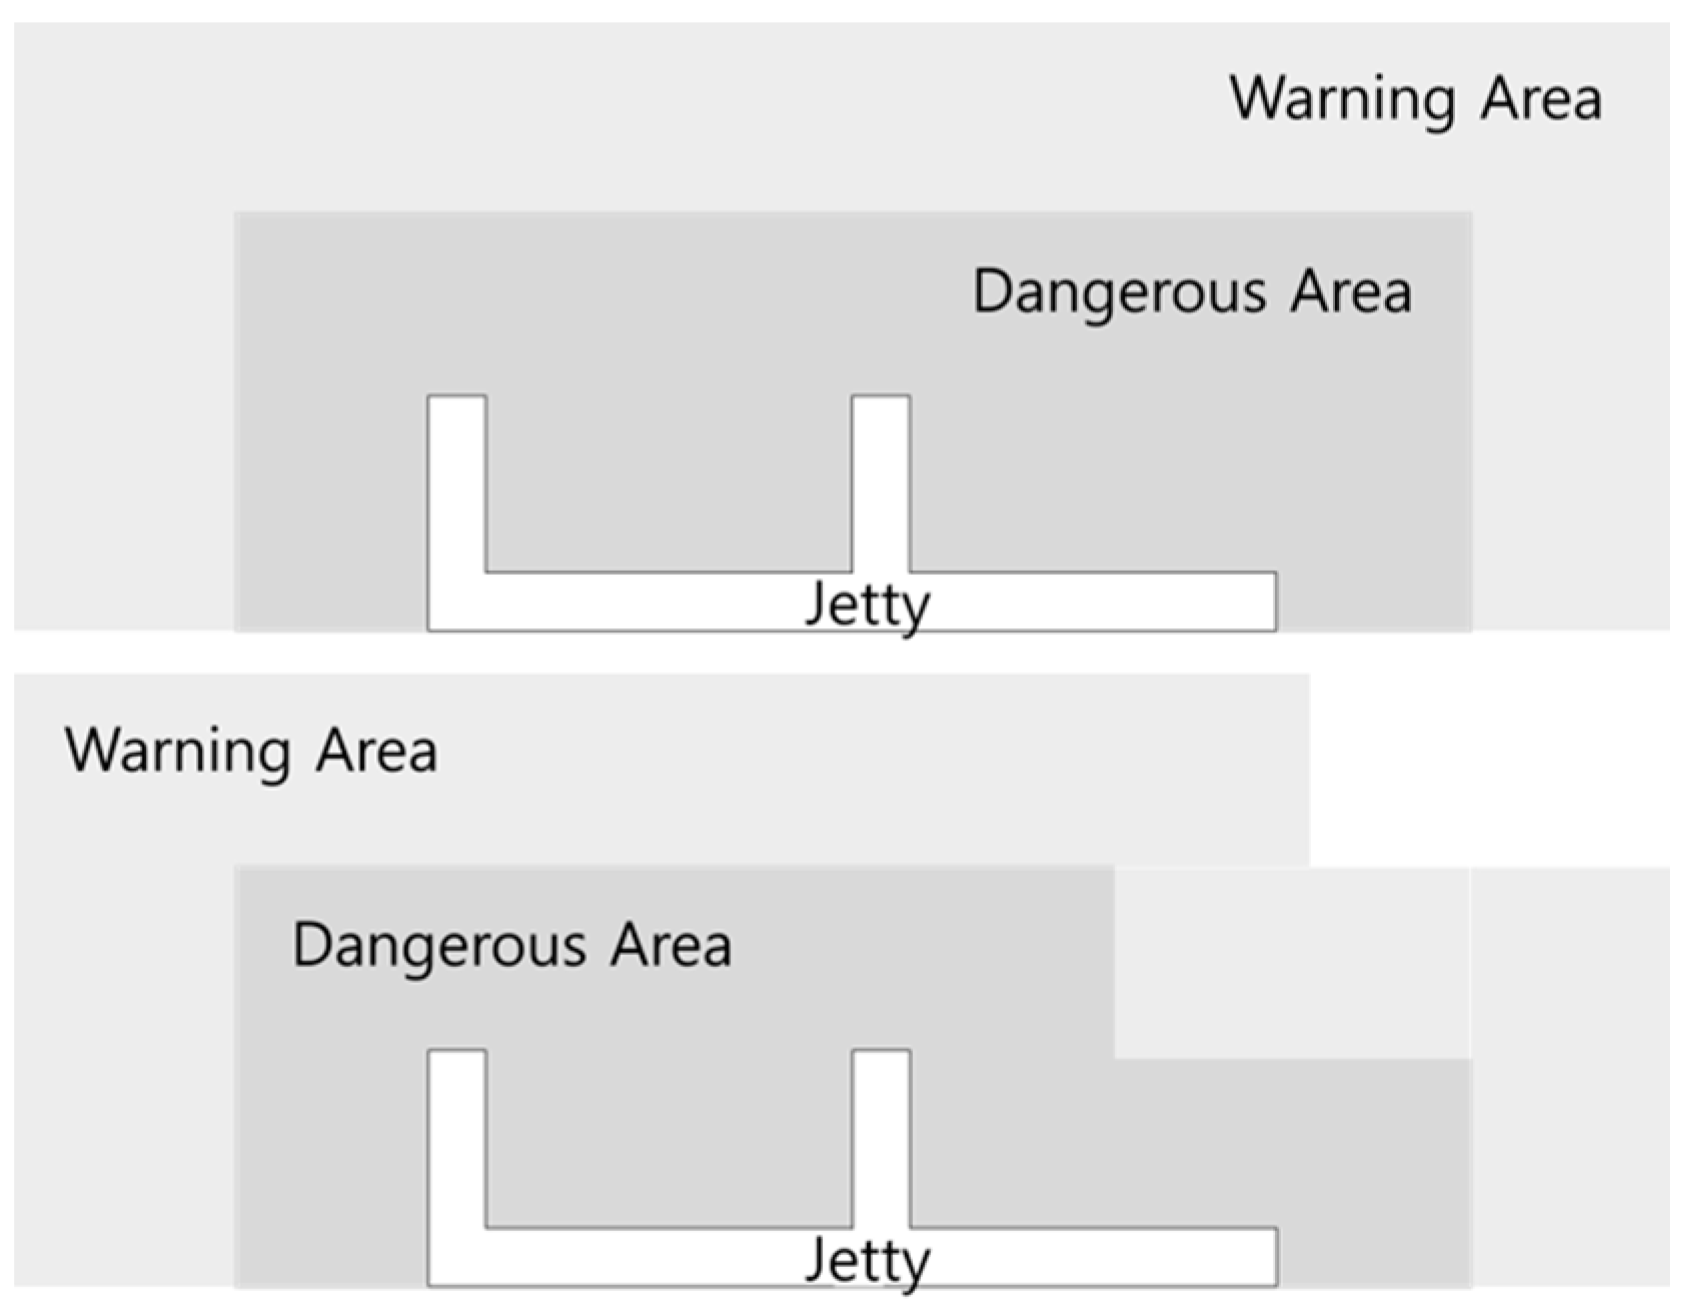
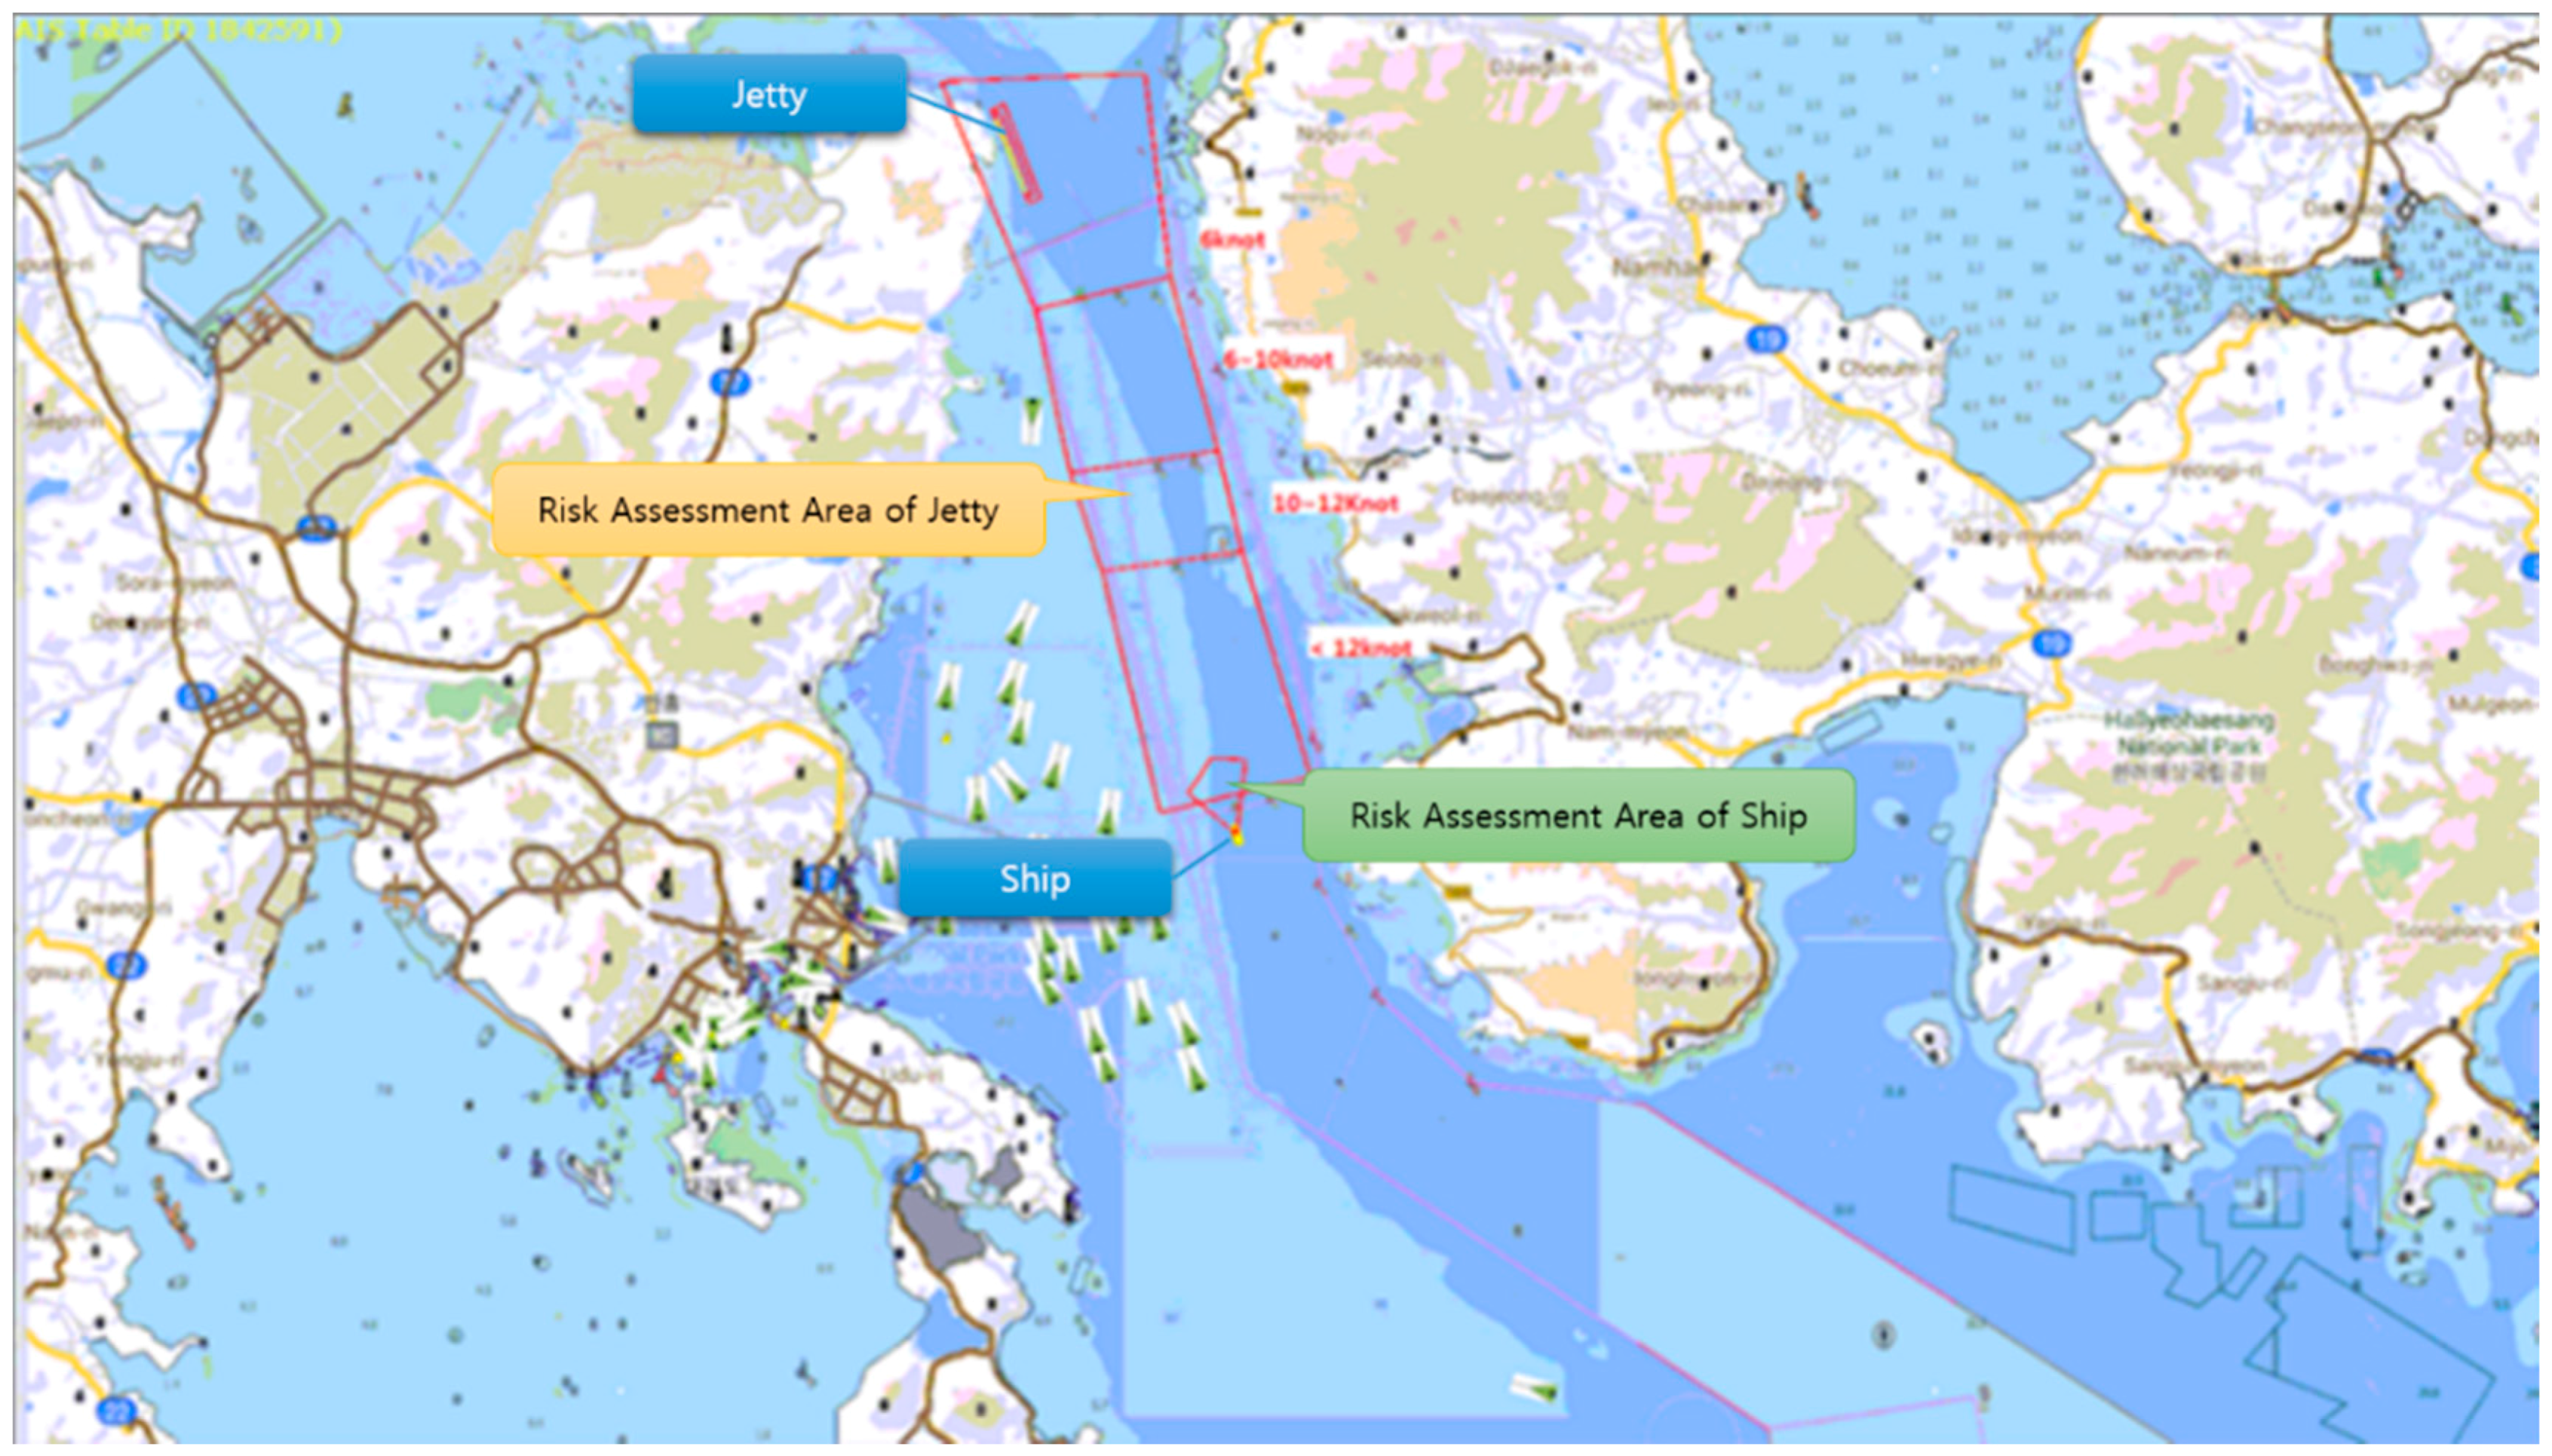
3.2. Calculation of the Risk Based Area of a Jetty
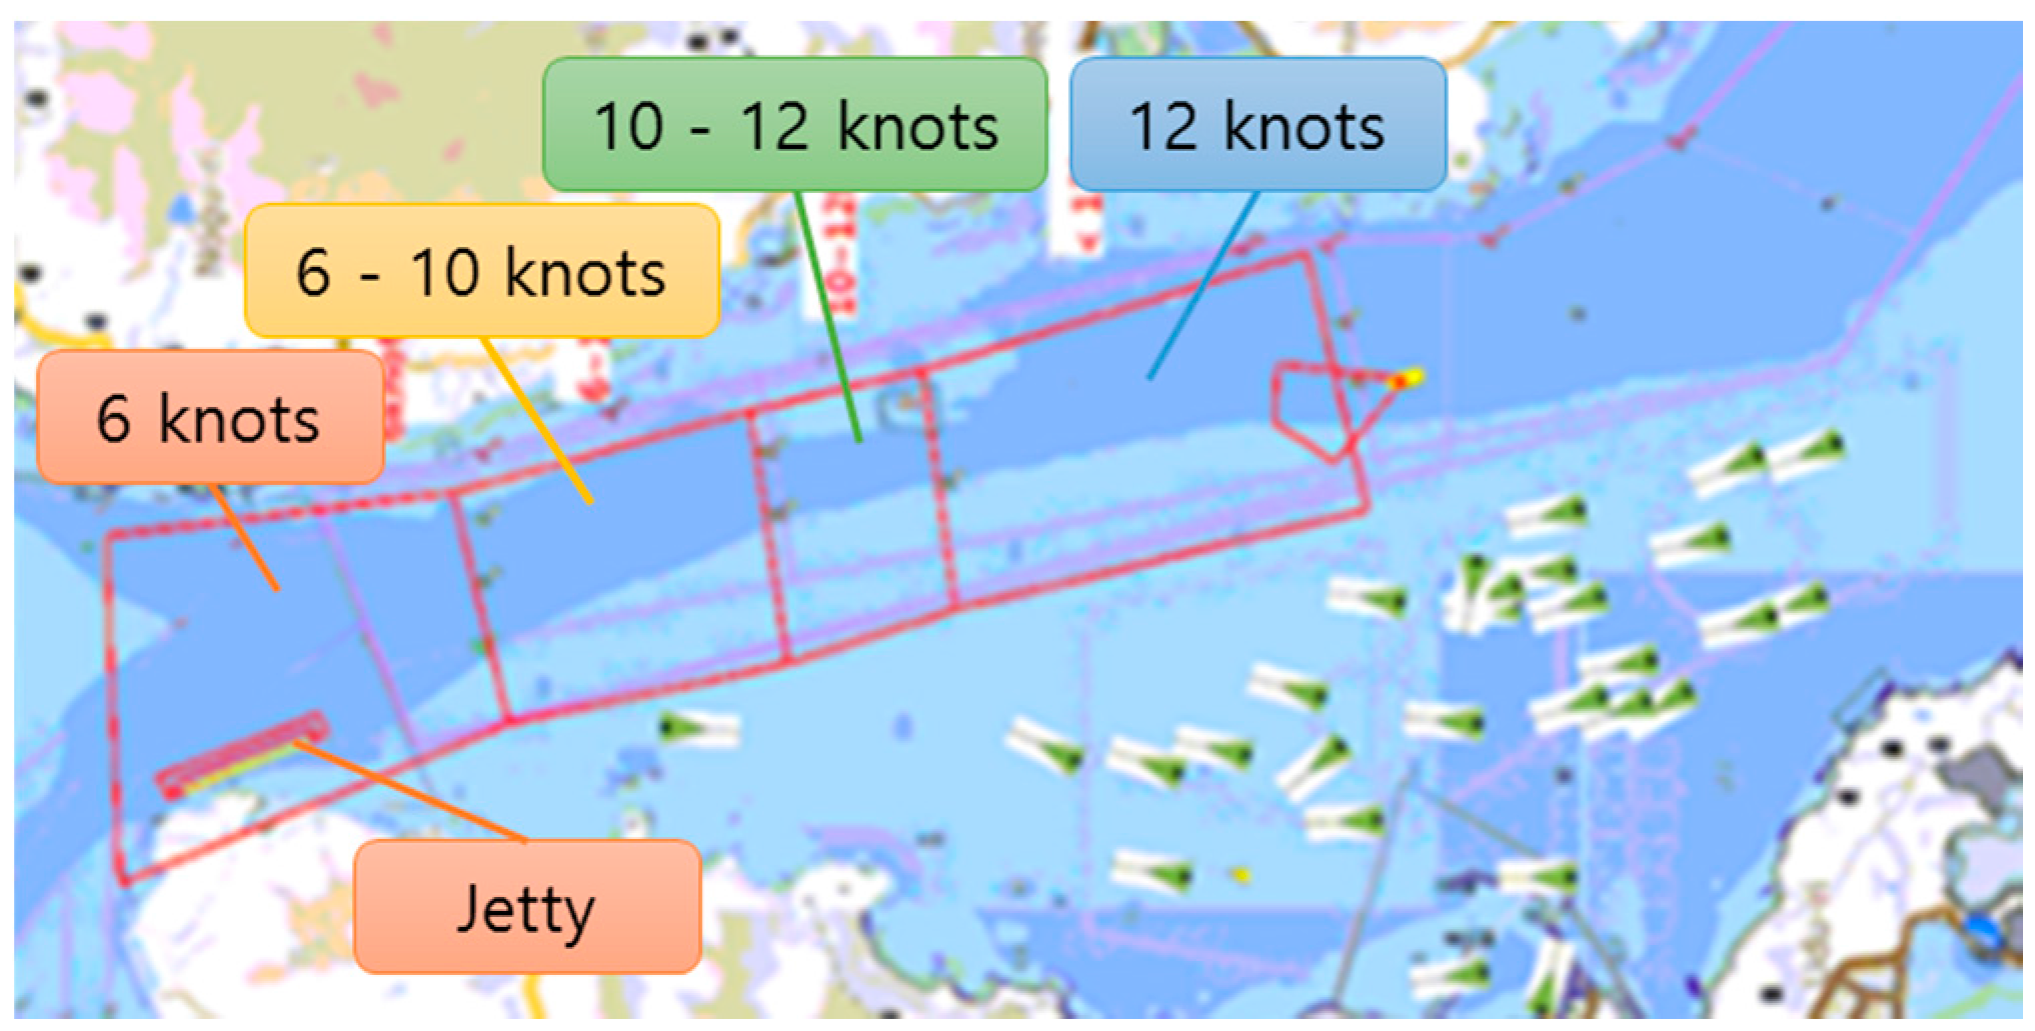
In contrast to the risk based area of a ship, the risk based area of a jetty is set by consultation between the managers, including system operators, managers responsible for safety, and officials of relevant ministry to enact rules and laws. This area is determined in consideration of such factors as the size of the ship, the size of the jetty, the structure of the jetty, and the item of acquisition. Because it is impossible to directly avoid the jetty when the ship approaches, the area was divided into two—the dangerous area and the warning area—which allowed for flexible coping according to the situation. The International Maritime Organization (IMO) proposed a regulation velocity according to the distance from the jetty [22,23]. The regulation ship velocity and distance specified by the IMO Standards of Training, Certification, and Watchkeeping for Seafarers (STCW) rules are shown in Table 2 [22,23]. After the accident involving the Torry Canyon ship near the coastlines of France in March 1967, the STCW was formed by the IMO as an international convention for providing international standards regarding crew certification. This convention sets goals regarding the safety of ships, the prevention of marine pollution, and the improvement of crew qualifications, along with suggesting standards for training, certification, and watchkeeping [24].
Table 2. Regulations for ship velocity and distance according to the IMO STCW rules.
DistanceDeadweight Tonnage (DWT)
Below 10,000 DWTPanamax, CapeVLOC, ULOC
Within 1–2 L2–3 knots2–3 knots2–3 knots
1 mile7–8 knots5–6 knots4–5 knots
2 miles13 knots9 knots7 knots
3 milesEngine S/B12 knots9 knots
4 milesUsual service conditionEngine S/B11 knots
5 miles-Usual service conditionEngine S/B
notesApproaching velocity
2–3 knots + 4 knots/mile
Approaching velocity
2–3 knots + 3 knots/mile
Approaching velocity
2–3 knots + 2 knots/mile
Engine S/B (standby): Before arriving in a port or departure from a port, we should standby the engine to meet the requirements of maneuvering operations in the port.
The risk based areas of the jetty, which are set according to various factors such as the weather and sea state, are shown in Figure 3. The risk based areas are rectangular or jetty-shaped. However, for calculating the turning route of a ship using the risk based area of the ship, a rectangular risk based area may be safer than a jetty-shaped one. These contents are covered concretely in the following risk calculation process.
Figure 3. Set of risk based areas of a jetty (top and bottom figures show rectangular and jetty-shaped risk based areas, respectively).
Sustainability 07 13154 g003
The risk based area can also be expressed by applying the rules of the marine pilots association or IMO STCW according to the regulation speed. Risk based areas obtained using the rules of the Yeosu Marine Pilots Association, which are based on the IMO STCW rules, are shown in Figure 4. These are the risk based areas of the GS Caltex jetty in Yeosu.
Figure 4. Set of risk based areas for a jetty according to the rules of the Yeosu Marine Pilots Association.
Sustainability 07 13154 g004

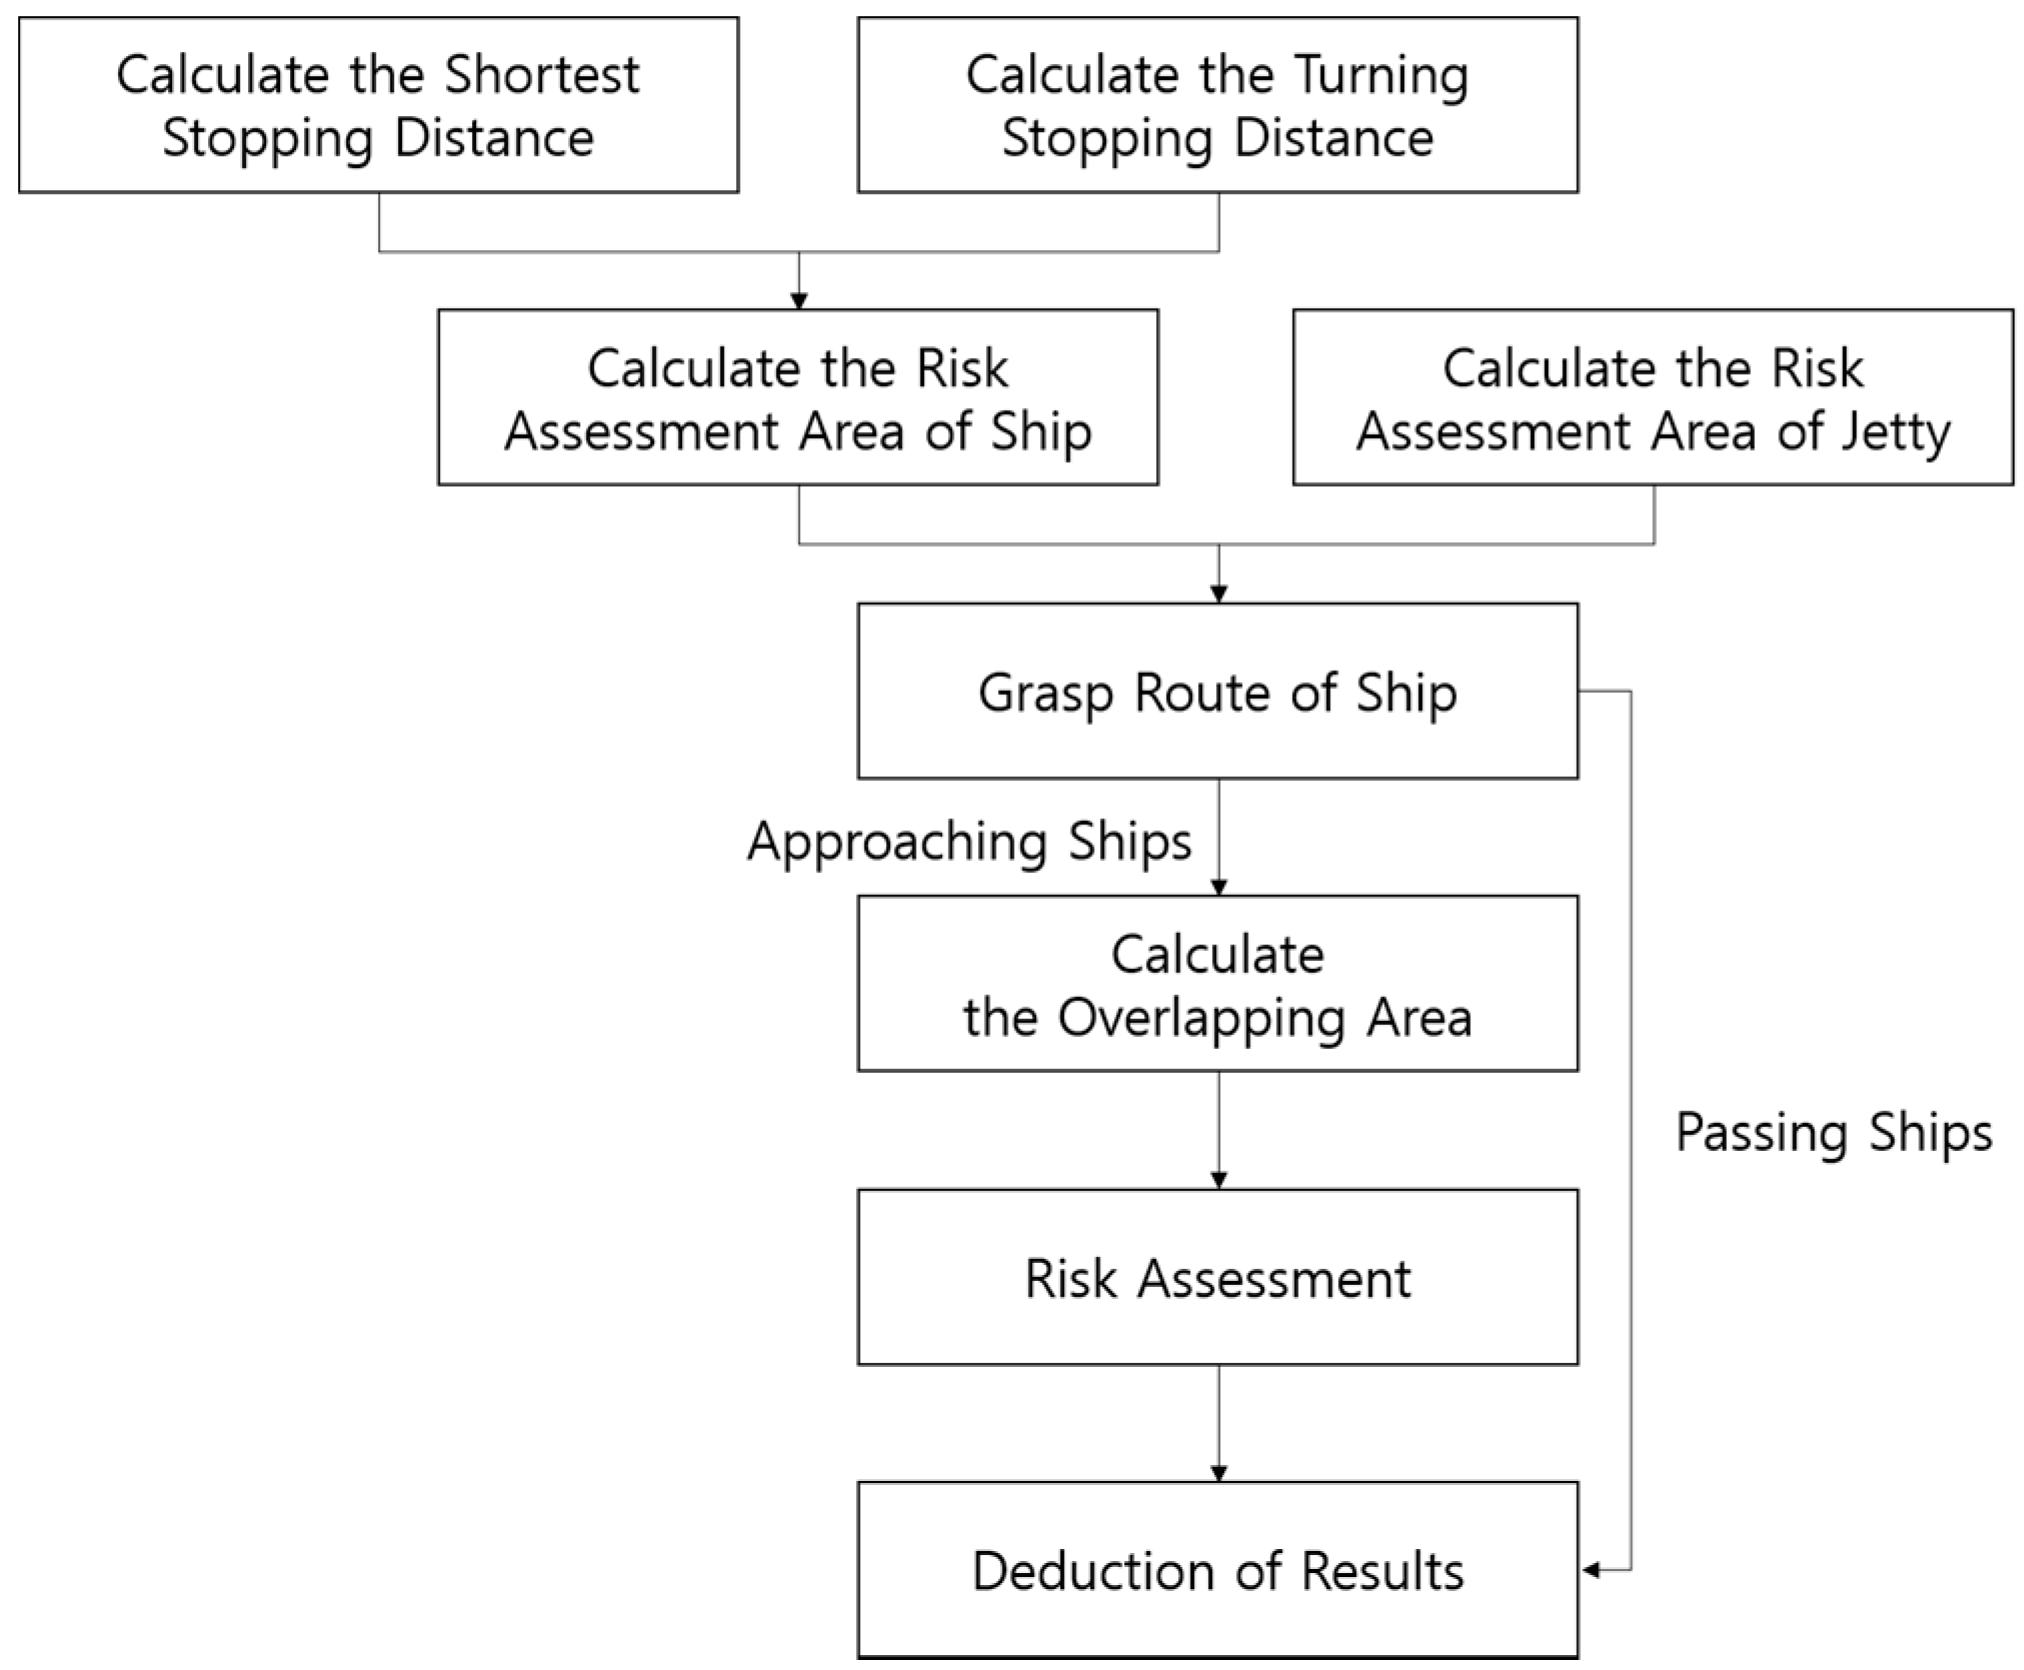
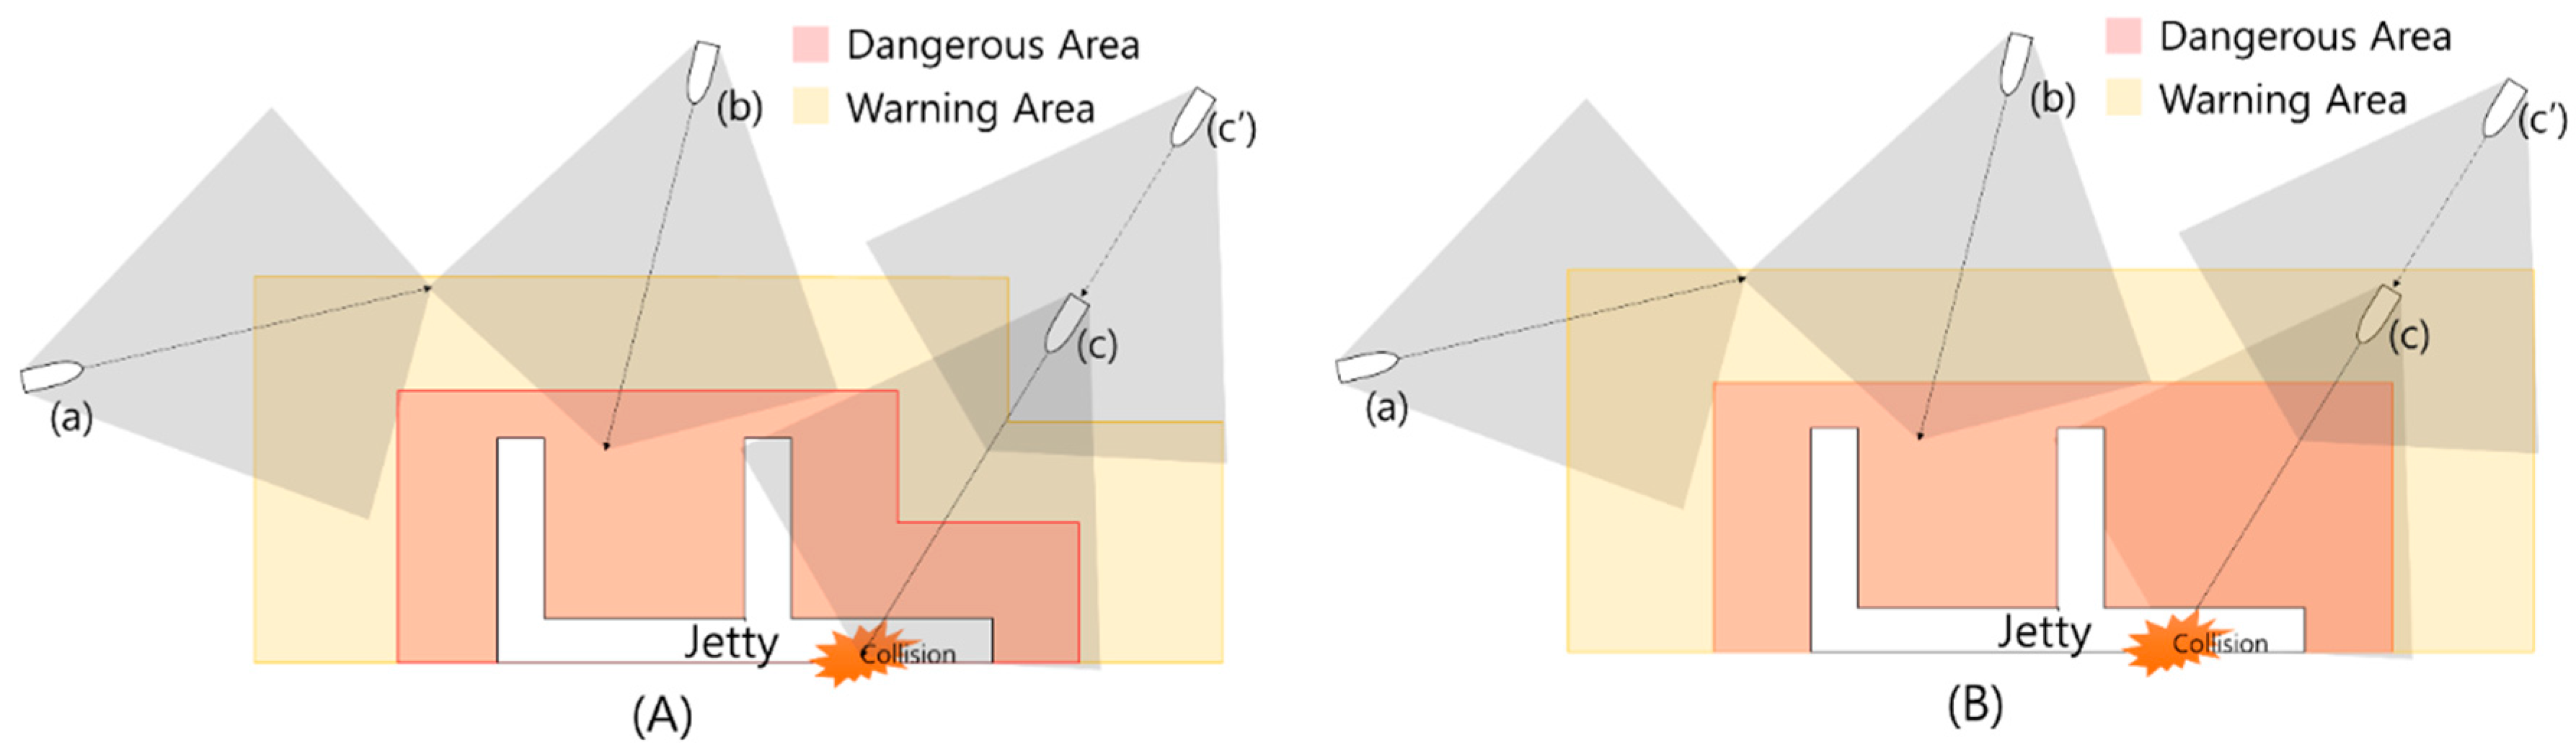
4. Risk Calculation Process

Risk assessment is performed according to the process shown in Figure 5. First, the shortest stopping distance and turning stopping distance are calculated by using AIS data for ships obtained in real time. The risk based area for a ship is then calculated using the two stopping distances, and that for a jetty is calculated considering the relevant conditions. Second, the overlap between the risk based areas of the ship and jetty is calculated. Finally, collisions between the ship and jetty are predicted by assessing the size of the overlapping risk based area, and the results are displayed.
Figure 5. Risk calculation process.
Sustainability 07 13154 g005
Figure 6 shows a collision state according to the overlap between the risk based areas for the ship and jetty. The amount of overlap varied according to the shape of the risk based areas. The risk based area for the jetty was set as rectangular and the shape of a pier. However, if the risk based area for the jetty was set as jetty-shaped, as shown in Figure 6A, a situation in which the miss occurred in the collision prediction same as (c’) in Figure 6A. In this case, because the collision warning shown in Figure 6A occurs later than that shown in Figure 6B, the probability of an accident is increased. Additionally, the response for the accident can occur a considerable amount of time after the accident, as in (c) in Figure 6B. Therefore, we set the risk based areas for the jetty as rectangular, as shown in Figure 6B.
Figure 6. Risk assessment for the collision according to the route and location of a ship, jetty-shaped risk based areas (A); and rectangular risk based areas (B).
Sustainability 07 13154 g006
The risk is assessed by calculating area of overlap between the risk based areas of a ship and a jetty. Ships have a variety of purposes, including sailing, passing near a jetty, and approaching a jetty. Accordingly, if a system monitors dozens to hundreds of ships operating near a jetty and the collision warning alerts are abused, the system administrator may be confused. Therefore, we classified the ships by their direction of movement to avoid collision warning alert abuse. The ships were classified into two: those passing near the jetty instead of heading for the jetty, as indicated by (a) of Figure 6B; and those approaching the jetty, as indicated by (b) and (c’) of Figure 6B. Risk assessment was performed for ships heading toward the jetty, excluding the ships passing near the jetty. If a collision warning alert about ships approaching the jetty occurs, the collision warning alert is similarly abused. Therefore, the velocity of the ship was used to avoid the abuse of the collision warning alert. Ships are subject to the regulation speed when operating near the jetty. The regulation speed follows the rules of the IMO STCW or the marine pilots association. The warning alert is for when ships exceeding the regulation speed approach the jetty. After the ships to be monitored were classified, the risk assessment was performed. The risk was assessed by judging the area of overlap between the risk based areas of the ship and the jetty. Because the overlap area depended on the risk based area of the jetty, the boundary of the risk based area of the ship—including the stopping point—was used to calculate the overlap area. Prior to performing a risk assessment, the turning boundary line connecting points of the port and starboard stopping distance was defined. Figure 7 presents a holistic view of the overlap-area assessment for clarity. The warning alert was set when the boundary of the risk based area for the ship touched that of the warning area of the jetty, as shown in (a’) of Figure 7, or immediately before the boundary of the risk based area for the ship touched the boundary of the dangerous area for the jetty, as shown in (a) of Figure 7. The warning alert represents a low collision probability, but caution is required. The danger alert was set when the boundary of the risk based area for the ship touched the boundary of dangerous area for the jetty, as shown in (b’) of Figure 7, or when the ship could turn in one direction (port or starboard) or avoid a collision by going full astern. The danger alert represents a high collision probability, but it is possible to prevent a collision through a quick response. Finally, when the boundaries of the risk based areas of a ship and a jetty intersect, the state is set to collision, as shown in (c) of Figure 7. That is, when the boundary of a jetty and a turning boundary line intersect and the boundary of a jetty and the shortest stopping distance line also intersect, a collision between the ship and the jetty occurs.
Figure 7. Risk assessment for a collision according to boundaries of risk based areas of a ship and a jetty; (A) represents the warning alert state, (B) represents the danger alert state, and (C) represents the collision state.
Sustainability 07 13154 g007

5. Configuration of the Safety-Monitoring System for a Jetty
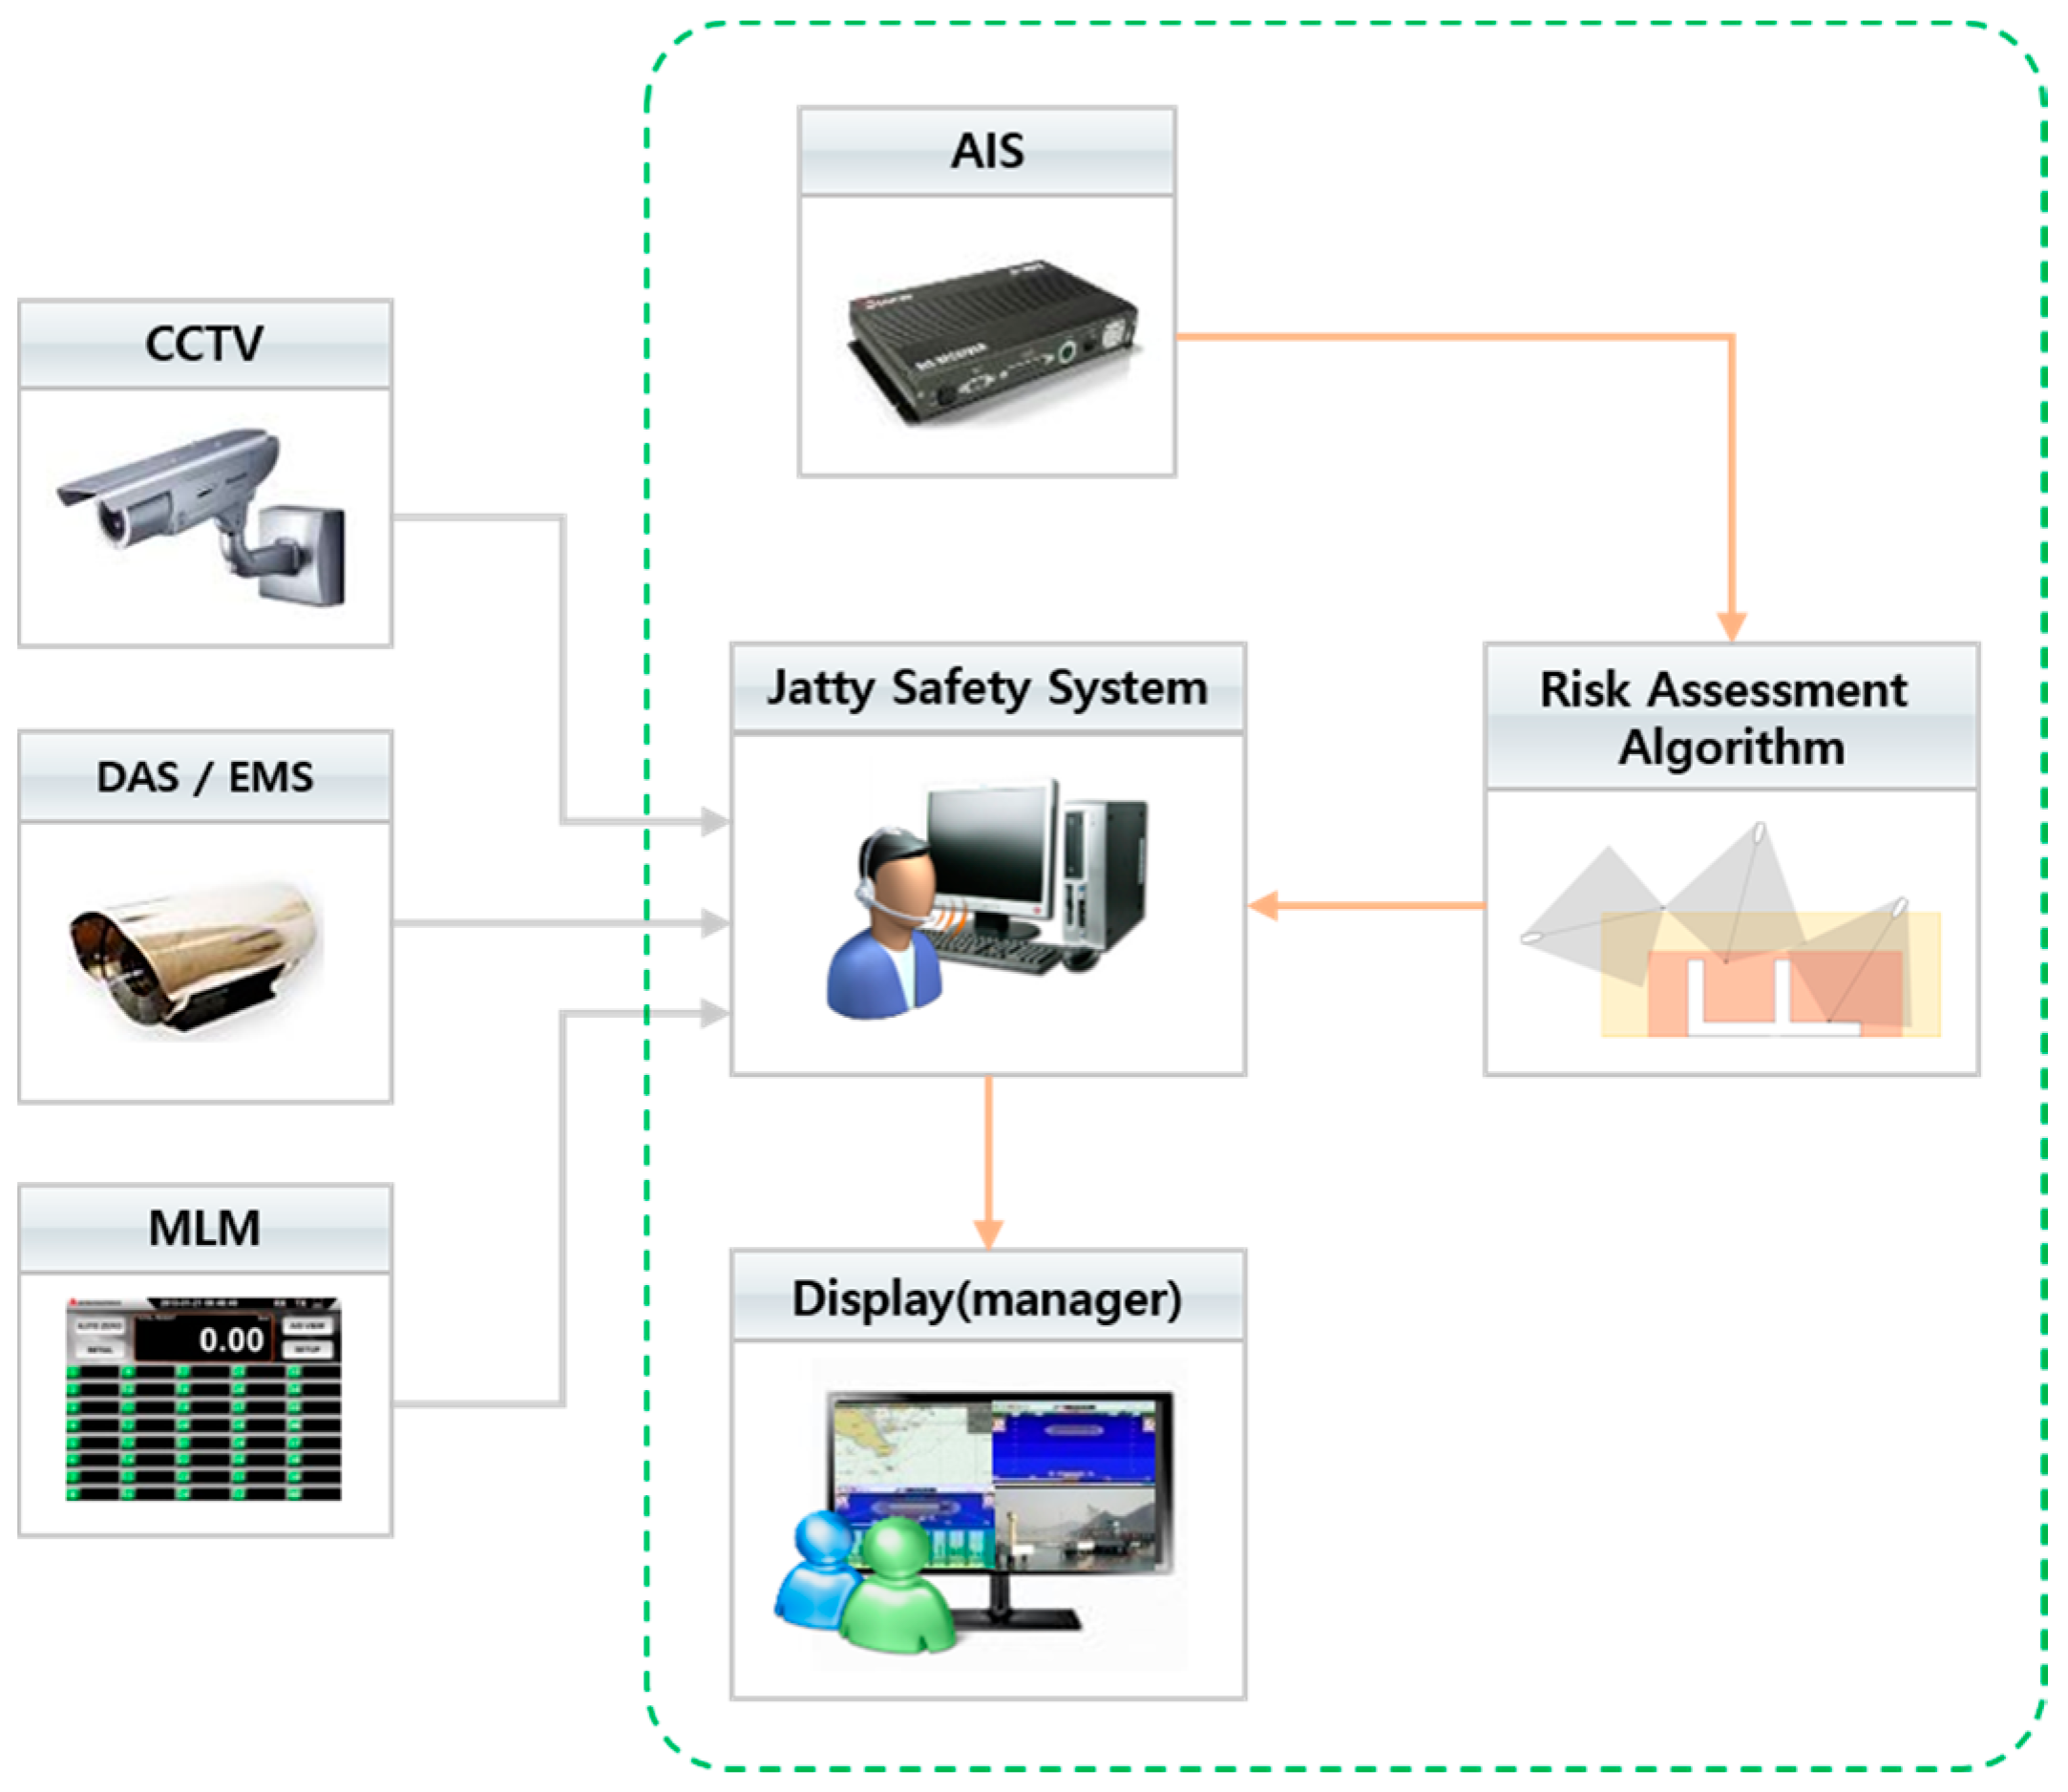
This paper suggests a jetty safety-monitoring system that consists of AIS for obtaining navigation information, a module for risk assessment, and a display for presenting the results. Figure 8 shows a jetty safety-monitoring system configuration applying the risk calculation method.
Figure 8. Configuration of a jetty safety-monitoring system using the risk calculation method.
Sustainability 07 13154 g008
AISs are capable of two-way data communication between ships or between a ship and land. They automatically transmit and receive information related to the cargo, ship specification, and navigation information. One such system was adopted in December 2000 by the IMO. Through the maritime mobile service identity of ships and the control method using the navigation information, AISs have been used as a precautionary measure for preventing ship collisions by identifying the ships [25]. As shown in Table 3, the information provided by the AIS consists of static information, dynamic information, navigation information, and text communications [26]. In this study, data comprising the ship specification, location, and velocity was obtained from the AIS equipment. The risk based area of the ship and jetty were calculated according to the risk based area methodology described in Section 3 and Section 4 using the acquired data. Whether a collision could occur was then determined by evaluating the degree of overlap of each area through a risk calculation process. Ultimately, the result derived from the risk calculation method was applied to the pier safety-monitoring system and expressed on a jetty control monitor.
Table 3. Information provided by AIS.
DivisionContents of Information
Static informationName of ship, IMO registration number, call sign, kind of ship, ship specification (length, depth, width, etc.), location of antenna
Dynamic informationShip location, course over the ground (COG), velocity, heading of ship, navigation state, rate of turn, angle of inclination
Navigation informationShip draft, hazardous cargo, destination, estimated time of arrival, route planning
Notification lettersImportant sailing or weather alerts

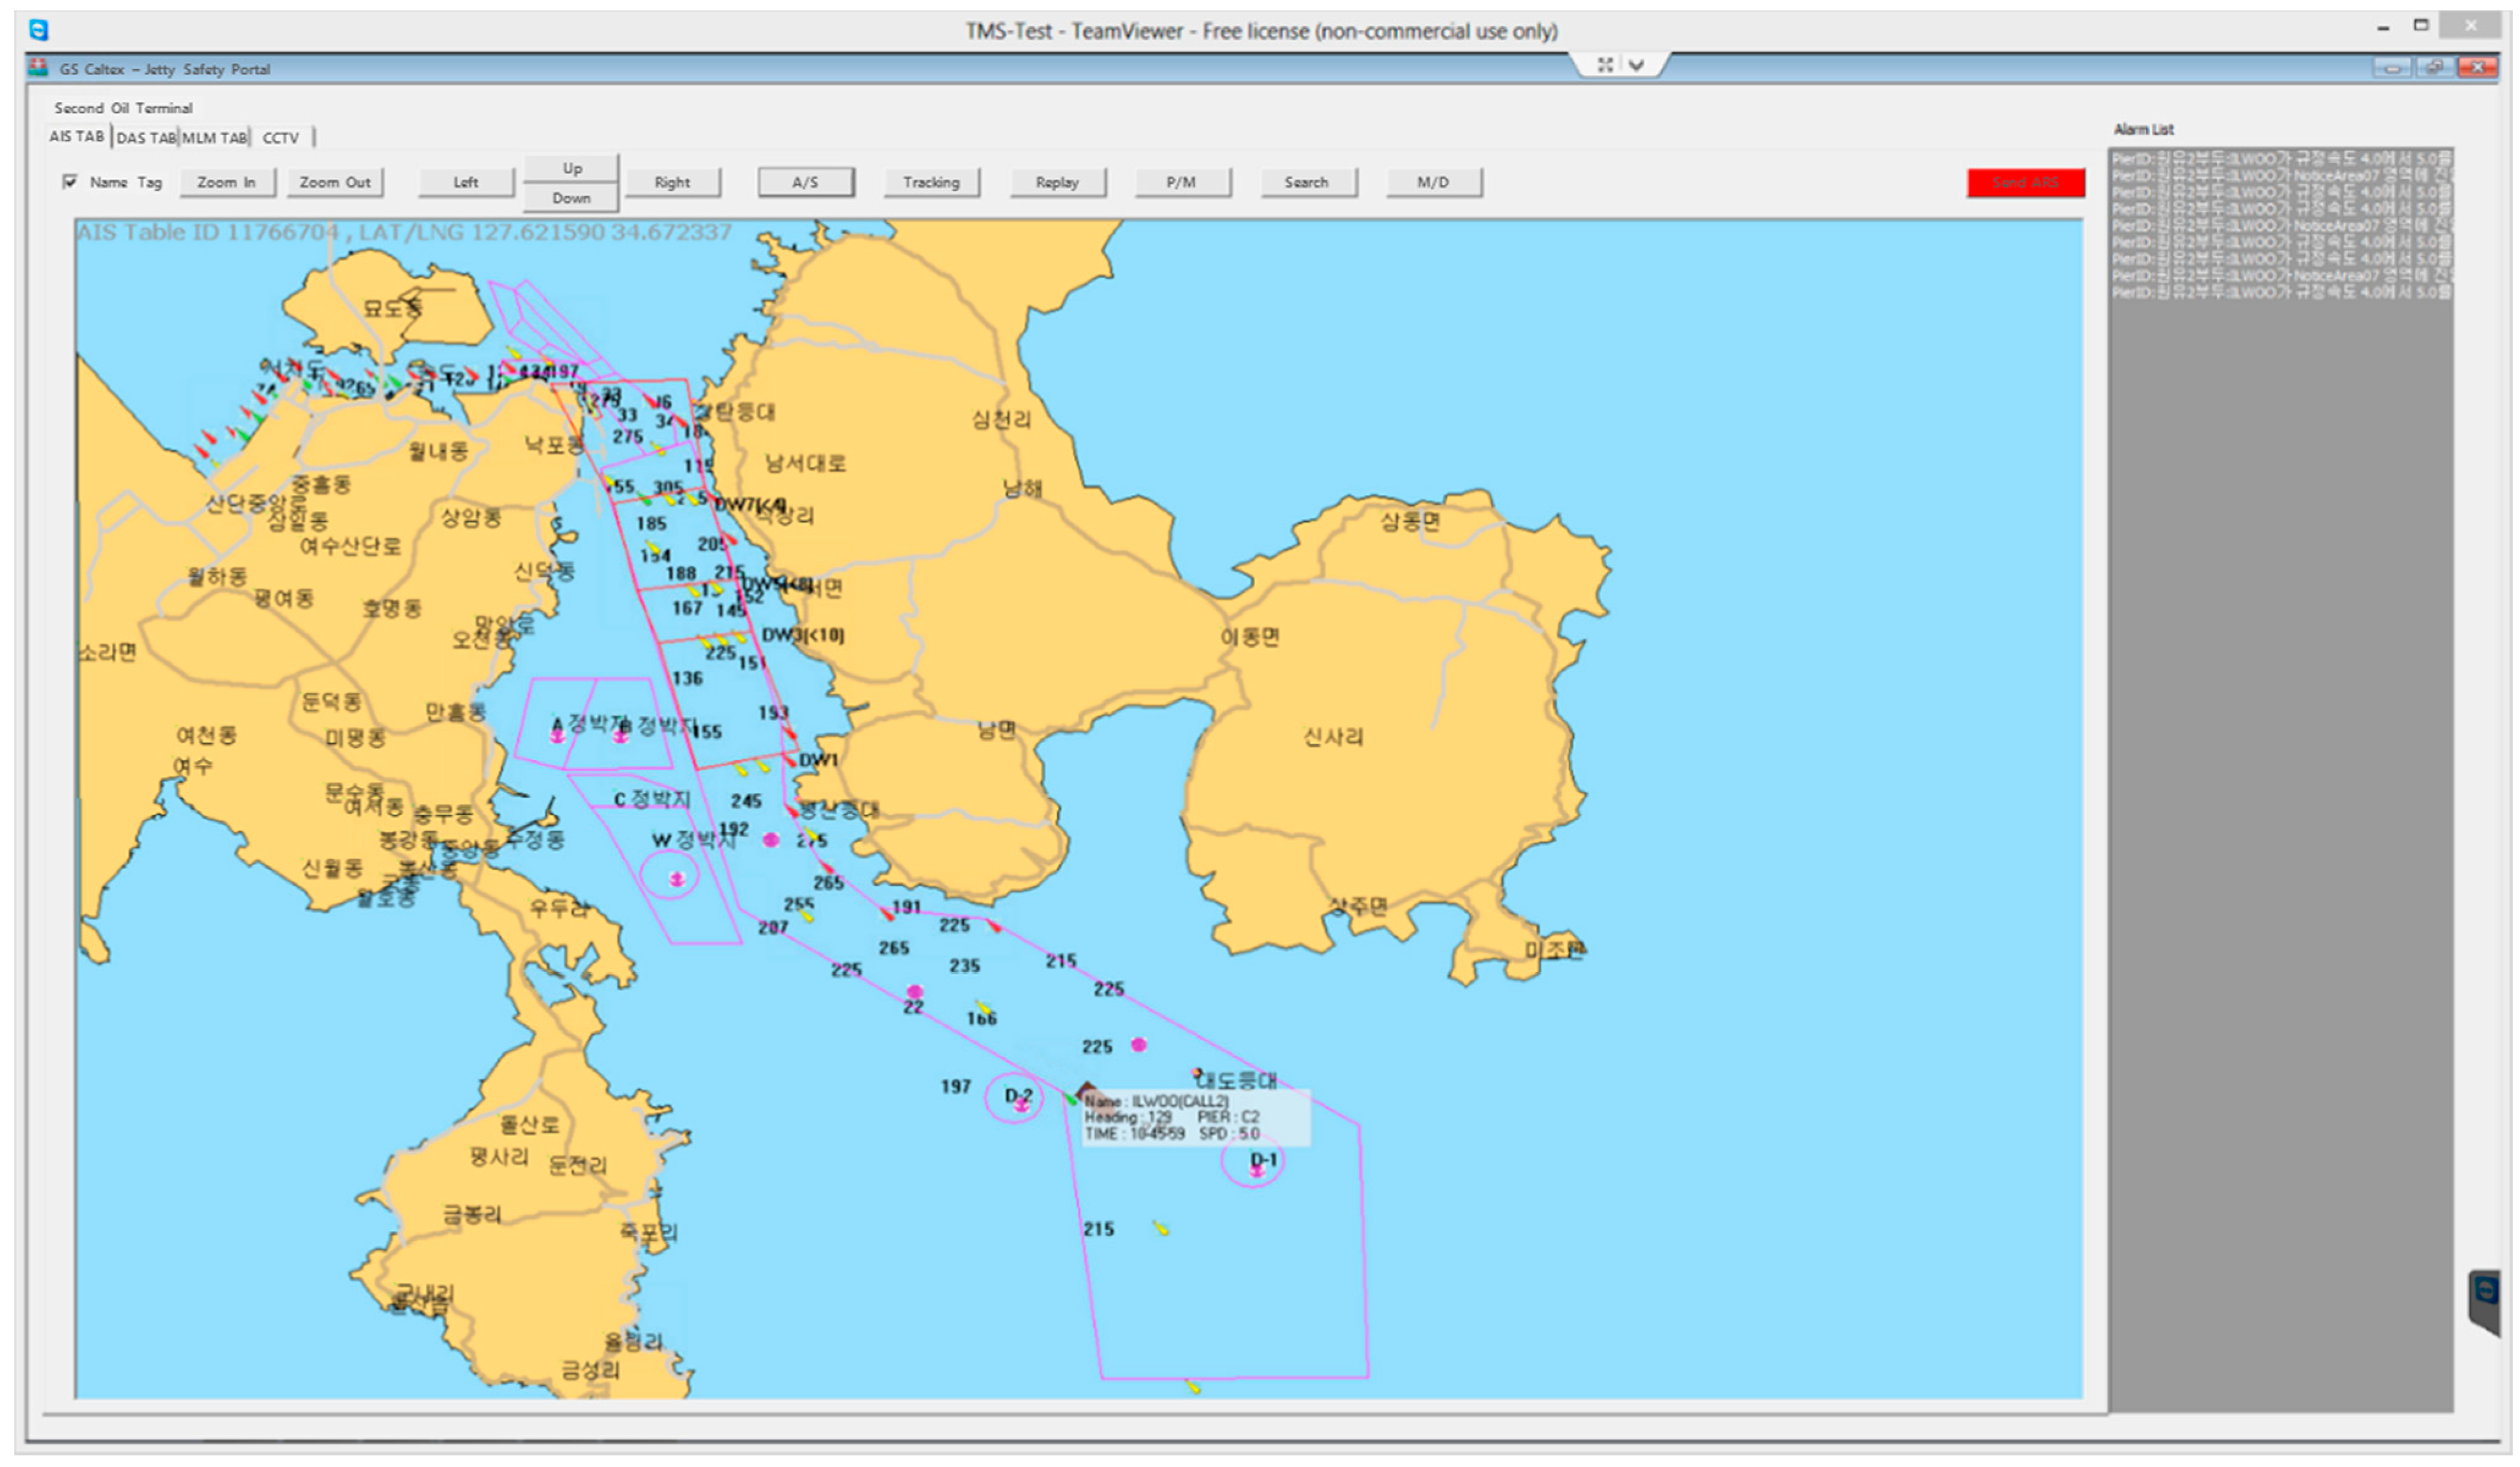
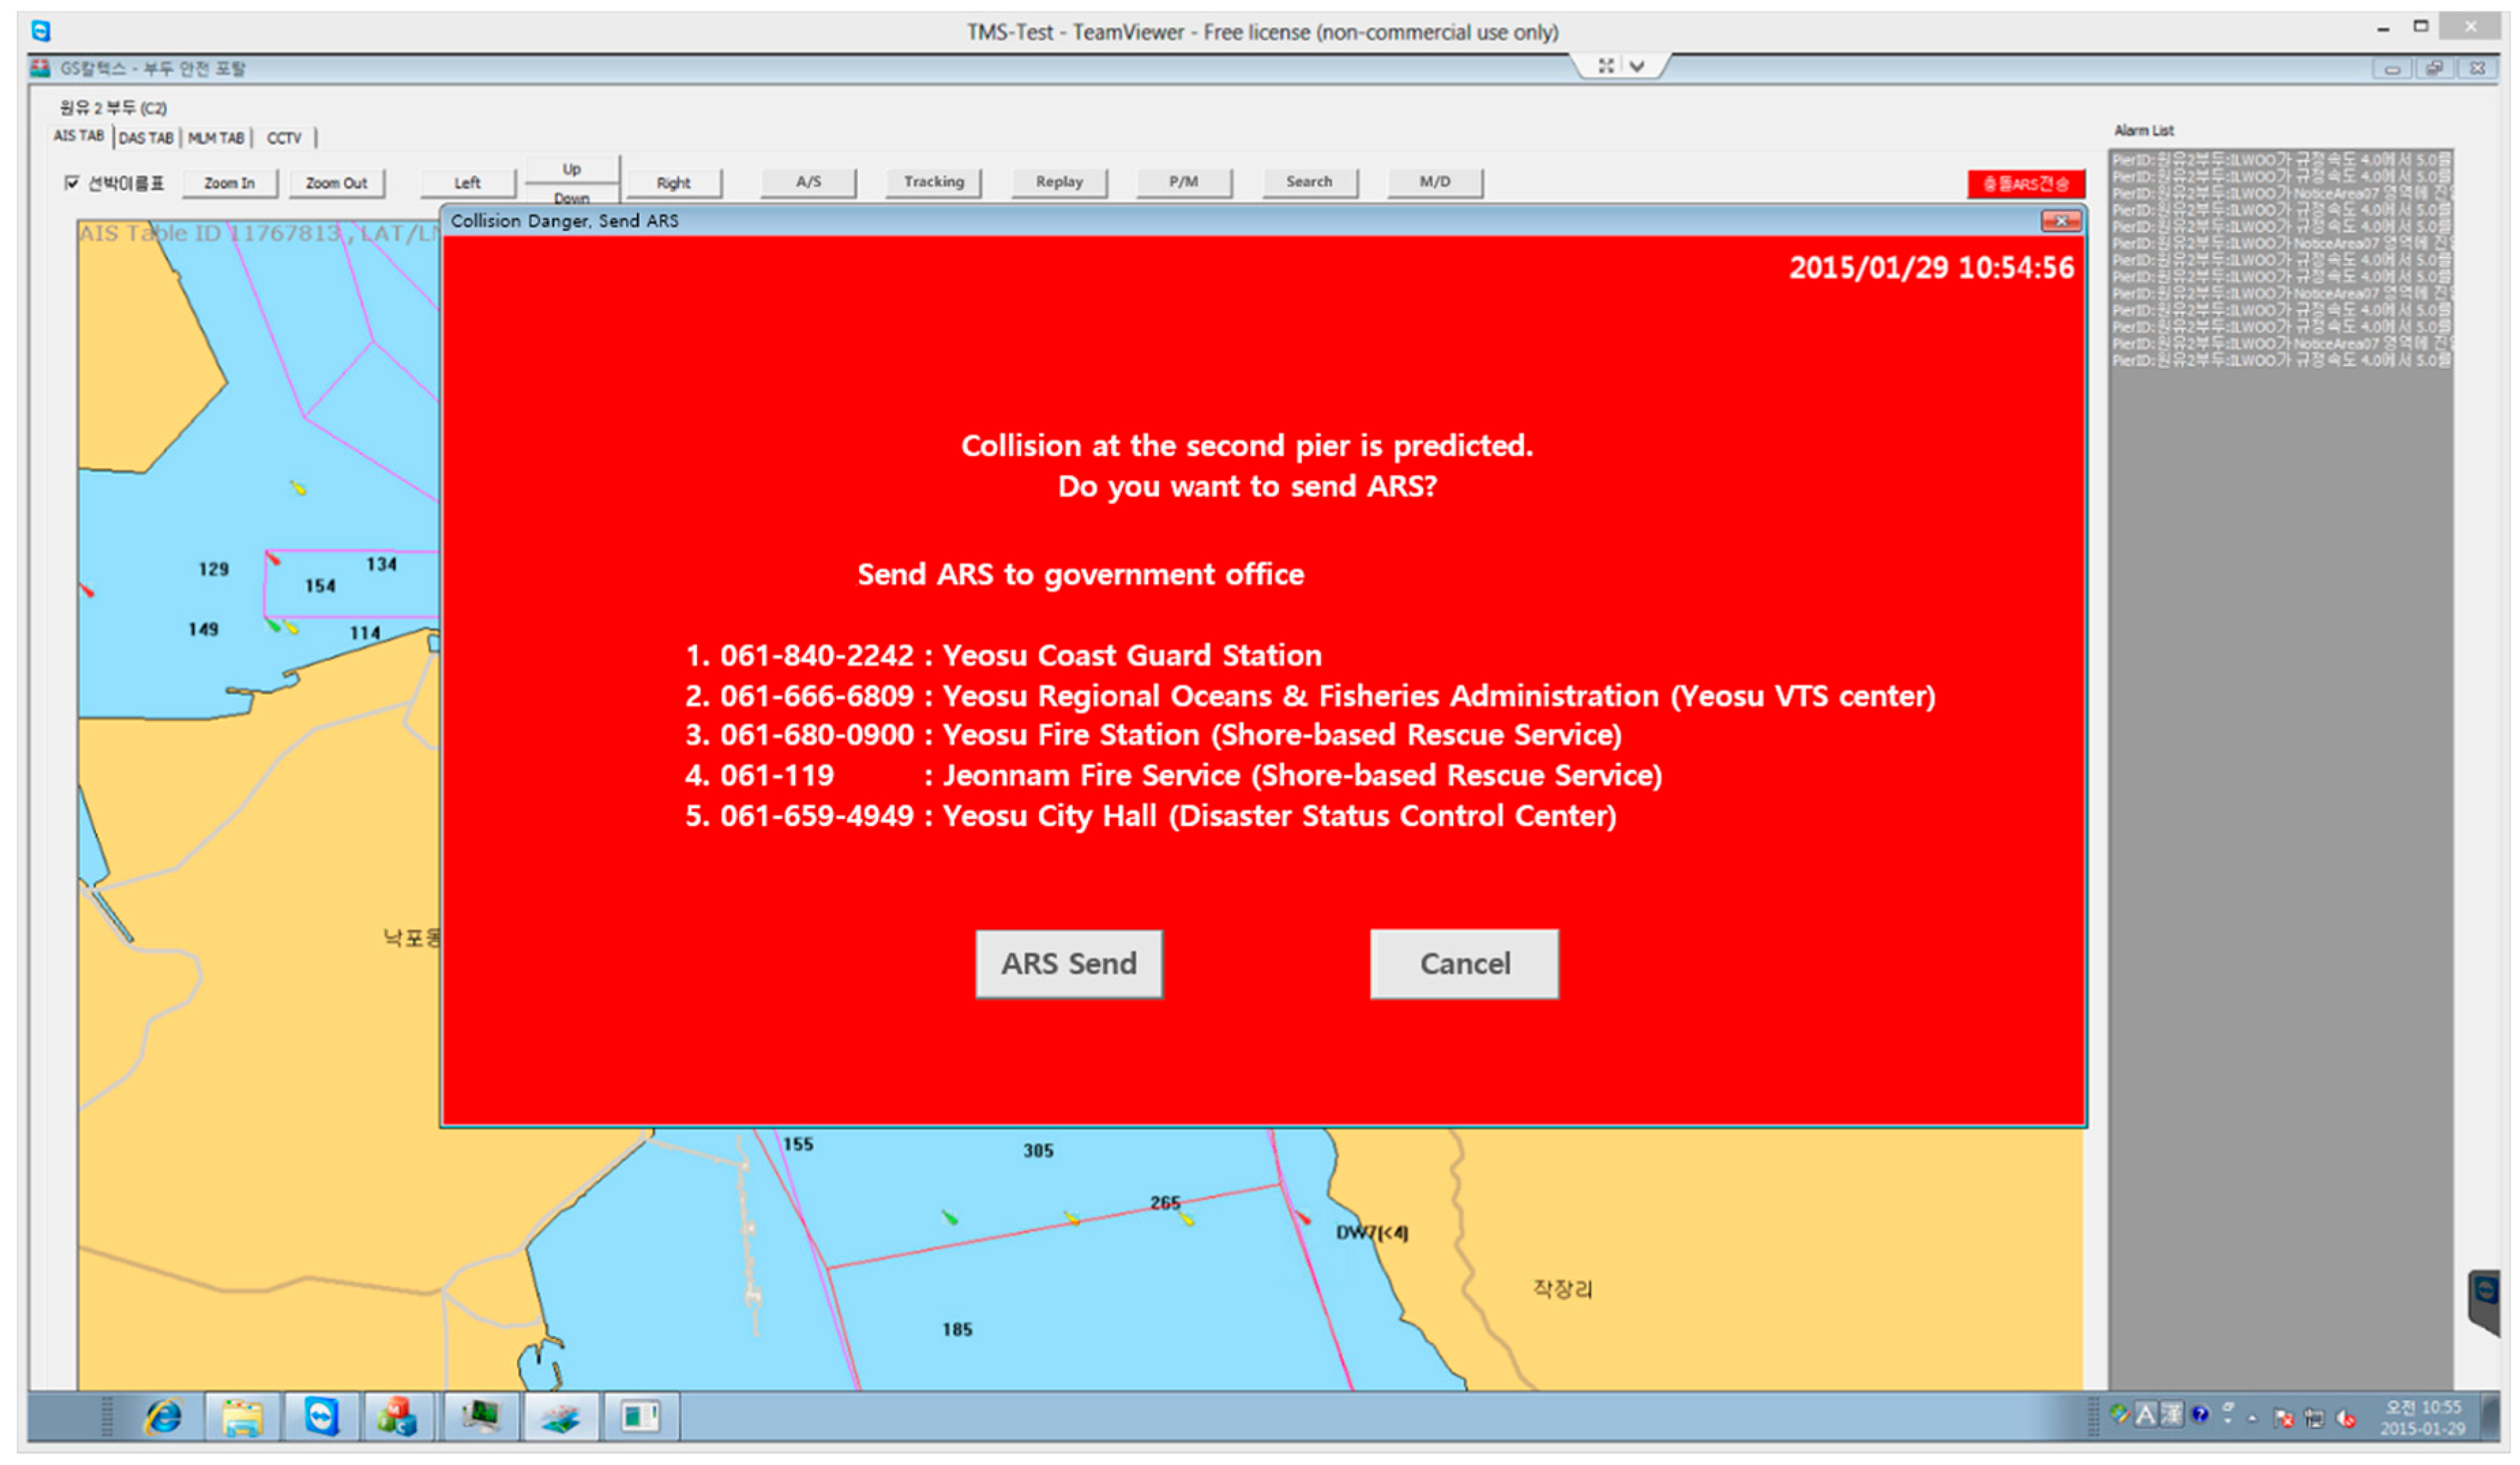
6. Realization of the Safety-Monitoring System for a Jetty

A prototype of the jetty safety-monitoring system applied to the risk calculation method is shown in Figure 9. The prototype was first applied to the second oil pier of GS Caltex; a map of the system was also implemented for the second oil pier. Pier traffic regulations and the jetty were considered in order to set up the risk based area for the jetty. As shown in Figure 10, the risk based area for the second oil pier was divided into four areas: 6 knots, 4–10 knots, 10–12 knots, and greater than 12 knots. The shortest stopping distance and turning stopping distance were calculated using the velocity and the direction of movement of the ship at the position acquired from the AIS. The risk based area calculated using the two stopping distances was overlaid on the map.
Figure 9. Map screen of the realized risk based area of the ship and jetty.
Sustainability 07 13154 g009
Figure 10. Map screen of the realized risk based area of the ship and jetty.
Sustainability 07 13154 g010

7. Test and Verification

The risk calculation method developed in this study was applied to the pier safety-monitoring system of the second GS Caltex oil pier. The test was conducted by targeting ships passing near the pier, approaching, and berthing. While testing the data for sailing ships, dozens to hundreds of ships passed near the pier. Accordingly, to determine the accuracy of the method, the test was conducted by intensively monitoring a ship whose purpose was to approach and berth at the pier. Figure 10 shows a screen that displays information about the ship as the object and monitors the movement of the object.
As the ship approached the pier, if it was located in the risk based area of the jetty set in accordance with the regulation velocity, or if a collision between the ship and the jetty was to be expected, a warning message was output. When a collision between the ship and the jetty was expected, the warning message shown in Figure 11 was displayed. This test was duplicated for many regions within the risk based area. The warnings are sent by a user. With a minimum of preventive measures to handle any warning generated by a system error, after the approval of the user at the jetty monitoring center, the warning system sends an alert.
Figure 11. Collision warning message for the realized risk based area.
Sustainability 07 13154 g011
A prototype was developed using a risk calculation method and applied to the monitoring system of the second oil pier at GS Caltex. A test demonstrated the effectiveness of the risk calculation method for the pier safety-monitoring system. Compared with the existing system, the collision-prediction system introduced in this study improved the safety-monitoring method.

8. Conclusions

In this study, we introduced the concept of the risk based area, which is distinct from the methodology used by previous studies, and suggested a risk calculation method using this concept. The risk based area of ships and jetties was set using the shortest stopping distance, turning stopping distance, and AIS data of ships approaching the pier or passing near the pier. The risk calculation method calculates the overlapping area of risk based area through a risk calculation process. Finally, this method is used to determine whether or not a collision will occur between a ship and jetty. We developed a prototype using this method and applied the prototype to the second oil pier at GS Caltex. The effectiveness of the system was demonstrated by testing when ships are approaching and passing the pier. We confirmed an improvement in the collision-prediction capability of the jetty safety-monitoring system compared with existing systems. Because the method proposed in this paper was designed to be adaptable to the individual characteristics of a pier, it is expected to be easy to implement. Ultimately, applying this method to each jetty is expected to improve jetty safety monitoring.

Acknowledgments

This work was supported by the Industrial Strategic Technology Development Program (10041790) funded by the Ministry of Knowledge Economy (MKE, Korea) and INHA research grant.

Author Contributions

Byeong-Wook Nam, Jung-Min Lee, Dae-Soek Kim, Bon-Jae Ku, Runqi Li, and Seong-Sang Yu conducted the research and wrote the paper. Kyung-Ho Lee was the thesis supervisor. All authors provided guidance, revision, and feedback.

Conflicts of Interest

The authors declare no conflicts of interest.

References

  1. Korea Maritime Institute Editorial department. Shipping Statistics Handbook 2010; Korea Maritime Institute: Busan, Korea, 2010; pp. 357–367.
  2. Cho, D.O. A study on port safety management between Korea and Japan. Ocean Policy Res. 2003, 18, 97–122. [Google Scholar]
  3. Anderson, D.E.; Oberman, F.R.; Malone, T.B.; Baker, C.C. Influence of Human Engineering on Manning Levels and Human Performance. Navig. Eng. J. 1997, 109, 67–76. [Google Scholar] [CrossRef]
  4. Perera, L.P.; Carvalho, J.P.; Soares, C.G. Autonomous guidance and navigation based on the COLREGs rules and regulations of collision avoidance. In Proceedings of the International Workshop on Advanced Ship Design for Pollution Prevention, Split, Croatia, 23–24 November 2009.
  5. Lenart, A.S. Manoeuvring to required approach parameters—CPA distance and time. Annu. Navig. 1999, 1, 99–108. [Google Scholar]
  6. Ren, Y.; Mou, J.; Yan, Q.; Zhang, F. Study on Assessing Dynamic Risk of Ship Collision. In Proceedings of the Study on Assessing Dynamic Risk of Ship Collision (ICTIS 2011), Wuhan, China, 30 June–2 July 2011.
  7. Bukhari, A.C.; Tusseyeva, I.; Lee, B.G.; Kim, Y.G. An intelligent real-time multi-vessel collision risk assessment system from VTS view point based on fuzzy inference system. Expert Syst. Appl. 2013, 40, 1220–1230. [Google Scholar] [CrossRef]
  8. Simsir, U.; Amasyali, M.F.; Bal, M.; Celebi, U.B.; Ertugrul, S. Decision support system for collision avoidance of vessels. Appl. Soft Comput. 2014, 25, 369–378. [Google Scholar] [CrossRef]
  9. Chin, H.C.; Debnath, A.K. Modeling perceived collision risk in port water navigation. Saf. Sci. 2009, 47, 1410–1416. [Google Scholar] [CrossRef] [Green Version]
  10. Goerlandt, F.; Montewka, J.; Kuzmin, V.; Kujala, P. A risk-informed ship collision alert system: Framework and application. Saf. Sci. 2015, 77, 182–204. [Google Scholar] [CrossRef]
  11. Fujii, Y.; Tanaka, K. Traffic Capacity. J. Navig. 1971, 4, 543–552. [Google Scholar] [CrossRef]
  12. Goodwin, E.M. A statistical study of ship domains. J. Navig. 1975, 28, 328–344. [Google Scholar] [CrossRef]
  13. Mazaheri, A.; Goelandt, F.; Kujala, P.; Montewka, J. A Decision Support Tool for VTS Centers to Detect Grounding Candidates. Int. J. Mar. Navig. Saf. Sea Transp. 2012, 6, 337–343. [Google Scholar]
  14. Kim, D.H.; Park, J.Y.; Lee, Y.S. A Study on the Development of Integrated Information System of Safety Management for Oil Tank Terminal; Korean Society of Marine Environment & Safety: Busan, Korea, 2014. [Google Scholar]
  15. Kim, D.J.; Ahn, K.S.; Lee, T.I.; Kim, Y.W. Development of Collision Avoidance Supporting System Based on ECDIS; Korean Institute of Navigation and Port Research: Busan, Korea, 2013. [Google Scholar]
  16. Lee, J.E. A Study on the Road Tunnel Lighting System Appied Fuzzy Reasoning and Dimming Control. Ph.D. Thesis, Hongik University, Seoul, Korea, 2015. [Google Scholar]
  17. Baldauf, M.; Mehdi, R.; Deeb, H.; Shröder-Hinrichs, J.U.; Benedict, K.; Krüger, C.; Fischer, S.; Gluch, M. Manoeuvring areas to adapt ACAS for the maritime domain. Sci. J. Marit. Univ. Szczec. 2015, 43, 39–47. [Google Scholar]
  18. Montewka, J.; Goerlandt, F.; Kujala, P. Determination of collision criteria and causation factors appropriate to a model for estimating the probability of maritime accidents. Ocean Eng. 2012, 40, 50–61. [Google Scholar] [CrossRef]
  19. Göhler, U.D. Estimation of Expectation Areas of Ships considering resistance changes, due to yaw angle and according to Model experiments. Schiffbauforschung 1983, 4, 235–246. [Google Scholar]
  20. Vessel Traffic Service Center. Available online: http://www.vtskorea.info/Board.do?flag=det&id =yeonjae_lecture&cPage=2&idx=51&limit=10&sc=SUBJECT&sv=&cg= (accessed on 26 July 2015).
  21. Wang, H.; Wei, Z.; Wang, S.S.; Ow, C.S.; Ho, K.T.; Feng, B.J.M. A Vision-based Obstacle Detection System for Unmanned Surface Vehicle. In Proceedings of the 2011 IEEE Conference on Robotics, Automation and Mechatronics (RAM), Qingdao, China, 17–19 September 2011.
  22. Incheon Port Marine Pilot’s Association. Available online: http://www.incheonpilot.com/main/main.asp (accessed on 26 July 2015).
  23. Pyeongtaek-Dangjin Port Marine Pilot’s Association. Available online: http://www.ptpilot.co.kr/pilotage/pilotage_08_06_01.aspx (accessed on 26 July 2015).
  24. Standards of Training, Certification & Watchkeeping. Available online: http://www.stcw.org/ (accessed on 25 August 2015).
  25. Kim, C.J.; Song, J.U.; Kim, C.H. A Study on the Development of the Module for Remote-Controlling Aids to Navigation. J. Korean Navig. Port Res. 2002, 26, 269–273. [Google Scholar]
  26. Seo, M.H. Service Implementation for the AIS Information and Maritime Safety Information in the Internet. Master’s Thesis, Mokpo National Maritime University, Mokpo, Korea, 2012. [Google Scholar]

