1. Introduction
ATIS (Advanced Traveler Information Systems) can provide drivers with real-time traffic information, pre-trip and en-route. The levels of details provided by real-time traffic information, including types and amount, definitely influence drivers’ travel behavior. Although many studies have focused on drivers’ behaviors in response to real-time traffic information [
1,
2,
3,
4,
5,
6,
7,
8,
9], little research has been focused on the issues related to “customized” real-time traffic information (CRTTI). Jou and Chen [
10] modeled freeway drivers’ demand for four different types of CRTTI under three different types of traffic flows along main freeways and alternative routes using a bivariate ordered probit model. The results indicate that in the choice of CRTTI, drivers with a stronger demand for information about main routes also have a relatively high demand for information about alternative routes. In that paper, although using the same dataset, the scope and methodology applied are different from the current one. In the previous paper, bivariate ordered probit models were estimated to investigate factors that significantly influence the demand for traffic information both for main freeways and secondary alternative routes. In the current one, Spike models were used to calculate the WTP for different traffic information. It shall be noted that the WTP information in Table 5 from a previous paper was directly obtained by asking the respondents (not estimation results). The important issue of how much the drivers are willing to pay for their preferred CRTTI is still under-explored in the previous paper.
Chung [
11] indicates that customized information will become more personalized and will be transferable via in-vehicle computers or personal mobile devices. For examples, private companies or public departments in the United States and the United Kingdom have offered drivers the opportunity to receive real-time traffic information according to their specific requests. Although many technologies can provide CRTTI, in-vehicle navigation systems are our main focus in this study. In addition, freeway drivers’ willingness to pay (WTP) for the following four types of CRTTI are investigated: they are basic information (“basic information” included information about the free flow speed, weather conditions, traffic control, road construction, traffic accidents, and road sections with pits or objects fallen from vehicles), dynamic travel time information, dynamic travel time delay information and navigation support information. A computer-aided survey was designed and then conducted with freeway drivers in Taiwan using face-to-face interviews in rest areas. A framework known as the contingent valuation method (CVM) was employed as a means of investigating the drivers’ willingness to pay for CRTTI.
CVM is a stated preference method, which has been widely used to reveal information about values associated with public and non-market goods. As individual preferences for the provision of non-priced goods and services are not readily determined from observable behavior, CVM is a useful tool to allow values to be associated with such goods and services [
12]. It involves creating a hypothetical market by asking people how much they would be willing to pay (WTP; Readers interested in WTP approaches can refer to Bengochea-Morancho
et al. [
13], Hu [
14], and Saz-Salazar and Garcia-Menendez [
15] for detailed modeling formulations) for a non-priced good. If the respondent rejects a series of questions, a case of “protest” zeroes will result [
16]. Since it is difficult to recognize whether the respondent’s response equals to zero (
i.e., they are not prepared to pay any money to obtain the outcome) under a CVM approach, Kristroöm [
17] proposed the “Spike model” to deal with zero bids. The utility of Spike models was confirmed by Yoo and Kwak [
18], who suggested that Spike models can reduce statistical bias. Spike models are a particularly appropriate method for data with a high proportion of zero bids [
13,
18,
19,
20,
21,
22].
The rest of this paper is organized as follows.
Section 2 presents the Spike models.
Section 3 describes the questionnaire design and presents data analysis results, followed by
Section 4 which presents the empirical findings. The final section offers conclusions and suggestions.
2. Model Framework
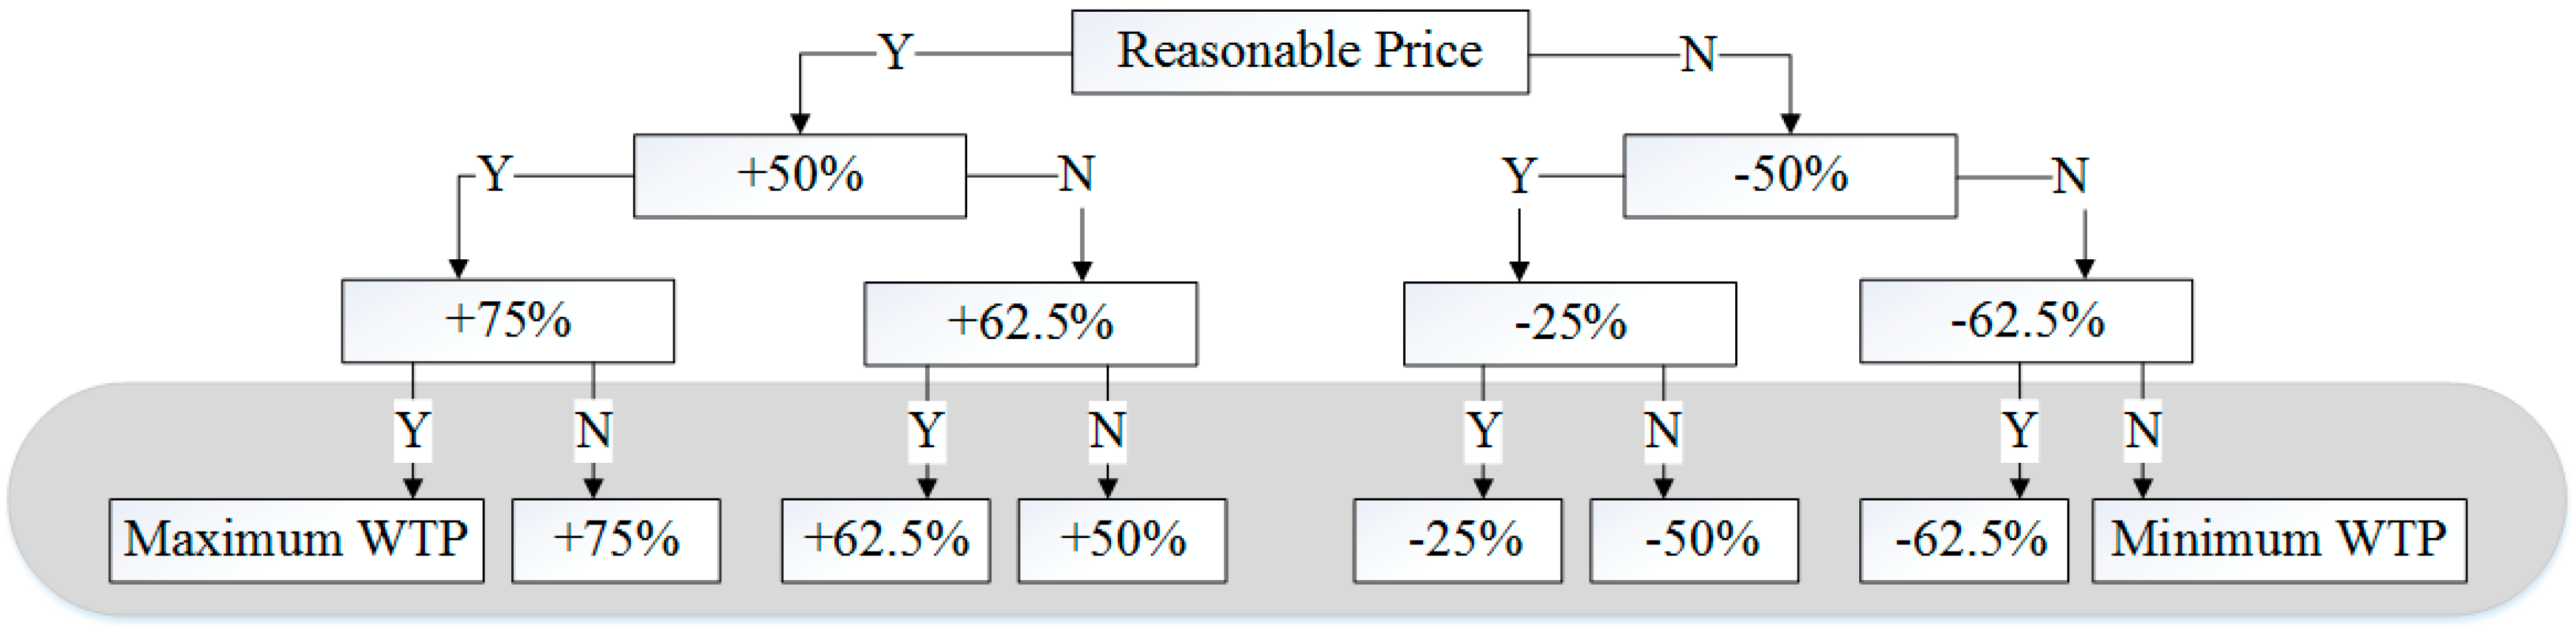
This study used DBDC (Double-Bounded Dichotomous Choice, proposed by Hanemann [
23] contingent valuation questions in a survey to determine drivers’ willingness to pay for CRTTI. A copy of DBDC questions used can be found in the
Appendix A. Substantial amount of the responses (16% in our study) were “zero bids” (where drivers are not willing to pay for CRTTI) and, thus, the Spike model is an appropriate method to estimate the WTP. The individual’s utility function can be written as:
where
is systematic utility and
is idiosyncratic utility, respectively When a driver is willing to pay for CRTTI
: the bid, the unit of bid is the charge for CRTTI per access and per period of time. The period of time for accessing CRTTI depends on the pricing policy of the government or company), it means that driver prefers the new alternative (
) to the current alternative (
), and we can have Equation (2):
where
is the driver’s disposable income,
is a vector of socio-economic characteristics, Q is a vector of the real-time traffic information preference related variables.
and
are random terms with independent and identical (iid) Gumbel distributions. We can derive the probability that the driver accepts bid
) for obtaining CRTTI as follows:
Thus, if the bid (
) displayed in the scenario is lower than the driver’s WTP for CRTTI, then the driver will accept the price to use CRTTI. The probability that driver is willing to pay for CRTTI can be derived as Equation (4).
where
is the cumulative distribution function (c.d.f.) for the driver who is not willing to pay the price (
) and use CRTTI. The domain of the cumulative distribution function can be expressed as in Equation (5).
P belongs to the domain (0,1) and is a continuous and increasing function, such that and .
Furthermore, we can derive the expected WTP using Equation (6).
Bengochea-Morancho
et al. [
13] showed that using the Maximum Likelihood Estimation (MLE) to estimate the parameters of the distribution is more accurate than using the Ordinary Least Squares (OLS) method. The log likelihood function for the sample is then given by Equation (7).
The combination of
and
distinguished three domains: inexistence, existence and acceptance of the WTP bid, where
and
are defined in Equations (8) and (9).
Equation (3) can be further rewritten as Equation (10)
where
Assuming that
is a logistical function,
can be shown as Equation (11).
Furthermore, Equation (5) can be written as Equation (12).
When driver’s WTP for CRTTI is greater than the bid (
) offered in the questionnaire (
), the expected WTP for CRTTI can be expressed as Equation (13).
The Spike value is defined when
and shown as Equation (14).
3. Survey Results
The data were collected through face-to-face interviews conducted at rest areas of national freeways (which are Freeway No.1 and No. 3 in Taiwan) using a computer-aided questionnaire on weekdays (Mon. to Fri.) in 2011. A total of 451 questionnaires were collected, of which 447 were valid. The questionnaire, designed using computer language C#, consisted of three parts, including (1) socioeconomic characteristics; (2) travel characteristics; and (3) contexts of CRTTI.
The analyses of socioeconomic characteristics of the respondents indicate that most of the respondents are mainly male drivers (83%) and aged between 31 and 40 years old (33%). Most of the respondents possessed only one vehicle. Most had received university (37%) or college education (21%), and 56% were married. The percentage difference between respondents who worked flexible hours and those who worked fixed hours was 12.8%. Most of the respondents (56.4%) had fixed working hours. Their average monthly income was concentrated in the range between USD 625 and 1563 (60%) (1 USD = 30 NTD, Bank of Taiwan in March 2013). Finally, 70% of the respondents owned and used the vehicle for their current trip. The sample was compared to the whole drivers’ population (Ministry of Transportation and Communications, 2009) in Taiwan in terms of gender, income and age. Most of the whole drivers’ population are Male (70.9%); they are 44 years old in average; their average monthly income is USD 1200. The result of chi-square test indicates the gender distributions of the sample and the whole drivers’ population in Taiwan are significantly different, and the t tests display the difference in income and age between the sample and the whole drivers’ population. It should be noted that although the sample did not reflect the characteristics of the general driving population, there was no obvious reason for any systematic biases to exist. Nevertheless, care should be exercised when generalizing the results of this study.
The results of travel characteristics indicate that most of the respondents used national freeways for business (44%) and leisure (35%) purposes. Seventy-two percent of them were either “familiar” or “fully familiar” with route conditions. In their experience with national freeways, traffic conditions were mostly “smooth” (53%) and “very smooth” (27%). When asked about the frequency with which they used national freeways, about 78% stated that they used them at least once per month while only 14% said they used them at least once per day. It can be inferred from these results that while most freeways drivers in the sample used freeways on a regular basis, they may be unfamiliar with detailed and dynamic changes in traffic conditions on freeways. Analysis of respondents’ decisions in the event of traffic congestion yielded a noteworthy result. About 51% of the respondents said that they would take local routes (combining those who said that they “always will” and “usually will”), and about 40% said that they would not. This result shows that the majority of drivers would divert to local routes in the event of congestion on freeways. If provided with CRTTI, a majority of drivers may be more likely to divert to local routes. As a result, both the total travel time of individual drivers and the congestion in the freeways system could be reduced. In terms of familiarity with local routes, only 19% of the respondents were either “unfamiliar” or “very unfamiliar” with local routes, and 30% were “very unfamiliar” with local routes. It can be inferred from these results that a majority of drivers on freeways are willing to take local routes when faced with congestion.
With respect to drivers’ satisfaction with in-vehicle navigation systems, most gave a neutral response (53%), and one third of them (33%) were unsatisfied. These findings reveal that there is still a need to improve existing and develop novel navigation systems in Taiwan. In general, most of the drivers still accessed real-time traffic information via VMS, radio, or by calling the traffic condition center for route conditions.
Overall, in the three traffic conditions, i.e., smooth, recurrent congestion and non-recurrent congestion, demands for information types about the main route were greater than demands for information types about the alternative route, and most of the respondents have no demand for CRTTI (information demand = 0). In the event of the smooth flow of traffic, the majority of freeway drivers had no information demands (83%). Recurrent congestion and non-recurrent congestion may increase drivers’ demands for information. Drivers’ demands for number of information types significantly increased in the event of non-recurrent congestion, indicating that freeway drivers are more likely to access real-time traffic information when uncertainty about external factors is high.
In the event of the normal flow of traffic or recurrent congestion, most respondents said that they needed basic information (33%) and navigation information for the main route and the alternative route (27% and 29%, respectively). These figures suggest that drivers considered these two types of information (basic information and route navigation) more than other two types of information for driving on freeways, without any contingency plan. It can be inferred from the findings that information providers should prioritize these two types of traffic information when providing real-time traffic information. In the event of non-recurrent congestion, most respondents said that they mainly needed a dynamic estimation of travel time (32%) and basic information (29%). Among the four types of traffic information provided in the questionnaire, freeway drivers were least interested in travel time delay information. A plausible explanation for this low interest is that travel time delay information is not the most intuitive information to use for many drivers and thus inconvenient. Another possibility is that drivers mainly care about how long the trip will take, and not how much longer it will take than under ideal conditions (which they may not know precisely).
4. Model Estimation Results
The Spike model estimate results for information pricing under different traffic conditions are presented in
Table B1,
Table B2 and
Table B3 (
Appendix B), differentiated as basic information, dynamic travel time information, dynamic travel time delay information, and navigation support information. Due to the practical difficulties of establishing pricing for traffic information under different traffic conditions, only the sample population’s WTP for traffic information is presented, and then separately calibrates the WTP for four types of information: basic information, dynamic travel time, travel time delay, and route guidance.
Table 1 compiles definitions for model variables. Driver age and total access to real-time traffic information were separately filled in.
Table 2 presents the combined model estimation results. Without distinguishing between types of real-time traffic information, the average WTP is USD 0.325. Significant socioeconomic variables showed that a rise in the pricing of real-time traffic information corresponded with a decline in drivers’ willingness to pay. Male drivers were more willing to pay for real-time traffic information, possibly because they had less patience for traffic congestion or because of personal control issues. Older drivers were willing to pay less to access real-time traffic information, possibly because older people are already accustomed to or satisfied with their current information access methods (e.g., radio broadcasts). Drivers with higher average monthly incomes (above USD 1563) were more willing to pay extra to access information.
Table 1.
Definitions of explanatory variables.
Table 1.
Definitions of explanatory variables.
| Variable | Definition |
|---|
| Gender | 1: Male; 0: Female |
| Age | Driver’s actual age |
| Personal monthly income(above USD 1563) | 1: above USD 1563; 0: otherwise |
| Amount of CRTTI acquired | Total amount of CRTTI acquired from origin to destination |
| Leisure trip | 1: leisure trip; 0: otherwise |
| Working trip | 1: working trip; 0: otherwise |
| Always encounter crowded traffic on highway | 1: Yes; 0: No |
Table 2.
Integrated Spike model estimation result (t-value in parenthesis).
Table 2.
Integrated Spike model estimation result (t-value in parenthesis).
| Variables | Coefficients |
|---|
| Constant | −1.79 (−5.39) |
| BID a | −0.11 (−40.39) |
| Gender (Male = 1) | 0.43 (2.48) |
| Age | −0.02 (−3.34) |
| Personal monthly income(above USD 1563) | 0.71 (4.63) |
| Always encounter crowded traffic flow on the highway | 1.29 (1.70) |
| Amount of CRTTI acquired | 0.04 (1.56) |
| Working trip | 0.39 (2.84) |
| Spike b | 0.142 |
| Average WTP (USD) | 0.325 |
| Wald statistic (p-value) | 340.271 (0.000) |
| Log-Likelihood | −1622.63 |
| Observations | 1132 |
Significant variables for trip characteristics showed that when drivers encounter traffic congestion on highways, they are more willing to pay to obtain real-time traffic information which could help them avoid traffic. Commuters want to avoid being late for work and are thus more willing to pay for real-time traffic information. Significant values for the characteristics of traffic information showed that drivers with a greater need for real-time traffic information are more willing to pay. These results indicate that providing accurate real-time traffic information may increase the use, price and frequency of use of that information. In addition, drivers with high information needs are more comfortable with the concept of having the user pay for such information.
Table 3 presents Spike model assessment results differentiated for different types of information, and shows that, as expected, all variables are significant. Among variables which impact basic information pricing, gender (male) and number of working trips trend towards increased WTP for real-time traffic information. Variables which trend negative for estimated value of dynamic travel time information include age and number of leisure trips. The explanation for the influence of age is similar to that presented in the previous section, while the lower WTP for dynamic travel time information by leisure drivers may be due to relative time flexibility of leisure trips. Personal monthly income above USD 1563 showed a significant positive correlation, possibly because people with higher monthly incomes are more inclined to pay additional fees to obtain information they regard as necessary. Drivers with a greater need for real-time traffic information are willing to pay higher rates for it. Variables that influence the value assigned to dynamic travel time information include age, personal monthly income over USD 1563, and total real-time traffic information accessed. Variables impacting the value assigned to dynamic route guidance were mostly socioeconomic, including gender (male), age (older), work-related trips, and personal monthly income over USD 1563.
Table 3.
Different types of CRTTI Spike model estimation results (t-value in parenthesis).
Table 3.
Different types of CRTTI Spike model estimation results (t-value in parenthesis).
| Variables | Basic Information | Dynamic Travel Time Information | Dynamic Travel Time Delay Information | Navigation Support Information |
|---|
| Constant | −2.35 (−8.01) | −1.23 (−1.73) | −1.79 (−2.24) | −1.69 (−2.82) |
| BID | −0.11 (−22.99) | −0.12 (−18.63) | −0.102 (−16.74) | −0.11 (−21.58) |
| Gender(Male = 1) | 0.70 (2.53) | | | 0.45 (1.40) |
| Age | | −0.04 (−2.40) | −0.05 (−2.23) | −0.02 (−1.32) |
| Working trip | 0.47 (2.06) | | | 0.55 (2.10) |
| Leisure trip | | −0.94 (−2.86) | | |
| Personal monthly income (Above USD 1562.5) | | 0.79 (2.19) | 1.13 (2.80) | 0.55 (1.97) |
| Amount of CRTTI acquired | | 0.12 (1.95) | 0.21 (2.86) | |
| Spike a | 0.09 | 0.226 | 0.143 | 0.155 |
| Average WTP (USD) | 0.125 | 0.081 | 0.050 | 0.297 |
| Wald statistic (p-value) | 291.435 (<0.00) | 213.41 (<0.00) | 539.258 (<0.00) | 84.97 (<0.00) |
| Log-likelihood | −555.43 | −318.63 | −291.93 | −451.18 |
| Samples | 375 | 228 | 210 | 319 |
Taking a closer look at WTP, the range of WTP for each type of information is USD 0.050–0.297. Among these types, the WTP for route guidance is the highest, which conforms to expectations. That is, providing drivers with clear guidance to avoid traffic congestion is the most obvious benefit, and providing reasons for traffic congestion helps drivers decide whether or not to find an alternative route. The WTP for basic information appears to be second highest. The plausible explanation for this result lies in the fact that most respondents said that they needed basic information (
Section 3). Finally, travel time delay information has the lowest WTP, possibly because the perception of this information is less direct and less useful.
5. Conclusions
This study uses Spike models to investigate highway drivers’ willingness to pay for real-time traffic information. The key conclusions include: (1) Demand for information is lowest when traffic is smooth, while demand for information increases during both recurrent and non-recurrent congested traffic situations and the demand is highest in non-recurrent congested traffic situations. This indicates that drivers are more willing to pay to obtain real-time traffic information when they face uncertainty; (2) In free flow traffic or recurrent traffic, the greatest demand is for basic information on main routes and alternative routes. In non-recurrent congested traffic, the greatest demand for real-time traffic information on the main routes is dynamic travel time predictions. Among all types of information, Taiwan drivers show the least preference for travel time delay information; (3) Spike model assessment results show that the WTP range expands to USD 0.050–0.297; (4) Socioeconomic variables have the greatest impact, including gender, age, and income, along with trip purpose, information requirements and traffic conditions.


