Article

Assessing the Atmospheric Oxygen Balance in a Region of Rapid Urbanization: A Case Study in the Pearl River Delta, China

1
Laboratory for Earth Surface Processes, Ministry of Education, College of Urban and Environmental Sciences, Peking University, Beijing 100871, China
2
Key Laboratory for Environmental and Urban Sciences, School of Urban Planning and Design, Shenzhen Graduate School, Peking University, Shenzhen 518055, China
3
Institute of Geographic Sciences and Natural Resources Research, Chinese Academy of Sciences, Beijing 100101, China
*
Author to whom correspondence should be addressed.
Sustainability 2015, 7(10), 13055-13072; https://doi.org/10.3390/su71013055
Submission received: 25 June 2015 / Revised: 17 September 2015 / Accepted: 17 September 2015 / Published: 24 September 2015

Abstract

:
Oxygen is a product of photosynthesis and is essential for human survival. It also has a profound effect on ecosystems as the atmospheric oxygen balance is the basis for regional ecological sustainability. The Pearl River Delta (PRD) has experienced rapid urbanization and has become one of China’s three major urban agglomerations. This study focused on the oxygen balance of the PRD in 2011, and established a model to calculate the oxygen balance that was suitable for a region of rapid urbanization by applying remote sensing gross primary production data via the C-Fix model. The influencing factors for the oxygen imbalance were analyzed and it was suggested that more attention be paid to the management of oxygen emissions than oxygen consumption. The results indicated that the oxygen balance capacity of the PRD was weak, with an oxygen consumption 9.37 times that of its oxygen emission. Zhaoqing and Huizhou are the main sources of oxygen in the PRD, with an oxygen emission density more than 4.67 times that of Dongguan or Zhuhai. Guangzhou and Shenzhen are the main oxygen sinks, with a total oxygen consumption more than 5.49 times that of Zhaoqing. Moreover, the oxygen balance of the PRD is more sensitive to oxygen emissions than consumption. Therefore, it could be inferred that the land urbanization has a stronger influence on the oxygen balance than the population urbanization.

1. Introduction

The fast urbanization with significant land cover change has influenced the urban microclimate, which may threaten the sustainability of atmospheric balance at regional scale [1,2]. Some of the regional atmospheric process such as CO2 emission has become a critical issue in sustainable development [3]. In urban ecosystems, the process of absorbing CO2 is correlated with oxygen emission, which forms a carbon and oxygen cycle in balance [4]. However, except the wide attention on the carbon cycle, few studies focus on the accompanying process of oxygen emission and consumption, which is also a link bridging the processes between nature and human beings. Oxygen is vital for the survival of life, and the maintenance of a certain concentration of atmospheric oxygen is the most fundamental aspect of human well-being. When the oxygen concentration is below 19.5% in a closed space, the human heart can be harmed by its increased workload, and people cannot survive when the oxygen concentration is less than 6%–7% [5]. On one side, oxygen is an important element of photosynthesis and respiration, and a certain concentration of atmospheric oxygen is needed to balance the ecosystem. On the other side, oxygen is an important raw material consumed in the chemical industry during the combustion of fossil fuels. Urbanization mainly involves deforestation and the large-scale use of fossil fuels. The rapidly rising CO2 concentration in the atmosphere due to urbanization has caused global climate change, which in turn aroused widespread concern [6,7,8]. Meanwhile, the problem of an atmospheric oxygen imbalance has been gradually identified. Klusinske [9] found that the oxygen concentration in the atmosphere fell by 0.0317% from 1990 to 2008. In densely populated city centers, the oxygen concentration is below 19%, and in some urban areas it is as low as 12%–17% [5]. Nevertheless, over half the world’s population live in cities, and urbanization has become a significant trend in the development of human civilization. With the high population increasingly consuming resources and energy, urbanization results in dramatic changes in land cover and environment [9,10,11]. As large amounts of green vegetation are converted to artificial impervious surfaces, the exchange of materials between the atmosphere and ground surface will be significantly affected [12,13]. Thus, urbanized areas, especially regions strongly affected by human disturbance causing significant surface changes [14,15], have become important in global environmental change studies.
Compared with studies of the carbon balance that focus on global warming, there have been few studies of the global oxygen balance. The quantitative methods used in oxygen balance studies have been improved to increase the accuracy of estimation. Some researchers have used the area of green vegetation cover to indicate carbon sequestration and oxygen emission [16]. Some researchers have used plant photosynthesis products of net primary productivity (NPP) to make estimations [17,18], while others found that remote sensing technology made the calculation more effective [19,20,21,22,23]. Dong [24] conducted an urban oxygen balance study in Nanjing, China. However, the study was relatively subjective and lacked a scientific basis in its assessment, because the estimation was based on empirical oxygen emission coefficients of several land use types without chemical formulas and ecological mechanisms. In more recent studies, the analysis and application of the oxygen balance has been strengthened. Ma et al. [25] applied an oxygen balance index to quantitatively evaluate the urban oxygen balance. Nowak et al. [26] and Peng [27] analyzed the role of green vegetation in the oxygen balance, and Zhang et al. [28] and Gui [29] calculated the need for ecological land in cities based on the oxygen balance. The city and the region have a close connection in terms of landscape function [30]. However, because the statistical data currently available is unable to meet the need for a large scale, it is not possible to establish an effective evaluation system for the comprehensive and quantitative assessment of the regional oxygen balance, nor is it possible to analyze the reasons for any reported imbalance.
Urban agglomeration is the merging of different metropolitan areas that interconnect at a regional scale. Thus, urban agglomerations provide a suitable scale for an atmospheric study [31]. China is experiencing rapid urbanization, where natural surfaces and economic activities are undergoing significant change [32,33,34,35], and metropolitan areas are sensitive to the atmospheric oxygen balance. After more than 30 years of reforming and opening-up, the Pearl River Delta (PRD) has become one of China’s three major urban agglomerations [36,37,38]. The level of urbanization in the PRD is high and the urban system is well developed, with cities at all levels having a close connection. At the same time, land cover in the PRD has changed dramatically as large amounts of natural land have been developed [39]. The rapidly developing economy has resulted in significant economic and structural changes in the PRD [40]. However, the characteristics of the cities in the PRD vary substantially. Dongguan formed according to market demands, Guangzhou evolved from the old city, and Shenzhen was built to comply with modern urban planning theory. The oxygen balance in the PRD can be extended to the other rapidly urbanizing regions in China, because the PRD is experiencing an innovative Chinese urbanization. Therefore, this study focused on the oxygen balance of the PRD in 2011 and established an oxygen balance calculation model by applying remote sensing gross primary productivity (GPP) data via the C-FIX model.

2. Methodology

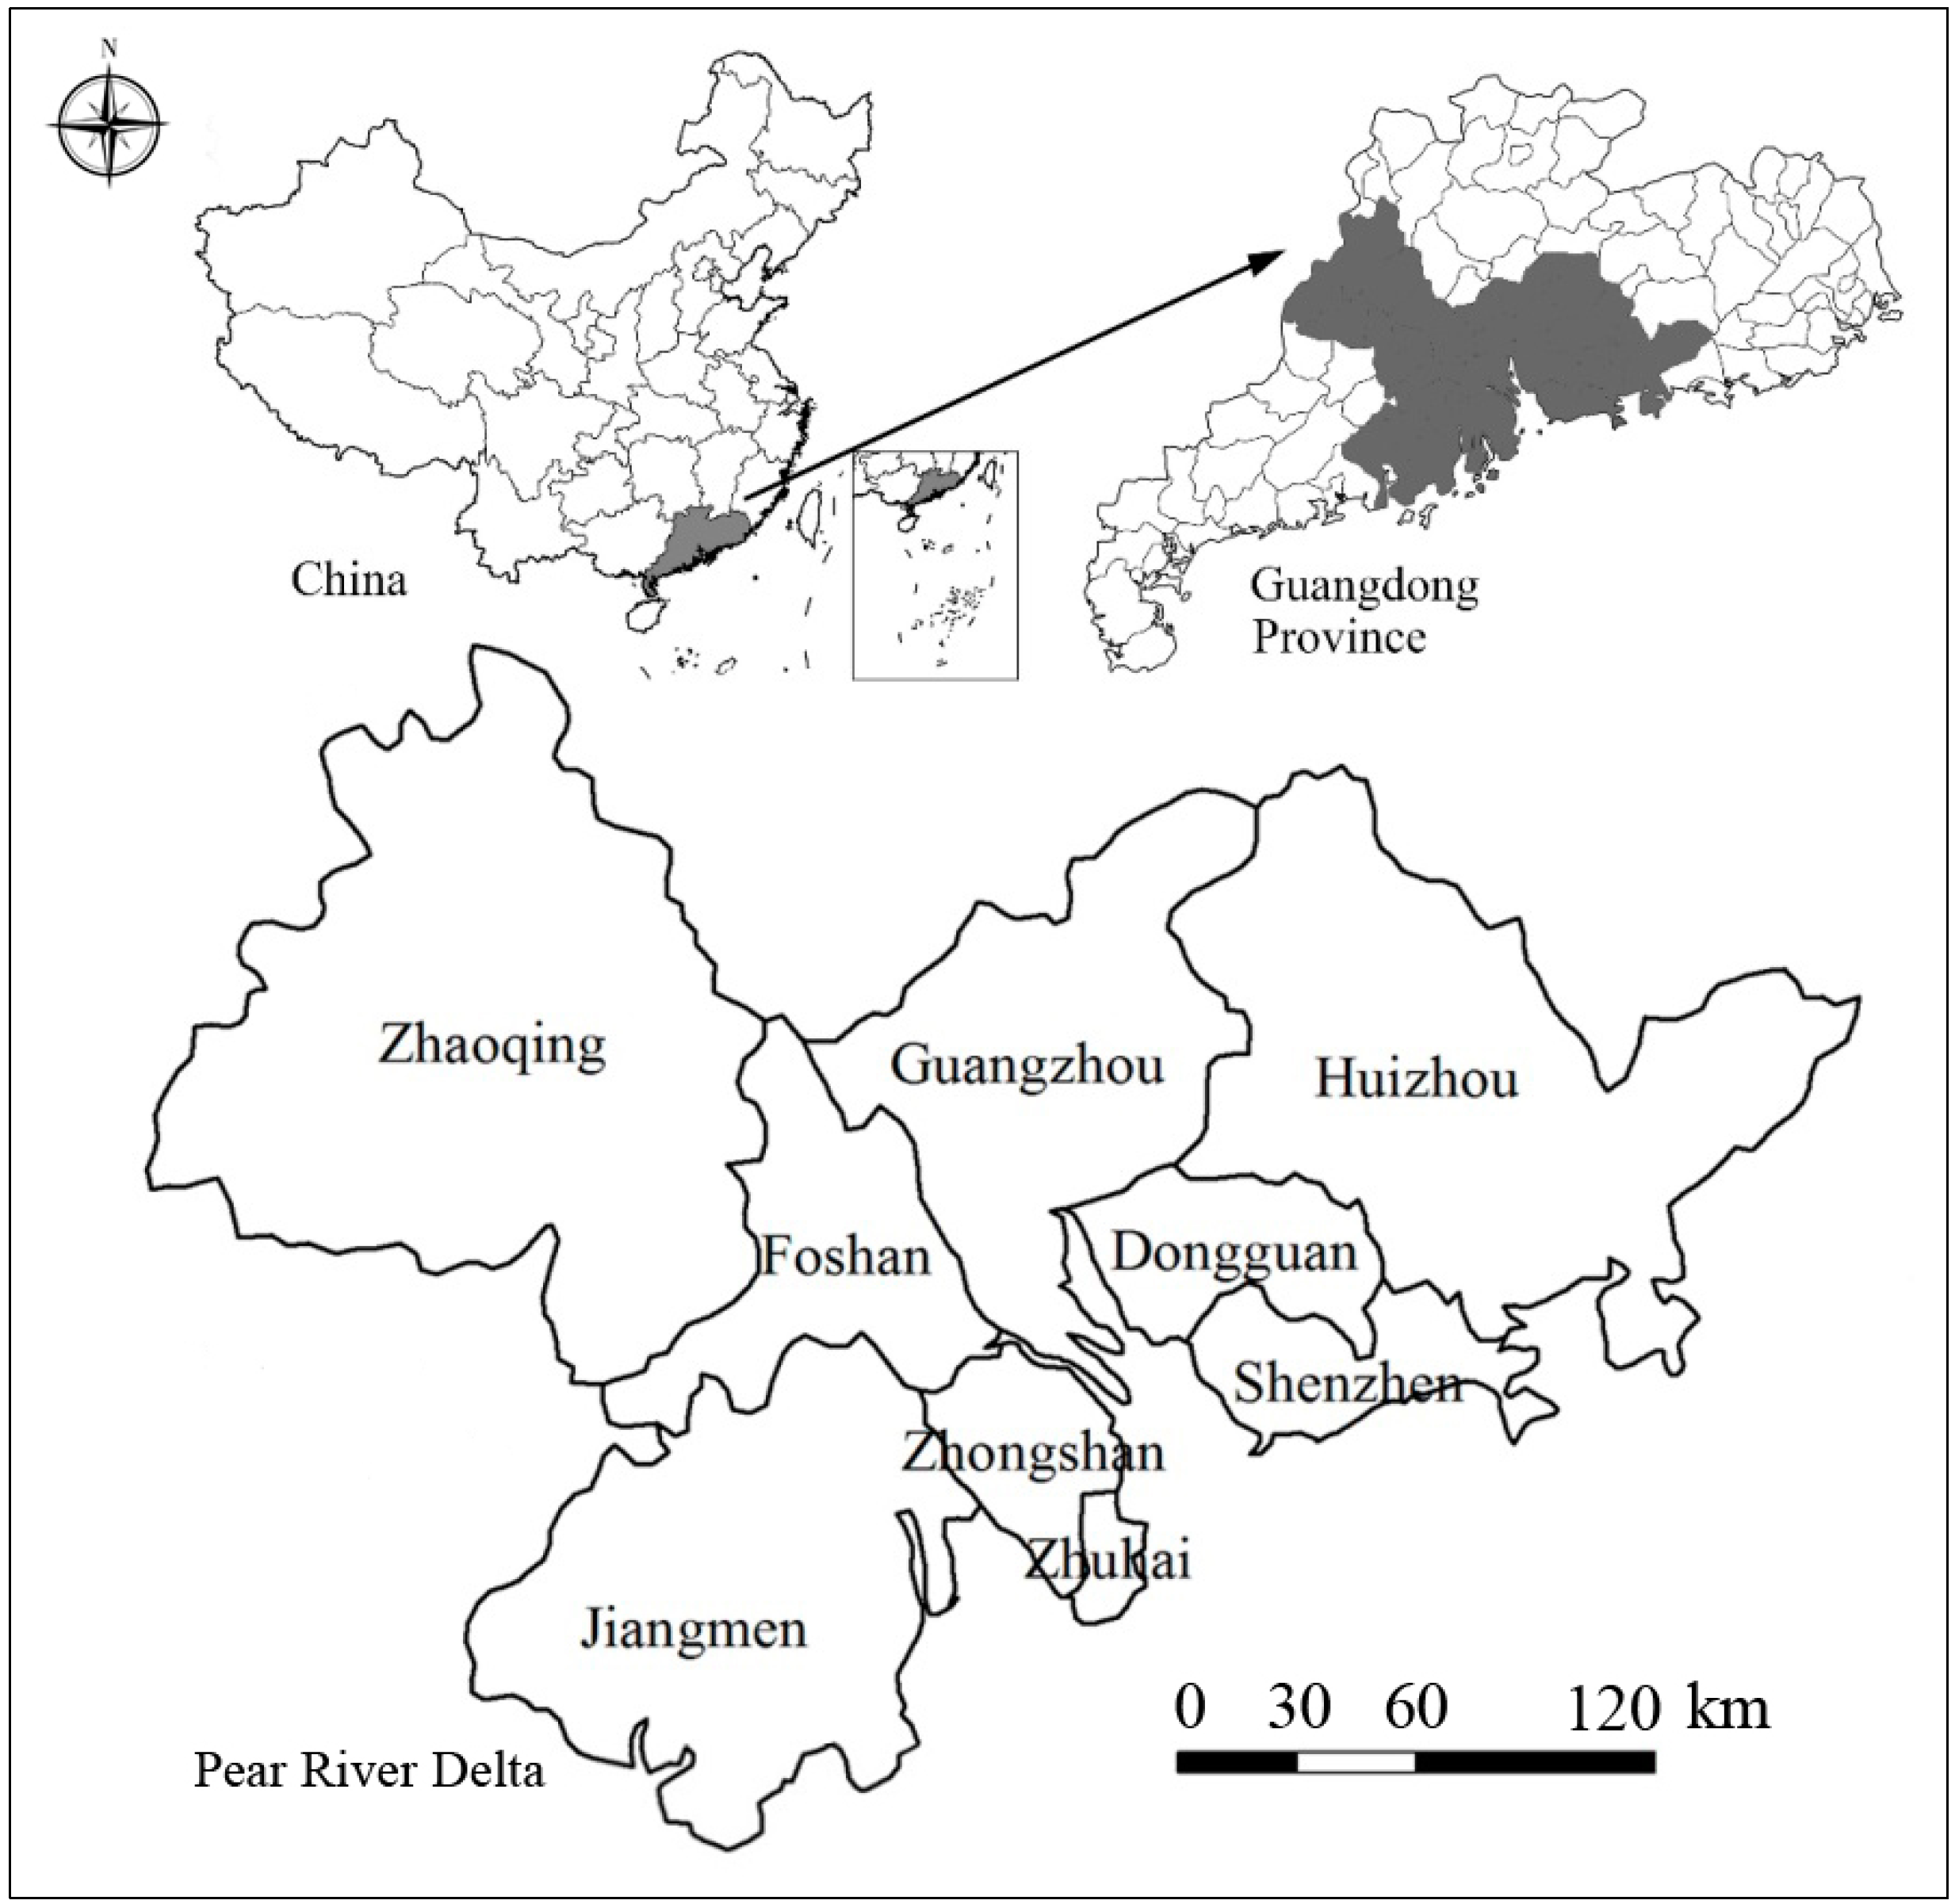
2.1. Study Area and Data Source

The PRD is an alluvial delta complex that developed from the silt supplied by the Xijiang River, North River, and East River together with its tributaries, i.e., the Tanjiang River, Zengjiang River, and Suijiang River. It is situated in the southeast of Guangdong Province, China, and is surrounded by high mountains on three sides, with the South China Sea to the south. Located near the Tropic of Cancer, it has a southern subtropical climate with adequate levels of light and rainfall. The rainy season coincides with the hottest time of the year, and the vegetation is mainly tropical and subtropical plants.
The urban agglomeration in the PRD includes nine cities: Guangzhou, Shenzhen, Zhuhai, Foshan, Jiangmen, Dongguan, Zhongshan, Huizhou, and Zhaoqing (Figure 1). After 30 years of rapid development, the PRD has become a mixture of highly concentrated economic entities and densely populated areas [41]. The PRD occupies only 0.446% of China’s land, but the GDP of the PRD in 2011 was 3767.33 billion yuan, accounting for 11.3% of China’s GDP. The residential population is 5.647 million, accounting for 4.09% of China’s total population. The urban population is 4.687 million, with an urbanization rate of 83.0%, which is higher than the country’s overall level of 51.3%.
The basic information used in this study was GPP remote sensing data, temperature monitoring data, and statistics. The remote sensing imagery for this project was extracted from a MOD17A2 data set of GPP values. Its spatial resolution was 1 × 1 km and the time frequency was eight days. A total of 47 images (from 1 January 2011 to 1 January 2012) were downloaded from NASA and USGS [42]. The images on days of 49, 65, and 121, which were obscured by clouds, were replaced by the mean value of two images taken earlier and later. The saturation zone, with pixel values of more than 30,000, was assigned to 0. The image coordinates were switched to the projection of Beijing 1954, Lambert. The temperature data were provided by the China Meteorological Data Sharing Service System [43] and were measured at 02:00\08:00\14:00\20:00 every day, with the mean value used as the daily average temperature. Statistical data were collected from the Guangdong Province 2012 yearbooks for Guangzhou, Shenzhen, Zhuhai, Foshan, Jiangmen, Dongguan, Zhongshan, Huizhou, and Zhaoqing. The following data were collected for the administrative areas of each city: permanent population, number of livestock, primary energy consumption, GDP, and energy consumption per unit of GDP in 2011.
Figure 1. Location of the study area.
Sustainability 07 13055 g001

2.2. Atmospheric Oxygen Emission Assessment

Photosynthesis accounts for 98% of the world’s oxygen output, while the splitting of water molecules by ultraviolet radiation accounts for the other 1%–2% [44]. The process of plants producing and consuming oxygen consists of three stages. The first is photosynthesis. Plants convert inorganic carbon to organic carbon and release oxygen, with the initial carbon referred to as GPP. The second is autotrophic respiration. Plants consume part of the organic carbon produced by photosynthesis and absorb some oxygen through respiration. The remaining organic carbon is referred to as NPP [45,46,47]. The third is heterotrophic respiration of soil organic matter. Part of the organic carbon in NPP expended by heterotrophic respiration and oxygen consumption of soil organic matter will enter the soil in the form of dead branches, fallen leaves, or other plant material. The organic carbon remaining after deducting the consumption by heterotrophic respiration of soil organic matter from the NPP is referred to as net ecosystem productivity (NEP) [48]. Thus, the oxygen emission of plants through photosynthesis, respiration, and heterotrophic respiration of soil organic matter can be calculated by the mass ratio between NEP and oxygen emission after estimating the NEP.
In rapidly urbanizing regions like the PRD, large vegetation changes have occurred at different intervals. The traditional calculation method, which uses ground-based data, is time costly and not suitable for a rapidly changing environment. The introduction of remote sensing technology has made it possible for measuring oxygen emissions in regions of rapid urbanization then the empirical value of land use type [49]. The MOD17A2-GPP data set reflects the wide range of spatial and temporal variations of vegetation photosynthesis in real-time. Thus the eight day time elapsed NPP and NEP values have been derived, and oxygen emissions have been estimated from the GPP and temperature data.
The models used for estimating NPP and NEP can be roughly divided into three categories [50]: traditional meteorology correlation models [51,52], ecological process models [53,54,55], and rational light utilization models [56,57]. The C-FIX model used in this study is a rational light utilization model, which can determine the calculation of NPP and NEP with a time-space attribute at the regional scale [58]. The model requires few input parameters, but has a high calculation efficiency [58]. In the C-FIX model, GPP, NPP, and NEP have the following relationships, where the subscript “d” stands for day:
NPPd = GPPd (1 − Ad)
NEPd = NPPd − Rh,d
where Ad is the autotrophic respiration rate of plants, and Rh,d is the heterotrophic decomposition rate of soil organic matter. NPPd is the net primary productivity on pixel, GPPd is the gross primary productivity on pixel, NEPd is the net ecosystem productivity on a pixel. The unit is tonne (t).
The autotrophic rate of plants and heterotrophic decomposition rate of soil organic matter are primarily related to temperature. The heterotrophic respiration rate will increase 1.5 times when the temperature is increased by 10 °C [59]. Finally, NEP of every eight days is estimated by entering the GPP remote sensing data and temperature data into the C-FIX model, and the yearly oxygen emission can be estimated by the summary of the eight days’ NEP.

2.3. Atmospheric Oxygen Consumption Assessment

The main issues that consume oxygen are the burning of fossil fuels and respiration. The primary energy sources consumed in the PRD are coal, oil, and gas. Respiration occurs mainly in humans and livestock [60]. The formulas for oxygen consumption due to the burning of oil, coal, and gas are as follows [61]:
CnH2n + 3n/2O2→nCO2 + nH2O
C + O2→CO2
C3H8 + 5O2→3CO2 + 4H2O
One adult’s daily oxygen consumption is 800 g. The daily oxygen consumption of livestock (mainly pigs and cattle) is 1500 g [62], thus:
Co = Eo + Ec + Eg + Rp + Rl
Co is the oxygen consumption (t O a−1), Eo is the oxygen consumption by oil burning (t O a−1), Eg is the oxygen consumption by coal burning (t O a−1), Eg is the oxygen consumption by gas burning (t O a1), Rp is the oxygen consumption by human respiration (t O a−1), and Rl is the oxygen consumption by livestock respiration (t O a−1).

2.4. Atmospheric Oxygen Balance Assessment

A quantitative assessment and evaluation of the oxygen balance is key to the application of regional oxygen balance studies. This study evaluated the oxygen balance by comparing oxygen consumption and emission, and constructing an oxygen balance index, i.e., Bo. The oxygen balance depends on the oxygen emission capacity indicated by the oxygen emission density (Peo), and the degree of oxygen consumption indicated by the oxygen consumption density (Pco). The major factors that affect oxygen emission are the area size indicated by the greening ratio (Ro), and the efficiency indicated by the oxygen emission rate (Yo). The major factors that affect the degree of oxygen consumption are the degree of economic development indicated by GDP, and economic development efficiency indicated by the oxygen consumption per unit of GDP (COGDP).
Bo = Co/Eo
Peo = EO/S
Pco = Co/S
Ro = So/S
Yo = Eo/So
COGDP = Co/GDP
Bo is the oxygen balance index, Co is the oxygen consumption (t), EO is the oxygen emission (t), Peo is the oxygen emission density (t·km−2), S is the total area (km2), Pco is the oxygen consumption density (t·km−2), Ro is the greening ratio (%), So is the area of green land (km2), Yo is the oxygen emission rate of green land (t·km−2), GDP is the Gross Domestic Product (108 yuan), COGDP is the oxygen consumption per unit of GDP (t 10−8 yuan−1).

2.5. Influencing Factors Identification of Atmospheric Oxygen Balance

After assessing the oxygen balance index in the PRD, to discuss the influencing factors can make a better understanding on the formation of oxygen balance. In this study, the factors influencing the oxygen balance were selected as four dimensions of population, land use, economy, and energy consumption. In detail, population dimension includes such five indicators as total population, urban population, proportion of urban population, rural population, and proportion of rural population. Land use dimension includes four indicators, i.e., area of construction land, area proportion of construction land, area of ecological land, and area proportion of ecological land. Economy dimension includes five indicators such as GDP, GDP of primary industry, GDP of secondary industry, GDP of tertiary industry, and GDP of industry. Finally, the energy consumption dimension only includes one indicator of primary energy consumption. The various influencing factors after standardization were extracted to make Pearson correlation analysis with the indexes of oxygen emission, oxygen consumption, and oxygen balance, respectively.

3. Results

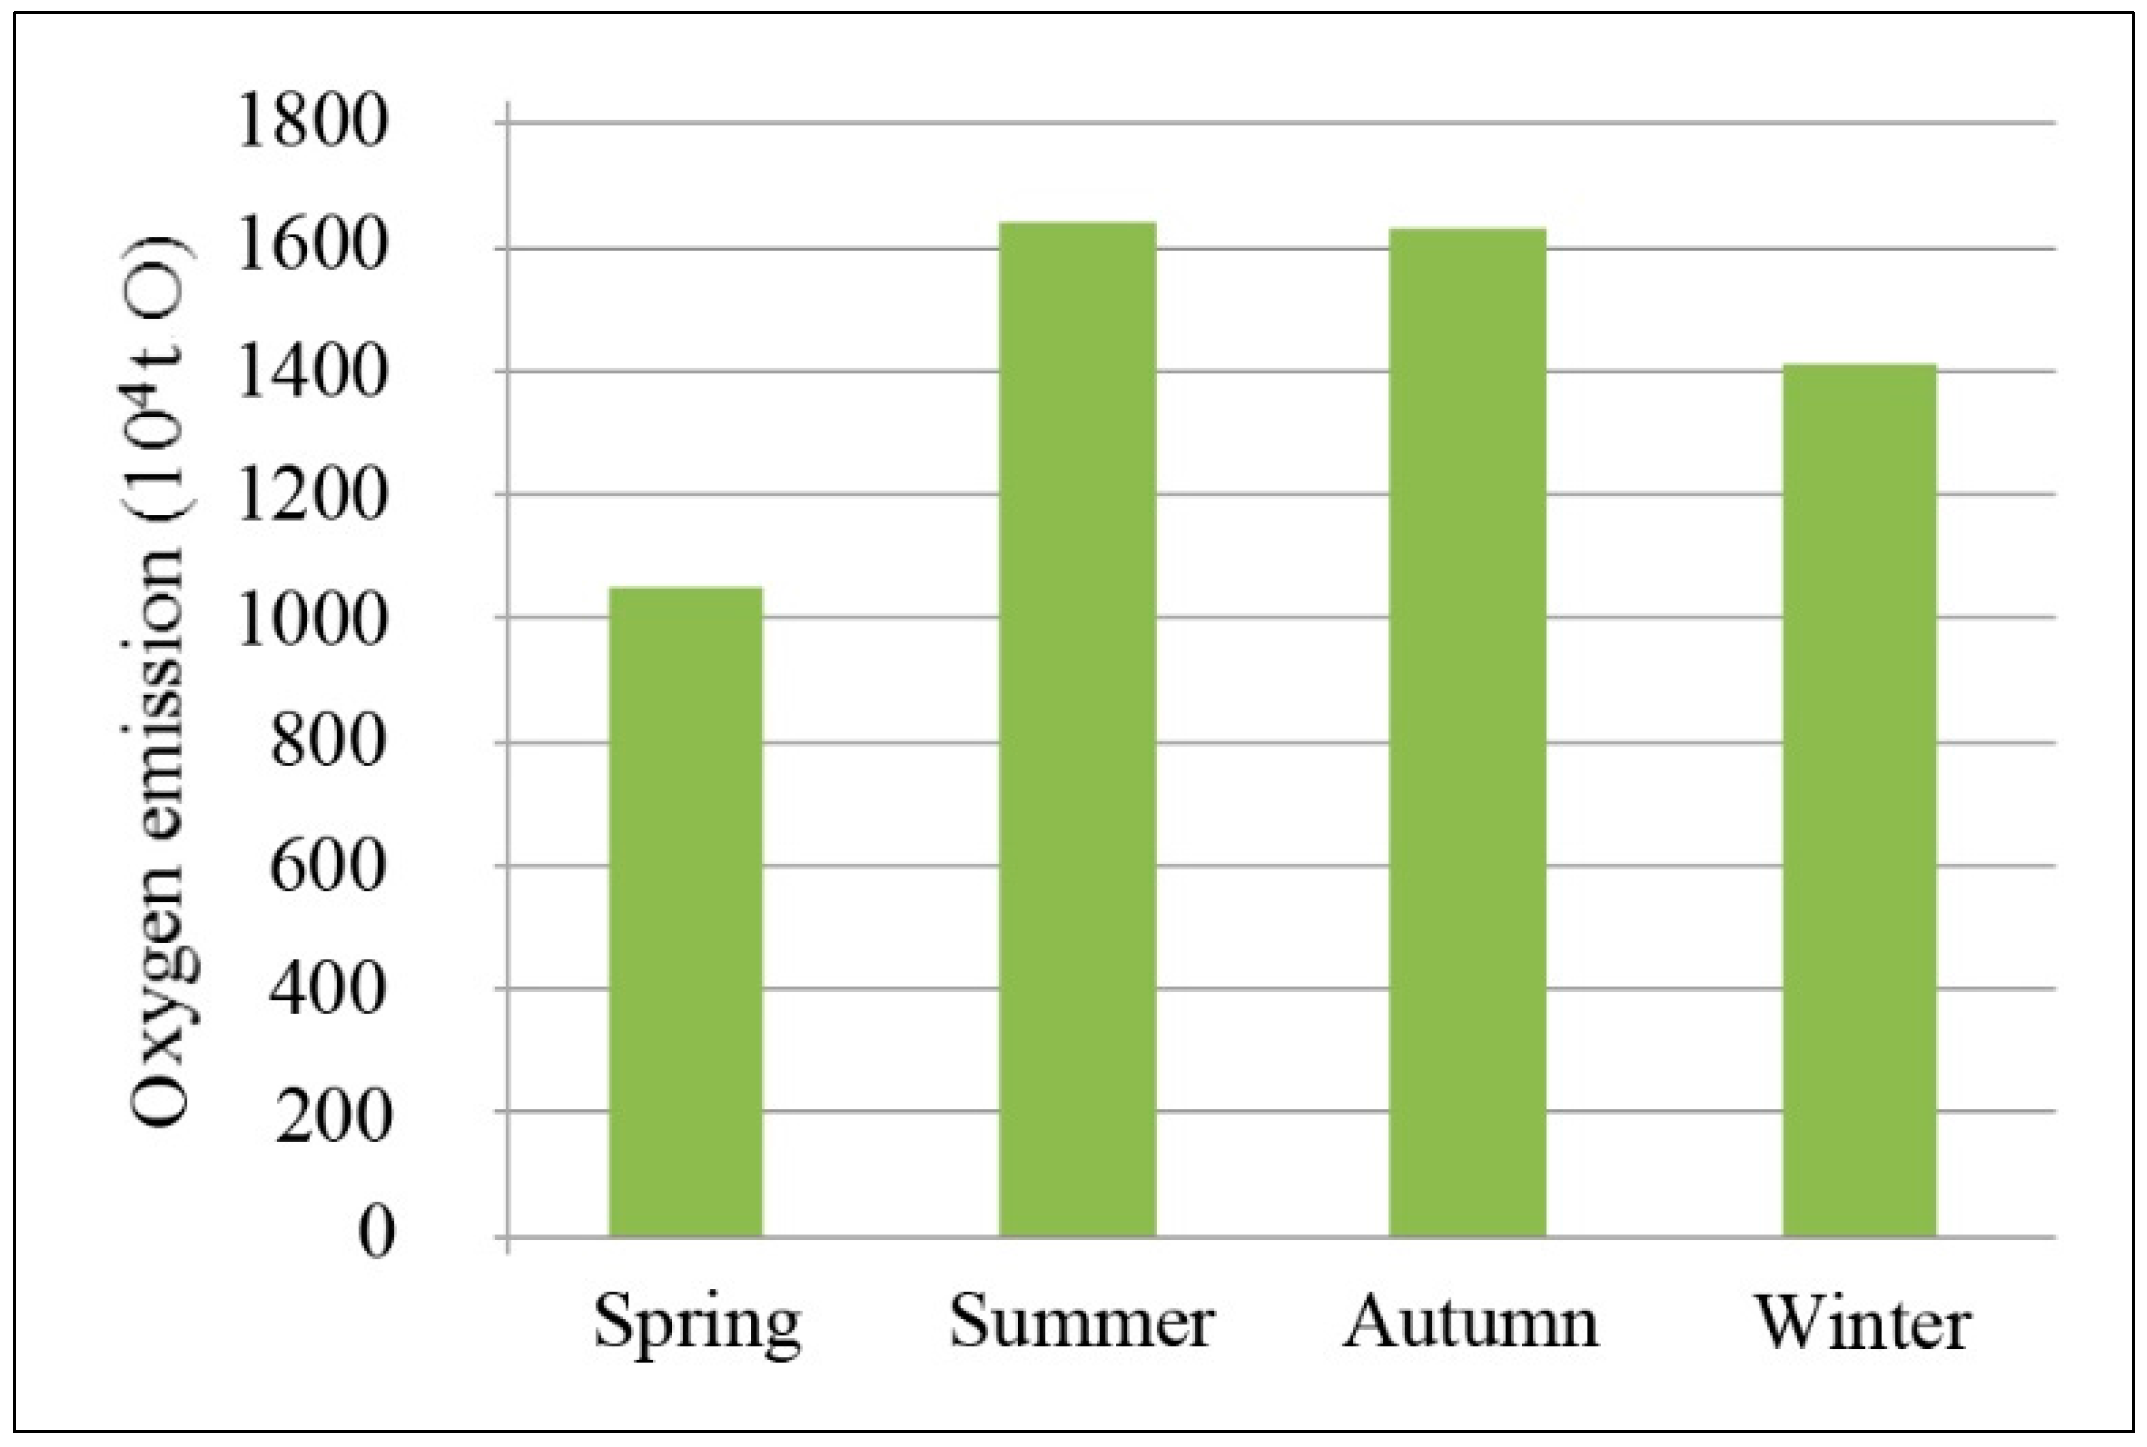
3.1. Spatio-Temporal Variation of Atmospheric Oxygen Emissions

The spatial distribution of the accumulated atmospheric oxygen emissions in the PRD indicated that the photosynthetic intensity of vegetation was high (Figure 2), and oxygen emissions per unit of green land were large. In 2011, the total initial oxygen production was 1.602 × 10⁸ t and the net oxygen emission was 5.956 × 10⁷ t. The area of green land that could potentially release oxygen was 4.397 × 10⁴ km2, and the average oxygen emission rate of green land was 1355 g O m−2 a−1, which was larger than the average value in China [63,64].
Figure 2. Spatial distribution of accumulated atmospheric oxygen emissions in the PRD in 2011.
Sustainability 07 13055 g002
The vegetation respiration intensity in the PRD was also high (Table 1). The total oxygen consumption from respiration was 1.006 × 10⁸ t, which accounted for 62.80% of all initial oxygen produced by vegetation, with 4.966 × 10⁷ t (31%) consumed by autotrophic respiration and 5.097 × 10⁷ t (31.82%) consumed by heterotrophic respiration of soil organic matter. Compared with other studies, the oxygen consumed by vegetation respiration accounted for 30.79% of the initial oxygen production in Harbin, China [50]. In Europe, the oxygen consumed by respiration accounted for 72.8% of the initial oxygen production, with 46.5% was consumed by autotrophic respiration and 26.3% was consumed by heterotrophic respiration of soil organic matter [58]. Therefore, the oxygen consumed by heterotrophic respiration of soil organic matter was larger in the PRD, with the proportion almost equal to the autotrophic respiration. It could also be found that the total initial oxygen production in the PRD was significantly higher, because the better hydrothermal conditions in the PRD can lead to higher intensity of photosynthesis. In detail, Zhaoqing and Huizhou had the largest oxygen emissions among the nine cities in the PRD. The vegetation in the two cities released 2.042 × 10⁷ t O and 1.681 × 10⁷ t O, respectively, which accounted for 34.28% and 28.22% of the total release in the PRD. Therefore, Zhaoqing and Huizhou is the spatial source of oxygen emission in the PRD.
Table 1. Accumulated atmospheric oxygen emission in each city of the PRD in 2011.
CityGPP (105 t C)NPP (105 t C)NEP (105 t C)Oxygen Emission (105 t O)Proportion of Total Oxygen Emission (%) *
Guangzhou60.05241.65122.56160.16910.10
Shenzhen28.88919.96910.76828.7174.82
Zhuhai3.7372.5091.388 3.702 0.62
Foshan17.75912.3216.66017.7622.98
Jiangmen97.63567.54137.15799.09716.64
Dongguan7.6885.3652.915 7.7731.31
Zhongshan5.9614.1682.3026.1391.03
Huizhou165.326114.82563.023168.08328.22
Zhaoqing213.615146.09276.560204.18434.28
PRD600.662414.441223.334595.626100.00
Note: * Proportion of total oxygen emission = oxygen emission of the city/oxygen emission of the PRD.
By considering March, April, and May as spring; June, July, and August as summer; September, October, and November as autumn; and December, January, and February as winter, oxygen emissions in the PRD were analyzed quarterly. As shown in Figure 3, oxygen emissions varied seasonally, with the emissions in spring, summer, autumn, and winter comprising 18.30%, 28.63%, 28.45%, and 24.62% of the whole year’s oxygen emission respectively. Oxygen emissions in summer and autumn were large, and spring accounted for the lowest emissions. Compared with the proportional oxygen emissions of 18.10%, 63.73%, 18.16%, and 0.01% for the same four seasons in Harbin [50], the range of seasonal variation in the PRD was not particularly large because of the relatively high temperatures in winter. The much worse hydrothermal conditions in the north can lead to much lower intensity of photosynthesis and respiration. Therefore, the oxygen emissions will be far more concentrated in summer in north China than in south China.
Figure 3. Accumulated atmospheric oxygen emissions in the PRD for each season of 2011.
Sustainability 07 13055 g003

3.2. Spatial Variation of Atmospheric Oxygen Consumption and Balance

The energy and oxygen consumption in the PRD was large and had increased rapidly, as shown in Table 2, Figure 4. The oxygen consumption in 1998 was estimated to be 1.635 × 10⁸ t in the PRD by Peng [27]. Guangdong Province’s primary energy consumption in 1998 was about 7 × 10⁴ t of standard coal equivalent, but by 2011 it had increased to be 2.413 × 10⁵ t, three times more than in 1998. The oxygen consumption in 2011 was 5.581 × 10⁸ t, which was also three times more than in 1998. Guangzhou and Shenzhen, the main oxygen sinks in the PRD, consumed the greatest volume of oxygen at 27.13% and 22.15%, respectively. The primary oxygen consuming activity in the PRD was the burning of fossil fuels, which accounted for 96.14% of the total oxygen consumption. The oxygen consumed by human and livestock respiration only accounted for 3.86% of the total.
Figure 4. Accumulated atmospheric oxygen emission and consumption in each city of the PRD in 2011.
Sustainability 07 13055 g004
Table 2. Accumulated atmospheric oxygen consumption in each city of the PRD in 2011 (unit: 104 t).
CityCoal CombustionOil CombustionGas CombustionHuman RespirationLivestock RespirationTotal Oxygen ConsumptionProportion of Total Oxygen Consumption (%) *
Guangzhou7273.95926.21492.7372.377.815,142.927.13
Shenzhen5965.54860.21224.2305.64.412,359.922.15
Zhuhai776.3632.5159.345.818.81632.72.92
Foshan3970.33234.7814.8211.160.88291.714.86
Jiangmen1264.21029.9259.4130.488.92772.84.97
Dongguan3181.32591.9652.9241.010.36677.411.96
Zhongshan1280.41043.2262.891.816.12694.34.83
Huizhou1871.61524.8384.1135.374.63990.47.15
Zhaoqing980.6798.9201.2115.4153.42249.54.03
PRD26,564.121,642.35451.41648.7505.155,811.6100.00
Note: * Proportion of total oxygen consumption = oxygen consumption of the city/oxygen consumption of the PRD.
The PRD’s oxygen balance was weak, with 9.37 times the current oxygen emissions needed from outside inputs to ensure an adequate balance (Table 3). In the winter, when there is usually a north wind, the PRD can obtain oxygen from the Nanling Mountains and the Yunnan-Guizhou Plateau. During the summer, there is usually a northeast wind, and the PRD can obtain oxygen from offshore locations [65]. As an economic center, the PRD inevitably has a relatively large oxygen deficit. From the perspective of oxygen security, to maintain a certain oxygen balance is a need to ensure a relatively high concentration of atmospheric oxygen even in a calm environment during a long period.
Table 3. Atmospheric oxygen balance for each city in the PRD in 2011.
CityOxygen Balance IndexDensity of Oxygen Emission (104 t km−2)Proportion of Green Area (%)Oxygen Emission Rate (104 t km−2)Density of Oxygen Consumption (104 t km−2)GDP (108 yuan)Oxygen Consumption Per Unit of GDP (104 t 108 yuan−1)
Guangzhou25.170.080.720.112.0110,748.281.41
Shenzhen43.040.150.470.326.469581.511.29
Zhuhai44.100.020.570.040.881208.601.35
Foshan46.680.050.510.102.335651.521.47
Jiangmen2.800.100.880.110.281570.421.77
Dongguan85.910.030.300.102.584246.451.57
Zhongshan43.890.030.430.071.321850.651.46
Huizhou2.370.150.940.160.361729.952.31
Zhaoqing1.100.140.970.140.151085.872.07
Of the nine cities in the PRD, Dongguan had the weakest oxygen balance index of 85.91. The city had no more than 30% of green area and resulted in low oxygen emissions of 300 t km−2 a−1. The density of oxygen consumption was up to 2.58 × 10⁴ t km−2 a−1, which was even higher than that in Guangzhou. The oxygen balance of Foshan, Zhuhai, and Zhongshan was also low, with the index value more than 40. This was because the low oxygen emission rate of green land results in an overall low oxygen emission density. Thus, they were in great need to upgrade industrial facilities, transform the mode of economic development, and enhance energy usage efficiency, besides improving oxygen emissions in Dongguan, Foshan, Zhuhai, and Zhongshan.
Shenzhen had a similar oxygen balance index value compared with Foshan, Zhuhai, and Zhongshan. However, there was a relatively higher density of oxygen emission and consumption in Shenzhen. The large density of oxygen consumption was up to 6.46 × 10⁴ t km−2 a−1, which resulted in a weak oxygen balance despite Shenzhen had the highest oxygen emission rate. Furthermore, Guangzhou had the largest economic size in the PRD. However, the oxygen balance index was only 25.17 in Guangzhou, which could be attributed to its high proportion of green area. Thus the oxygen balance of Guangzhou was relatively better than the other economic centers in the PRD.
The oxygen balances of Zhaoqing, Huizhou, and Jiangmen, with oxygen balance indexes of 1–3, were the best in the PRD. This was because on one hand, they had the highest proportion of green areas (97%, 94%, and 88%, respectively) and the higher oxygen emission rate of green land in the PRD. On the other hand, the economic size of these three cities was relatively small, which lead to the lowest density of oxygen consumption. However, the energy utilization efficiency should be paid more attention since the oxygen consumption per unit of GDP in these three cities were the lowest.

4. Discussion

4.1. Data Comparison

The results of this study were similar to those of previous studies (see Table 4). Tang et al. [66] showed the vegetation NPP density and NEP density, which comprised broad-leaved Korean pine forest in the Changbai Mountains, was lower than in this study because the altitude was much higher and the temperature was lower than in the PRD. The similar conditions in Russia also confirmed this similarity [58]. However, the vegetation NEP density in Italy was higher than in this study. This was due to the higher photosynthetic intensity of vegetation, which was mainly composed of forests in Italy. The density of vegetation oxygen emissions in Guangzhou, estimated using the NPP by Guan et al. [17], was higher than in this study because the oxygen consumption by heterotrophic respiration of soil organic matter was not deducted. The study of the vegetation oxygen emission density in Xiamen and the PRD indicated similar results [25,27], as well as the NEP of loblolly pine forests in California [67]. Sun and Zhu [68] reported that the NPP gradually decreased from southeast China to northwest China, as the vegetation NPP density in the subtropical zone was more than 500 g C m−2 a−1, while in Hainan, Taiwan, Yunnan, and other hydrothermal locations it could exceed 1000 g C m−2 a−1. In this study, the vegetation NPP density in the PRD was 937 g C m−2 a−1, which was consistent with the results of Sun and Zhu [68].
Table 4. Comparison of oxygen emissions reported in the literature.
Study AreaVegetation NPP Density (g C m−2 a−1)Vegetation NEP Density(g C m−2 a−1)Vegetation Oxygen Emission Density (g O m−2 a−1)
Broad-leaved Korean pine forest in the Changbai Mountains [66]870270-
Xiamen [25]--1698
Guangzhou [17]--2326
PRD [27]1002-1263
Subtropical China [68]1000--
Russia [58]-255-
Germany [58]-598-
Italy [58]-879-
Loblolly pine forest in California [67]-602-
This study9375051346

4.2. Factors Influencing the Atmospheric Oxygen Balance

As shown in Table 5, oxygen emission was strongly related to the ecological land area (r = 0.978) and the proportion of urban population (r = −0.927). Significant correlation also existed between oxygen emission and the proportion of rural population (r = 0.927), the GDP of primary industry (r = 0.851), rural population (r = 0.815), the proportion of ecological land area (r = 0.786), and the proportion of construction land area (r = −0.780). Therefore, ecological land, with the strongest correlation to oxygen emission, was the primary factor that directly affected oxygen emission. As we know, agricultural and forest land was an important part of ecological land in a region. Thus, the more ecological land that was available in relationship to the proportion of rural population and primary industry would result in a greater release of oxygen.
Table 5. Correlation coefficients among the influencing factors and atmospheric oxygen emission, consumption, and balance.
Influencing FactorOxygen EmissionOxygen ConsumptionOxygen Balance
Total population−0.1920.971 **0.238
Urban population−0.3820.977 **0.393
Proportion of urban population−0.927 **0.5280.770 **
Rural population0.815 **−0.060−0.666 *
Proportion of rural population0.927 **−0.528−0.770 **
Construction land area0.1510.703 *−0.102
Proportion of construction land area−0.780 **0.3740.950 **
Ecological land area0.978 **−0.203−0.842 **
Proportion of ecological land area0.786 **−0.383−0.950 **
GDP−0.3230.990 **0.240
GDP of primary industry0.851 **−0.525−0.704 *
GDP of secondary industry−0.164−0.5310.083
GDP of tertiary industry−0.3650.785 **0.348
GDP of industry−0.212−0.5030.143
Primary energy consumption−0.2911.000 **0.244
Note: ** Correlation is significant at the 0.01 level; * Correlation is significant at the 0.05 level.
Oxygen consumption was strongly related to primary energy consumption (r = 1.000) and GDP (r = 0.990). Energy consumption would directly lead to oxygen consumption, with 96.14% of oxygen consumption in the PRD stemming from the burning of fossil fuels. Furthermore, energy consumption was highly correlated to GDP. Generally speaking, the larger the GDP, the more fossil fuels combusted and the more oxygen consumed.
The oxygen balance was very strongly correlated with the proportion of construction land area (r = 0.950) and the proportion of ecological land area (r = −0.950), as well as having a significant correlation with the proportion of urban population (r = 0.770) and the proportion of rural population (r = −0.770). The proportion of different land use types and population types could mirror the process of urbanization. The extent of urbanization was obviously an important factor affecting the urban oxygen balance. The greater the extent of urbanization, the larger the energy consumption was. Therefore, together with a smaller ecological land area due to urban expansion, there would be a higher oxygen balance index, i.e., serious oxygen deficit.
It could also be found that the oxygen balance index had a much stronger correlation with the proportion of different land use types than the population types, although population was the key to the realization of urbanization. Thus, besides controlling urban population, the oxygen balance could be ensured in areas of rapid urbanization by realizing intensive land use, and retaining important ecological land. It should also be noted that the factors that were significantly correlated with the oxygen balance were also significantly correlated with oxygen emission, but were completely different from those that were significantly correlated with oxygen consumption. Therefore, it could be concluded that the oxygen balance depended more on oxygen emissions in the PRD under the current conditions. It was currently more effective for the improvement of oxygen balance by increasing oxygen emissions rather than by controlling oxygen consumption.

5. Conclusions

Oxygen is not only a key element in geochemical cycle, but a critical one for human health. This study established an oxygen balance calculation model, which is suitable for regions of rapid urbanization by applying remote sensing GPP data and the C-FIX model. In the PRD, there were huge levels of oxygen emission and consumption. Zhaoqing and Huizhou were the main sources of oxygen with Guangzhou and Shenzhen for the main oxygen sinks. The overall oxygen balance of the PRD was weak, and relies on the input of oxygen from outside the region. The oxygen balance of Zhaoqing, Huizhou, and Jiangmen was the strongest, while it was weakest in Dongguan. It has also been found that urbanization factors largely influence oxygen balance, and increasing oxygen emission can effectively improve oxygen balance. This is because oxygen balance index has a stronger correlation with land use indicators than population indicators, and land use issues are in step with oxygen emission. That is to say, land urbanization was more importantly affecting the oxygen balance than the population of the urbanization. In order to strengthen the oxygen balance, a better urbanization method should be focused on optimizing the urban landscape with more green space to increase the oxygen emission, and maintaining a fit population density and secondary industry proportion.
In future studies, several aspects should be considered to find more information on oxygen balance. (1) Improve the source data accuracy. This study used MODIS data with a resolution of 1 km. However, some errors will exist in GPP remote sensing data due to cloud cover, and therefore different kinds of data could be used as an auxiliary correction; (2) Improve the oxygen emission estimation accuracy. Because of the estimated error or uncertainty in the oxygen balance index, the rank of cities may be changed. In addition, water ecosystems were not considered although they could be important; (3) Compare the oxygen balance with carbon balance. In the 20 years prior, carbon balance was not such a hot topic as it is nowadays. Compared with carbon cycle studies, oxygen balance is a closely related process while it is usually ignored. Therefore a synthetic view on both oxygen balance and carbon balance may be useful in understanding the ecological effect of urbanization.

Acknowledgments

This research was financially supported by the National Key Technology R&D Program of China (2012BAJ15B02).

Author Contributions

Jian Peng, An Wang, Yanxu Liu, and Weidong Liu conceived and designed the study. Jian Peng, An Wang, Yanxu Liu and Weidong Liu made substantial contributions to acquisition, analysis, and interpretation of the data. Jian Peng and An Wang wrote the first draft of the article. Yanxu Liu and Weidong Liu reviewed and edited the first draft. All authors read and approved the submitted manuscript, agreed to be listed, and accepted the version for publication.

Conflicts of Interest

The authors declare no conflict of interest.

References

  1. Lu, H.L.; Liu, G.F. Opportunity costs of carbon emissions stemming from changes in land use. Sustainability 2015, 7, 3665–3682. [Google Scholar] [CrossRef]
  2. Yang, X.B.; Chen, Z.L.; Cai, H.; Ma, L.J. A framework for assessment of the influence of China’s urban underground space developments on the urban microclimate. Sustainability 2014, 6, 8536–8566. [Google Scholar] [CrossRef]
  3. Wang, C.J.; Wang, F.; Zhang, H.O.; Ye, Y.Y.; Wu, Q.T.; Su, Y.X. Carbon emissions decomposition and environmental mitigation policy recommendations for sustainable development in Shandong Province. Sustainability 2014, 6, 8164–8179. [Google Scholar] [CrossRef]
  4. Yin, K.; Lu, D.S.; Tian, Y.C.; Zhao, Q.J.; Yuan, C. Evaluation of carbon and oxygen balances in urban ecosystems using land use/land cover and statistical data. Sustainability 2015, 7, 195–221. [Google Scholar] [CrossRef]
  5. The Oxygen Crisis. Available online: http://www.guardian.com/commentisfree/2008/aug/13/carbonemissions.climatechange (accessed on 13 August 2008).
  6. Prentice, I.C.; Heimann, M.; Sitch, S. The carbon balance of the terrestrial biosphere: Ecosystem models and atmospheric observations. Ecol. Appl. 2000, 10, 1553–1573. [Google Scholar] [CrossRef]
  7. Lovelock, J.E. Hands up for the Gaia hypothesis. Nature 1990, 344, 100–102. [Google Scholar] [CrossRef]
  8. Liu, Y.P.; Yu, D.Y.; Xun, B.; Sun, Y.; Hao, R.F. The potential effects of climate change on the distribution and productivity of Cunninghamia lanceolata in China. Environ. Monit. Assess. 2014, 186, 135–149. [Google Scholar] [CrossRef] [PubMed]
  9. Atmospheric Oxygen Depletion: Should we be Worried? World Green. Available online: http://worldgreen.org/home/wg-feature-articles/8472-atmospheric-oxygen-depletion-should-we-be-worried.htmlbr (accessed on 25 January 2012).
  10. Li, Y.F.; Shi, Y.L.; Zhu, X.D.; Cao, H.H.; Yu, T. Coastal wetland loss and environmental change due to rapid urban expansion in Lianyungang, Jiangsu, China. Reg. Environ. Chang. 2014, 14, 1175–1188. [Google Scholar] [CrossRef]
  11. Zhou, W.Q.; Qian, Y.G.; Li, X.M.; Li, W.F.; Han, L.J. Relationships between land cover and the surface urban heat island: Seasonal variability and effects of spatial and thematic resolution of land cover data on predicting land surface temperatures. Landsc. Ecol. 2014, 29, 153–167. [Google Scholar] [CrossRef]
  12. Liu, Z.H.; Wang, Y.L.; Peng, J.; Xie, M.M.; Li, Y. Using ISA to analyze the spatial pattern of urban land cover change: A case study in Shenzhen. Acta Geogr. Sin. 2011, 66, 961–971. (In Chinese) [Google Scholar]
  13. Liu, Z.H.; Wang, Y.L.; Li, Z.G.; Peng, J. Impervious surface impact on water quality in the process of rapid urbanization in Shenzhen, China. Environ. Earth Sci. 2013, 68, 2365–2373. [Google Scholar] [CrossRef]
  14. Grimm, N.B.; Faeth, S.H.; Golubiewski, N.E.; Redman, C.L.; Wu, J.G.; Bai, X.M.; Briggs, J.M. Global change and the ecology of cities. Science 2008, 319, 756–760. [Google Scholar] [CrossRef] [PubMed]
  15. Peng, J.; Liu, Y.X.; Pan, Y.J.; Zhao, Z.Q.; Song, Z.Q.; Wang, Y.L. Study on the correlation between ecological risk due to natural disaster and landscape pattern-process: Review and prospect. Adv. Earth Sci. 2014, 29, 1186–1196. (In Chinese) [Google Scholar]
  16. Fu, G.; Shen, Z.X.; Zhang, X.Z.; Yu, G.R.; He, Y.T.; Wu, J.S. Respondence of grassland soil respiration to global change. Prog. Geogr. 2010, 29, 1391–1399. (In Chinese) [Google Scholar]
  17. Guan, D.S.; Chen, Y.J.; Huang, F.F. The storage and distribution of carbon in urban vegetation and its roles in balance of carbon and oxygen in Guangzhou. China Environ. Sci. 1998, 18, 437–441. (In Chinese) [Google Scholar]
  18. Nakazawa, T. Variation and cycles of carbon dioxide and methane. Glob. Environ. Res. 1997, 2, 5–14. [Google Scholar]
  19. Boulain, N.; Cappelaere, B.; Séguis, L.; Gignoux, J.; Peugeot, C. Hydrologic and land use impacts on vegetation growth and NPP at the watershed scale in a semi-arid environment. Reg. Environ. Change 2006, 6, 147–156. [Google Scholar] [CrossRef]
  20. Wang, Y.; Zhang, N.; Yu, G.R. Simulation of carbon cycle in Qianyanzhou artificial masson pine forest ecosystem and sensitivity analysis of model parameters. Chin. J. Appl. Ecol. 2010, 21, 1656–1666. (In Chinese) [Google Scholar]
  21. Xu, C.; Li, Y.T.; Hu, J.; Yang, X.J.; Sheng, S.; Liu, M.S. Evaluating the difference between the normalized difference vegetation index and net primary productivity as the indicators of vegetation vigor assessment at landscape scale. Environ. Monit. Assess. 2012, 184, 1275–1286. [Google Scholar] [CrossRef] [PubMed]
  22. Zhang, Y.J.; Zhou, G.S. Exploring the effects of water on vegetation change and net primary productivity along the IGBP Northeast China Transect. Environ. Earth Sci. 2011, 62, 1481–1490. [Google Scholar] [CrossRef]
  23. Zhu, W.Q.; Pan, Y.Z.; Yang, X.Q.; Song, G.B. Comprehensive analysis of the impact of climatic changes on Chinese terrestrial net primary productivity. Chin. Sci. Bull. 2007, 52, 3253–3260. [Google Scholar] [CrossRef]
  24. Dong, Y.W. Study on balance of oxygen in urban ecology—Taking Nanjing city as example. Urban Environ. Urban Ecol. 1995, 8, 15–18. (In Chinese) [Google Scholar]
  25. Ma, J.Y.; Yin, K.; Lin, T. Analysis of the carbon and oxygen balance of a complex urban ecosystem: A case study in the coastal city of Xiamen. Acta Sci. Circumst. 2011, 31, 1808–1816. (In Chinese) [Google Scholar]
  26. Nowak, D.J.; Hoehn, R.; Crane, D.E. Oxygen production by urban trees in the United States. Arboric. Urban For. 2007, 33, 220–226. [Google Scholar]
  27. Peng, J.Y. Roles of vegetation on balance of carbon and oxygen in the Pearl River Delta. Acta Sci. Nat. Univ. Sunyatseni 2003, 42, 105–108. (In Chinese) [Google Scholar]
  28. Zhang, L.X.; Liu, Q.; Hall, N.W.; Fu, Z.T. An environmental accounting framework applied to green space ecosystem planning for small towns in China as a case study. Ecol. Econ. 2007, 60, 533–542. [Google Scholar] [CrossRef]
  29. Gui, L.D. Relationship between urbanization level and ecological land demand and supply in Lanzhou city. Bull. Soil Water Conserv. 2012, 32, 298–302. (In Chinese) [Google Scholar]
  30. Peng, J.; Jiang, Y.Y.; Li, Z.G.; Zhang, X.F.; Li, W.F.; Yue, J. Evaluation of land use efficiency—A case study of Jiangnin County. Resour. Environ. Yangtze Basin 2005, 14, 304–309. (In Chinese) [Google Scholar]
  31. Reddy, M.K.; Rao, K.G.R.; Rao, I.R. Air quality status of Visakhapatnam (India)—Indices basis. Environ. Monit. Assess. 2004, 95, 1–12. [Google Scholar] [CrossRef] [PubMed]
  32. Hou, M.T.; Hu, Y.H.; He, Y.T. Modifications in vegetation cover and surface albedo during rapid urbanization: A case study from South China. Environ. Earth Sci. 2014, 72, 1659–1666. [Google Scholar] [CrossRef]
  33. Sun, Q.Q.; Wu, Z.F.; Tan, J.J. The relationship between land surface temperature and land use/land cover in Guangzhou, China. Environ. Earth Sci. 2012, 65, 1687–1694. [Google Scholar] [CrossRef]
  34. Peng, J.; Wang, Y.L.; Jing, J.; Song, Z.Q.; Han, D. Research on integrated regional planning of urban landscape functions: A case study in Shenzhen City. Acta Ecol. Sin. 2005, 25, 1714–1719. (In Chinese) [Google Scholar]
  35. Yang, L.Y.; Wu, Y.; Zhang, J.; Liu, S.M.; Deng, B. Burial of terrestrial and marine organic carbon in Jiaozhou Bay: Different responses to urbanization. Reg. Environ. Chang. 2011, 11, 707–714. [Google Scholar] [CrossRef]
  36. Deng, Y.B.; Fan, F.L.; Chen, R.R. Extraction and analysis of impervious surfaces based on a spectral un-mixing method using Pearl River Delta of China Landsat TM/ETM+ imagery from 1998 to 2008. Sensors 2012, 12, 1846–1862. [Google Scholar] [CrossRef] [PubMed]
  37. Zhang, K.; Wei, Y.L.; Zeng, E.Y. A review of environmental and human exposure to persistent organic pollutants in the Pearl River Delta, South China. Sci. Total Environ. 2013, 463, 1093–1110. [Google Scholar] [CrossRef] [PubMed]
  38. Zhu, Z.; Zheng, B.H.; He, Q.Y. Study on evolution of spatial structure of Pearl River Delta urban agglomeration and its effects. Econ. Geogr. 2011, 31, 404–408. (In Chinese) [Google Scholar]
  39. Lin, W.S.; Zhang, L.; Du, D.S.; Yang, L.M.; Lin, H.; Zhang, Y.Z.; Li, J.N. Quantification of land use/land cover changes in Pearl River Delta and its impact on regional climate in summer using numerical modeling. Reg. Environ. Chang. 2009, 9, 75–82. [Google Scholar] [CrossRef]
  40. Chen, Y.M.; Li, X.; Zheng, Y.; Guan, Y.Y.; Liu, X.P. Estimating the relationship between urban forms and energy consumption: A case study in the Pearl River Delta, 2005–2008. Landsc. Urban Plan. 2011, 102, 33–42. [Google Scholar] [CrossRef]
  41. Gao, Y.; Wu, Z.F.; Lou, Q.S.; Huang, H.M.; Cheng, J.; Chen, Z.L. Landscape ecological security assessment based on projection pursuit in Pearl River Delta. Environ. Monit. Assess. 2012, 184, 2307–2319. [Google Scholar] [CrossRef] [PubMed]
  42. EARTHDATA: LP DAAC. Available online: https://lpdaac.usgs.gov/dataset_discovery/modis/modis_products_table/mod17a2 (accessed on 17 September 2015).
  43. China Meteorological Administration. Available online: http://www.cma.gov.cn/ (accessed on 17 September 2015).
  44. Atmospheric Oxygen Decline due to Fossil Fuel Combustion. Available online: http://www.climateemergencyinstitute.com/atmos_oxy_karen_v-t.html (accessed on 14 February 2012).
  45. Kwon, Y.S.; Larsen, C.P.S. An assessment of the optimal scale for monitoring of MODIS and FIA NPP across the eastern USA. Environ. Monit. Assess. 2013, 185, 7263–7277. [Google Scholar] [CrossRef] [PubMed]
  46. Keum, D.K.; Kim, B.H.; Lim, K.M.; Choi, Y.H. Radiation exposure to Marine biota around the Fukushima Daiichi NPP. Environ. Monit. Assess. 2014, 186, 2949–2956. [Google Scholar] [CrossRef] [PubMed]
  47. Nayak, R.K.; Patel, N.R.; Dadhwal, V.K. Estimation and analysis of terrestrial net primary productivity over India by remote-sensing-driven terrestrial biosphere model. Environ. Monit. Assess. 2010, 170, 195–213. [Google Scholar] [CrossRef] [PubMed]
  48. Evrendilek, F.; Berberoglu, S.; Meydan, S.T.; Yilmaz, E. Quantifying carbon budgets of conifer Mediterranean forest ecosystems, Turkey. Environ. Monit. Assess. 2006, 119, 527–543. [Google Scholar] [CrossRef] [PubMed]
  49. Cui, X.; Feng, Q.S.; Liang, T.G. Research progress on remote sensing based net primary productivity of terrestrial vegetation. Prat. Sci. 2007, 24, 36–42. (In Chinese) [Google Scholar]
  50. Zhang, L.J.; Ma, J.; Yan, X.D.; Liu, D.; Zhang, L. Study on the estimation of regional oxygen production: A case study in Harbin. Prog. Geogr. 2012, 31, 337–343. (In Chinese) [Google Scholar]
  51. Wei, Y.X.; Wang, L.W. A review on researching scale effect of net primary productivity based on remote sensing. Prog. Geogr. 2010, 29, 471–477. [Google Scholar]
  52. Band, L.E.; Peterson, D.L.; Running, S.W.; Coughlan, J.; Lammers, R.; Dungan, J.; Nemani, R. Forest ecosystem process at the watershed scale: Basis for distributed simulation. Ecol. Model. 1991, 56, 171–196. [Google Scholar] [CrossRef]
  53. Foley, J.A.; Prentice, I.C.; Ramankutty, N.; Levis, S.; Pollard, D.; Sitch, S.; Haxeltine, A. An integrated biosphere model of land surface processes, terrestrial carbon balance, and vegetation dynamics. Glob. Biogeochem. Cycles 1996, 10, 603–628. [Google Scholar] [CrossRef]
  54. Liu, J.; Chen, J.M.; Cihlar, J.; Park, W.M. A process-based boreal ecosystem productivity simulator using remote sensing inputs. Remote Sens. Environ. 1997, 62, 158–175. [Google Scholar] [CrossRef]
  55. Sellers, P.J.; Los, S.O.; Tucker, C.J.; Justice, C.O.; Dazlich, D.A.; Collatz, G.J.; Randall, D.A. A revised land surface parameterization (SiB2) for atmospheric GCMs. Part II: The generation of global fields of terrestrial biophysical parameters from satellite data. J. Clim. 1996, 9, 706–737. [Google Scholar] [CrossRef]
  56. Goetz, S.J.; Prince, S.D.; Goward, S.N.; Thawley, M.M.; Small, J. Satellite remote sensing of primary production: An improved production efficiency modelling approach. Ecol. Model. 1999, 122, 239–255. [Google Scholar] [CrossRef]
  57. Ruimy, A.; Dedieu, G.; Saugier, B. TURC: A diagnostic model of continental gross primary productivity and net primary productivity. Glob. Biogeochem. Cycle. 1996, 10, 269–285. [Google Scholar] [CrossRef]
  58. Veroustraete, F.; Sabbe, H.; Eerens, H. Estimation of carbon mass fluxes over Europe using the C-Fix model and Euroflux data. Remote Sens. Environ. 2002, 83, 376–399. [Google Scholar] [CrossRef]
  59. Maisongrande, P.; Ruimy, A.; Dedieu, G.; Saugier, B. Monitoring seasonal and interannual variations of gross primary productivity, net primary productivity and net ecosystem productivity using a diagnostic model and remotely sensed data. Tellus 1995, 47, 178–190. [Google Scholar] [CrossRef]
  60. Deng, X.K.; Liu, Y.F.; Li, J.W. Comparative study on regional carbon footprint of energy consumption calculation models: A case study of Hubei province. Ecol. Environ. Sci. 2012, 21, 1533–1538. (In Chinese) [Google Scholar]
  61. Luan, Y.; Chen, S.H.; Yin, Z.D.; Gao, S.M.; Zhou, X.C. The analysis of the Zhuhai city ecosystem environment quality evaluation and problem. Res. Soil Water Conserv. 2008, 15, 186–189. (In Chinese) [Google Scholar]
  62. Niu, Y.Q.; Li, S.J.; Luo, X.; Hu, Y.N. Study on ecological land demand of Shijiazhuang City based on carbon-oxygen balance method. J. Anhui Agric. Sci. 2012, 40, 7325–7327. (In Chinese) [Google Scholar]
  63. Cao, M.K.; Tao, B.; Li, K.R.; Shao, X.M.; Stephen, D.P. Interannual variation in terrestrial ecosystem carbon fluxes in China from 1981 to 1998. Acta Bot. Sin. 2003, 45, 552–560. [Google Scholar]
  64. Chen, B.; Wang, S.Q.; Liu, R.G.; Song, T. Study on modeling and spatial pattern of net primary production in China’s terrestrial ecosystem. Res. Sci. 2007, 29, 45–53. (In Chinese) [Google Scholar]
  65. Song, J.M.; Li, X.G.; Yuan, H.M.; Zhen, G.X.; Yang, Y.F. Carbon fixed by phytoplankton and cultured algae in China coastal seas. Acta Ecol. Sin. 2008, 28, 551–558. (In Chinese) [Google Scholar]
  66. Tang, F.D.; Han, S.J.; Zhang, J.H. Carbon dynamics of broad-leaved Korean pine forest ecosystem in Changbai Mountains and its responses to climate change. Chin. J. Appl. Ecol. 2009, 20, 1285–1292. (In Chinese) [Google Scholar]
  67. Hamilton, J.G.; DeLucia, E.H.; George, K.; Naidu, S.L.; Finzi, A.C.; Schlesinger, W.H. Forest carbon balance under elevated CO2. Ecosyst. Ecol. 2002, 131, 250–260. [Google Scholar]
  68. Sun, R.; Zhu, Q.J. Distribution and seasonal change of net primary productivity in China from April, 1992 to March, 1993. Acta Geogr. Sin. 2000, 55, 36–45. (In Chinese) [Google Scholar]

