Strategies of Building a Stronger Sense of Community for Sustainable Neighborhoods: Comparing Neighborhood Accessibility with Community Empowerment Programs

Abstract
:1. Introduction
2. Past Literature
2.1. Community Attachment and Social Interaction
2.2. Community Identity and Sense of Community
2.3. Pedestrianism and Neighborhood Accessibility
2.4. Measuring Sense of Community Based on 11 Questions in Likert Scale
2.5. Review of Taiwan’s Community Empowerment Program Influencing on Sense of Community
3. Method

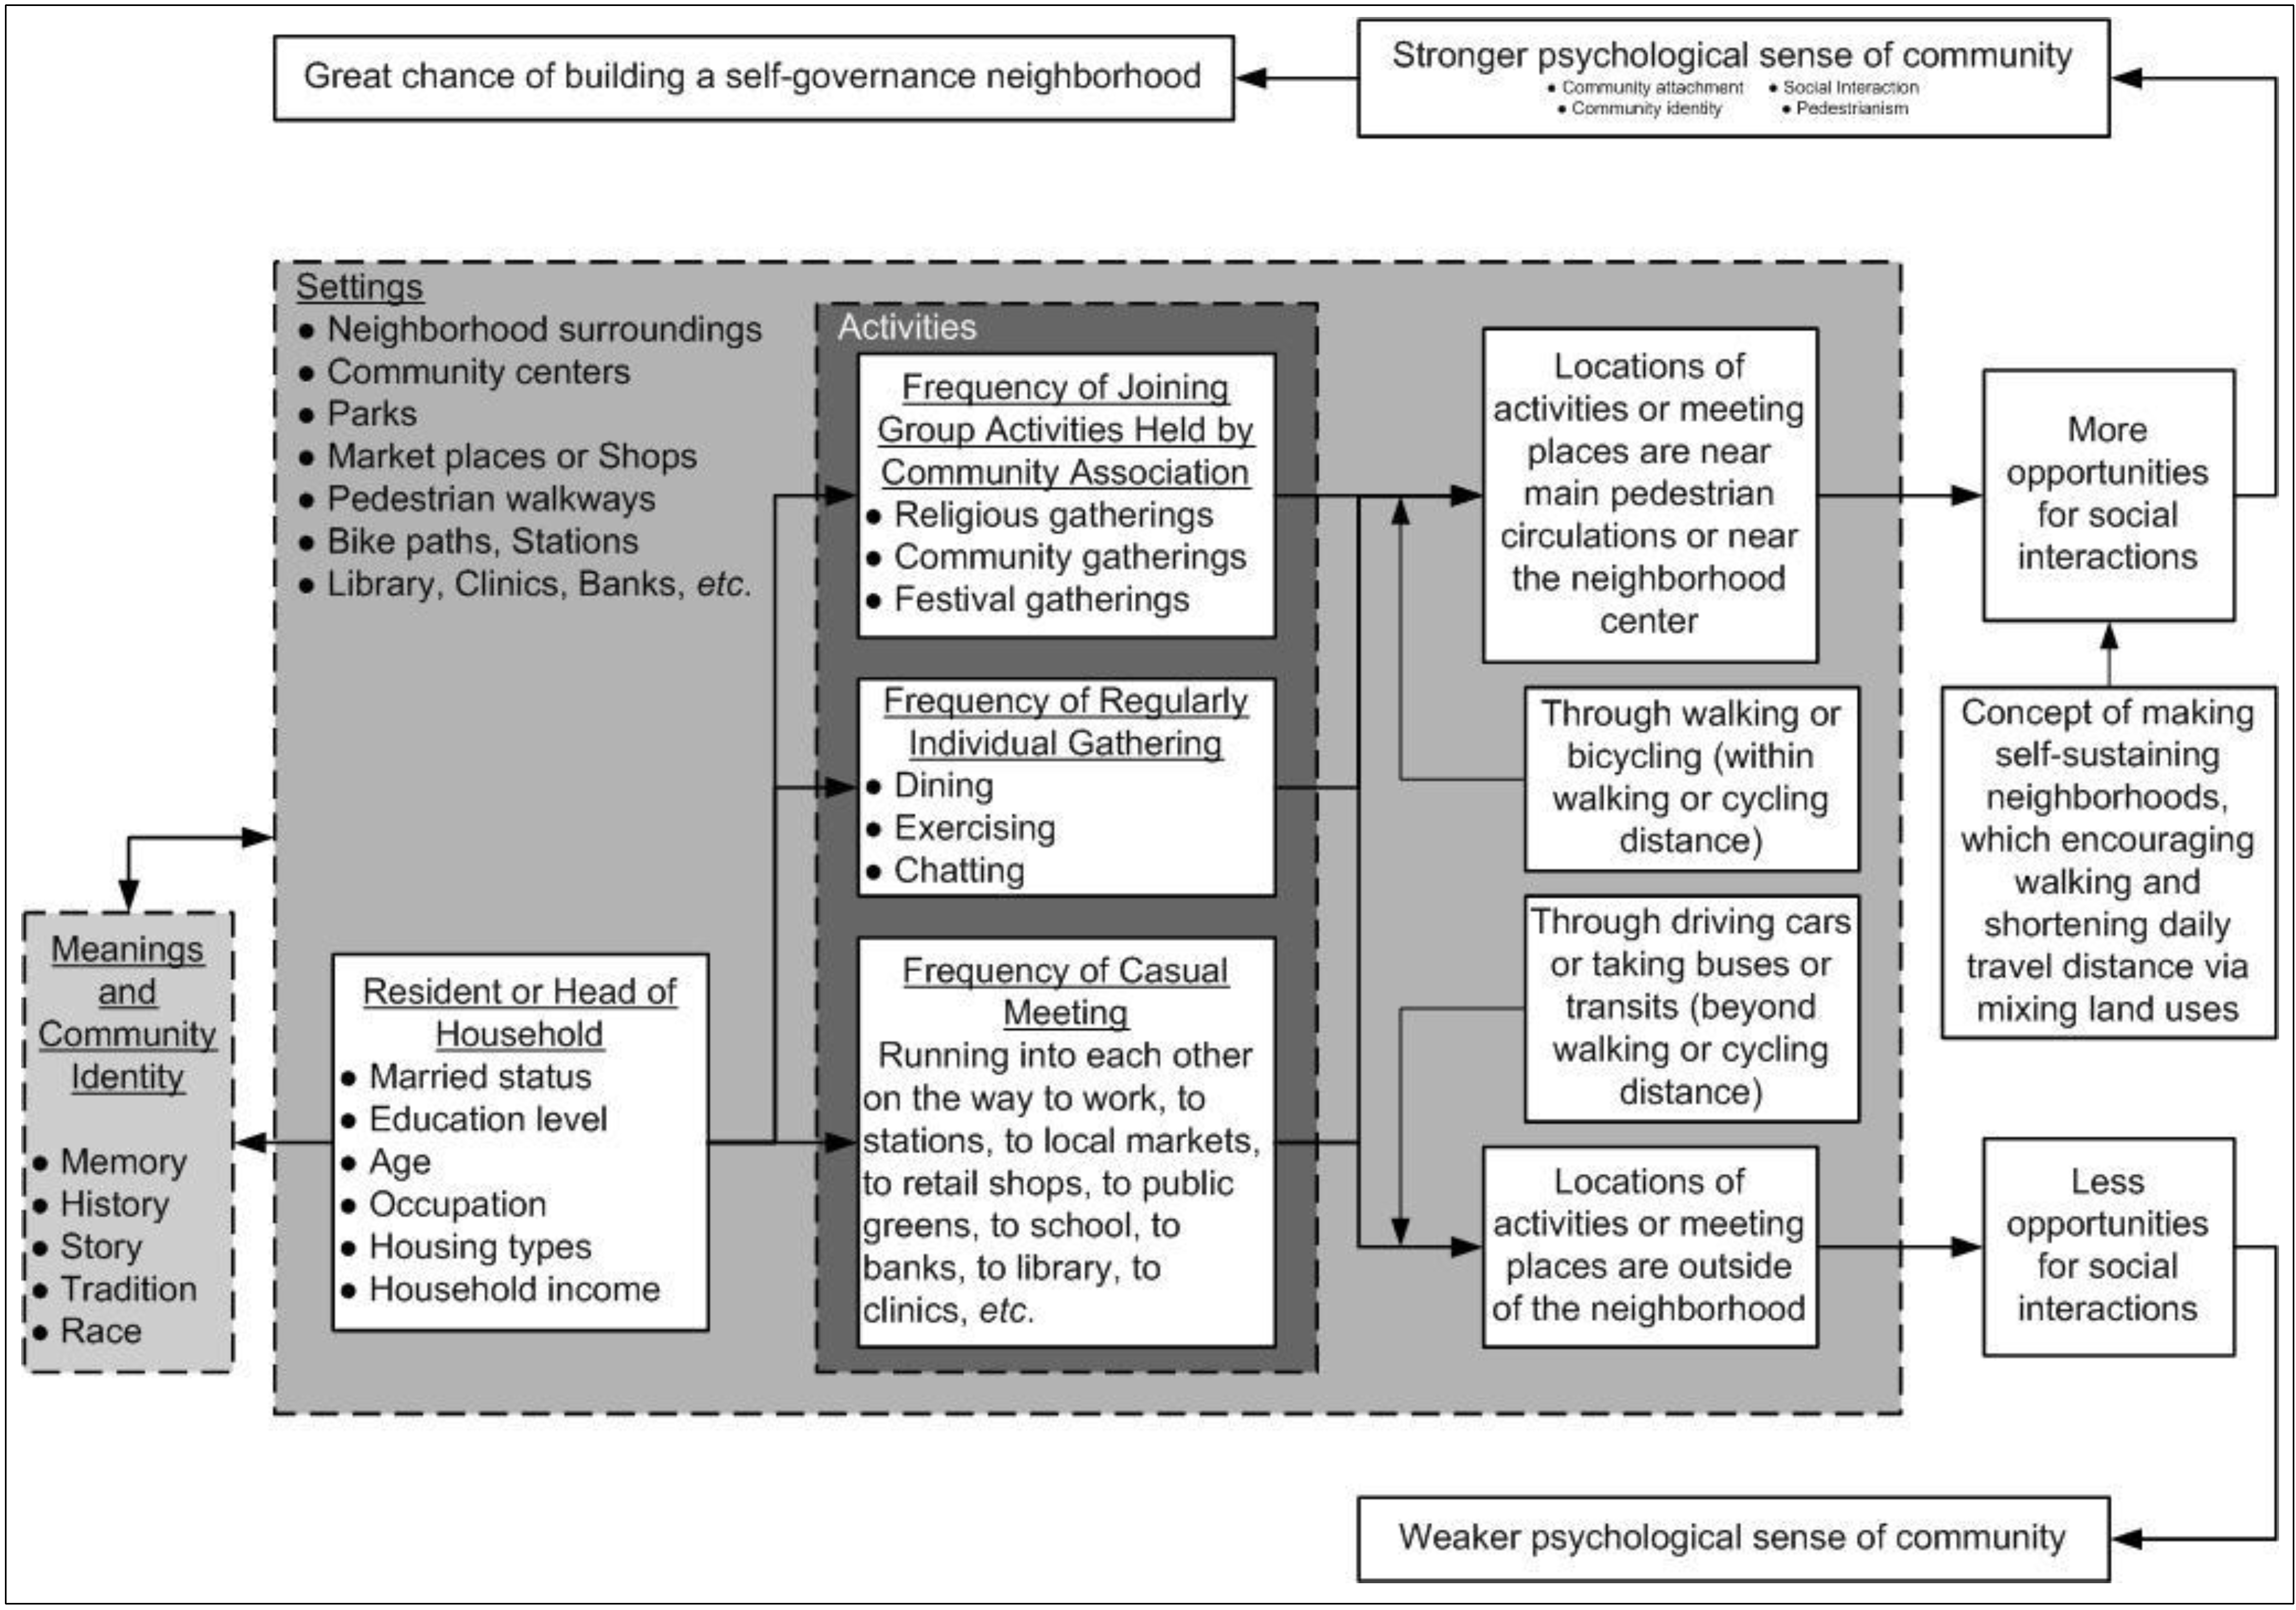
- “Degree of PSOC” is the degree of psychological sense of community based on neighborhood unit;
- “Bckgrnd” is the backgrounds of residents and their household conditions together with neighborhood identity (unique character or identity of their community) at neighborhood scale;
- “ActvtyDstnc” is the settings and physical spatial configurations of types of activities found at several locations within the neighborhoods; and
- “FrquncyMtng” is the frequencies of residents participating in social activity gatherings.
3.1. Independent Variables

| Number of questionnaire survey obtained | Population in 2009 | Number of households in 2009 | Number of members joining community association in 2009 | Ratio of housing type in the neighborhood | ||
|---|---|---|---|---|---|---|
| Neighborhood | Under 3 stories | 3–5 stories | Above 5 stories | |||
| 65 | 5394 | 1968 | 223 | 96% | 4% | 0% |
| 32 | 977 | 383 | 80 | 98% | 2% | 0% |
| 12 | 1936 | 748 | 53 | 95% | 5% | 0% |
| 21 | 2481 | 837 | 90 | 96% | 4% | 0% |
| 331 | 94446 | 39353 | 1670 | 39% | 50% | 11% |
| 19 | 3435 | 1164 | 210 | 85% | 14% | 1% |
| 16 | 7799 | 3080 | 50 | 64% | 27% | 9% |
| 12 | 4942 | 1850 | 80 | 45% | 52% | 3% |
| 14 | 9872 | 3341 | 320 | 67% | 29% | 4% |
| 19 | 11020 | 3649 | 100 | 20% | 79% | 1% |
| 19 | 7966 | 2745 | 80 | 23% | 66% | 11% |
| 27 | 5719 | 1914 | 100 | 11% | 84% | 5% |
| 38 | 9294 | 3102 | 68 | 25% | 72% | 3% |
| 18 | 7828 | 2618 | 156 | 35% | 62% | 3% |
| 19 | 7483 | 2524 | 100 | 24% | 71% | 5% |
| 23 | 6480 | 2256 | 72 | 54% | 33% | 13% |
| 16 | 7935 | 2871 | 70 | 31% | 36% | 33% |
| 39 | 5594 | 1853 | 90 | 19% | 75% | 6% |
| 16 | 8674 | 3104 | 78 | 34% | 65% | 1% |
| 16 | 4894 | 1612 | 60 | 69% | 26% | 5% |
| 20 | 4658 | 1670 | 36 | 16% | 10% | 74% |
3.2. Dependent Variable
| Suburban | ||||
|---|---|---|---|---|
| Mean | Median | S.D. | Mean | Median |
| −0.0294 | −0.0278 | 0.0510 | −0.0114 | −0.0108 |
| 2.71 | 2.60 | 0.19 | 2.89 | 2.96 |
| 7328.2 | 492.37 | 9974.3 | 22,405.15 | 15,8778 |
| 0.9633 | 0.9600 | 0.0125 | 0.4047 | 0.3100 |
| 0.0367 | 0.0400 | 0.0125 | 0.4984 | 0.5962 |
| 0.0000 | 0.0000 | 0.0000 | 0.0922 | 0.0300 |
| 2545.0 | 2400.0 | 1948.0 | 608.24 | 465.00 |
| 14.55 | 13.56 | 2.79 | 15.75 | 15.59 |
| 0.4407 | 0.4333 | 0.0909 | 0.3461 | 0.3125 |
| 43.65 | 43.33 | 3.57 | 49.81 | 48.75 |
| 0.6593 | 0.6667 | 0.1725 | 0.5574 | 0.5000 |
| 31.38 | 37.69 | 11.57 | 19.93 | 12.98 |
| 3.89 | 4.37 | 1.28 | 2.82 | 2.10 |
| 0.6520 | 0.7778 | 0.2184 | 0.9235 | 0.8400 |
| 0.1750 | 0.1111 | 0.1749 | 0.2820 | 0.2632 |
| 0.5792 | 0.5000 | 0.1530 | 0.4765 | 0.4444 |
| 576,666 | 185,000 | 553,900 | 724,981 | 772,500 |
| 1.88 | 1.25 | 1.03 | 1.35 | 1.00 |
| Suburban | ||||
|---|---|---|---|---|
| Mean | Median | S.D. | Mean | Median |
| 3.3595 | 3.5556 | 0.3761 | 3.7881 | 3.8235 |
| 3.3640 | 3.3333 | 0.3105 | 3.5600 | 3.5600 |
| 4.2446 | 4.3448 | 0.3032 | 4.4028 | 4.4375 |
| 3.8148 | 3.7778 | 0.1386 | 3.7897 | 3.7778 |
| 3.8563 | 4.0690 | 0.4995 | 4.0214 | 4.0625 |
| 3.0958 | 3.6207 | 0.7751 | 3.5166 | 3.5625 |
| 3.1775 | 3.3103 | 0.3748 | 3.2368 | 3.2222 |
| 2.1296 | 2.0000 | 0.2658 | 2.0632 | 2.0000 |
| 2.4111 | 2.2333 | 0.4272 | 2.4874 | 2.4118 |
| 3.4370 | 3.4444 | 0.3539 | 3.6330 | 3.7105 |
| 3.5111 | 3.8667 | 0.5996 | 3.7115 | 3.7647 |
3.3. Data Collection

4. Existing Neighborhood Identity and Situations of 19 Selected Neighborhoods
| Empowerment programs held by community association (Information obtained through face-to-face interviewing community associations) | Most place chosen for group gathering held by community association |
|---|---|
| Neighborhood | |
| Mainly private house | |
| Ecotourism, Lily of Nile festival | Private house or Restaurant |
| Local Chinese orchestra, Bakery class, Religious ceremony | Private house, Community office |
| Local Chinese orchestra, Religious ceremony, Festival parties, Yoga class | Private house |
| Mainly community office | |
| Local Chinese orchestra, Religious ceremony, Festival parties | Community office |
| Elderly care, Computer and English conversation classes, Festival parties, Flea market, Community cleaning day | Community office |
| Elderly care, Community cleaning-up day, Community gardening day | Community office |
| Ecotourism, Elderly care, Healthcare, Old tree and wildlife protection works | Community office |
| Festival parties, Computer class, Barbecue party, Religious ceremony | Riverfront |
| Elderly care, Waste recycle, | Community office, Park |
| Flea market, Mountain hiking, Festival parties, Drawing competition | Community office |
| Health care, Parenting class, Childcare, Mountain hiking | Community office |
| Elderly care, Singing class, Art exhibition, Community gardening day | Community office, Community office |
| Elderly care, Singing class, Festival parties, Community cleaning-up day | Community office Community office |
| Elderly care, Waste recycle, Festival parties, Healthcare | Community office, Public green |
| Community publication, Festival parties, Community cleaning-up day, Outdoor travel | Private house, Community office |
| Community cleaning-up day, Festival parties, Flea market | Community office |
| Singing and conversation classes, Festival parties | Community office |
| Elderly care, Community cleaning-up day, Community gardening day | Community office |
| Singing and dancing classes, Festival parties, Outdoor travel | Public parks, Community office |
5. Empirical Evidence
5.1. Mode Choice for Daily Activities
| For Works | For Daily Shopping | For Leisure | Taking Children to School | To Bank | To Post Office | To Library | To Clinics |
|---|---|---|---|---|---|---|---|
| 20% | 6% | 8% | 18% | 2% | 4% | 3% | 11% |
| 33% | 26% | 16% | 36% | 39% | 23% | 23% | 28% |
| 9% | 14% | 6% | 2% | 9% | 9% | 10% | 7% |
| 17% | 51% | 68% | 41% | 46% | 61% | 58% | 43% |
| 21% | 3% | 3% | 3% | 4% | 4% | 6% | 12% |
| 42% | 45% | 14% | 13% | 36% | 35% | 10% | 47% |
| 30% | 27% | 17% | 29% | 32% | 36% | 39% | 30% |
| 0% | 0% | 8% | 0% | 3% | 3% | 0% | 0% |
| 14% | 7% | 55% | 56% | 15% | 7% | 26% | 4% |
| 14% | 21% | 5% | 2% | 14% | 18% | 26% | 19% |
5.2. Comparison of Shortening Inner Neighborhood Travels and Encouraging Community Activity Participation for Promoting a Stronger Psychological Sense of Community
| Step + in/- out | B | t-value(12) |
| 0.444536 | 4,41989 | |
| 1 | −0.001991 | −5.29806 |
| 2 | 0.172702 | 4.59373 |
| 3 | 0.151835 | 3.81848 |
| 4 | −0.164942 | −5.04524 |
| 5 | 0.106275 | 1.78473 |
| 6 | −0.031738 | −3.53253 |
| 7 | 0.070187 | 2.40045 |
| 8 | 0.032446 | 1.93187 |
- (1)
- Provide enough incentives to encourage old neighborhood renewal so that homeownership organizations of those renewal residential buildings (taller than five stories) are able to help residents building strong community attachment. Based on Taiwan’s “Apartment and Condominium Management Ordinance”, developers of new high-rises and apartments have to set up a public funding (certain percentages of construction cost) and transfer it to homeownership associations later for maintaining communities. Other than collecting maintenance fee, homeownership associations often hold festival parties and regular homeownership meetings together with maintaining community safety and taking care of their surrounding outdoor space. Moreover, many new high-rises reserve the ground level as public activity space where residents can meet and interact with their neighbors easily. Their SOC is therefore stronger.
- (2)
- Rearrange the underused outdoor spaces along the major pedestrian corridors to small public places such as corner cafes, so that residents can meet each other casually and having extra chances of social interaction.
- (1)
- A neighborhood having larger percentages of residents of education level under college seems to build better community cohesion. Since Beitou district was once zoned as either agricultural or industrial land usages together with development limitation, residents were less wealthy and often blue-collar workers. They worked either in the neighborhood or adjacent districts, and have similar spare time to meet with each other thereby the degree of SOC is enhanced.
- (2)
- A neighborhood having less numbers of persons per household is likely to form a stronger SOC. Based on interviews, we are told that young couples have no choice but to ask neighbors for taking care of their children, when both of them are busy on works. Therefore, a neighborhood having more households of fewer members is likely to increase opportunities of asking helps thereby the degree of SOC is elevated.
- (3)
- A neighborhood having a larger ratio of households of married couples with children seems to maintain stronger community cohesion, due to parents having more chances of meeting each other while taking their children to schools or participating in school activities. This finding has been discovered by several other researchers as well [2,4].
6. Conclusions and Discussion
Conflicts of Interest
References
- Talen, E. Sense of Community and Neighborhood Form: An Assessment of the Social Doctrine of New Urbanism. Urban Stud. 1999, 36, 1361–1379. [Google Scholar] [CrossRef]
- Nasar, J.L.; Julian, D.A. The Psychological Sense of community in the Neighborhood. J. Am. Plan. Assoc. 1995, 61, 178–184. [Google Scholar] [CrossRef]
- Garde, A.M. New Urbanism as Sustainable Growth? A Supply Side Story and Its Implications for Public Policy. J. Plan. Educ. Res. 2004, 24, 154–170. [Google Scholar] [CrossRef]
- Lund, H. Pedestrian Environments and Sense of Community. J. Plan. Educ. Res. 2002, 21, 301–312. [Google Scholar] [CrossRef]
- Kim, J.; Kaplan, R. Physical and Psychological Factors in Sense of Community: New Urbanist Kenlands and Nearby Orchard Village. Environ. Behav. 2004, 36, 313–340. [Google Scholar] [CrossRef]
- Tseng, S.C. Community Building in Taiwan; Walkers Cultural Enterprise Ltd.: New Taipei City, Taiwan, 2009. (In Chinese) [Google Scholar]
- Wu, K.L. Developing an Evaluation Framework for Community Empowerment from the Viewpoint of Sustainable Communities: A Study on the Experiences of Tainan City and Tainan County. J. Housing Stud. 2007, 16, 21–55. (In Chinese) [Google Scholar]
- Sarason, S.B. The Psychological Sense of Community: Prospects for a Community Psychology; Jossey-Bass: San Francisco, CA, USA, 1974. [Google Scholar]
- McMillan, D.W.; Chavis, D.M. Sense of Community: A Definition and Theory. J. Community Psychol. 1986, 14, 6–23. [Google Scholar] [CrossRef]
- Perkins, D.D.; Long, D.A. Neighborhood Sense of Community and Social Capital: A Multi-level Analysis. In Psychological Sense of Community: Research, Applications, and Implications; Fisher, A.T., Sonn, C.C., Bishop, B.J., Eds.; Plenum: New York, NY, USA, 2002; pp. 291–318. [Google Scholar]
- Putnam, R.D. Bowling Alone: American’s Declining Social Capital. J. Democr. 1995, 6, 65–78. [Google Scholar] [CrossRef]
- Rosenblatt, T.; Cheshire, L.; Lawrence, G. Social Interaction and Sense of Community in a Master Planned Community. Hous.Theory Soc. 2009, 26, 122–142. [Google Scholar] [CrossRef]
- Relph, E. Place and Placelessness; Pion Books: London, UK, 1976. [Google Scholar]
- Gospodini, A. Urban Morphology and Place Identity in European Cities: Built Heritage and Innovative Design. J. Urban Des. 2004, 9, 225–248. [Google Scholar] [CrossRef]
- Hummon, D.M. Commonplaces: Community Ideology and Identity in American Culture; State University of New York Press: Albany, NY, USA, 1990. [Google Scholar]
- Kim, J. Perceiving and Valuing Sense of Community in a New Urbanist Development: A Case Study of Kentlands. J. Urban Des. 2007, 12, 203–230. [Google Scholar] [CrossRef]
- Keen, M.; Mahanty, S.; Sauvage, J. Sustainability Assessment and Local Government: Achieving Innovation through Practitioner Network. Local Envir. 2006, 11, 201–216. [Google Scholar] [CrossRef]
- Punter, J. Participation in the Design of Urban Space. Landscape Des. 1991, 200, 24–27. [Google Scholar]
- Montgomery, J. Making a City: Urbanity, Vitality and Urban Design. J. Urban Des. 1998, 3, 93–116. [Google Scholar] [CrossRef]
- Gotham, K.F. Political Opportunity, Community Identity, and the Emergence of a Local Anti-Expressway Movement. Soc. Probl. 1999, 46, 332–354. [Google Scholar] [CrossRef]
- Lee, Y.J. Community Empowerment vis-à-vis Globalization: Case of Taiwan. J. State and Soc. 2009, 7, 1–27. (In Chinese) [Google Scholar]
- Jabareen, Y.R. Sustainable Urban Forms: Their Typologies, Models, and Concepts. J. Plan. Educ. Res. 2006, 26, 38–52. [Google Scholar] [CrossRef]
- Carmona, M.; Tiesdell, S.; Heath, T.; Oc, T. Public Places Urban Spaces: The Dimensions of Urban Design; Architectural Press: Oxford, UK, 2010. [Google Scholar]
- Handy, S.; Clifton, K.J. Evaluating Neighborhood Accessibility: Possibilities and Practicalities. J. Transport. Stat. 2001, 4, 67–78. [Google Scholar]
- Bromley, R.D.F.; Tallon, A.R.; Thomas, C.J. City Centre Regeneration through Residential Development: Contributing to Sustainability. Urban Stud. 2005, 42, 2407–2429. [Google Scholar] [CrossRef]
- Tsai, T.A. A Study of Integrating the Principles of New Urbanism with Urban Development Indicators for Achieving Community Sustainability—Case of the Communities in Beitou District, Taipei, Taiwan; Research Project ID: NSC96-2415-H-034-009-SS2; National Science Council: Taipei, Taiwan, 2009. (In Chinese) [Google Scholar]
- Glynn, T.J. Psychological Sense of Community: Measurement and Application. Hum. Relat. 1981, 32, 789–818. [Google Scholar] [CrossRef]
- Filipovič Hrast, M.; Dolničar, V. Sense of Community and the Importance of Values: Comparison of Two Neighborhoods in Slovenia. J. Urban Aff. 2011, 34, 317–336. [Google Scholar]
- Herson, L.J.R.; Bolland, J.M. The Urban Web: Politics, Policy, and Theory; Nelson-Hall Publishers: Chicago, IL, USA, 1991. [Google Scholar]
- Barrett, B.; Usui, M. Local Agenda 21 in Japan: Transforming Local Environmental Governance. Local Envir. 2002, 7, 49–67. [Google Scholar] [CrossRef]
- Chang, H.C. A Study on Basic Agricultural Extension Organizations Involving Taiwan’s Rural Community Empowerment Program. Community Dev. J. 2007, 120, 312–329. (In Chinese) [Google Scholar]
- Nishisato, S. Dual Scaling. In The Sage Handbook of Quantitative Methodology for the Social Sciences; Kaplan, D., Ed.; SAGE Publications, Inc.: Thousand Oaks, CA, USA, 2004; pp. 3–24. [Google Scholar]
- Hibbard, M.; Lurie, S. Saving Land but Losing Ground: Challenges to Community Planning in the Era of Participation. J. Plan. Educ. Res. 2000, 20, 187–195. [Google Scholar]
- Wang, A. Reclaiming a Sense of Community. Taiwan Review. 1 April 2008. Available online: http://taiwanreview.nat.gov.tw/fp.asp?xItem=30741&CtNode=119 (accessed on 16 March 2012).
- Davidson, K.M.; Venning, J. Sustainability Decision-making Frameworks and the Application of Systems Thinking: An Urban Context. Local Envir. 2011, 16, 213–228. [Google Scholar] [CrossRef]
- Mapes, J.; Wolch, J. “Living Green”: The Promise and Pitfalls of New Sustainable Communities. J. Urban Des. 2011, 16, 105–126. [Google Scholar] [CrossRef]
- Rohe, W.H. From Local to Global: One Hundred Years of Neighborhood Planning. J. Am. Plan. Assoc. 2009, 75, 209–230. [Google Scholar] [CrossRef]
- Tsai, T.A. What Businesses and Services Promote Shorter Inner Neighborhood Travels under Mixed Land Uses Strategy? J. Habitat Eng. Des. 2013, 5, 49–64. [Google Scholar]
- Xu, Q.; Perkins, D.D.; Chow, J.C.C. Sense of Community, Neighboring, and Social Capital as Predictors of Local Political Participation in China. Am. J. of Community Psychol. 2010, 45, 259–271. [Google Scholar] [CrossRef]
© 2014 by the authors; licensee MDPI, Basel, Switzerland. This article is an open access article distributed under the terms and conditions of the Creative Commons Attribution license (http://creativecommons.org/licenses/by/3.0/).
Share and Cite
Tsai, T.-I.A. Strategies of Building a Stronger Sense of Community for Sustainable Neighborhoods: Comparing Neighborhood Accessibility with Community Empowerment Programs. Sustainability 2014, 6, 2766-2785. https://doi.org/10.3390/su6052766
Tsai T-IA. Strategies of Building a Stronger Sense of Community for Sustainable Neighborhoods: Comparing Neighborhood Accessibility with Community Empowerment Programs. Sustainability. 2014; 6(5):2766-2785. https://doi.org/10.3390/su6052766
Chicago/Turabian StyleTsai, Te-I Albert. 2014. "Strategies of Building a Stronger Sense of Community for Sustainable Neighborhoods: Comparing Neighborhood Accessibility with Community Empowerment Programs" Sustainability 6, no. 5: 2766-2785. https://doi.org/10.3390/su6052766