A GIS-Based Approach in Support of Spatial Planning for Renewable Energy: A Case Study of Fukushima, Japan

Abstract
:1. Introduction
2. Planning for Renewable Energy: A Chance for Spatial Planning?
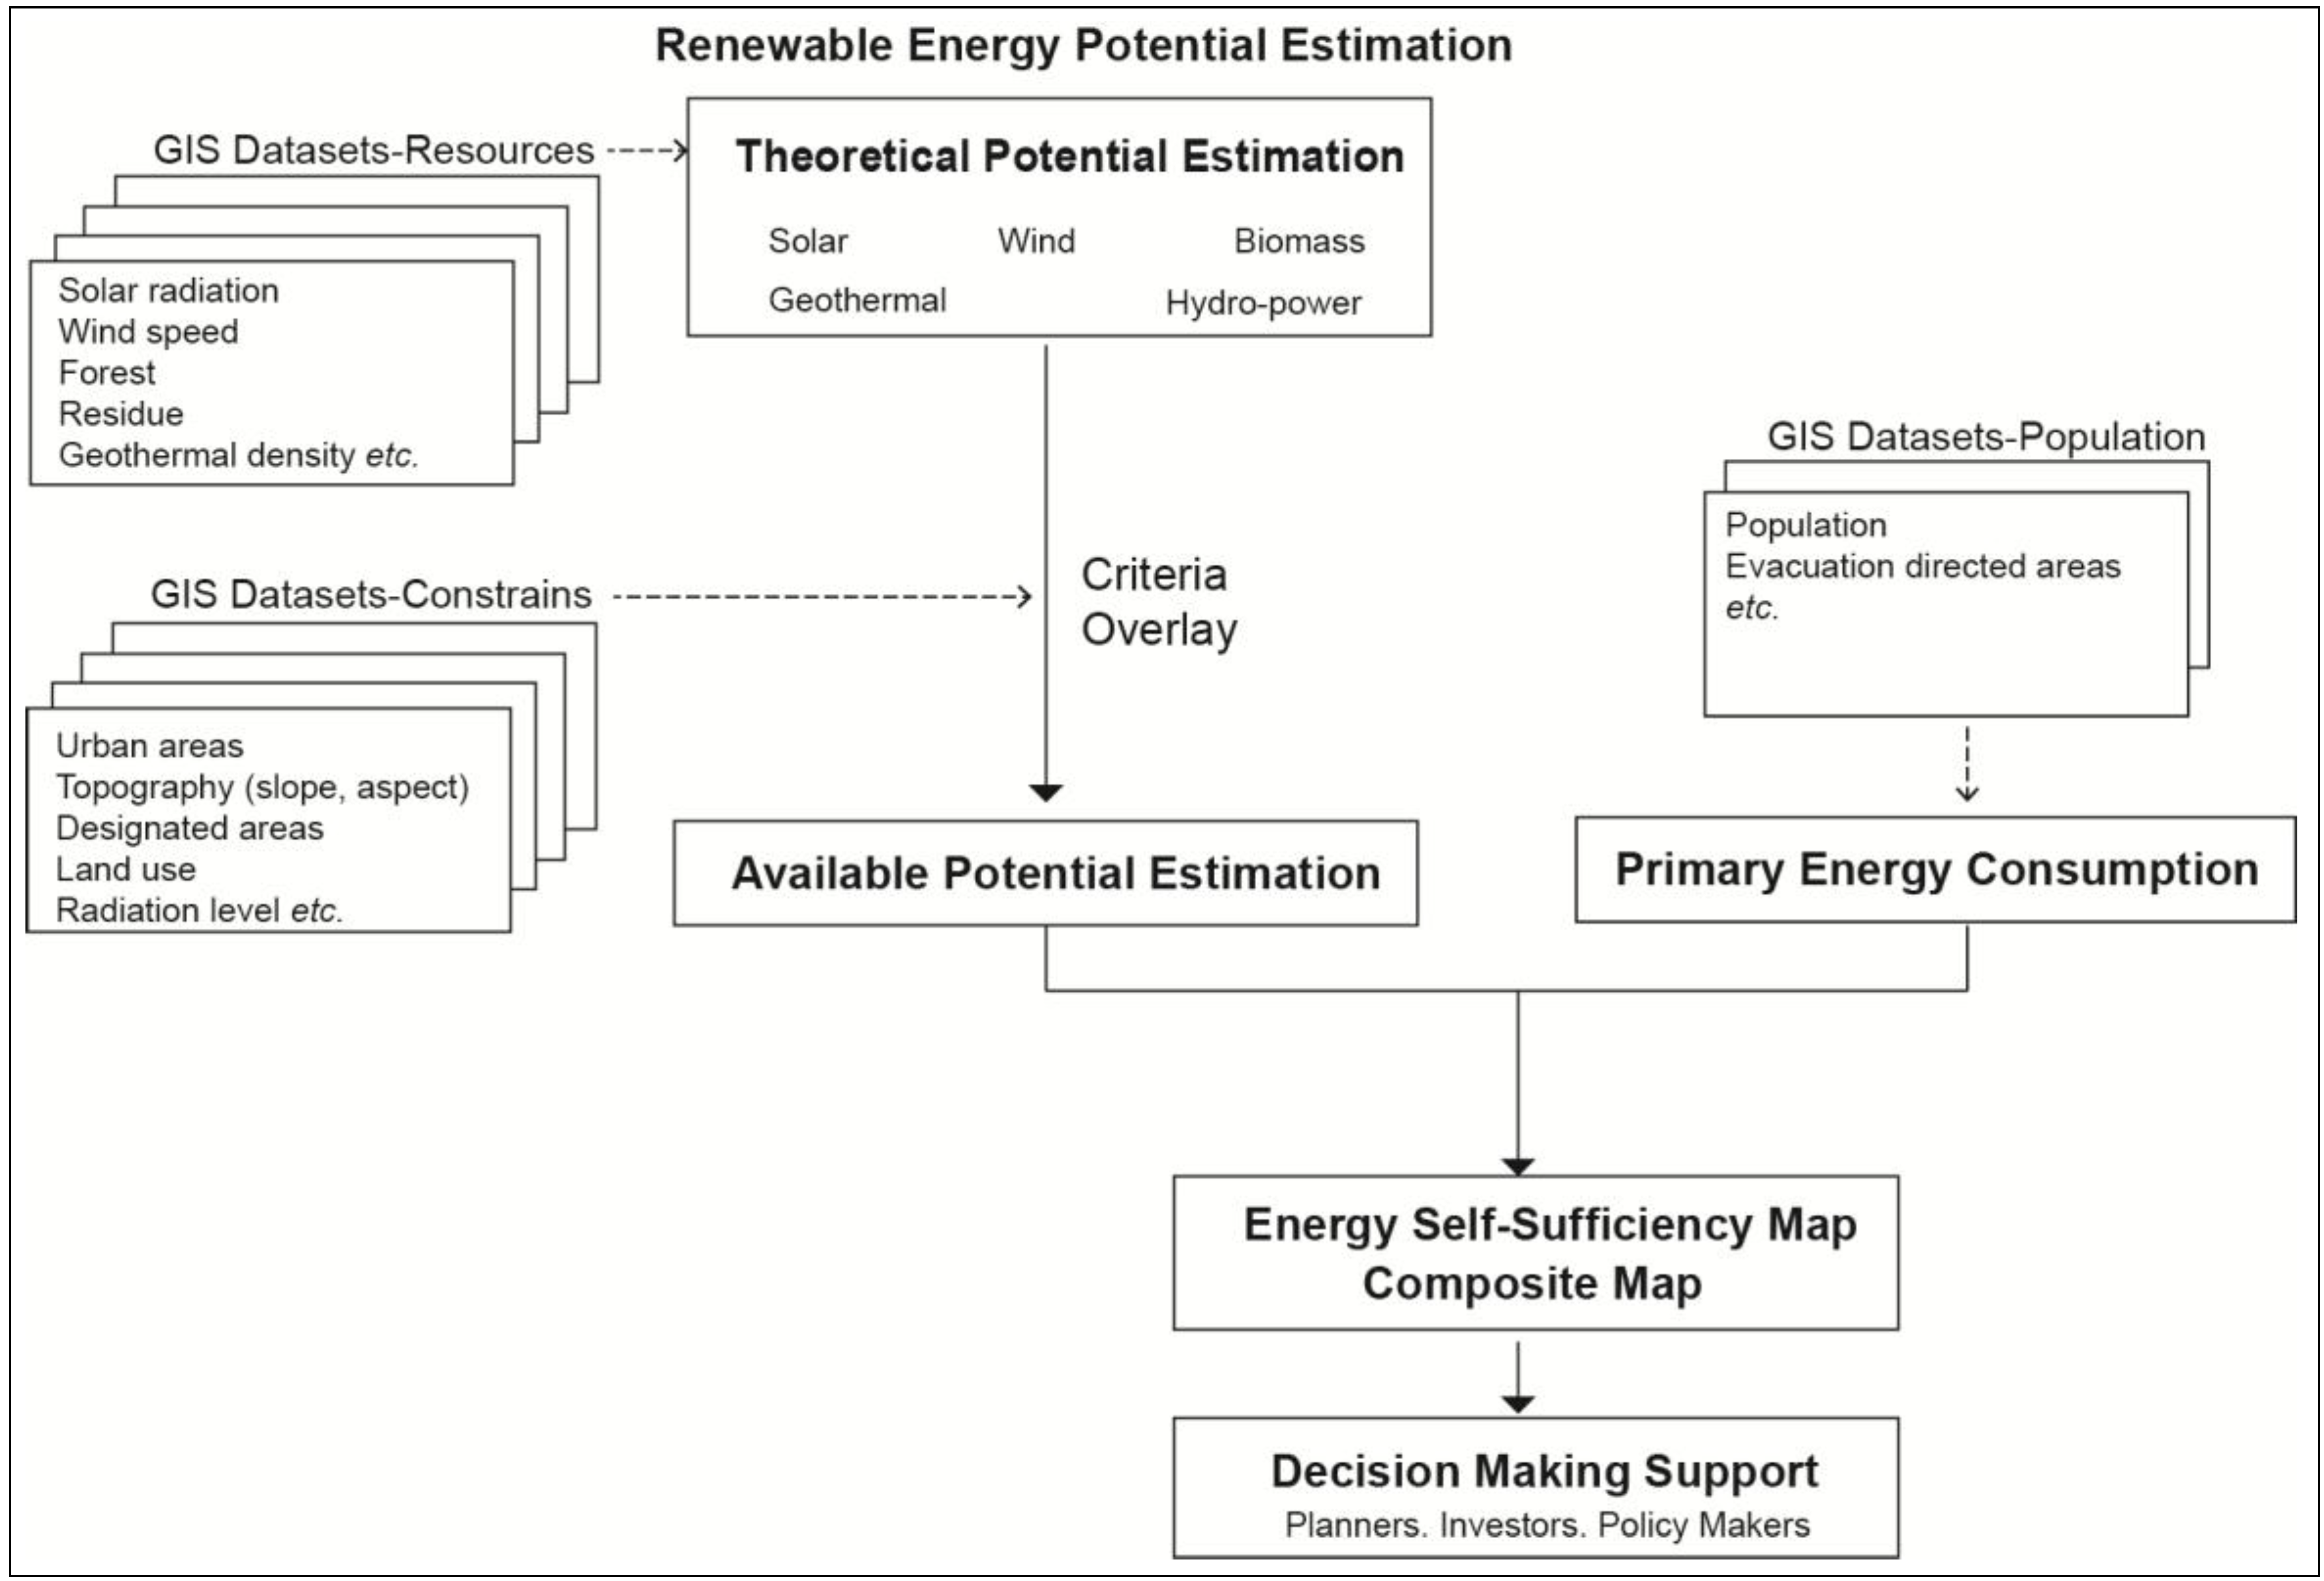
3. Proposal for a New Spatial Planning Approach for Renewable Energy
- (1)
- Primary energy consumption analysis.
- (2)
- RE potential estimation: theoretical potential estimation and available potential estimation.
- (3)
- Energy self-sufficiency analysis.
- (4)
- Composite map preparation.
- (5)
- Decision making support in RE planning.
4. Study Area
5. Case Study: Methods, Datasets
5.1. Primary Energy Consumption

| Japan | 2010 | 2020 | 2030 |
|---|---|---|---|
| Total Primary Energy Consumption [50] | 501 Mtoe (1) | 491 Mtoe | 482 Mtoe |
| Total Population [51] | 128,060,000 | 124,100,000 | 116,620,000 |
| Primary Energy Consumption/person | 3.9 toe/person | 3.96 toe/person | 4.13 toe/person |

5.2. Estimation of Renewable Energy Potential
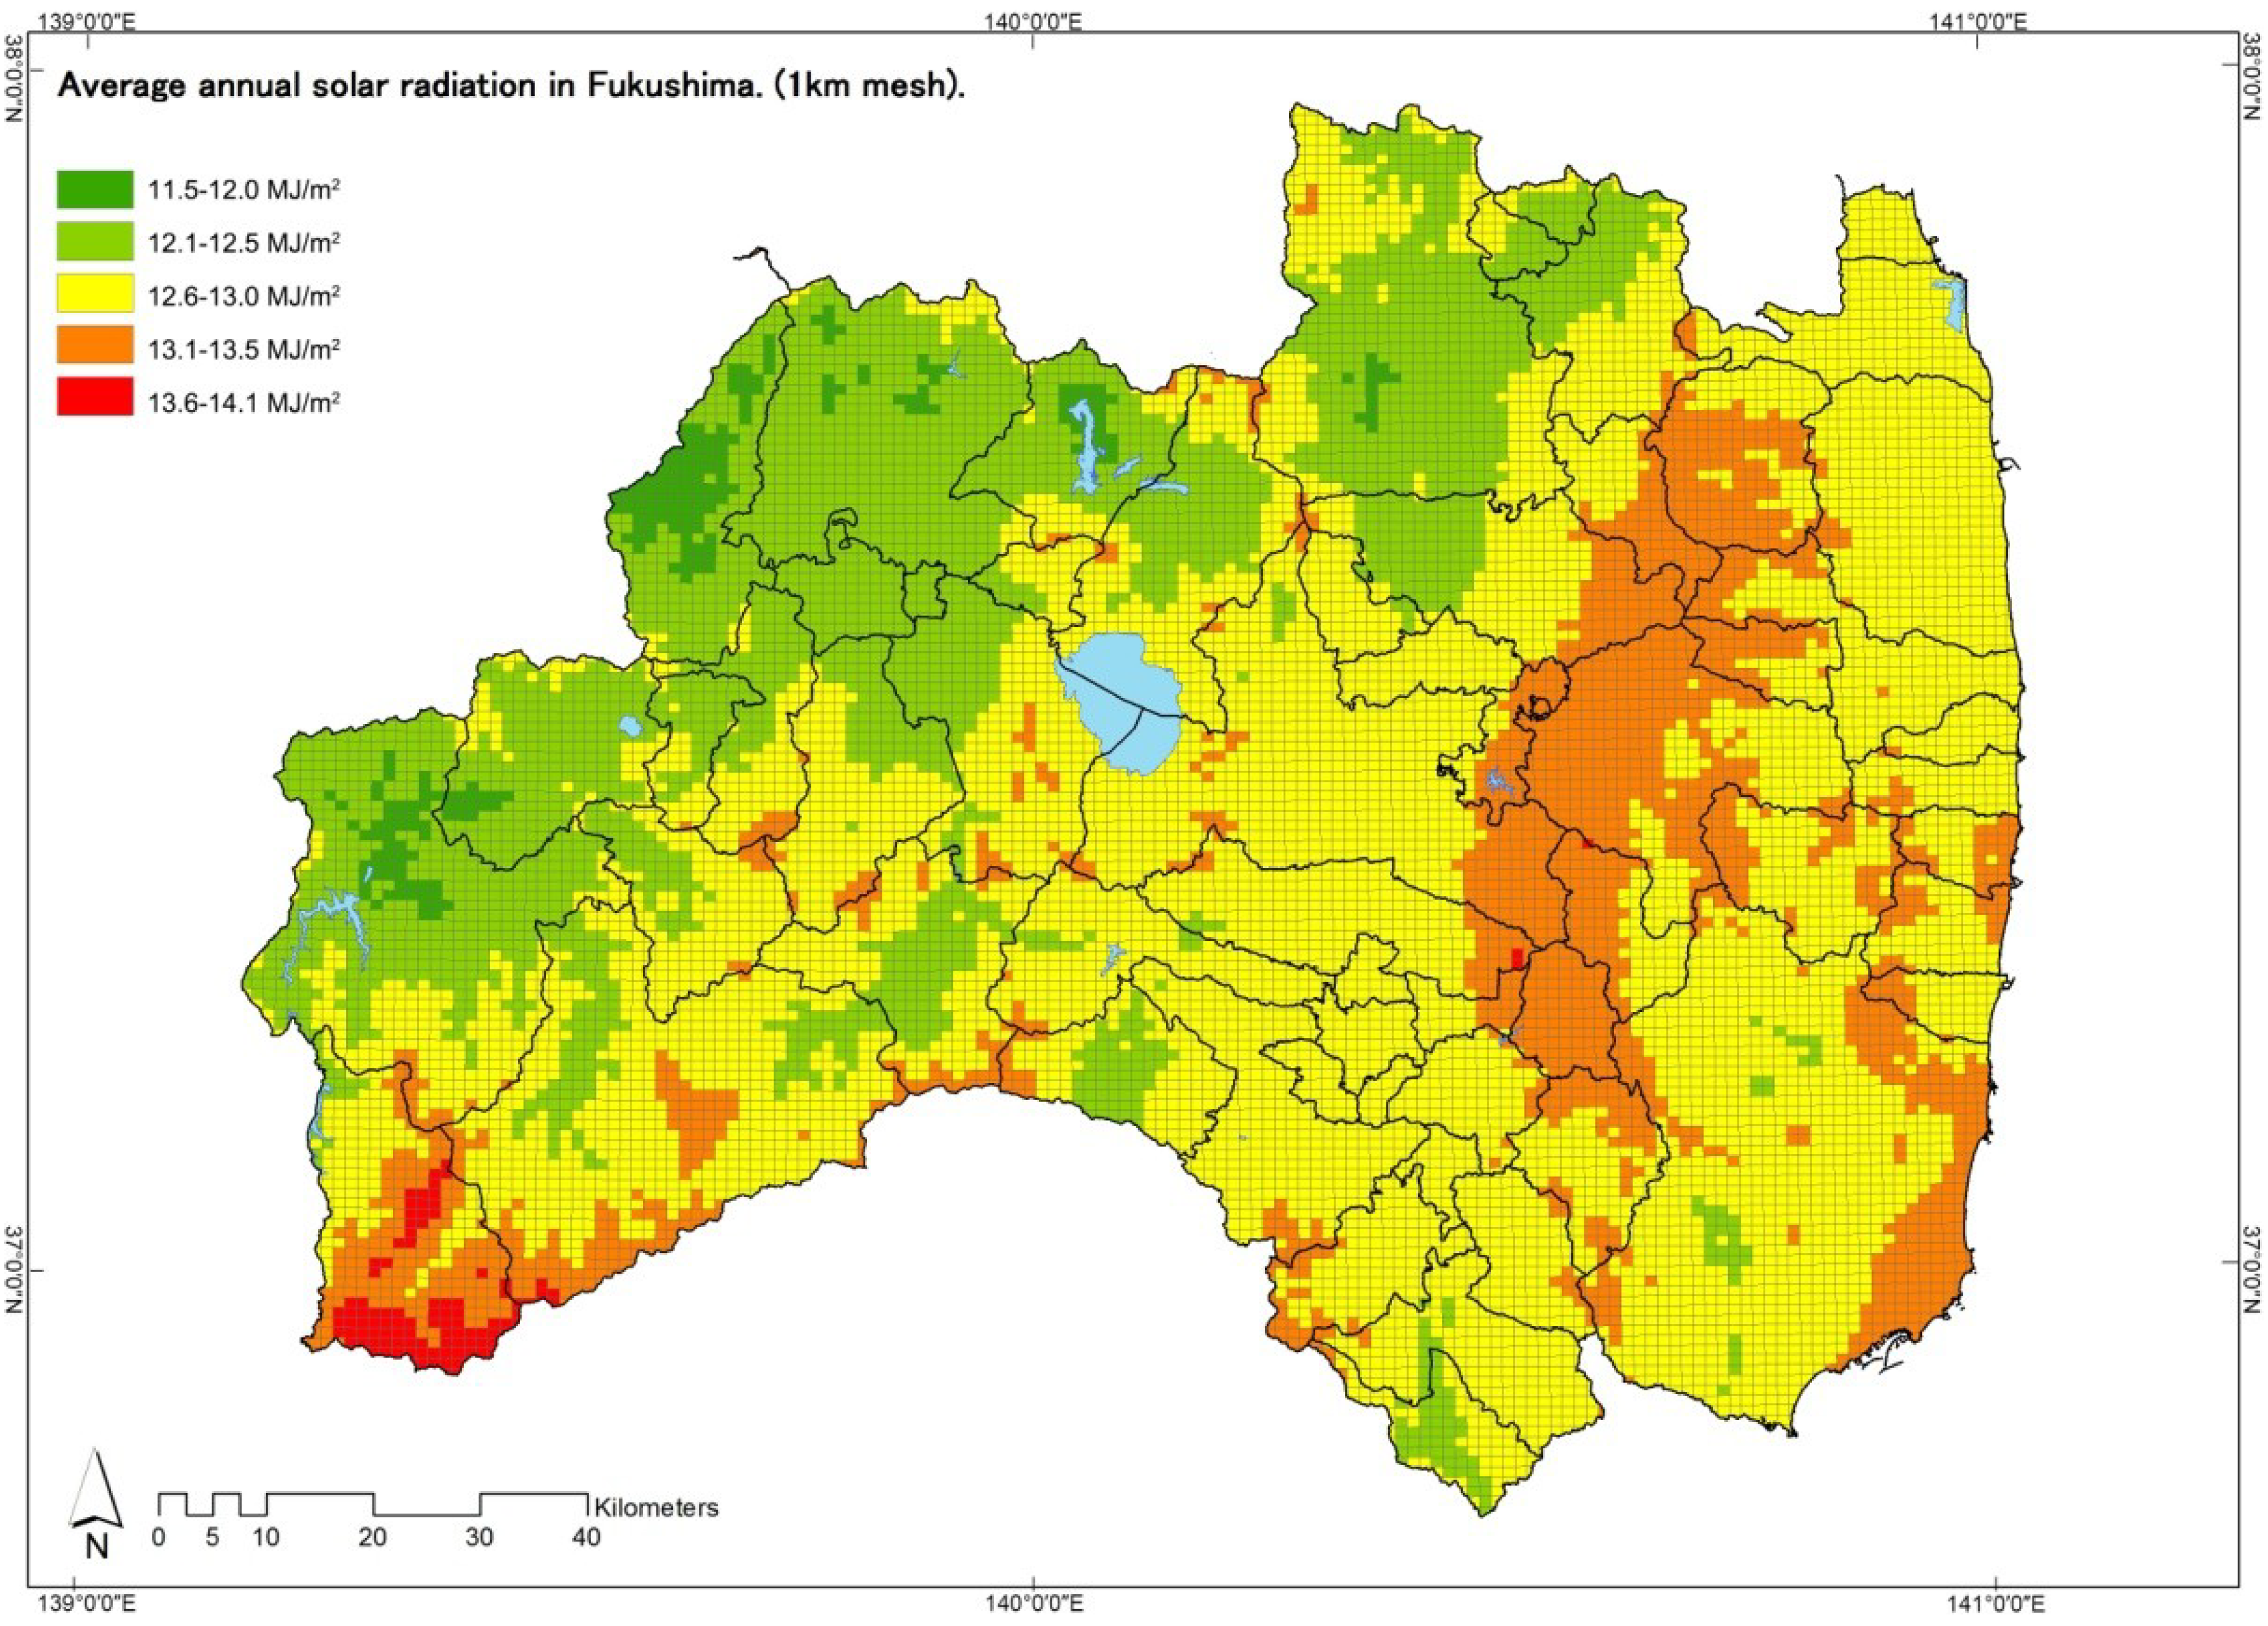
5.2.1. Solar Photovoltaic
- Non-urbanized areas or industrial areas in urbanized areas.
- Slope: 0%–2.5%, any aspect; 2.5%–15%, south-facing aspect [9].
- Exclude superior agricultural areas, protected forest areas, natural preservation areas, national parks (special preservation area), and landslide areas assigned by relative laws in Japan [61].
- Un-available land use: rice fields, built-up areas, roads, railways, rivers and lakes, beaches, golf courses, and others (airports, artificial landfill areas among others). Available land uses: other agricultural areas (fruit orchards among others), forests, and barren lands [61].
- Minimum available land area of 1.5 ha [46].
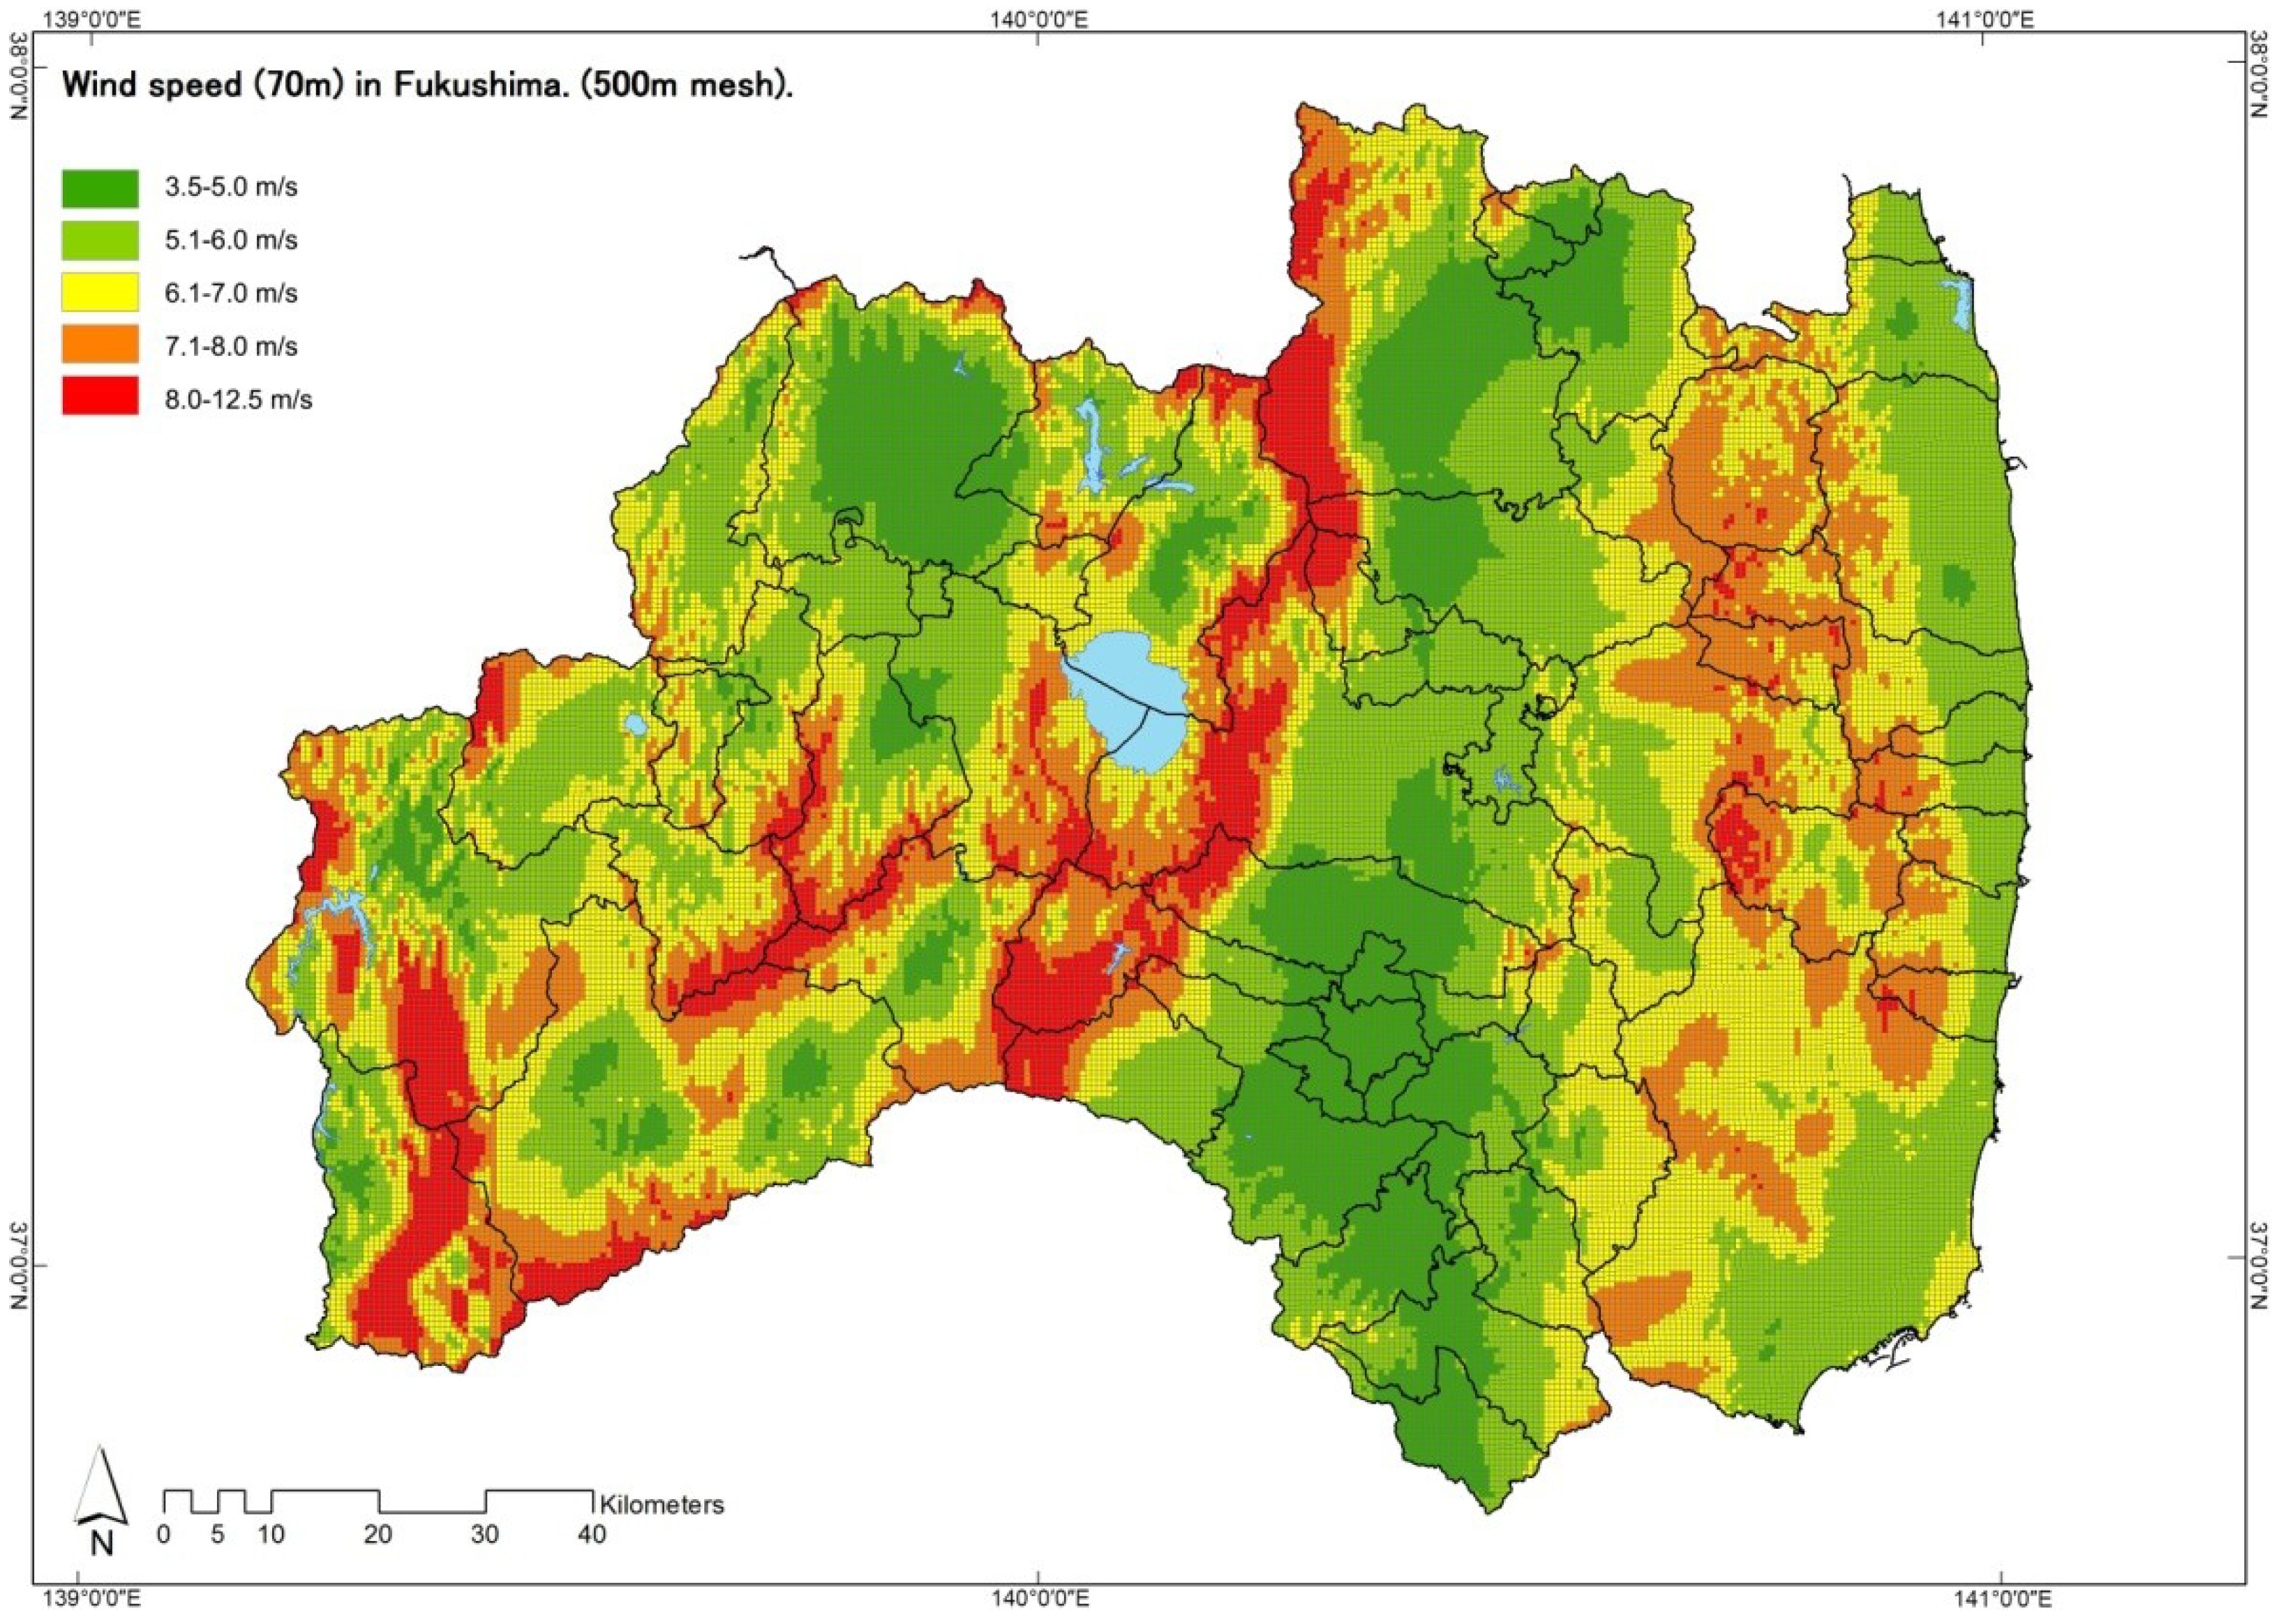
5.2.2. Wind Energy
- Slope < 20° [61].
- Non-urbanization area [61].
- Exclude superior agricultural areas, protected forest areas, natural preservation areas, national parks (special preservation areas), landslide areas, and wildlife conservation areas assigned by relative laws in Japan [61].
- Unavailable land uses: rice fields, built-up areas, roads, railways, rivers and lakes, golf courses, and others (airports, artificial landfill areas among others). Available land uses: other agricultural areas (fruit orchards among others), forests, barren lands, and beaches [61].
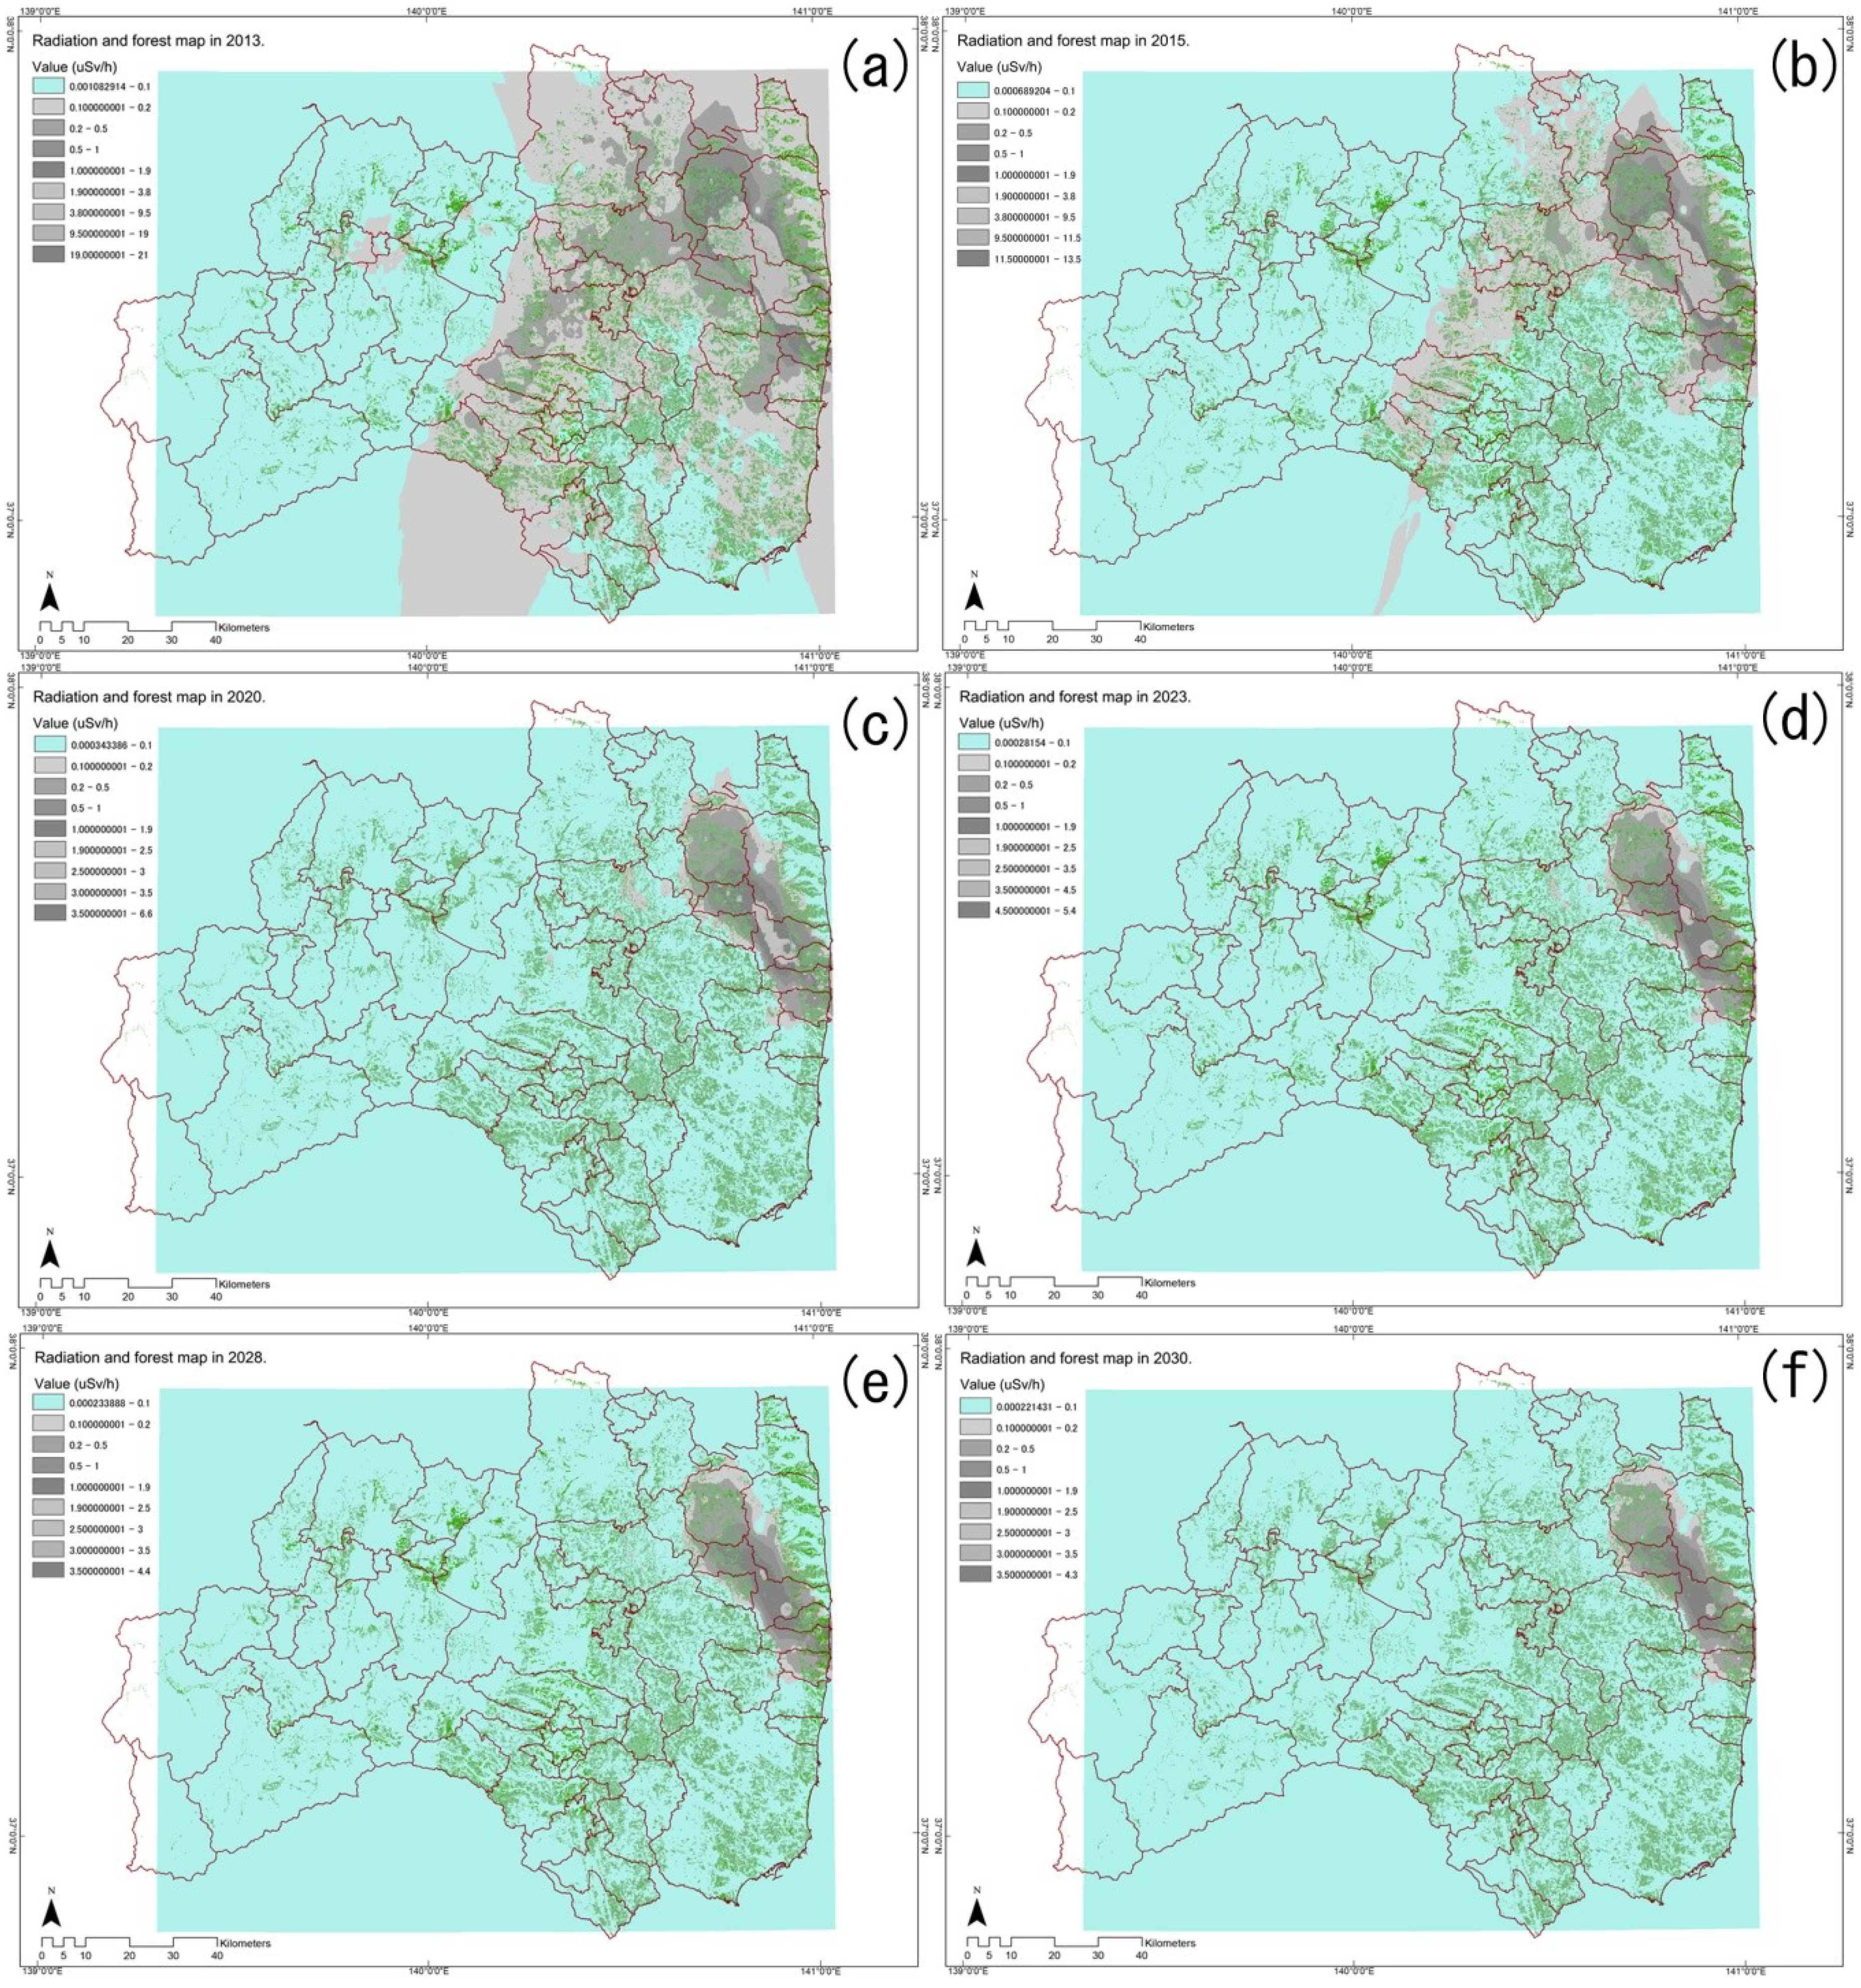
5.2.3. Biomass
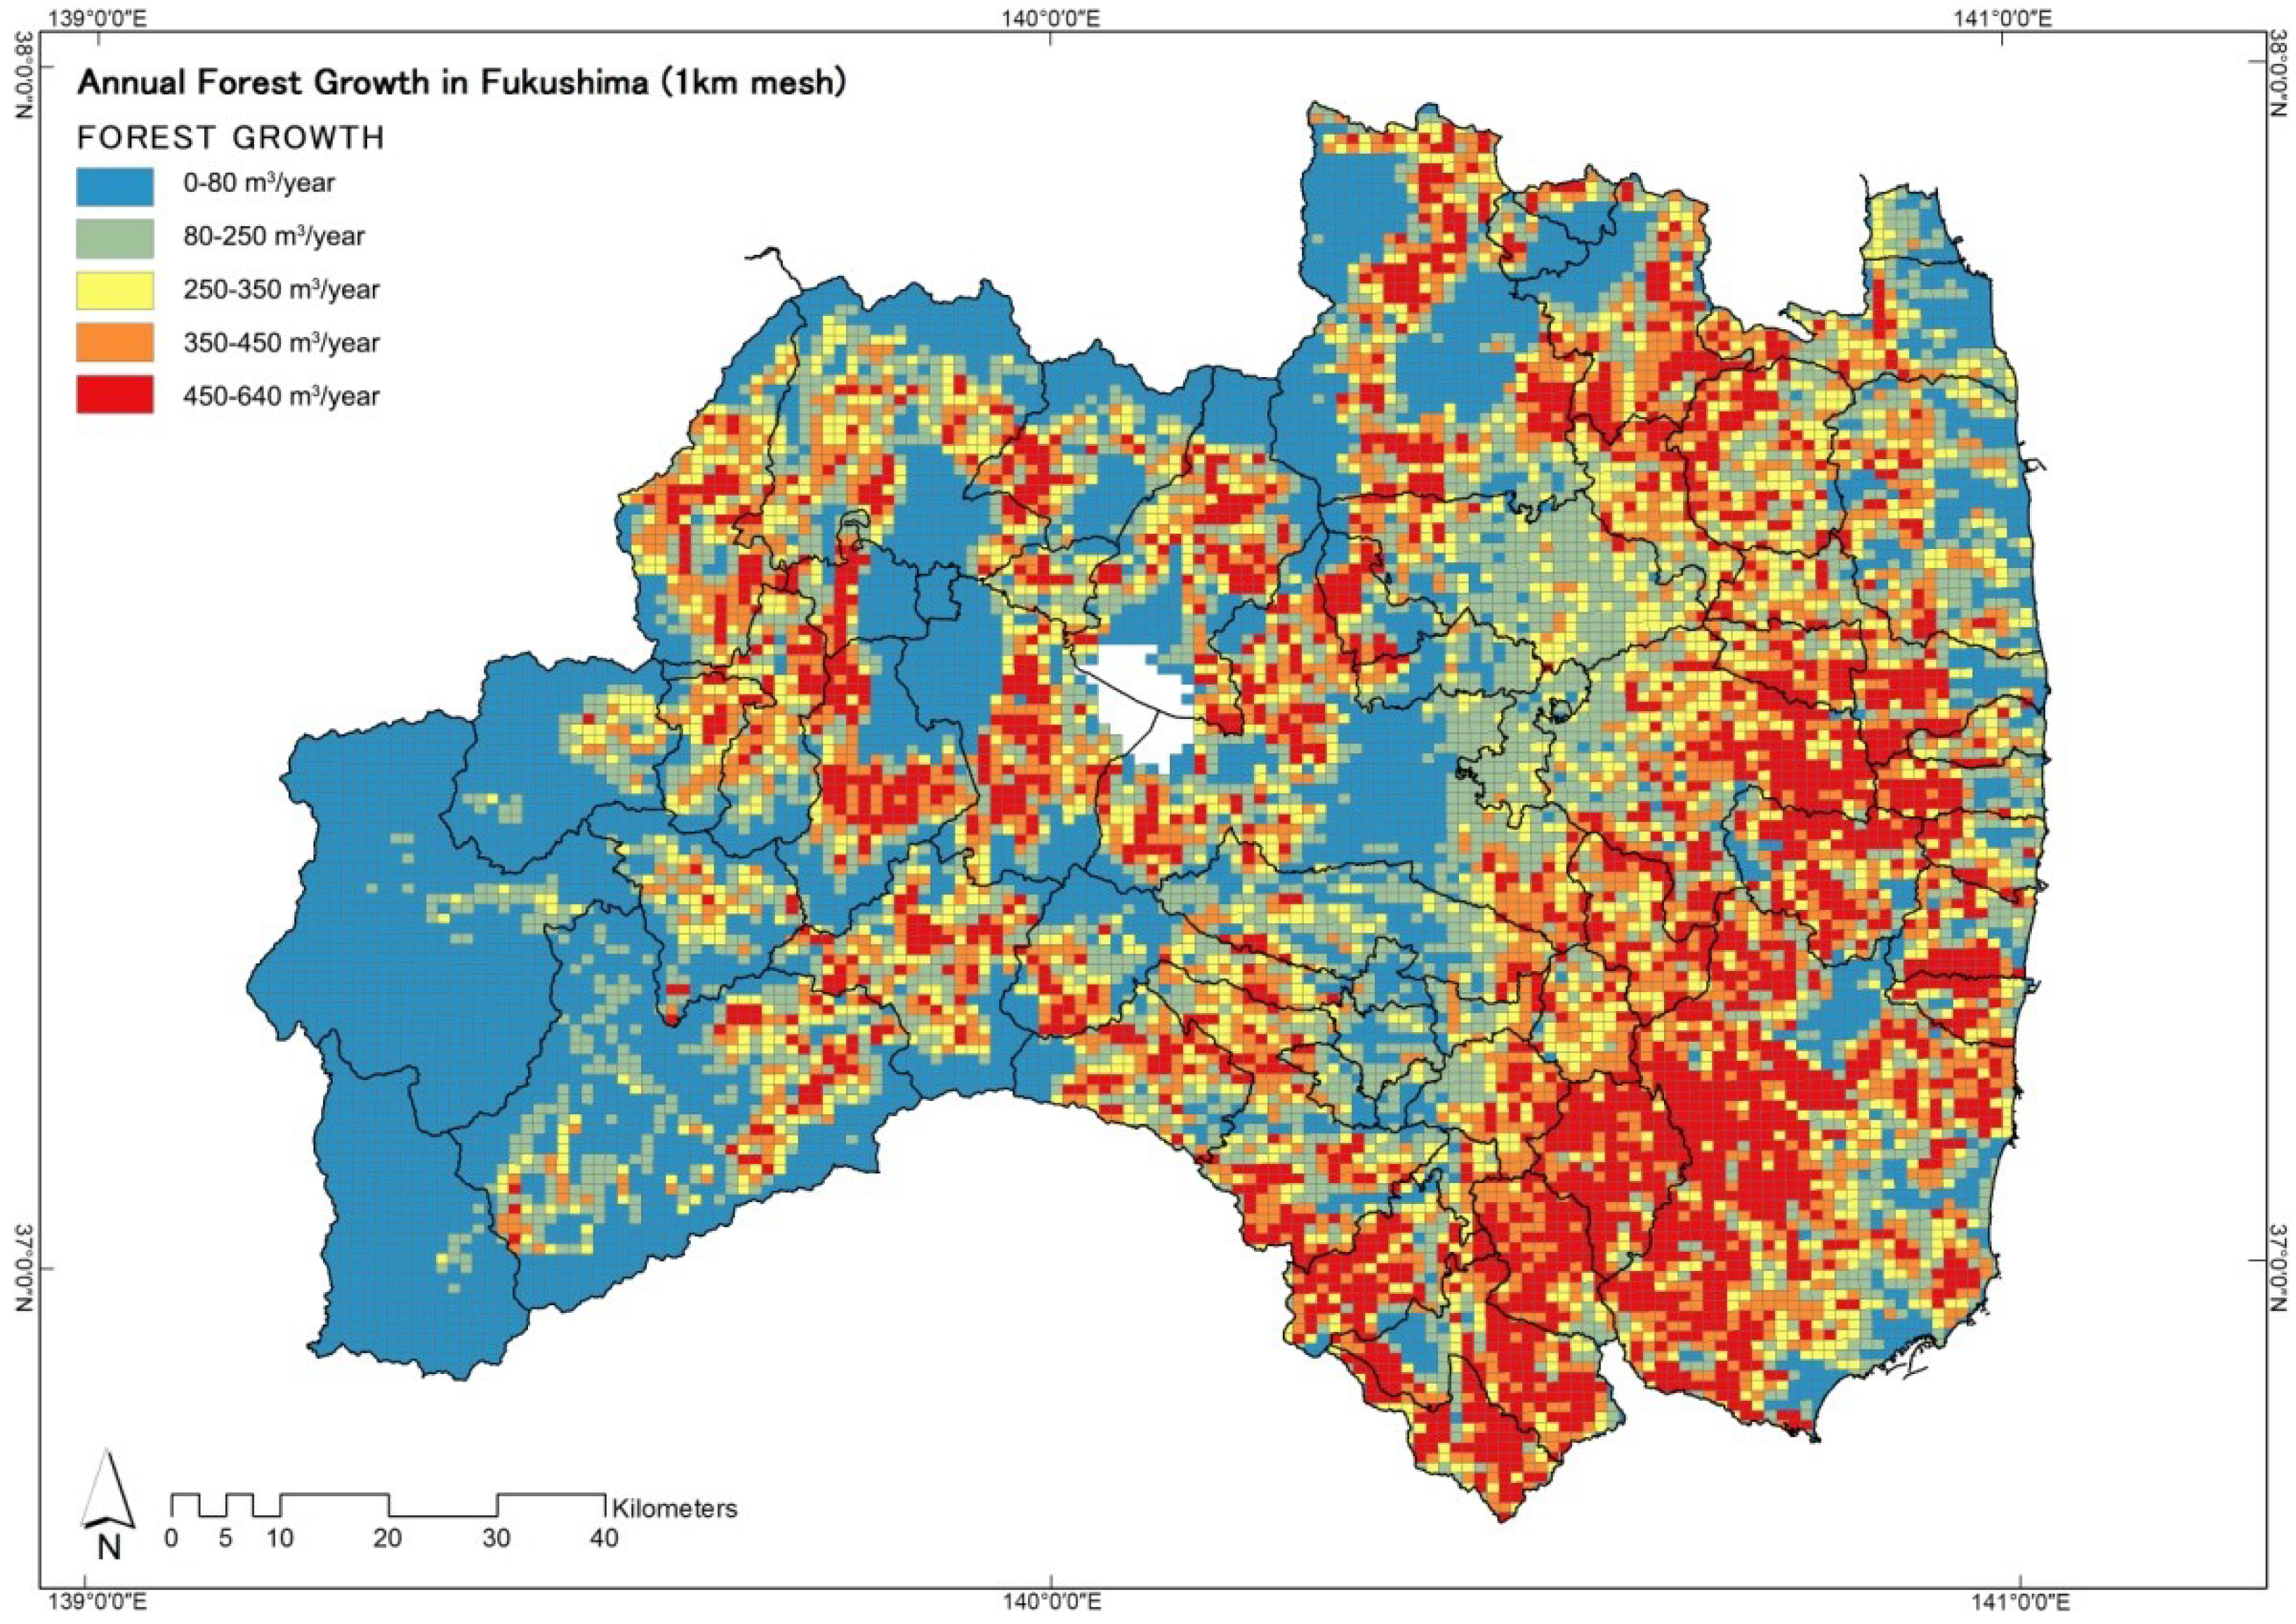
- Forest area.
- Exclude protected forest areas, natural preservation areas, national parks (special preservation areas), and wildlife conservation areas assigned by relative laws in Japan.

5.2.4. Geothermal
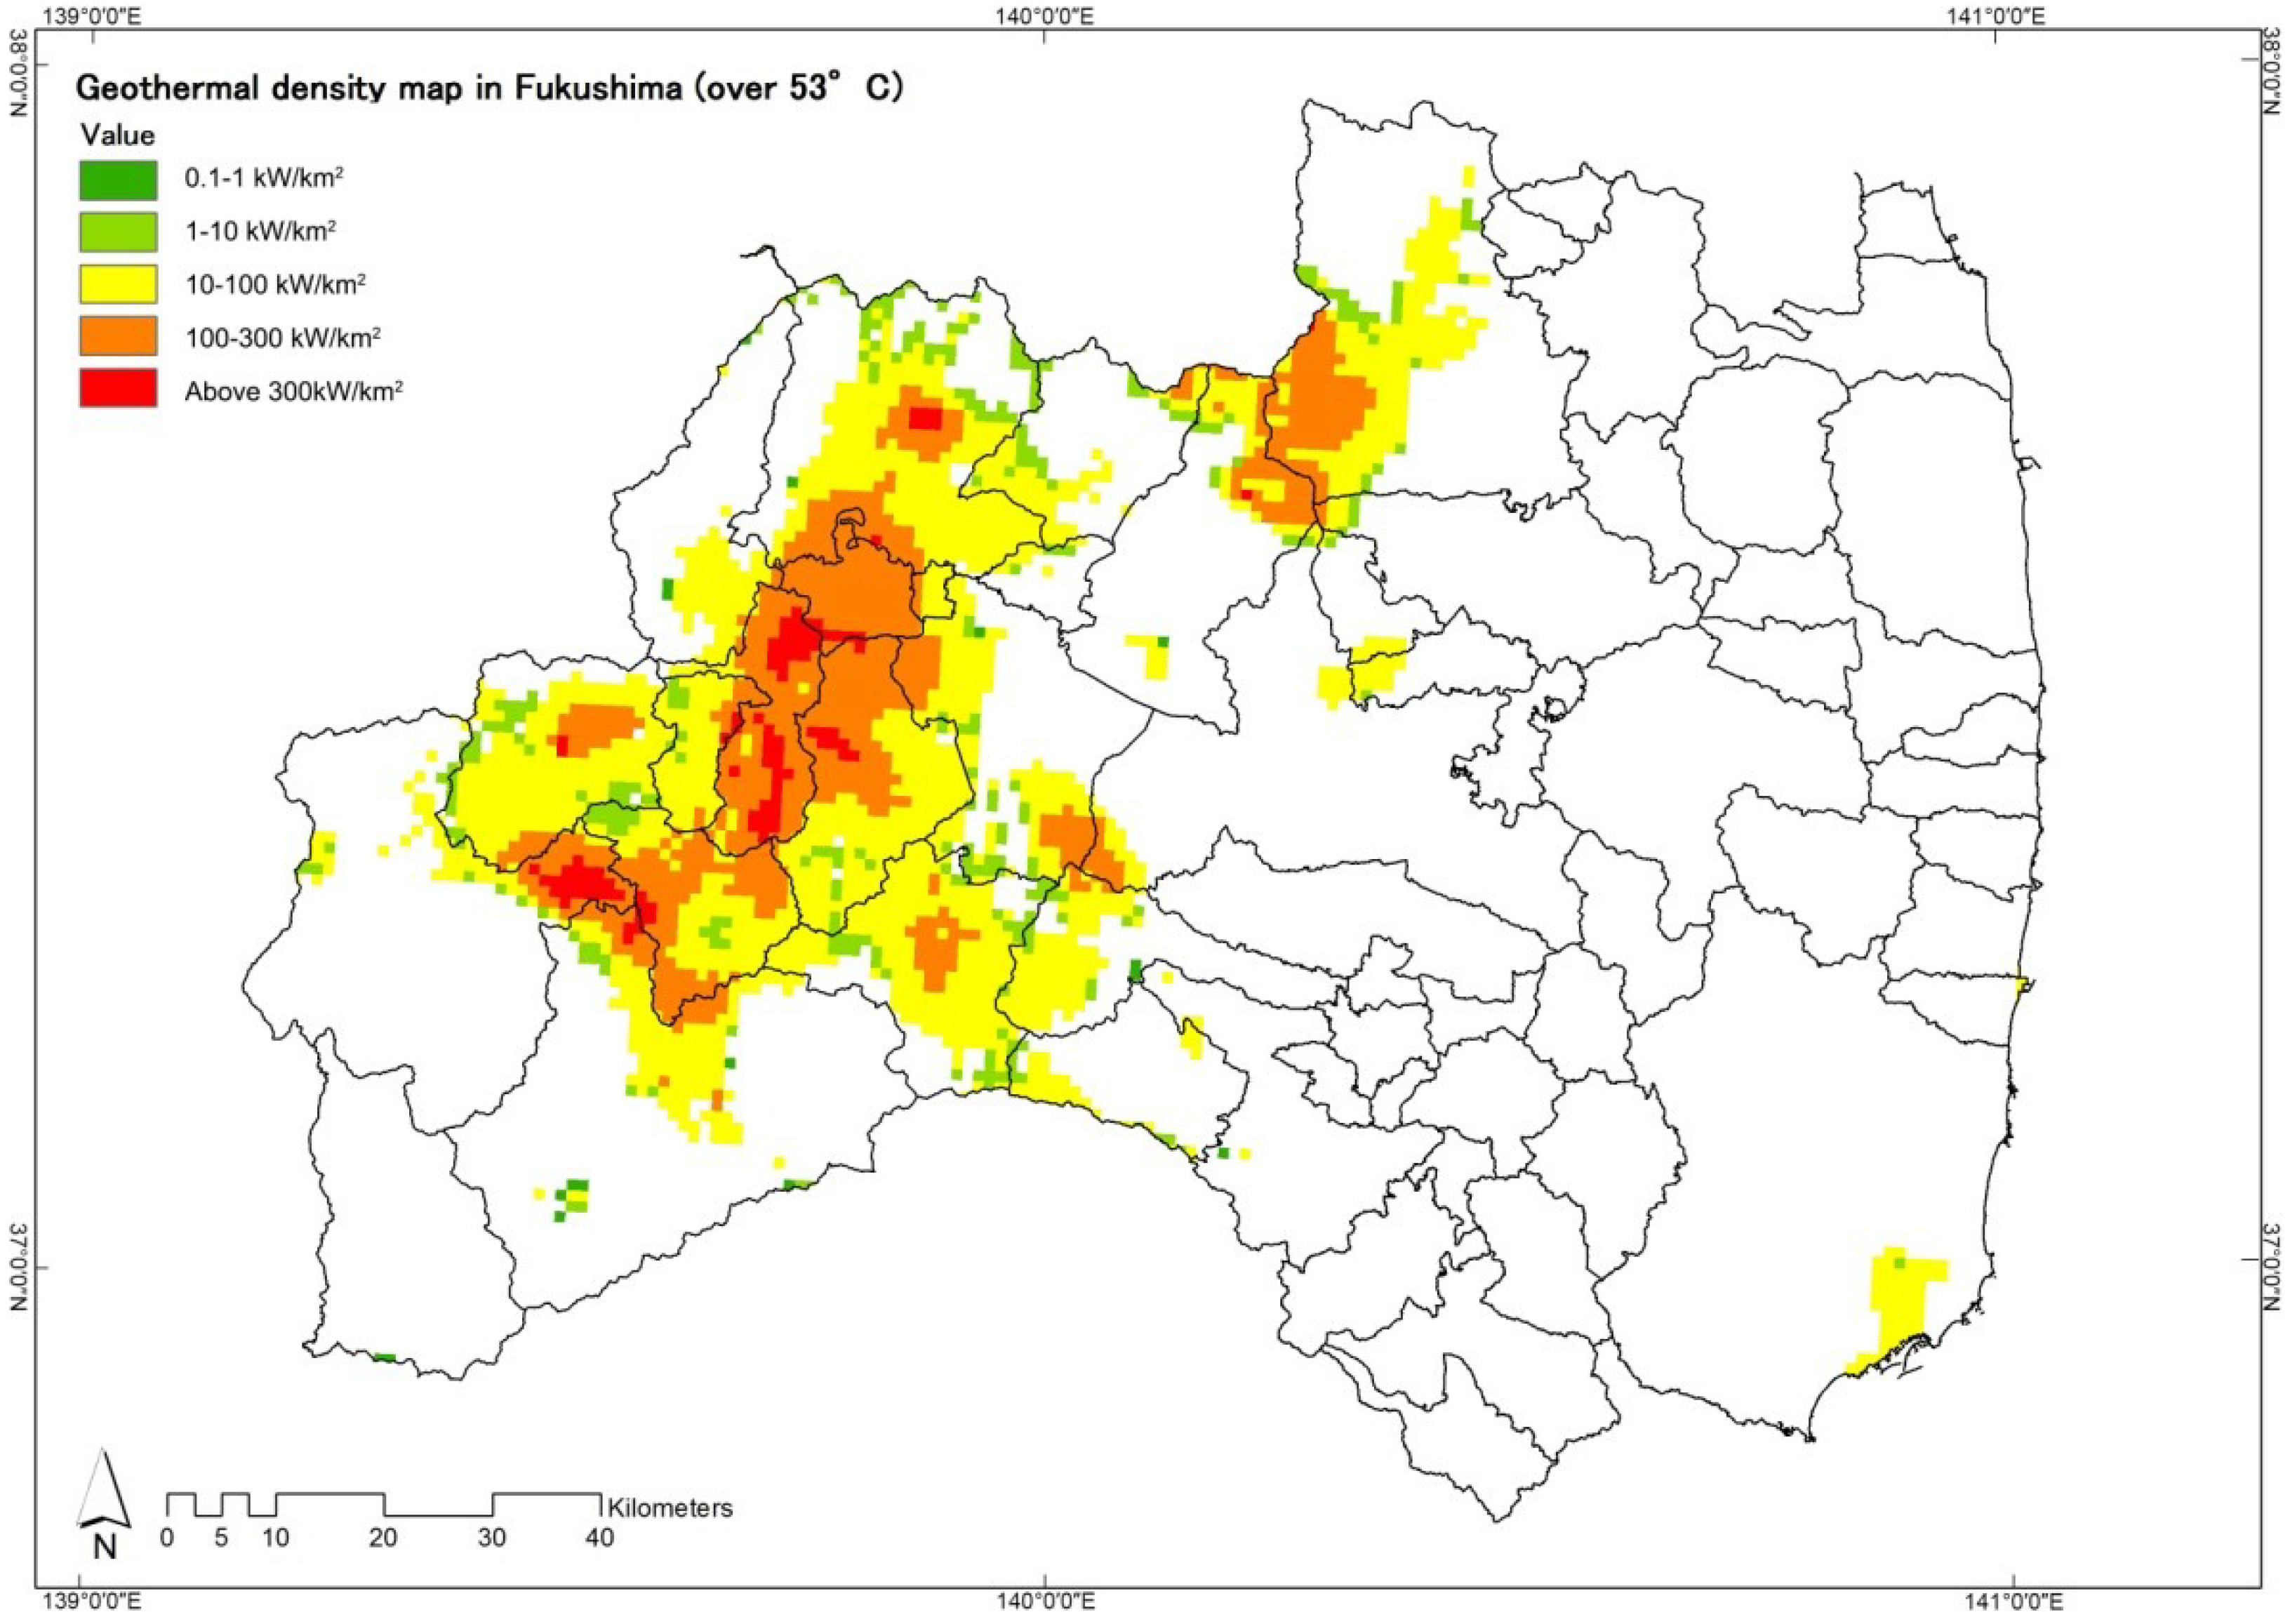
- Slope < 20°.
- Non-urbanization areas.
- Exclude superior agricultural areas, protected forest areas, natural preservation areas, national parks (special preservation areas), and wildlife conservation areas assigned by relative laws in Japan.
- Un-available land use: rice fields, built-up areas, roads, railways, rivers and lakes, golf courses, and others (airports, and artificial landfill areas among others). Available land use: other agricultural areas (fruit orchards among others), forests, barren lands, and beaches.
- Buffer distance: current hot-spring tourism areas >1,000 m [77].
- Land area size >0.5 ha [77].
5.2.5. Hydro-Power

5.3. Energy Self-Sufficiency Analysis
5.4. Composite Map Preparation
5.5. Decision Making Support: Renewable Energy Plan Making
| Input Data | Format/Resolution or scale | Tool | Inter Output Data | Tools (For criteria overlay) | Final Output Data |
|---|---|---|---|---|---|
| Population | Polygon/1:25,000 | Field Calculator | Population and Primary energy consumption in municipal polygon | Spatial join | Population and Primary energy consumption in 500 m mesh* |
| Average annual solar radiation | Polygon/ 1 km mesh | Field Calculator | Solar potential in 1 km mesh | Erase or Clip Field Calculator Spatial join | Solar potential in 500 m mesh |
| Wind speed | “.dat” | Fishnet tool Microsoft Excel and Access Field Calculator | Wind speed in 500 m mesh (.dbf) | Erase or Clip Field Calculator Spatial join | Wind speed in 500 m mesh |
| Annual forest growth | Polygon/1 km mesh | Field Calculator | Wood biomass potential in 1 km mesh | Erase or Clip Field Calculator Spatial join | Wood biomass potential in 500 m mesh |
| Radiation | Point | IDW analysis Raster to polygon | Polygons for forest areas under 0.1 μSv/h | - | - |
| Residue (agriculture, dwarf bamboo etc.) | Polygon/1 km mesh | - | Residue (agriculture, dwarf bamboo etc.) in 1 km mesh | Spatial join | Residue (agriculture, dwarf bamboo etc.) in 500 m mesh |
| Residue (wood, animal etc.) | “.xls” | Microsoft Excel and Access | Residue (wood, animal etc.) in Municipal polygon (.dbf) | Spatial join | Residue (wood, animal etc.) in 500 m mesh |
| Geothermal density | Raster map/100 m | Raster to polygonField Calculator | Geothermal potential polygon map | Erase or Clip Field Calculator Spatial join | Geothermal potential in 500 m mesh |
| Hydro-power | Point | Field Calculator | Hydro-power potential in point data | Erase or Clip Spatial join | Hydro-power potential in 500 m mesh |
6. Results and Discussion
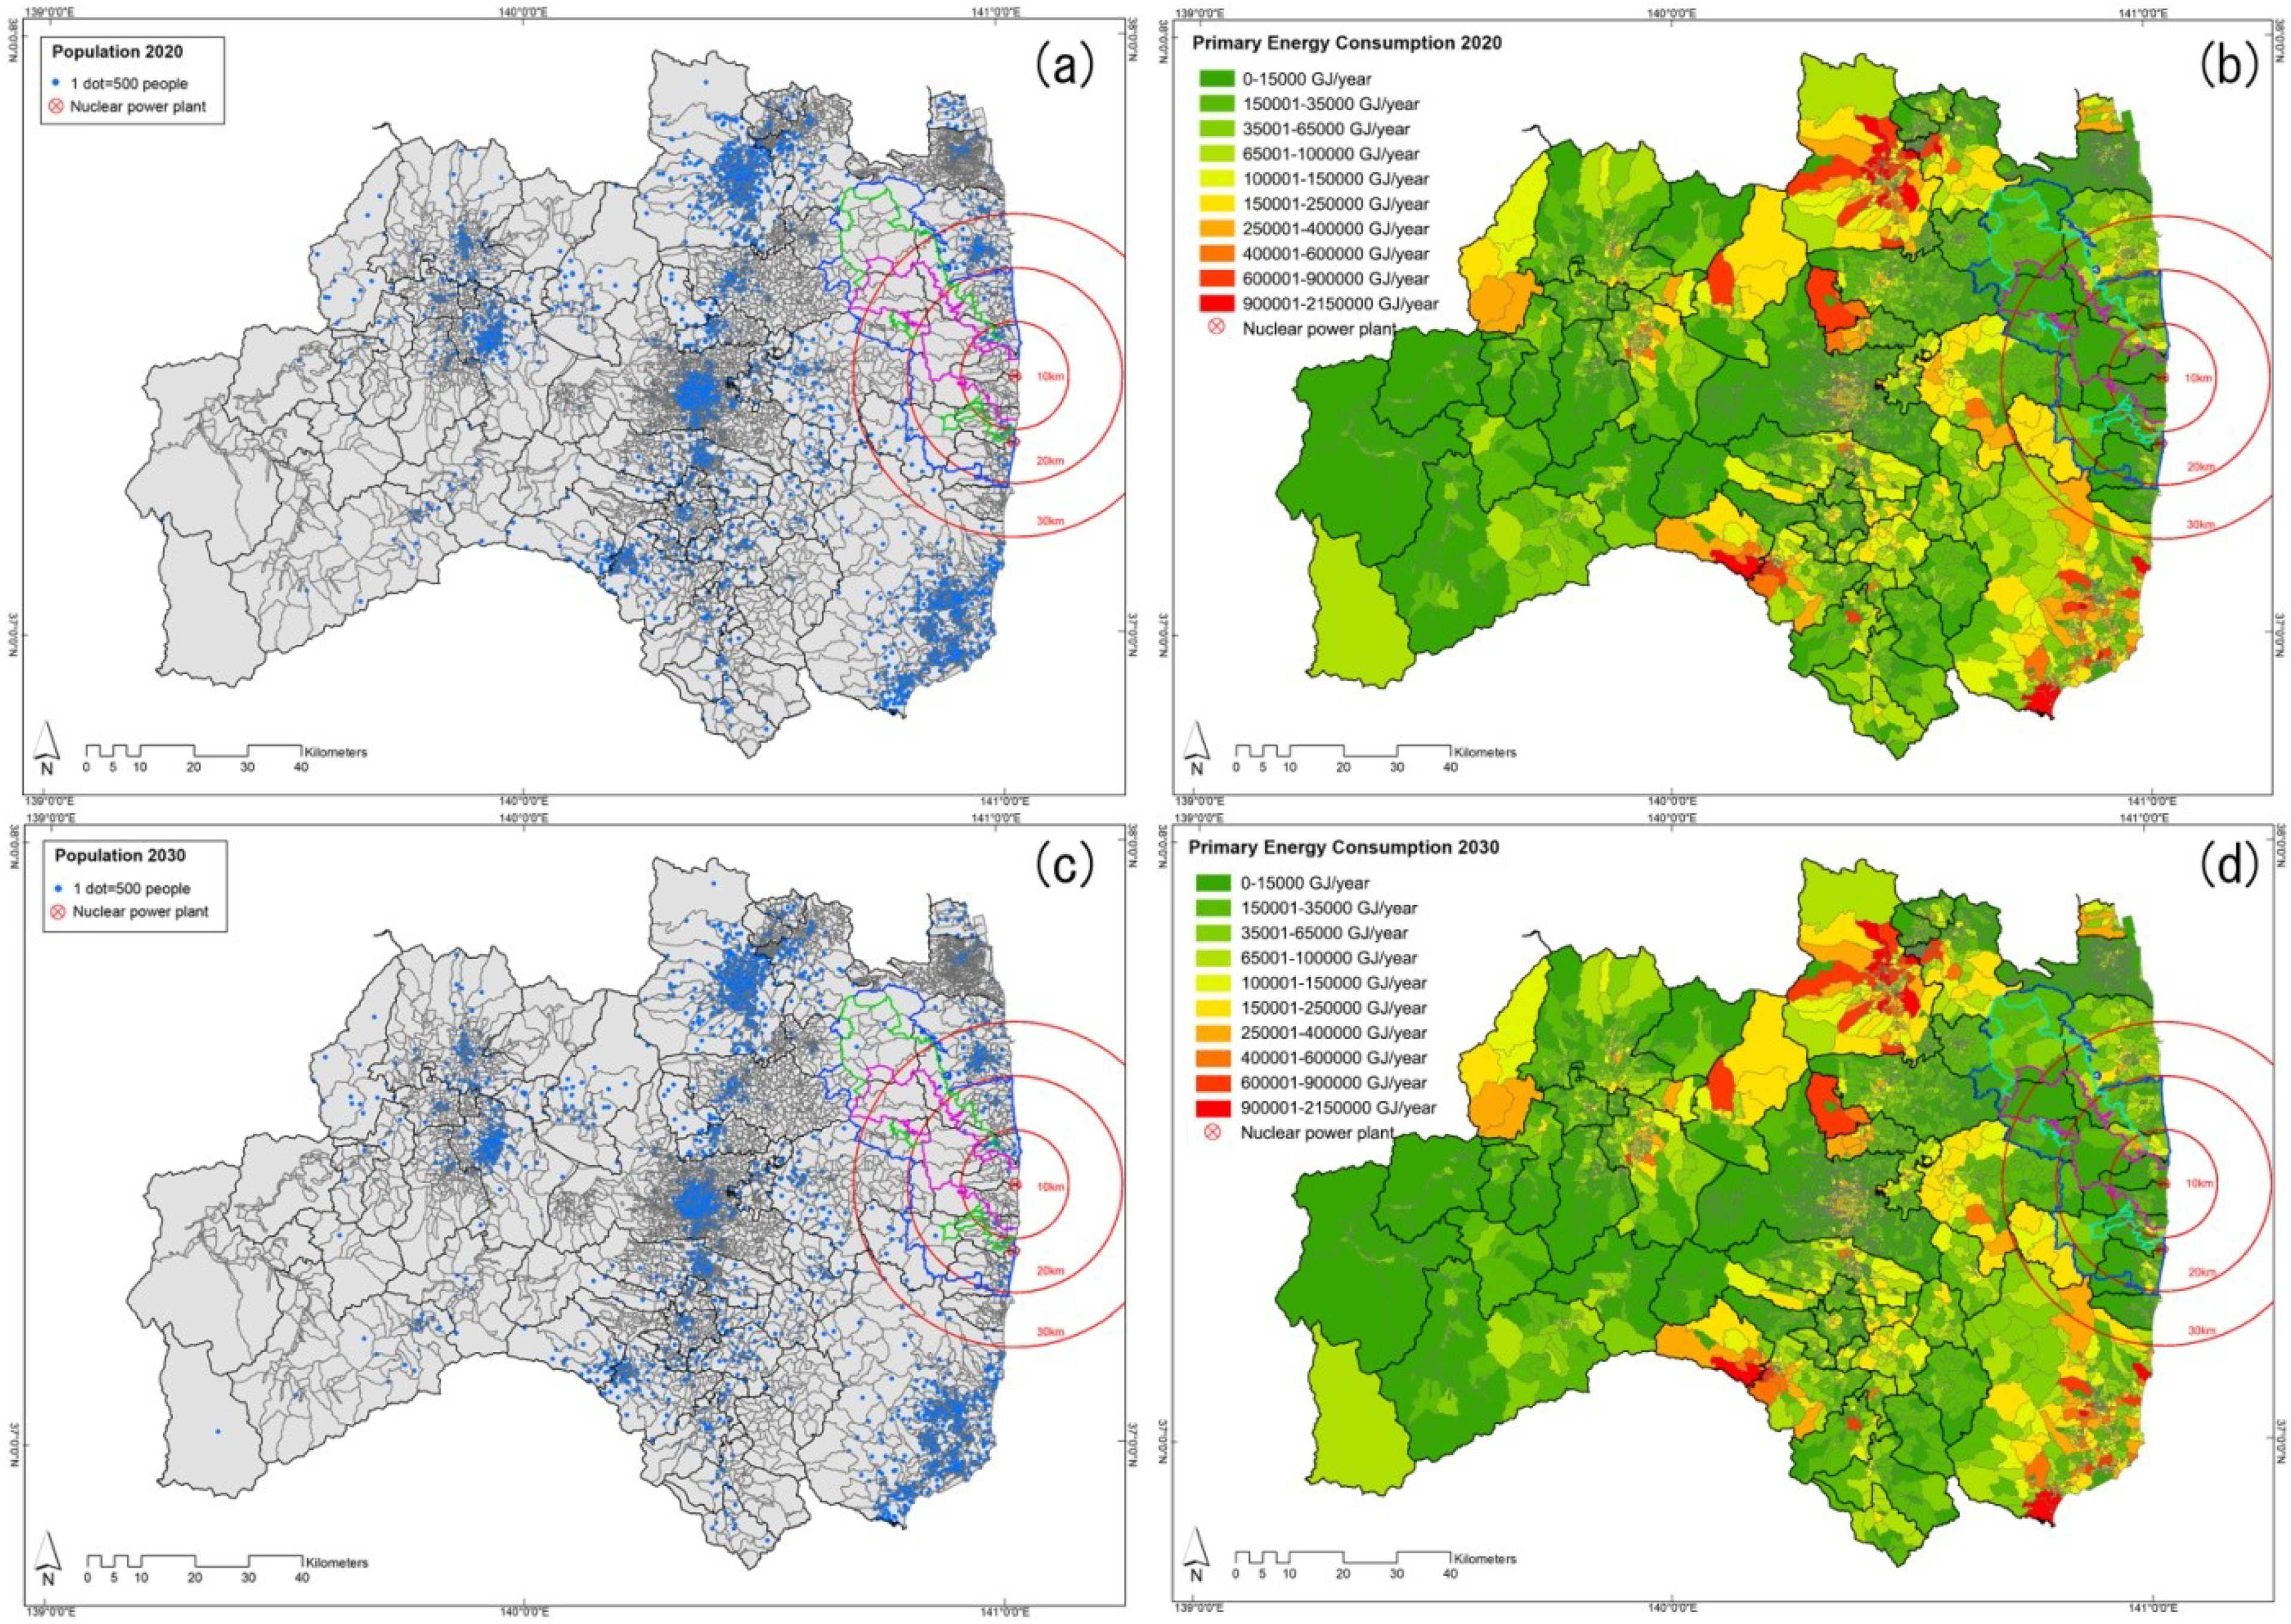
6.1. Primary Energy Consumption
| Region | Sub-Region | Population | Primary Energy Consumption (GJ/year) | ||||
|---|---|---|---|---|---|---|---|
| 2010 | 2020 | 2030 | 2010 | 2020 | 2030 | ||
| Aizu | Aizu | 262,051 | 249,117 | 223,607 | 42,791,559 | 41,304,906 | 38,666,877 |
| Minami-Aizu | 29,893 | 27,645 | 24,814 | 4,881,163 | 4,583,692 | 4,290,945 | |
| Naka-doori | Kenpoku | 497,059 | 474,225 | 425,860 | 81,166,125 | 78,628,979 | 73,641,111 |
| Kenchu | 551,745 | 523,803 | 470,245 | 90,095,740 | 86,849,387 | 81,316,276 | |
| Kennan | 150,117 | 140,001 | 125,665 | 24,512,959 | 23,212,869 | 21,730,327 | |
| Hama-doori | Soso | 202,773 | 142,009 | 142,823 | 33,112,178 | 23,545,885 | 24,697,479 |
| Iwaki | 342,249 | 338,636 | 303,959 | 55,886,443 | 56,147,587 | 52,561,597 | |
| Total | 2,035,887 | 1,895,436 | 1,716,973 | 332,446,167 | 31,423,305 | 296,904,612 | |

6.2. Renewable Energy Potential
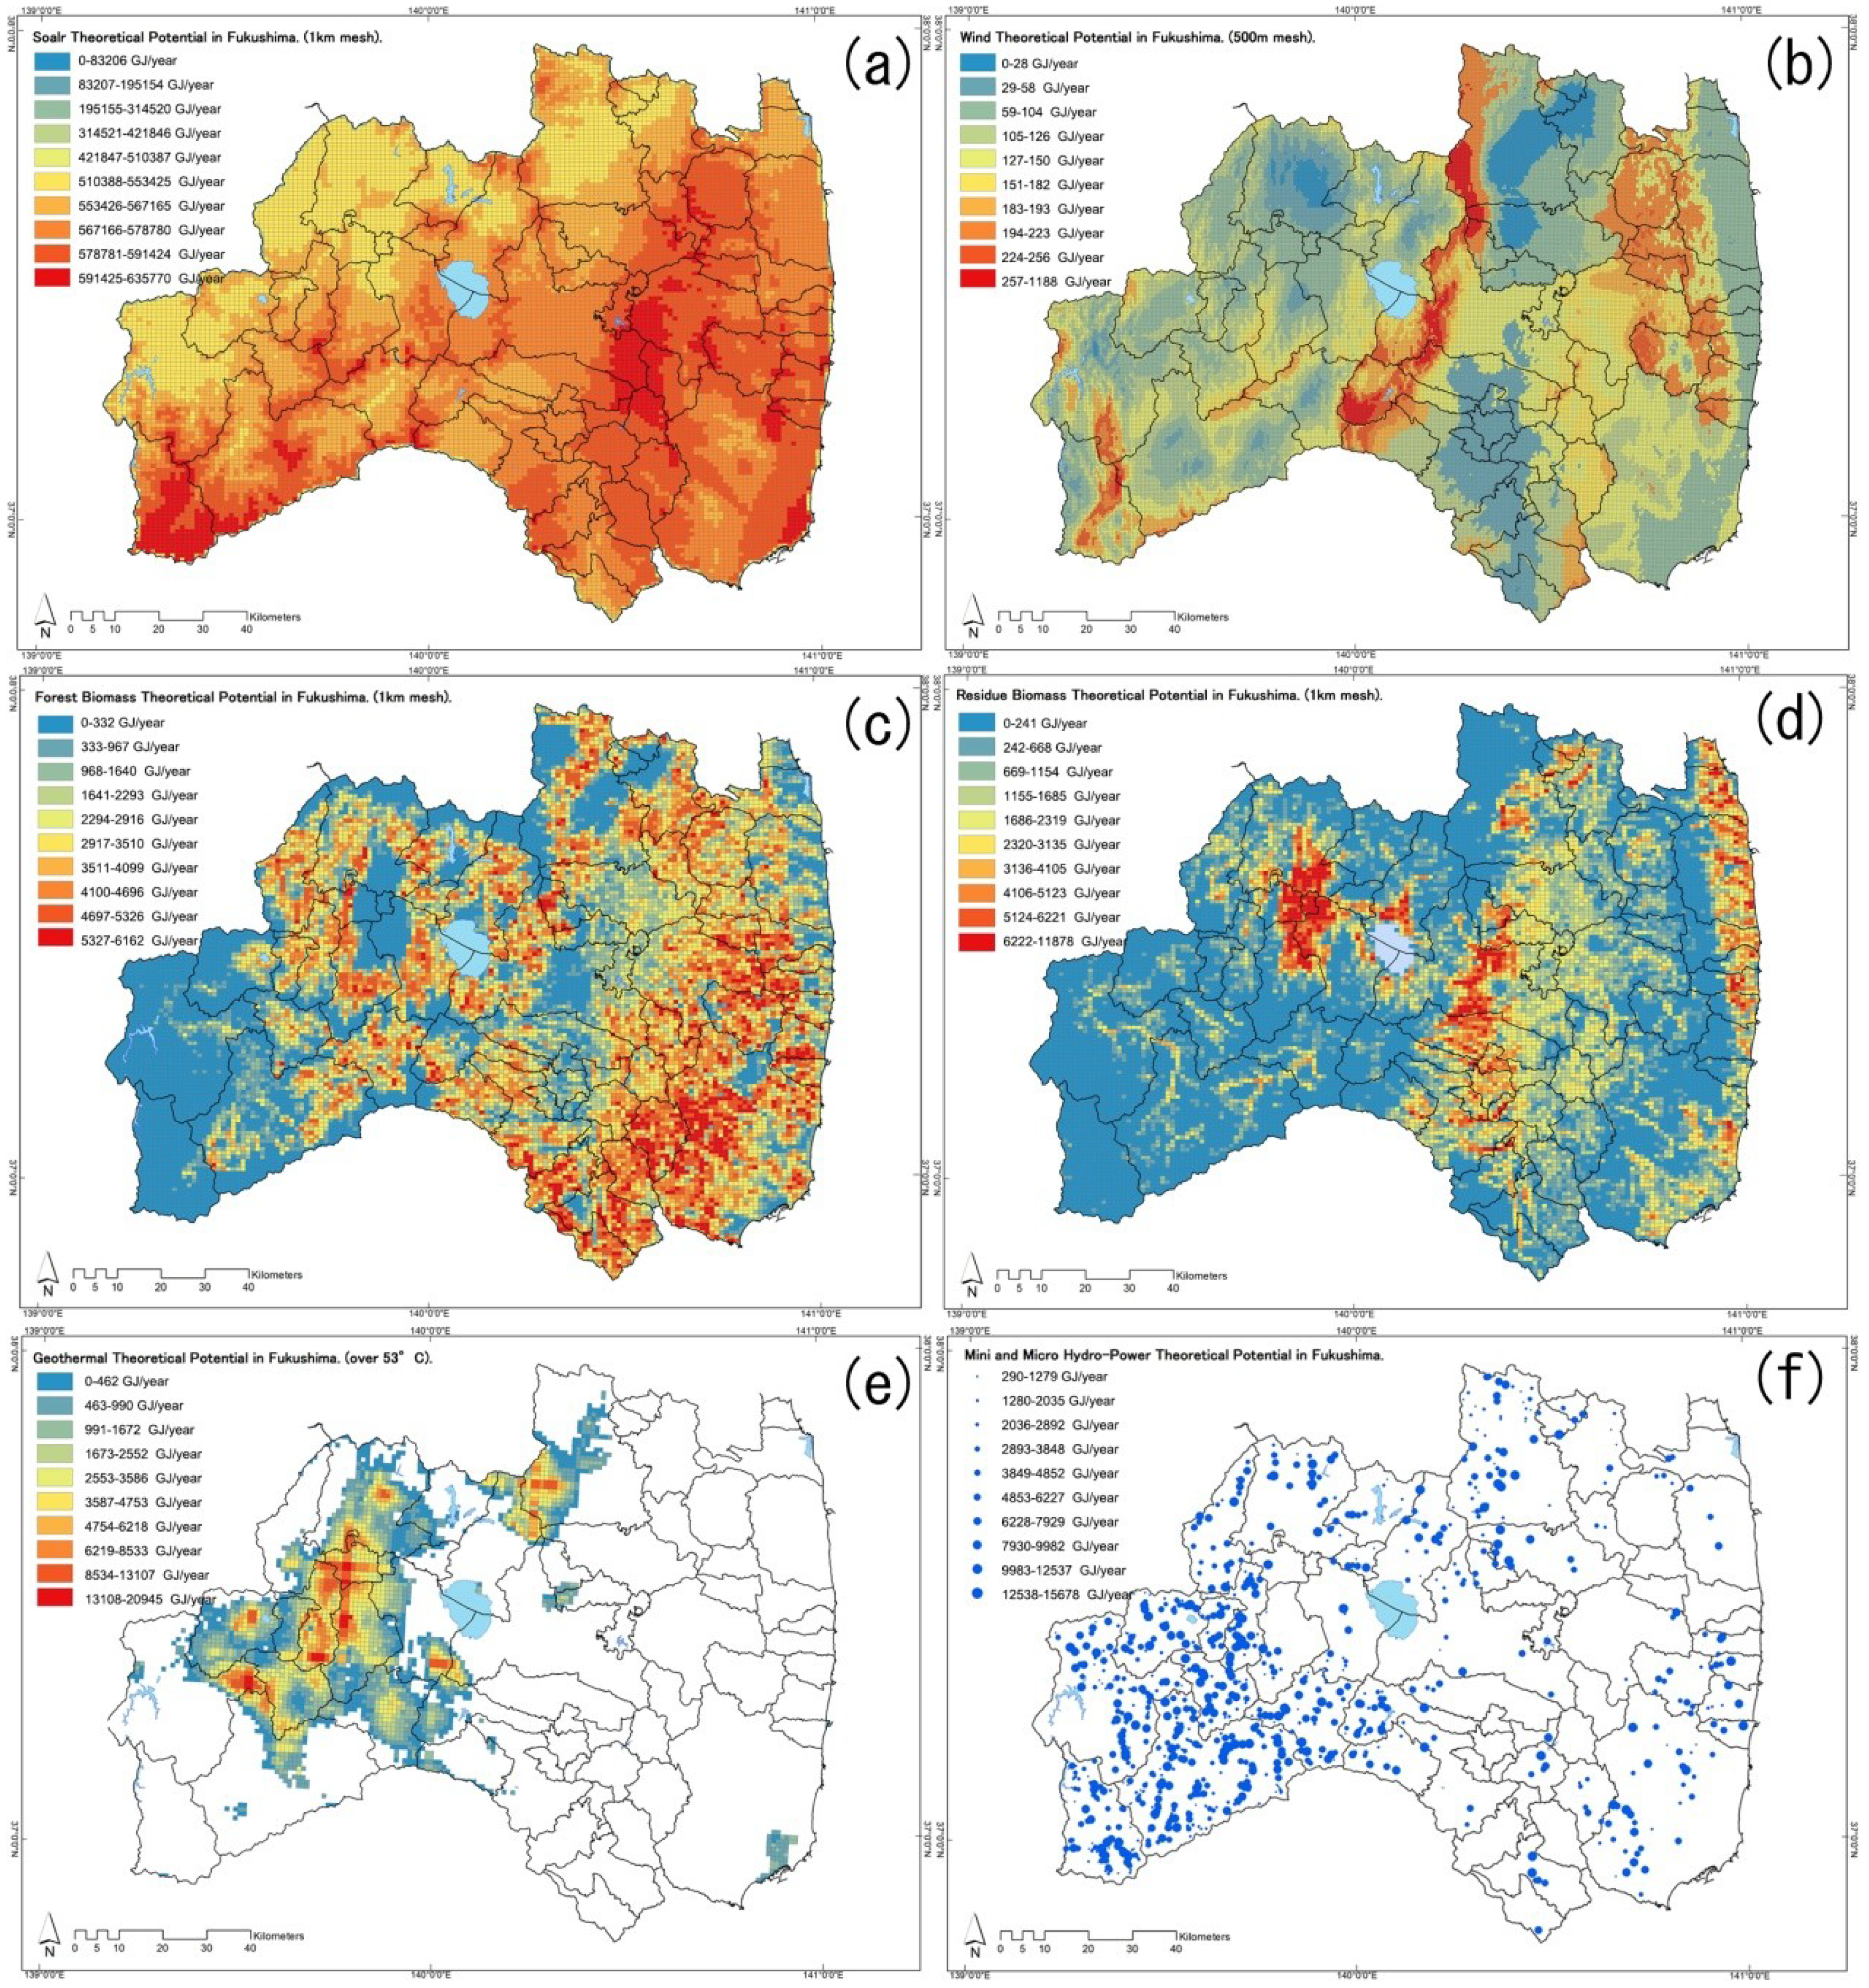
6.2.1. Theoretical Renewable Energy Potential
| Region | Sub-Region | Solar (GJ/year) | Wind (GJ/year) | Biomass (GJ/year) | Geothermal (GJ/year) | Hydro-power (GJ/year) | |
|---|---|---|---|---|---|---|---|
| Forest | Residue | ||||||
| Aizu | Aizu | 1,649,380,413 | 1,335,567 | 5,672,292 | 6,765,281 | 4,031,570 | 1,734,745 |
| Minami-Aizu | 1,301,851,592 | 1,205,125 | 1,851,971 | 2,098,939 | 921,606 | 2,761,851 | |
| Naka-doori | Kenpoku | 875,823,528 | 785,558 | 3,531,325 | 4,750,331 | 467,028 | 462,833 |
| Kenchu | 1,454,652,744 | 1,533,576 | 6,679,078 | 8,283,394 | 143,910 | 359,587 | |
| Kennan | 690,962,002 | 553,976 | 3,952,520 | 4,956,428 | 19,249 | 152,787 | |
| Hama-doori | Soso | 985,262,414 | 1,059,140 | 4,897,303 | 5,761,468 | 1238 | 238,846 |
| Iwaki | 689,691,755 | 606,831 | 4,113,452 | 5,984,101 | 35,257 | 243,585 | |
| Total | - | 7,647,624,448 | 7,827,791 | 30,697,941 | 38,599,942 | 5,619,858 | 5,954,234 |

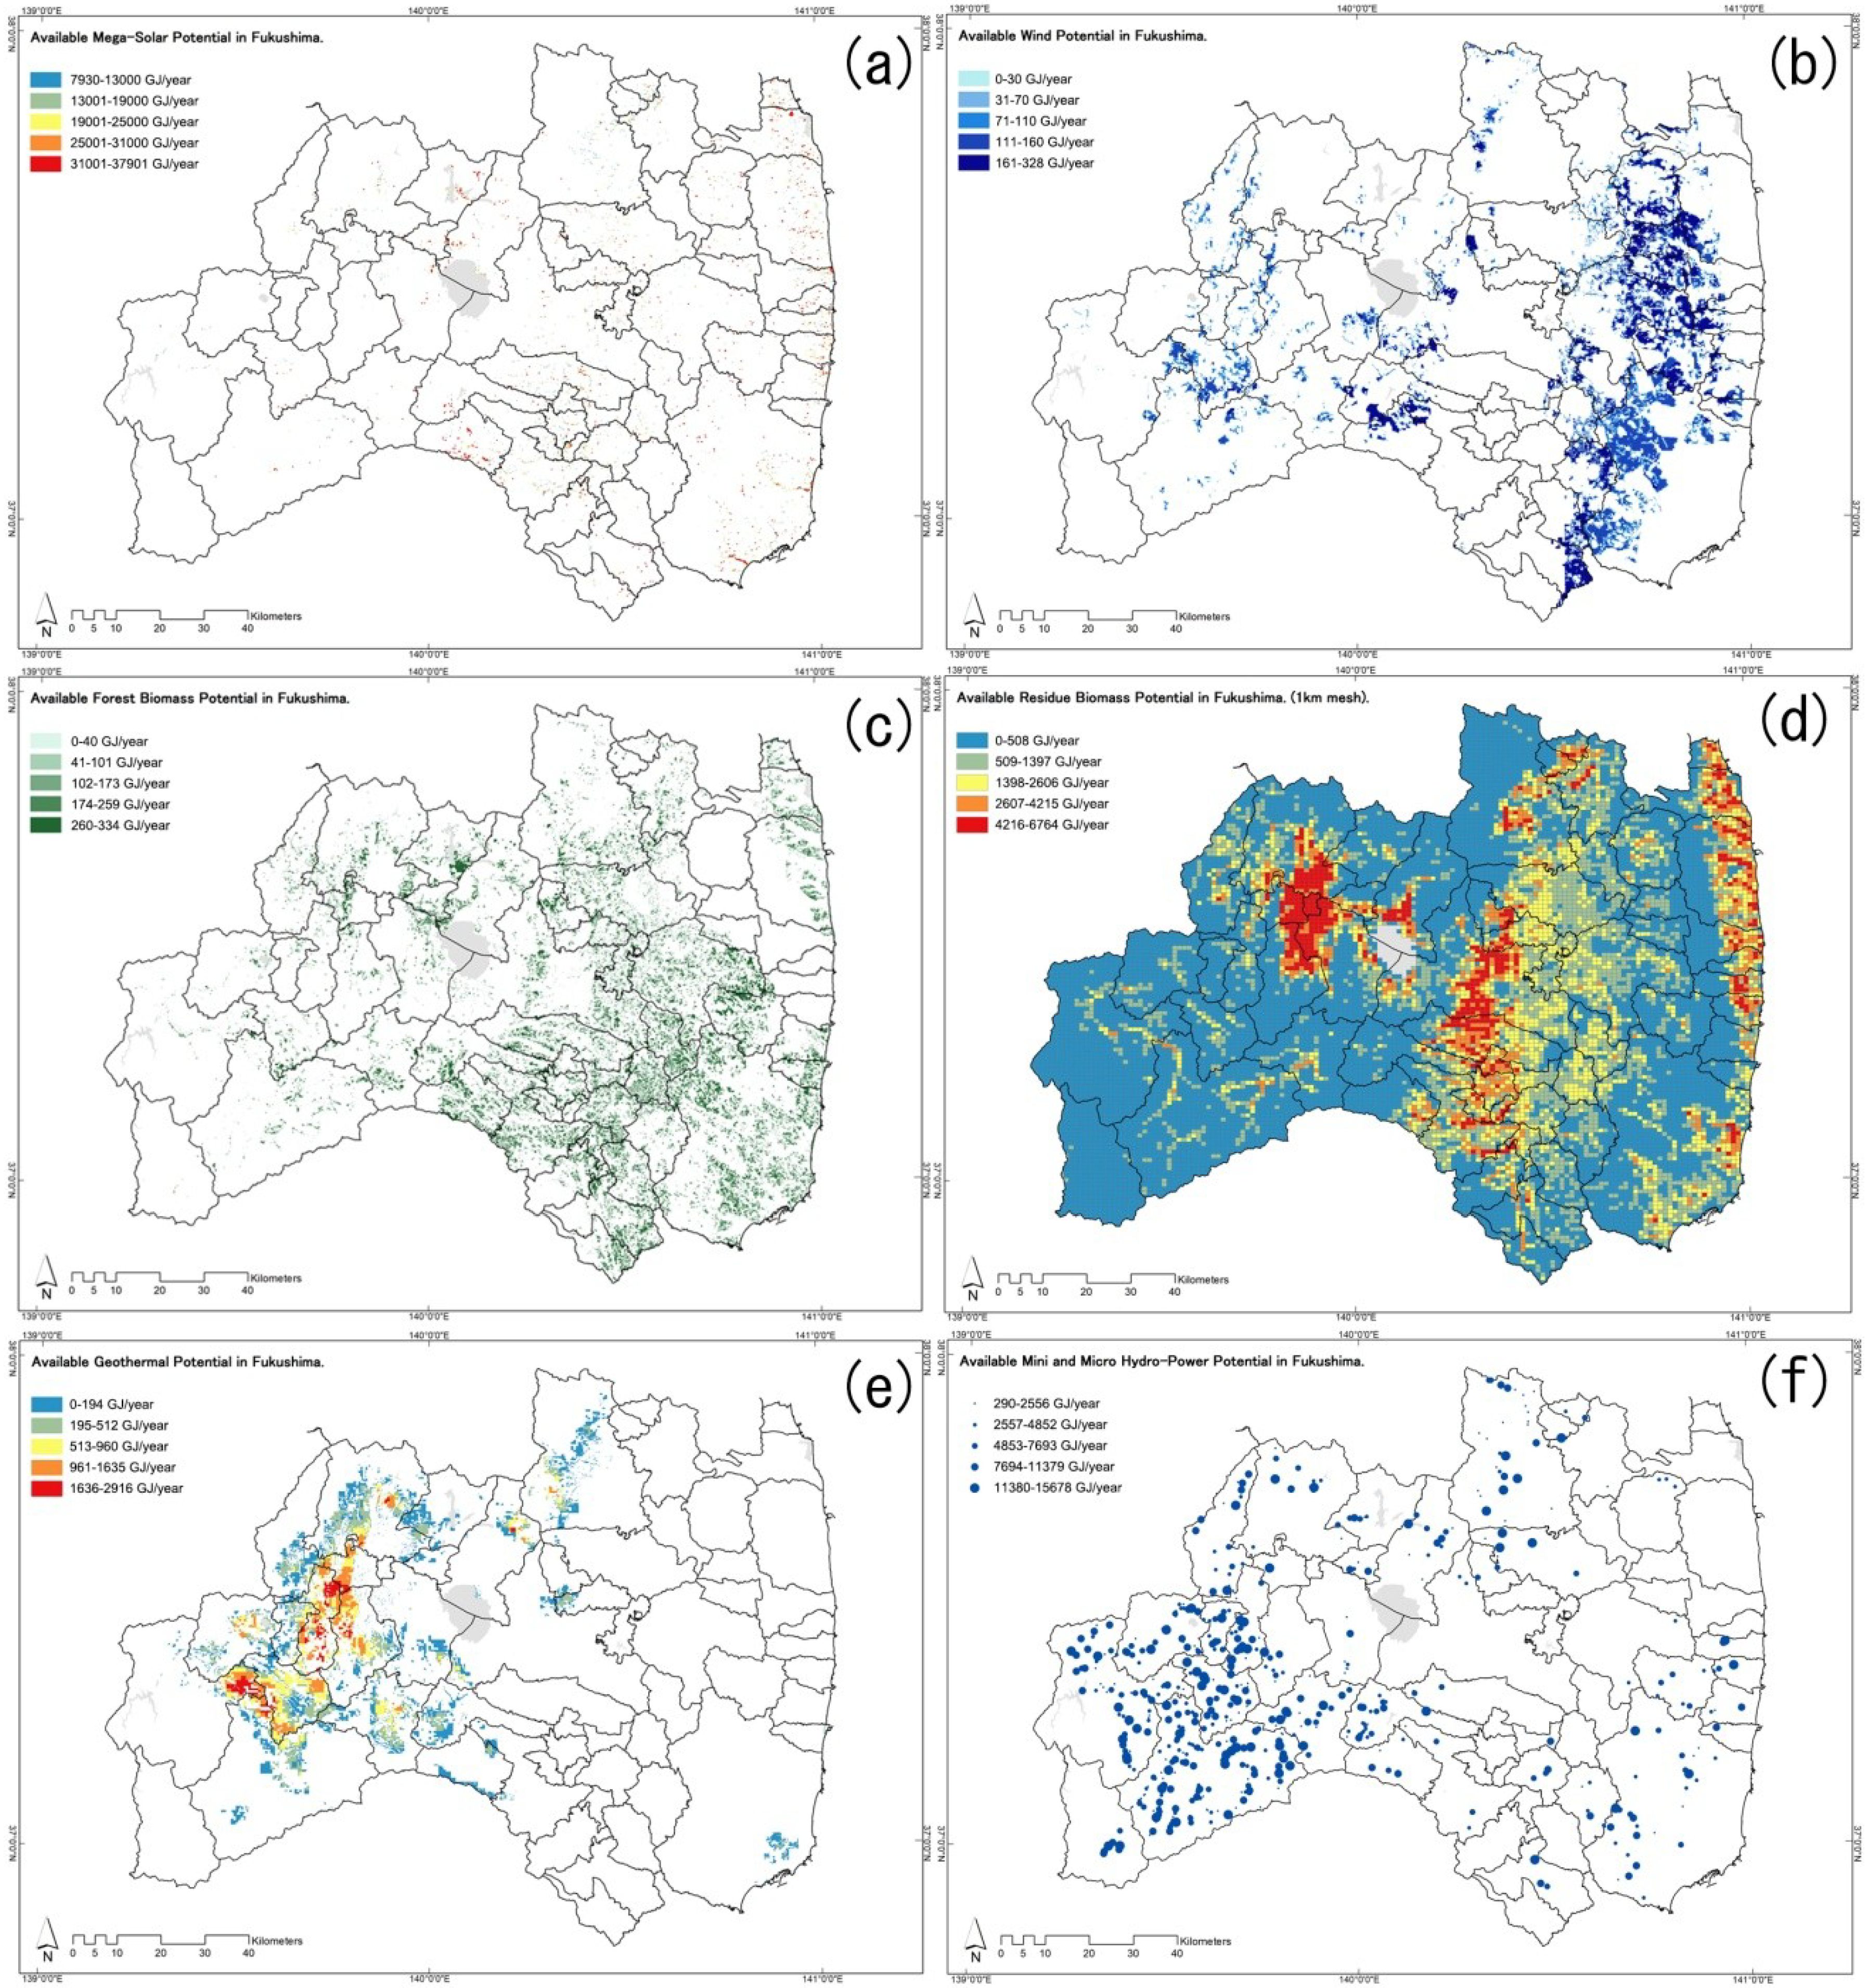
6.2.2. Available Renewable Energy Potential
| Region | Sub-Region | Mega-Solar (GJ/year) | Wind (GJ/year) | Biomass (GJ/year) | Geothermal (GJ/year) | Hydro-power (GJ/year) | |
|---|---|---|---|---|---|---|---|
| Forest (2020) | Residue | ||||||
| Aizu | Aizu | 12,155,400 | 93,742 | 1,143,591 | 2,742,340 | 1,664,734 | 1,244,265 |
| Minami-Aizu | 2,612,457 | 45,108 | 348,803 | 464,288 | 499,986 | 1,724,135 | |
| Naka-doori | Kenpoku | 8,449,481 | 61,982 | 946,895 | 1,304,350 | 89,005 | 245,175 |
| Kenchu | 21,018,417 | 273,709 | 2,764,895 | 3,242,402 | 42,183 | 225,566 | |
| Kennan | 16,376,603 | 83,800 | 1,606,596 | 1,163,934 | 11,474 | 92,090 | |
| Hama-doori | Soso | 28,279,549 | 302,983 | 992,506 | 1,834,251 | 724 | 124,723 |
| Iwaki | 14,234,210 | 151,444 | 1,610,949 | 837,067 | 11,873 | 187,230 | |
| Total | - | 103,126,117 | 1,012,768 | 9,414,235 | 11,588,632 | 2,319,979 | 3,843,184 |

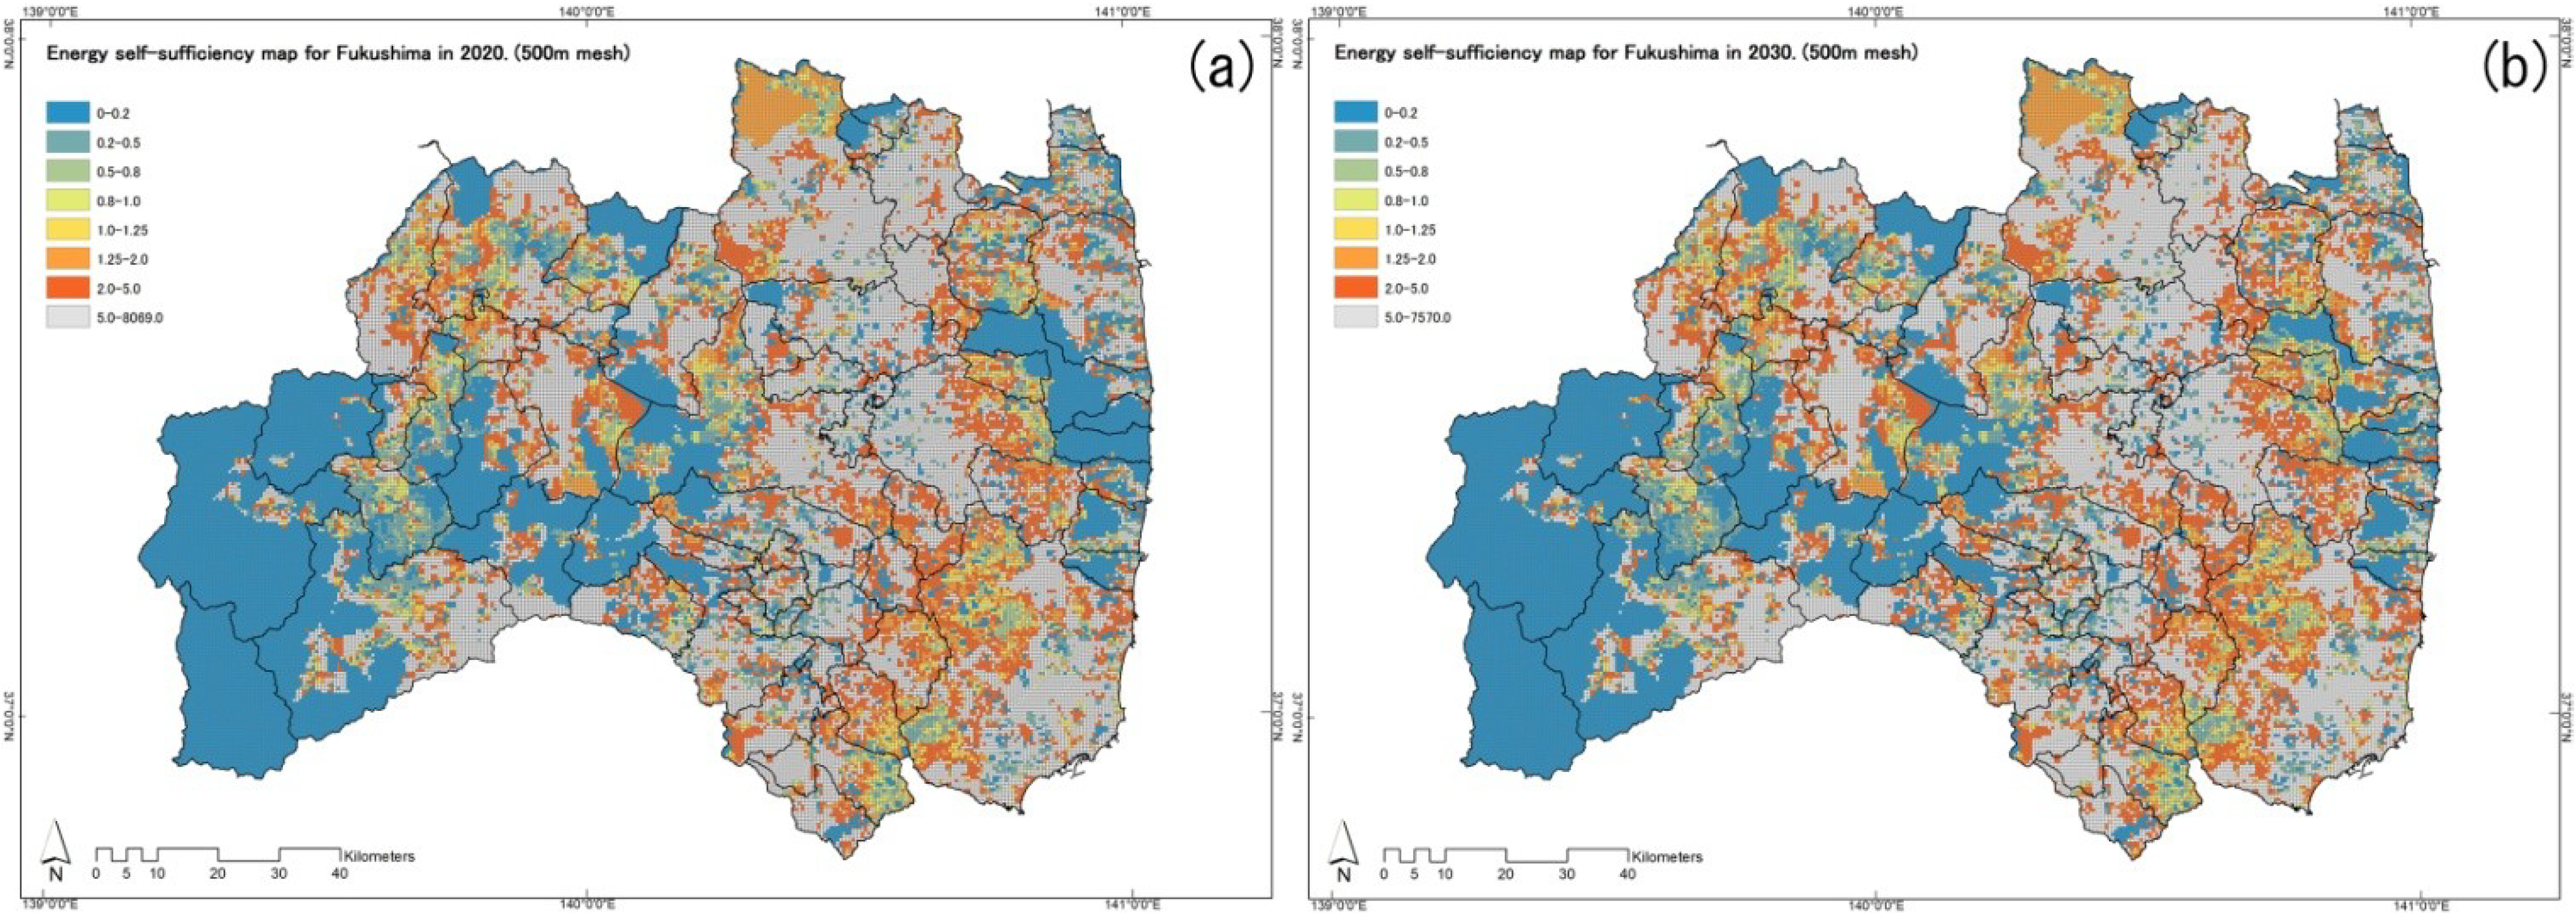
6.3. Energy Self-Sufficiency Map
| Region | Sub-Region | High self-sufficiency area | Medium self-sufficiency area | Low self-sufficiency area | |||
|---|---|---|---|---|---|---|---|
| 2020 | 2030 | 2020 | 2030 | 2020 | 2030 | ||
| Aizu | Aizu | 10.0% | 10.1% | 1.5% | 1.4% | 11.0% | 10.9% |
| Minami-Aizu | 13.1% | 13.1% | 0.3% | 0.3% | 3.7% | 3.6% | |
| Naka-doori | Kenpoku | 1.9% | 1.9% | 0.4% | 0.4% | 10.4% | 10.3% |
| Kenchu | 5.1% | 5.1% | 0.6% | 0.8% | 11.4% | 11.3% | |
| Kennan | 2.1% | 2.2% | 0.5% | 0.5% | 6.3% | 6.3% | |
| Hama-doori | Soso | 6.0% | 4.8% | 0.6% | 0.9% | 6.2% | 7.1% |
| Iwaki | 1.5% | 1.5% | 0.8% | 0.8% | 6.6% | 6.7% | |
| Total | - | 39.7% | 38.7% | 4.7% | 5.1% | 55.6% | 56.2% |
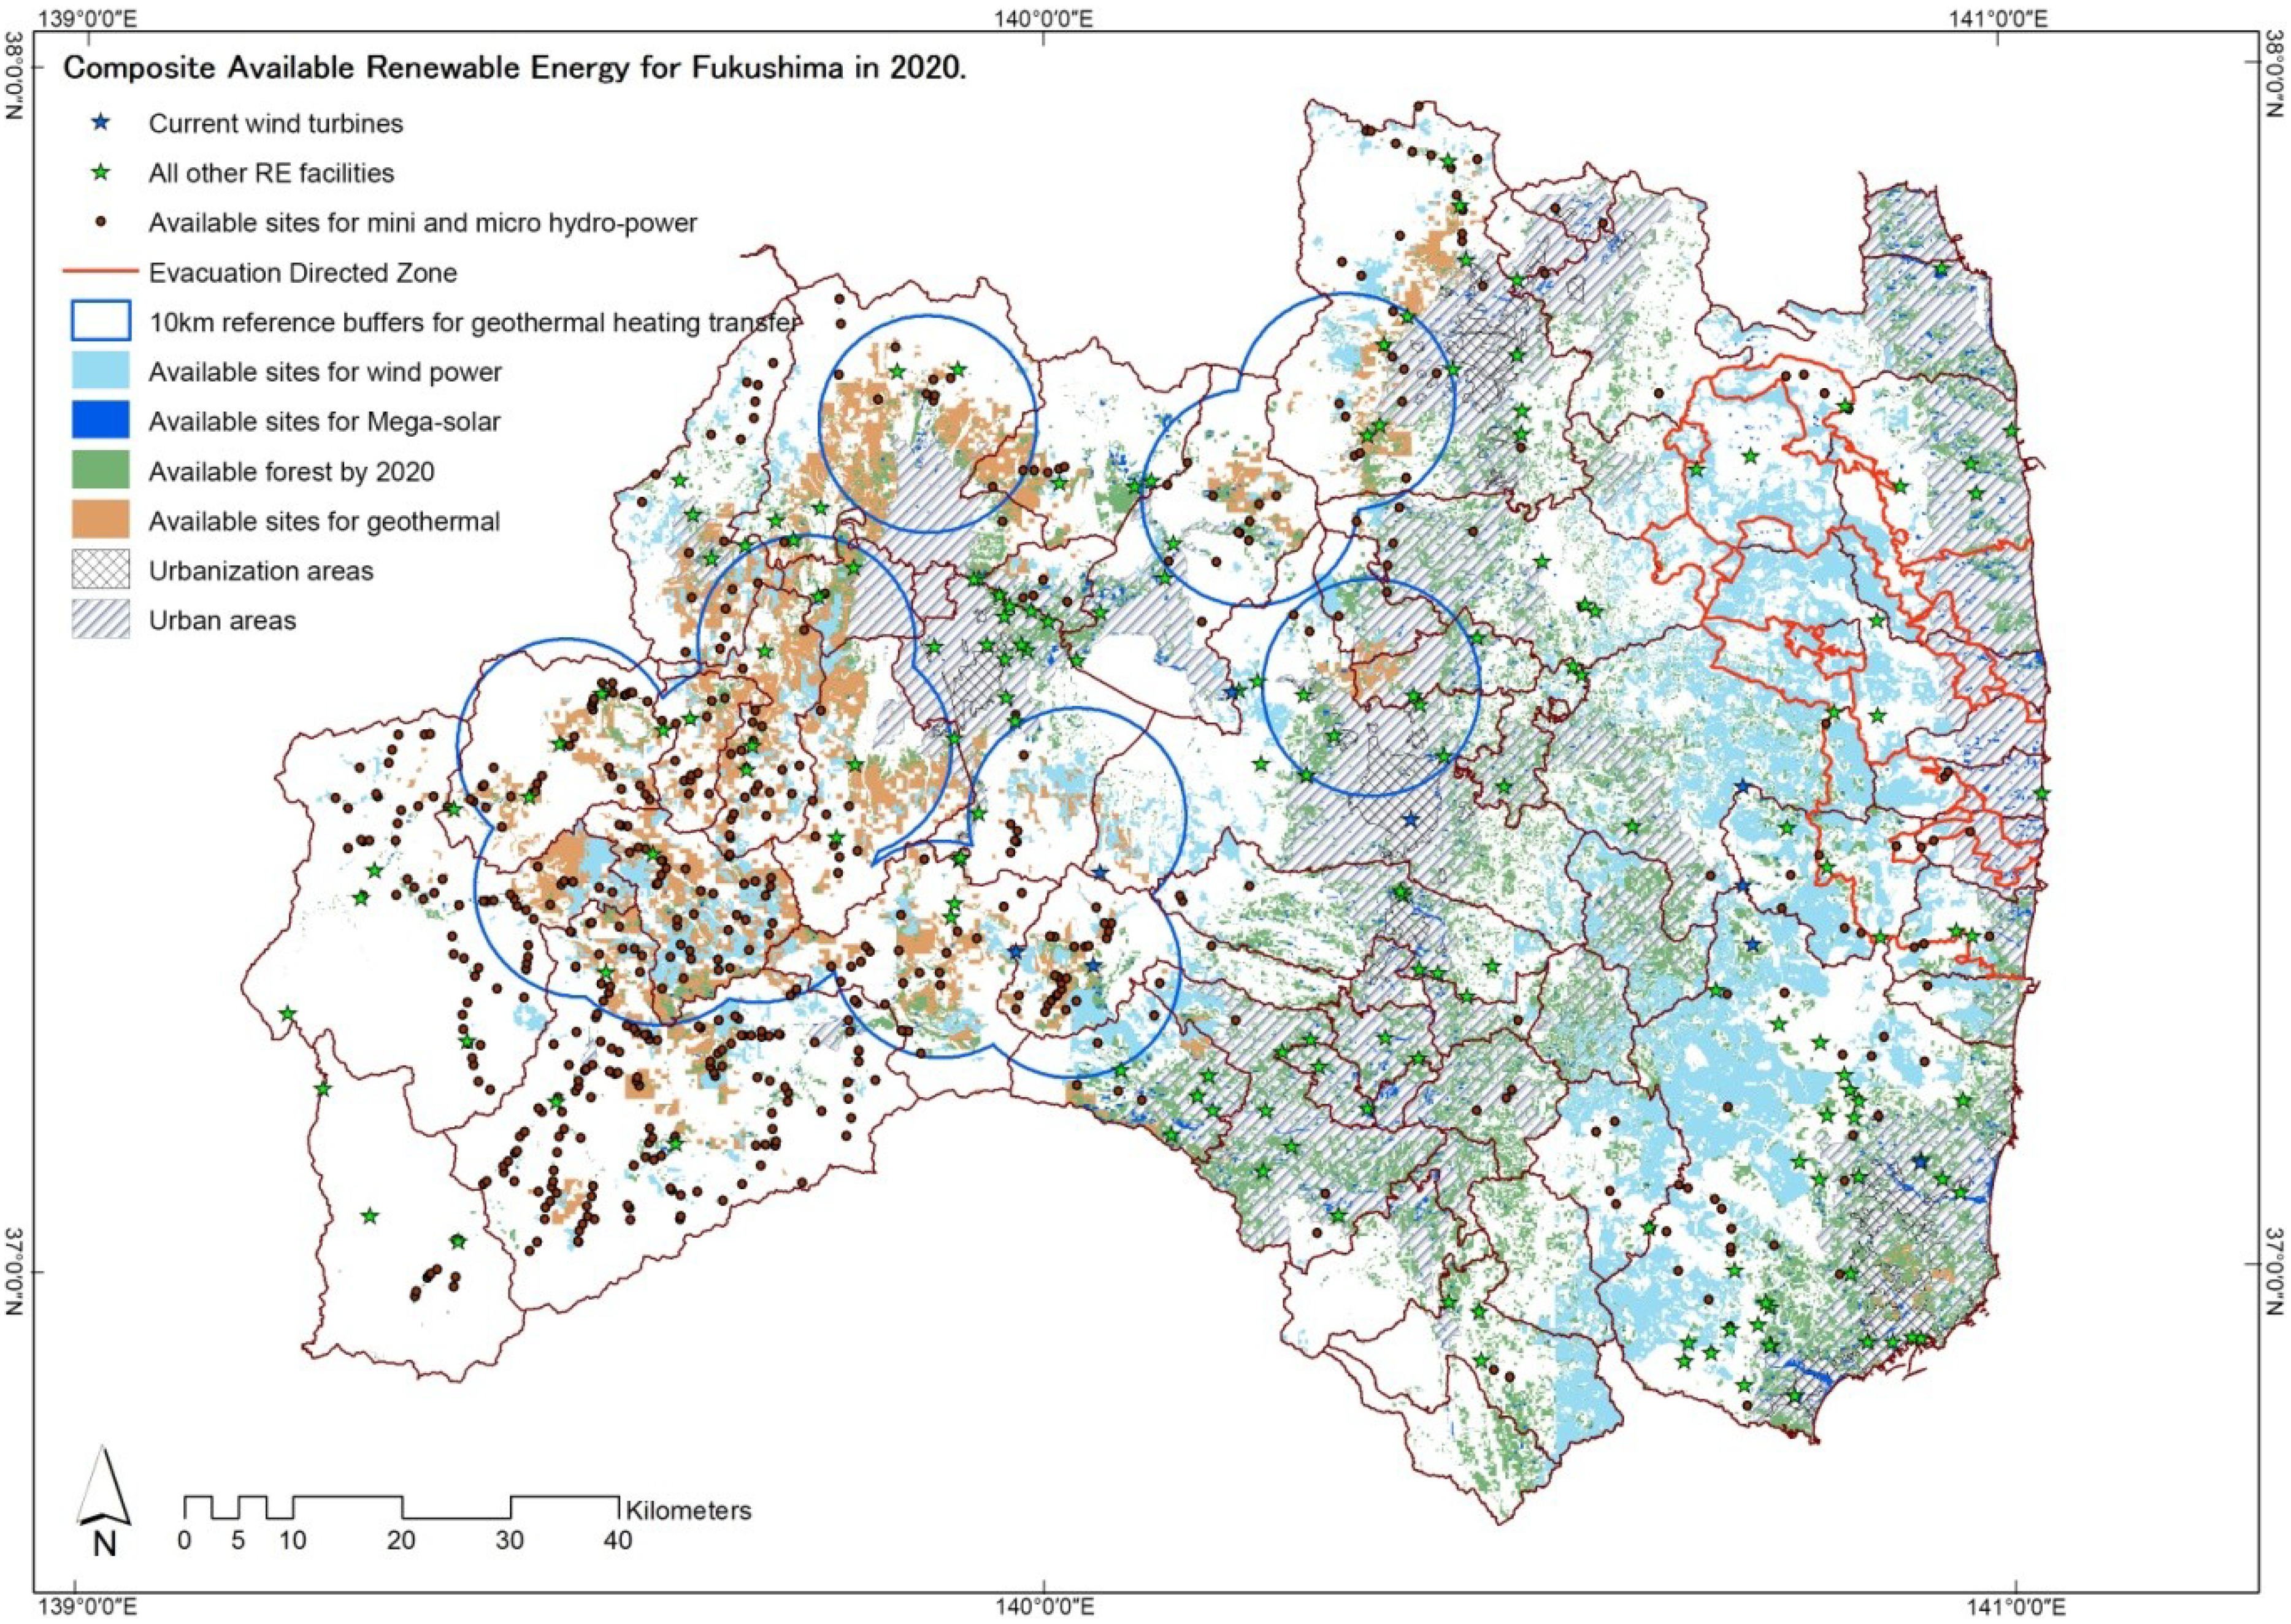
6.4. Composite Analysis Map
7. Conclusions
- In Fukushima, except for the Soso region, which may have an increase in population due to returning evacuees by 2030, there will be a decrease in population in all the other regions between 2010 and 2030. In regard to RE potential, solar power has the highest theoretical potential among all the five RES; biomass is second, while wind power is in third place. Mega-solar has the highest available potential, biomass, mini and micro hydro-power takes second and third places, respectively. Available forest areas will greatly increase from year 2013–2020. On the other hand, they will increase comparatively slowly from 2020–2030. This is because those areas originally with high radiation levels will still be above 0.1 μSv/h even 20 years after Fukushima Daiichi Crisis in 2011. By the end of 2020, 39.7% of Fukushima areas will have potential to become high self-sufficiency areas, 4.7% will have potential to become medium self-sufficiency areas while the remaining 55.6% will be in the low self-sufficiency category. By the end of 2030, high self-sufficiency levels in the Soso region will slightly decrease by 1.2% compared to 2020, due to increase in evacuees return to this region.
- The proposed GIS-based approach is useful in providing quantification and visualization of information in support of decision making for spatial planning of RE. The results of the case study in Fukushima confirm that, with the proposed approach, it is possible to identify future potential energy self-sufficiency possibilities with energy self-sufficiency map. Likewise, low self-sufficiency areas that need energy importation through spatial organizations in a long-term vision can also be identified. The composite map for available renewable energy revealed potential sites for developing RE facilities in the future. It also characterized their spatial distribution relationship, thus providing more accurate and integrated information for planners, investors, and policymakers.
- Because only installation objectives have been set for various RE facilities in Fukushima, the study results show possibilities and capabilities on how to achieve these goals. The results of this study show the need to explore multiple RES to meet those goals, and to increase energy safety and independence in Fukushima.
- The process of evaluating self-sufficiency possibilities and identifying potential sites for RE at the regional scale can further be applied to other Japanese municipalities or regions. Other criteria for available potential estimation and RES can further be included based on local, regional, and actual conditions. As RE are expected to play a key role in post-earthquake redevelopment in Fukushima and other regions, more municipalities and communities will embrace RE planning aimed at increasing energy independence. We reckon that municipalities and communities shall be best-informed through GIS-based integrated analysis, and hence make the most appropriate decisions in the planning process.
Acknowledgments
Author Contributions
Conflicts of Interest
References
- Elliott, D. Renewable energy and sustainable futures. Futures 2000, 32, 261–274. [Google Scholar] [CrossRef]
- Vera, I.; Langlois, L. Energy indicators for sustainable development. Energy 2007, 32, 875–882. [Google Scholar] [CrossRef]
- Dincer, I. Renewable energy and sustainable development: A crucial review. Renew. Sustain. Energy Rev. 2000, 4, 157–175. [Google Scholar] [CrossRef]
- European Renewable Energy Council. Energy Sustainable Communities. Available online: http://www.erec.org/ (accessed on 2 April 2014).
- Vettorato, D.; Geneletti, D.; Zambelli, P. Spatial comparison of renewable energy supply and energy demand for low-carbon settlements. Cities 2011, 28, 557–566. [Google Scholar] [CrossRef]
- Sarafidis, Y.; Diakoulaki, D.; Papayannakis, L.; Zervos, A. A regional planning approach for the promotion of renewable energies. Renew. Energy 1999, 18, 317–330. [Google Scholar] [CrossRef]
- Voivontas, D.; Assimacopuulos, D.; Mourelatos, A. Evaluation of renewable energy potential using a GIS decision support system. Renew. Energy 1998, 13, 333–344. [Google Scholar]
- Gil, M.V.; Blanco, D.; Carballo, M.T.; Calvo, L.F. Carbon stock estimates for forest in the Gastilla y Leon Region, Spain. A GIS based method for evaluation spatial distribution of residual biomass for bio-energy. Biomass Bioenergy 2011, 35, 243–252. [Google Scholar] [CrossRef]
- Arnette, A.N.; Zebel, C.W. Spatial analysis of renewable energy potential in the greater southern appalachian mountains. Renew. Energy 2011, 36, 2785–2798. [Google Scholar] [CrossRef]
- Hoesen, J.V.; Letendre, S. Evaluating potential renewable energy resources in poultney, vermont: A GIS-based approach to supporting rural community energy planning. Renew. Energy 2010, 35, 2114–2122. [Google Scholar] [CrossRef]
- Domingues, J.; Amador, J. Geographical information systems applied in the field of renewable energy sources. Comput. Ind. Eng. 2007, 52, 322–326. [Google Scholar] [CrossRef]
- Clarke, J.A.; Grant, A.D. Planning support tools for the integration of renewable energy at the regional level. Renew. Energy 1996, 9, 1090–1093. [Google Scholar] [CrossRef]
- Simao, A.; Densham, P.J.; Haklay, M. Web-based GIS for collaborative planning and public participation: An application to the strategic planning of wind farm sites. J. Environ. Manag. 2009, 90, 2027–2040. [Google Scholar] [CrossRef]
- Energy-Atlas Bayern. Available online: http://www.energieatlas.bayern.de/ (accessed on 2 April 2014).
- Pohekar, S.D.; Ramachandran, M. Application of multi-criteria decision making to sustainable energy planning—A review. Renew. Sustain. Energy Rev. 2004, 8, 365–381. [Google Scholar] [CrossRef]
- Beccali, M.; Cellura, M.; Mistretta, M. Decision-making in energy planning. Application of the electre method at the regional level for the diffusion of renewable energy technology. Renew. Energy 2003, 28, 2063–2087. [Google Scholar] [CrossRef]
- Tsoutsos, T.; Drandaki, M.; Frantzeskaki, N.; Iosifidis, E.; Kiosses, I. Sustainable energy planning by using multi-criteria analysis application in the island of crete. Energy Pol. 2009, 37, 1587–1600. [Google Scholar] [CrossRef]
- Loken, E. Use of multi-criteria decision analysis methods for energy planning problems. Renew. Sustain. Energy Rev. 2007, 11, 1584–1595. [Google Scholar] [CrossRef]
- Geogopoulou, E.; Lalas, D.; Papagiannakis, L. A multi-criteria decision aid approach for energy planning problems: The case of renewable energy option. Eur. J. Oper. Res. 1997, 103, 38–54. [Google Scholar]
- Terrados, J.; Almonacid, G.; Perez-Higueras, P. Proposal for a combined methodology for renewable energy planning. Application to a Spanish region. Renew. Sustain. Rev. 2009, 13, 2022–2030. [Google Scholar] [CrossRef]
- Czaplicka-Kolarz, K.; Stanczyk, K.; Kapusta, K. Technology foresight for a vision of energy sector development in Poland till 2030. Delphi survey as an element of technology foresighting. Technol. Forecast. Soc. Chang. 2009, 76, 327–338. [Google Scholar] [CrossRef]
- Celiktas, M.S.; Kocar, G. From potential forecast to foresight of turkey’s renewable energy with Delphi approach. Energy 2010, 35, 1973–1980. [Google Scholar] [CrossRef]
- Shiftan, Y.; Kaplan, S.; Hakkert, S. Scenario building as a tool for planning a sustainable transportation system. Transp. Res. Part D: Transp. Environ. 2003, 8, 323–342. [Google Scholar] [CrossRef]
- Neudoerffer, R.C.; Malhotra, P.; Ramana, P.V. Participatory rural energy planning in India—A policy context. Energy Pol. 2001, 29, 371–381. [Google Scholar] [CrossRef]
- Droege, P. The Renewable City: A Comprehensive Guide to an Urban Revolution; Wiley-Academy: Chichester, UK, 2006. [Google Scholar]
- Takigawa, K.; Murakami, A.; Ikeda, N.; Tashiro, K.; Ohmi, M. Energy Autonomy in Europe; Gakugei Publication: Kyoto, Japan, 2012. (In Japanese) [Google Scholar]
- Portland Sustainability Institute. Eco Districts. Available online: http://ecodistricts.org/ (accessed on 14 January 2014).
- Stremke, S.; Koh, J. Ecological concepts and strategies with relevance to energy-conscious spatial planning and design. Environ. Plan. B: Plan. Design 2010, 37, 518–532. [Google Scholar] [CrossRef]
- Yue, C.D.; Wang, S.S. GIS-based evaluation of multifarious local renewable energy resources: A case study of the Chigu area of Southwestern Taiwan. Energy Policy 2006, 34, 730–742. [Google Scholar] [CrossRef]
- Ramachandra, T.V.; Shruthi, B.V. Spatial mapping of renewable energy potential. Renew. Sustain. Energy Rev. 2007, 11, 1460–1480. [Google Scholar] [CrossRef]
- Japan Ministry of Economy, Trade and Industry. Basic Energy Plan. 2010. Available online: http://www.enecho.meti.go.jp/topics/kihonkeikaku/100618honbun.pdf (accessed on 8 June 2013). (In Japanese) [Google Scholar]
- Federal Ministry of Transport, Building and Urban Development. New Concepts for Spatial Planning in Germany. Available online: http://www.bmvbs.de/SharedDocs/EN/Artikel/SW/new-concepts-for-spatial-planning-in-germany.html?nn=37416 (accessed on 18 September 2013).
- CEMAT. European Regional/Planning Charter. Available online: http://www.coe.int/t/dgap/localdemocracy/cemat/VersionCharte/Charte_bil.pdf (accessed on 10 July 2013). (In French)
- Healey, P. Collaborative Planning: Shaping Places in Fragment Societies; Macmillan: London, UK, 1997. [Google Scholar]
- Commission of the European Communities. The EU Compendium of Spatial Planning Systems and Policies. 1997. Available online: http://bookshop.europa.eu/en/the-eu-compendium-of-spatial-planning-systems-and-policies-pbCX0397870/ (accessed on 26 September 2013).
- Kinoshita, I.; Ringli, H.; Schwrzenbach, B.; Nakamura, M. Spatial Planning of Switzerland; A Series of Rural Engineering Study; Rural Development Planning Commission: Tokyo, Japan, 1998. [Google Scholar]
- Koresawa, A.; Konvitz, J. Chaper 1 towards a New Role for Spatial Planning. In Towards a New Role for Spatial Planning; OECD: Paris, France, 2001. [Google Scholar]
- Adams, N.; Alden, J.; Harris, N. Regional Development and Spatial Planning in an Enlarged European Union; Urban and Regional Planning and Development Series; Ashgate: Surrey, UK, 2006. [Google Scholar]
- Kinoshita, I. Why the western spatial planning system could not land in Japan? J. Rural Plan. Assoc. 2011, 30, 139–142. [Google Scholar] [CrossRef]
- Jabareen, Y. Sustainable urban forms: Their typologies, models, and concepts. J. Plan. Educ. Res. 2006, 26, 38–52. [Google Scholar] [CrossRef]
- Rio, P.; Burguillo, M. Assessing the impact of renewable energy development on local sustainability: Towards a theoretical framework. Renew. Sustain. Energy Rev. 2008, 12, 1325–1344. [Google Scholar] [CrossRef]
- Bergmann, A.; Hanley, N.; Wright, R. Valuing the attributes of renewable energy investments. Energy Pol. 2006, 34, 1004–1014. [Google Scholar] [CrossRef]
- Gret-Regamey, A.; Crespo, R. Planning from future vision: Inverse modeling in spatial planning. Environ. Plan. B: Plan. Design 2011, 38, 979–994. [Google Scholar] [CrossRef]
- Fukushima Gov. Renewable Energy Promotion Vision. Available online: http://www.pref.fukushima.lg.jp/download/1/re_zenpen.pdf (accessed on 30 October 2013).
- New Energy and Industrial Technology Development Organization (NEDO). Wind Power Installation Performance List in Fukushima, Japan. Available online: http://www.nedo.go.jp/library/fuuryoku/case/pdf/pref_07.pdf (accessed on 5 November 2013).
- Fukushima Gov. Mega-Solar Candidate Sites. Available online: http://www.pref.fukushima.lg.jp/uploaded/library/mega_131226.pdf (accessed on 28 November 2013). (In Japanese)
- Electrical Japan. Japan Mega-Solar and Hydro-Power Plant Map. Available online: http://agora.ex.nii.ac.jp/earthquake/201103-eastjapan/energy/electrical-japan/ (accessed on 18 December 2013).
- Fukushima Gov. Fukushima Airport Mega-Solar Project. Available online: http://www.pref.fukushima.lg.jp/uploaded/attachment/39411.pdf (accessed on 18 December 2013). (In Japanese)
- Fukushima Gov. Renewable Energy Potential Database. Available online: http://www.pref.fukushima.jp/chiiki-shin/saiseiene/casestudies/energy.html (accessed on 28 October 2013). (In Japanese)
- International Energy Agency (IEA). World Energy Outlook 2010. Available online: http://www.worldenergyoutlook.org/media/weo2010.pdf (accessed on 7 October 2013).
- Japanese National Institute of Population and Social Security Research (IPSS). Future Population Prediction. Available online: http://www.ipss.go.jp/syoushika/tohkei/newest04/gh2401.pdf (accessed on 7 October 2013). (In Japanese)
- Japan Government Statistics. E-Stat. Available online: https://www.e-stat.go.jp/SG1/estat/eStatTopPortal.do (accessed on 3 October 2013). (In Japanese)
- Japan Ministry of Education, Science and Culture. Evacuation Population Data. Available online: http://www.mext.go.jp/b_menu/shingi/chousa/kaihatu/016/shiryo/__icsFiles/afieldfile/2011/11/25/1313502_3.pdf (accessed on 14 October 2013). (In Japanese)
- Japan Ministry of Land, Infrastructure, Transport and Tourism. Conceptual Diagram of Revised Evacuation Areas. Available online: http://www.meti.go.jp/earthquake/nuclear/20130530_02.html (accessed on 2 October 2013). (In Japanese)
- Fukushima Gov. Comprehensive Plan-Fukushima Shinsei Plan. Available online: http://www.pref.fukushima.lg.jp/download/1/sougoukeikaku_fukushimashinseiplan.pdf (accessed on 18 October 2013). (In Japanese)
- Biodiversity Center of Japan. Japanese Standard Mesh System. Available online: http://www.biodic.go.jp/kiso/col_mesh.html (accessed on 5 October 2013). (In Japanese)
- Japan Government Statistics. About Japanese Mesh System. Available online: http://www.stat.go.jp/data/mesh/m_tuite.htm (accessed on 6 October 2013). (In Japanese)
- Japan Ministry of Land, Infrastructure, Transport and Tourism. National Land Numerical Information Download Service. Available online: http://nlftp.mlit.go.jp/ksj-e/index.html (accessed on 10 October 2013). (In Japanese)
- NEDO. New Energy Guide Book. Available online: http://www.nedo.go.jp/library/pamphlets/ZZ_pamphlets_08_3dounyu_shinenegaido_index.html (accessed on 16 June 2012). (In Japanese)
- Ministry of Economy, Trade and Industry. Renewable Energy Cost Verification Committee Report. Available online: http://www.enecho.meti.go.jp/info/committee/kihonmondai/8th/8-3.pdf (accessed on 16 December 2013). (In Japanese)
- Japan Ministry of Environment. Renewable Energy Potential Survey Report. Available online: https://www.env.go.jp/earth/report/h25-05/full.pdf (accessed on 7 December 2013). (In Japanese)
- Geospatial Information Authority of Japan. GIS Base Map Information. Available online: http://www.gsi.go.jp/kiban/index.html (accessed on 9 October 2013). (In Japanese)
- NEDO. Local Area Wind Energy Prediction System. Available online: http://app8.infoc.nedo.go.jp/nedo/webgis (accessed on 4 November 2013). (In Japanese)
- Kitakata City Gov. New Energy Vision. Available online: http://www.city.kitakata.fukushima.jp/dbps_data/_material_/localhost/kakuka/seisaku/new-energy-vision-honsyo.pdf (accessed on 30 October 2013). (In Japanese)
- Baban, S.M.J.; Parry, T. Developing and applying a GIS-assisted approach to locating wind farms in the UK. Renew. Energy 2001, 24, 59–71. [Google Scholar] [CrossRef]
- Silz-Szkliniarz, B.; Vogt, J. GIS-based approach for the evaluation of wind energy potential: A case study for the kujawsko-pomorskie voivodeship. Renew. Sustain. Energy Rev. 2011, 15, 1696–1707. [Google Scholar] [CrossRef]
- NEDO. Biomass Theoretical and Available Potential Estimation. Available online: http://app1.infoc.nedo.go.jp/biomass/ (accessed on 25 November 2013). (In Japanese)
- Fukushima Gov. Hanawa Town Reconstruction Project-Wood Biomass Power Plant Project. Available online: http://www.pref.fukushima.lg.jp/uploaded/attachment/43439.pdf (accessed on 25 December 2013).
- Forestry Agency. Survey Results of Radioactive Materials in the Forest. Available online: http://www.rinya.maff.go.jp/j/press/kenho/pdf/130329-01.pdf (accessed on 25 December 2013). (In Japanese)
- Nuclear Regulation Authority. Monitoring Information of Environmental Radiation Level. Available online: http://radioactivity.nsr.go.jp/map/ja/download.html (accessed on 21 December 2013). (In Japanese)
- Nuclear Regulation Authority. The 4th and 6thAirborne Monitoring Results at 80 km Radius from Fukushima Daiichi. Available online: http://radioactivity.nsr.go.jp/ja/list/258/list-1.html (accessed on 25 December 2013). (In Japanese)
- Fukushima Gov. The 1st–6th Environmental Radiation Monitoring and Mesh Survey Results: Radiation Map Making. Available online: http://www.pref.fukushima.lg.jp/sec/16025d/monitaring-mesyu.html (accessed on 3 October 2013). (In Japanese)
- Biodiversity Center of Japan. The 5th Vegetation Survey. Available online: http://www.biodic.go.jp/trialSystem/shpddl.html (accessed on 18 November 2013). (In Japanese)
- Japan Ministry of Environment. Basic Zoning Information of RE 2012; [CD-ROM]; Japan Ministry of Environment: Tokyo, Japan, 2012.
- Ministry of Economy, Trade and Industry. Geothermal Electricity. Available online: http://www.meti.go.jp/committee/materials2/downloadfiles/g90309c05j.pdf (accessed on 16 December 2013). (In Japanese)
- Ostergaard, P.A.; Lund, L. A renewable energy system in frederikshavn using low-temperature geothermal energy for district heating. Appl. Energy 2011, 88, 479–487. [Google Scholar] [CrossRef]
- Japan Ministry of Environment. Summary of Actions in Geothermal Development. Available online: https://www.env.go.jp/nature/geothermal_power/conf/h2304/ref02.pdf (accessed on 19 January 2014). (In Japanese)
- Fukushima University. Mini and Micro Hydro-Power Planning. Available online: http://www.sss.fukushima-u.ac.jp/saiene/system/pdfs/attachments/000/000/039/original/%E7%AC%AC16%E7%AB%A0%E3%80%80%E5%B0%8F%E6%B0%B4%E5%8A%9B%E7%99%BA%E9%9B%BB%E3%83%97%E3%83%A9%E3%83%B3%E3%83%8B%E3%83%B3%E3%82%B0%E5%AE%9F%E7%BF%92.pdf (accessed on 17 December 2013). (In Japanese)
- Kiryu City Gov. Mini and Micro Hydro-Power Installation Book. Available online: http://www.city.kiryu.gunma.jp/web/home.nsf/HomePage/4EA4A0025D72A035492577A600353D4B/$FILE/donyu.pdf (accessed on 18 January 2014). (In Japanese)
- Jabareen, Y. A new conceptual framework for sustainable development. Environ. Dev. Sustain. 2008, 10, 179–192. [Google Scholar] [CrossRef]
© 2014 by the authors; licensee MDPI, Basel, Switzerland. This article is an open access article distributed under the terms and conditions of the Creative Commons Attribution license (http://creativecommons.org/licenses/by/3.0/).
Share and Cite
Wang, Q.; M'Ikiugu, M.M.; Kinoshita, I. A GIS-Based Approach in Support of Spatial Planning for Renewable Energy: A Case Study of Fukushima, Japan. Sustainability 2014, 6, 2087-2117. https://doi.org/10.3390/su6042087
Wang Q, M'Ikiugu MM, Kinoshita I. A GIS-Based Approach in Support of Spatial Planning for Renewable Energy: A Case Study of Fukushima, Japan. Sustainability. 2014; 6(4):2087-2117. https://doi.org/10.3390/su6042087
Chicago/Turabian StyleWang, Qianna, Martin Mwirigi M'Ikiugu, and Isami Kinoshita. 2014. "A GIS-Based Approach in Support of Spatial Planning for Renewable Energy: A Case Study of Fukushima, Japan" Sustainability 6, no. 4: 2087-2117. https://doi.org/10.3390/su6042087
APA StyleWang, Q., M'Ikiugu, M. M., & Kinoshita, I. (2014). A GIS-Based Approach in Support of Spatial Planning for Renewable Energy: A Case Study of Fukushima, Japan. Sustainability, 6(4), 2087-2117. https://doi.org/10.3390/su6042087