Combining Satellite Data and Models to Assess Vulnerability to Climate Change and Its Impact on Food Security in Morocco

Abstract
:1. Introduction
- (1)
- Discriminates between urban and rural populations,
- (2)
- Performs the estimates at a fine horizontal scale (5 km × 5 km) compatible with regional agro-ecological zones in Morocco, and most importantly,
- (3)
- Considers climate change indicators as drivers of the NPP supply component.
2. Materials and Methods
2.1. Model Formulation
2.2. Data
3. Estimating NPP Demand and Supply
3.1. NPP Demand

| Vegetal | Eggs | Milk | Meat | Wood | Paper | |
|---|---|---|---|---|---|---|
| Urban | 64 | 56 | 57 | 60 | 12 | 80 |
| Rural | 36 | 44 | 43 | 40 | 88 | 20 |
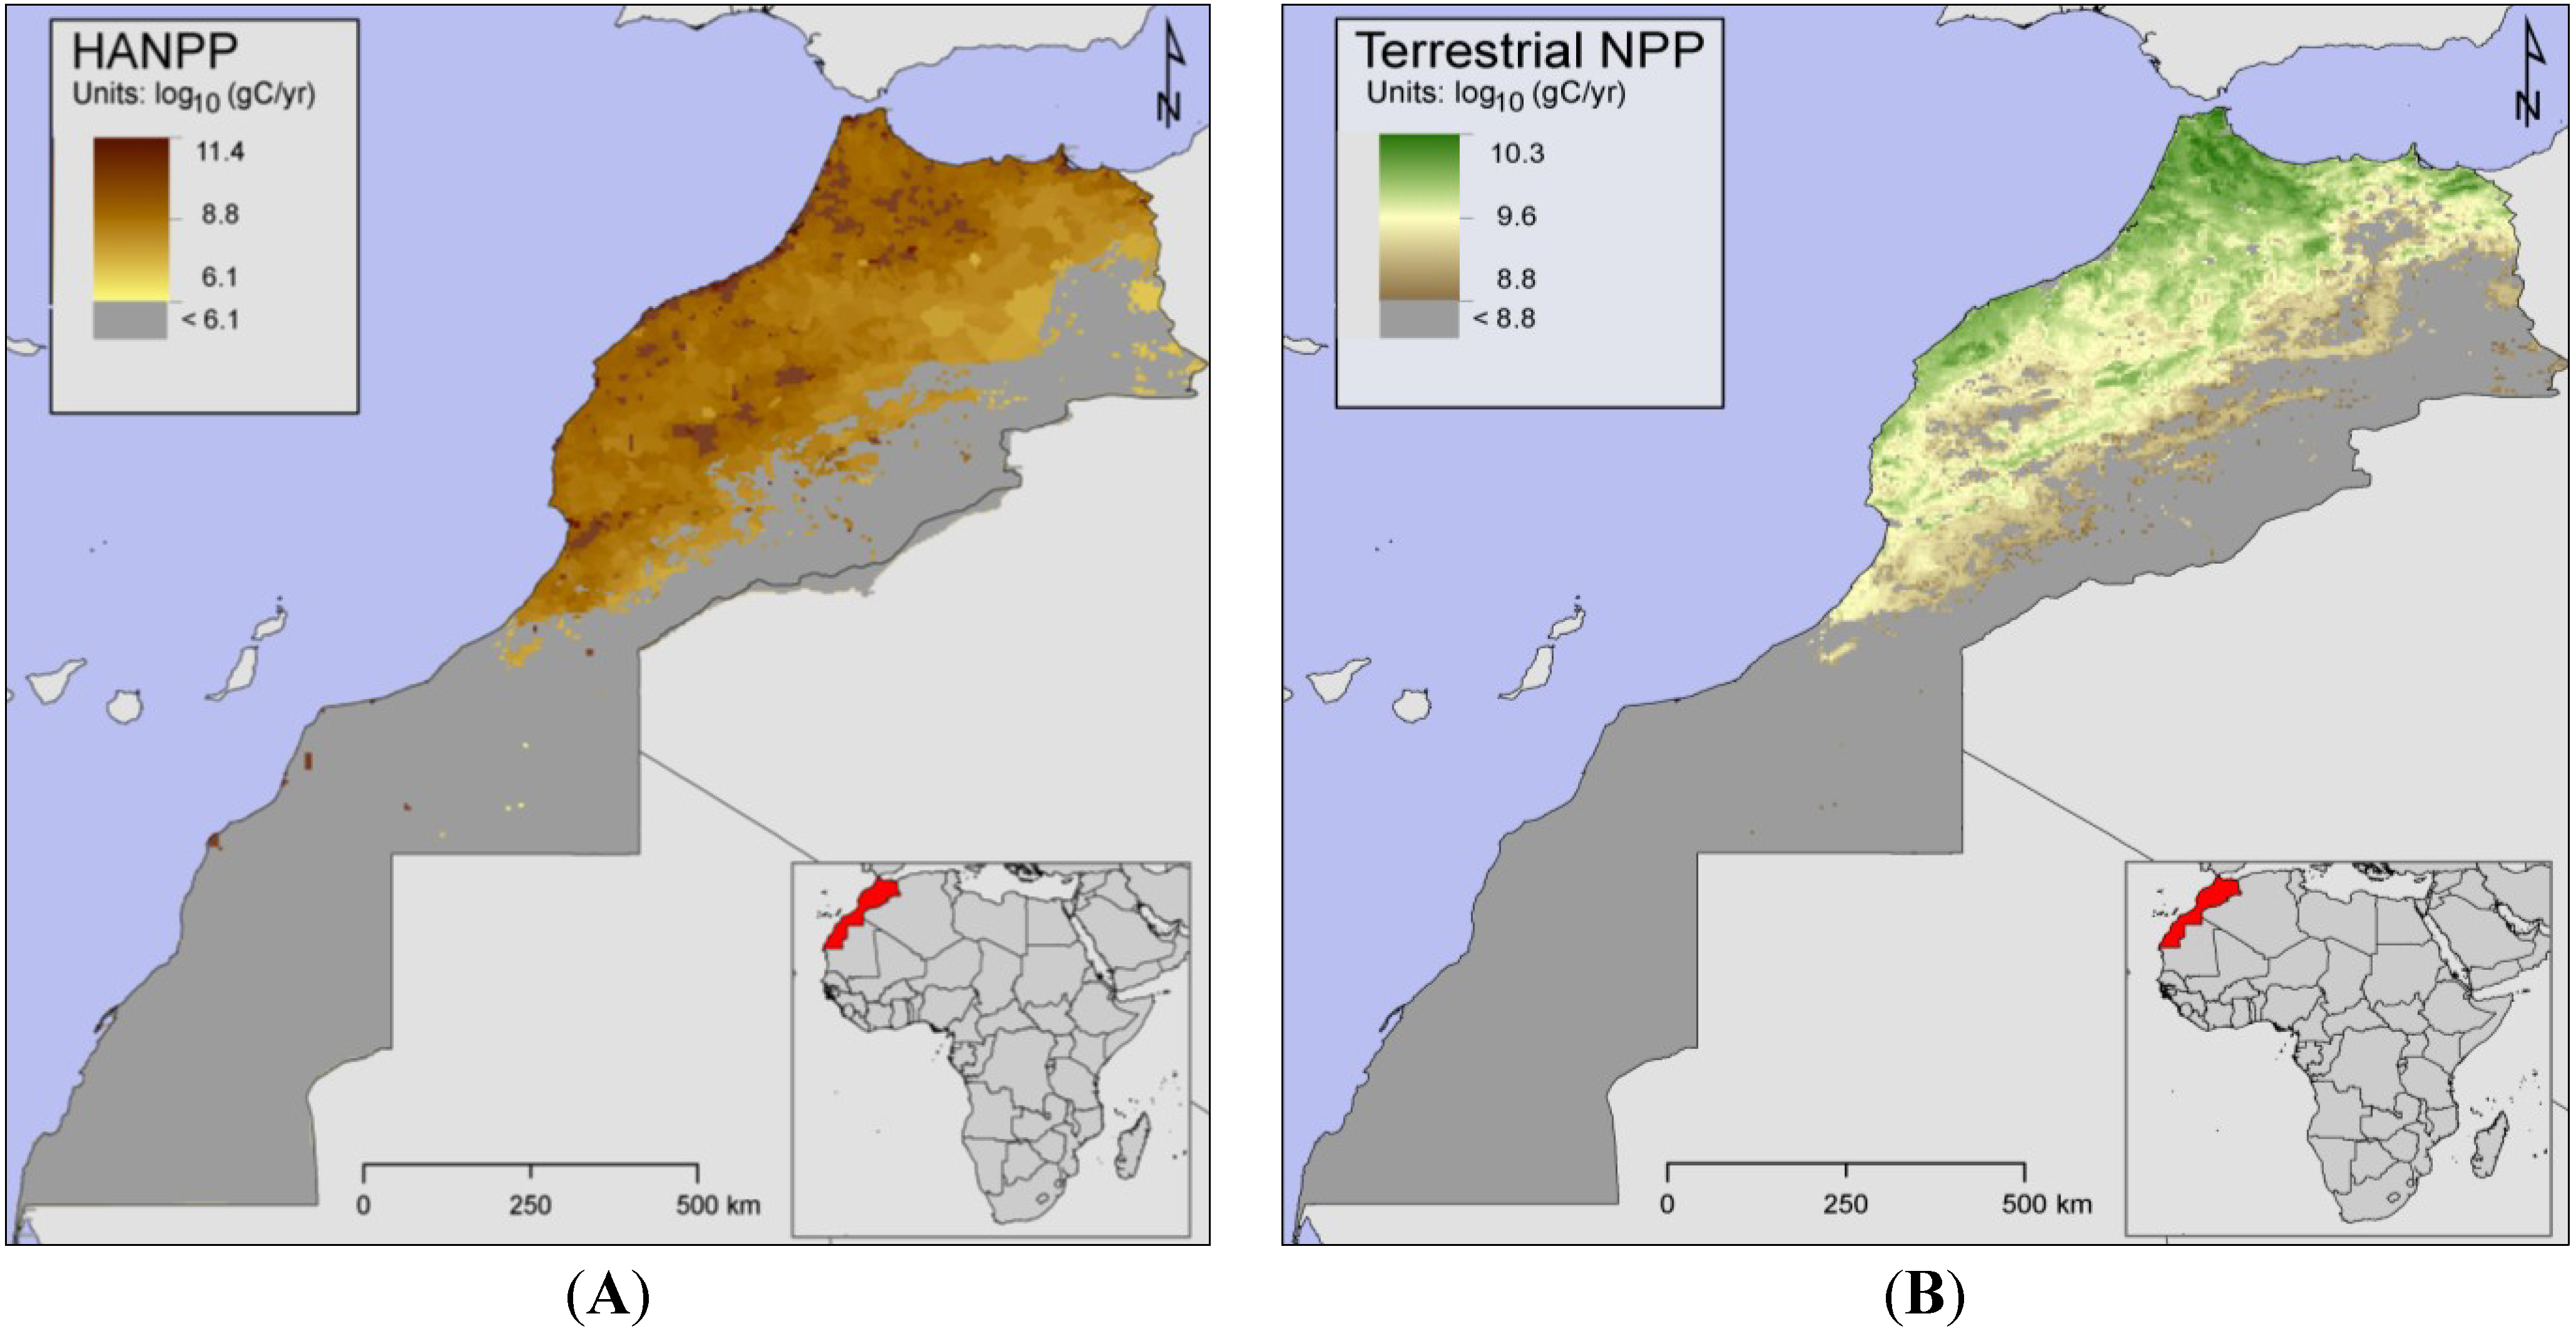
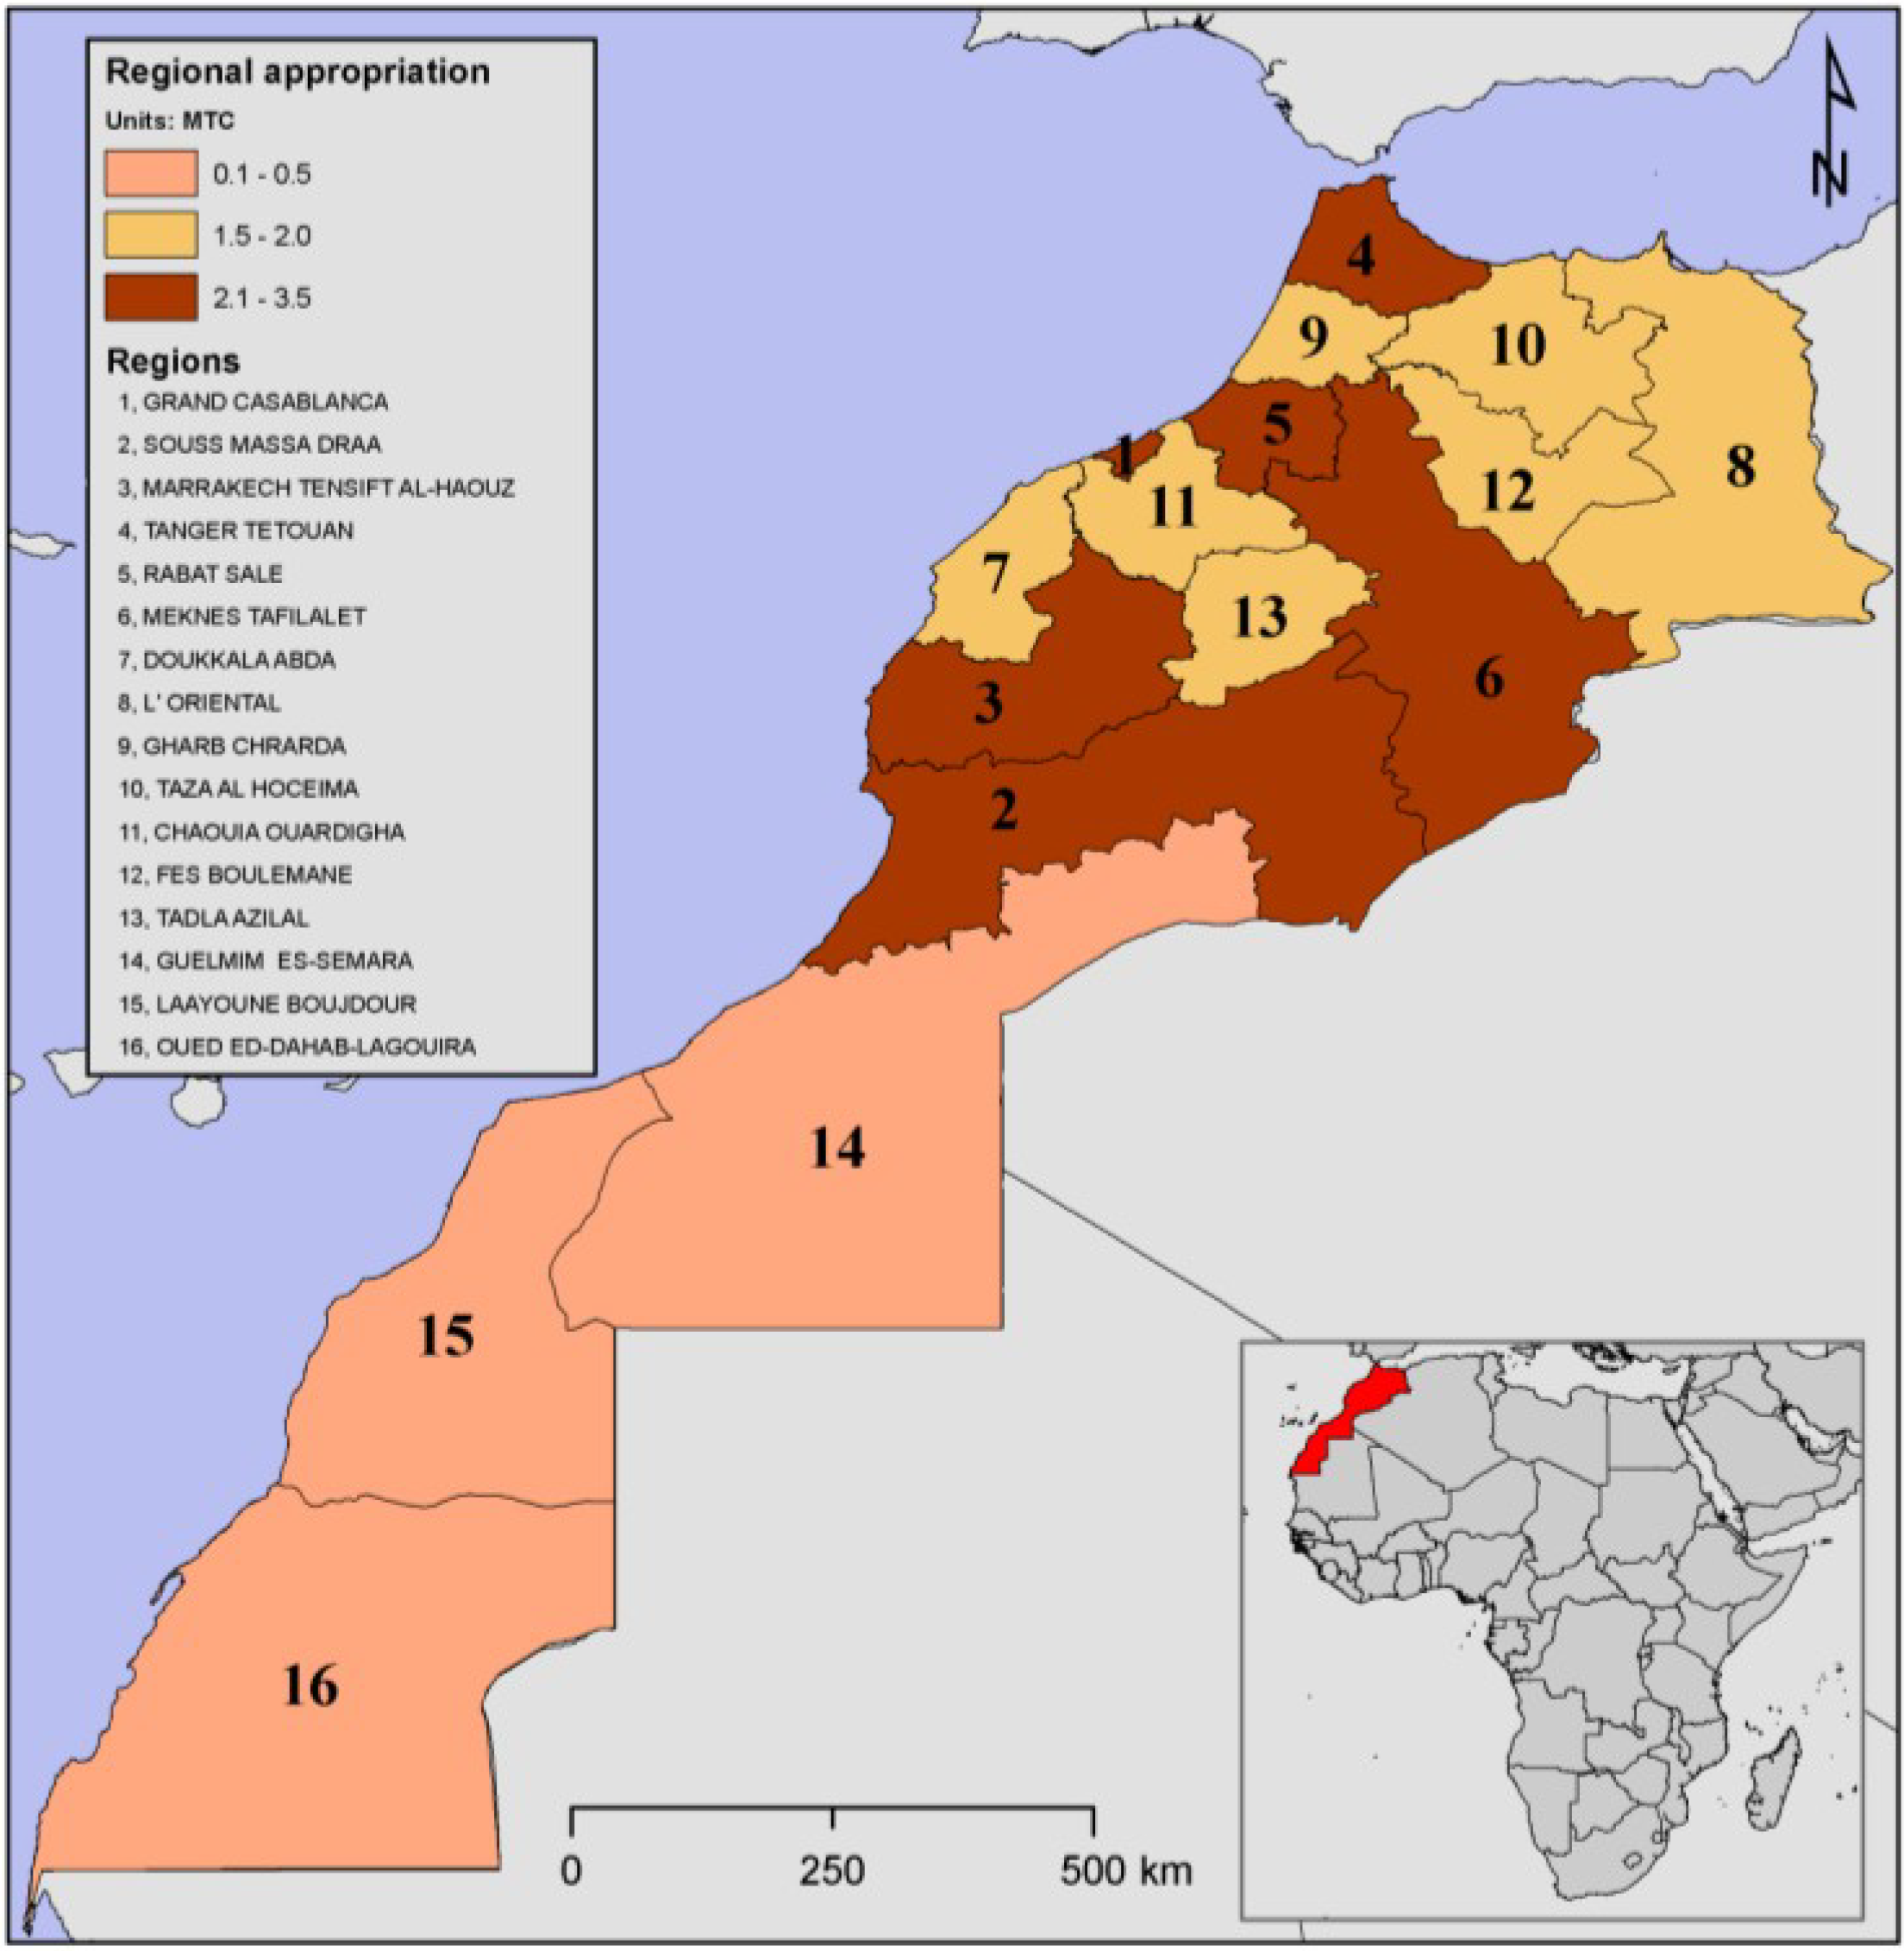
3.2. NPP Supply
4. Results and Discussion
4.1. Evaluation of the Current Situation
| Population (million) | Vegetal | Eggs | Meat | Milk | Crop Fiber | Total Food Products | Wood | Paper | Wood Fiber | Total Wood Products | Total Appropriation | |
|---|---|---|---|---|---|---|---|---|---|---|---|---|
| 1995 | 27.21 | 11.91 | 0.64 | 4.83 | 0.38 | 0.15 | 17.91 | 6.35 | 0.30 | 0.11 | 6.75 | 24.66 |
| 2000 | 29.14 | 13.10 | 0.77 | 5.74 | 0.51 | 0.11 | 20.24 | 4.46 | 0.34 | 0.08 | 4.87 | 25.11 |
| 2003 | 30.21 | 13.94 | 0.76 | 6.26 | 0.54 | 0.11 | 21.61 | 4.57 | 0.38 | 0.20 | 5.15 | 26.76 |
| 2005 | 30.93 | 14.54 | 0.63 | 7.10 | 0.60 | 0.005 | 22.88 | 6.18 | 0.44 | 0.11 | 6.73 | 29.61 |
| 2007 | 31.70 | 15.16 | 0.67 | 7.56 | 0.69 | 0.01 | 24.08 | 5.12 | 0.44 | 0.09 | 5.65 | 29.73 |
| Absolute change | 4.49 | 3.25 | 0.03 | 2.73 | 0.31 | −0.15 | 6.17 | −1.23 | 0.14 | −0.02 | −1.10 | 5.07 |
| Relative change (%) | 16.50 | 27.30 | 4.56 | 56.54 | 80.37 | −96.71 | 34.45 | −19.33 | 48.66 | −18.08 | −16.33 | 20.54 |


| 2000 | 2003 | 2005 | 2007 | |
|---|---|---|---|---|
| Food | ||||
| NPP demand | 18.08 | 19.26 | 20.22 | 21.24 |
| NPP supply | 22.23 | 23.79 | 19.50 | 22.17 |
| Demand/supply (%) | 81.31 | 80.98 | 103.68 | 95.83 |
| Wood | ||||
| NPP demand | 4.88 | 5.16 | 6.74 | 5.65 |
| NPP supply | 2.67 | 2.51 | 2.27 | 2.95 |
| Demand/supply (%) | 182.44 | 205.72 | 297.07 | 191.54 |

4.2. Plausible Future Evolution
4.2.1 Projection of the Demand
| Population scenario (P) | Affluence scenario (A) | Technology scenario (T) | PAT | |||||
|---|---|---|---|---|---|---|---|---|
| A2 | B2 | A2 | B2 | A2 | B2 | A2 | B2 | |
| 2015 | 32.80 | 31.22 | 39.67 | 32.90 | 29.37 | 29.20 | 64.77 | 33.88 |
| 2020 | 34.87 | 32.37 | 49.58 | 34.86 | 29.04 | 28.73 | 68.06 | 36.63 |
| 2025 | 37.06 | 33.57 | 59.50 | 36.83 | 28.73 | 28.30 | 71.58 | 39.53 |
| Relative change (%) | 24.70 | 12.95 | 100 | 23.92 | −3.33 | −4.78 | 140.84 | 33.02 |
4.2.2. Projection of Supply
| NPP Observations | NPP Projections | |||||||
|---|---|---|---|---|---|---|---|---|
| Biomes | 2007 | 2015 | 2020 | 2025 | ||||
| A2 | B2 | A2 | B2 | A2 | B2 | |||
| Woodlands | 2.9500 | 2.9528 | 2.9531 | 2.9553 | 2.9560 | 2.9579 | 2.9589 | |
| Agricultural lands | Cereals | 2.6920 | 2.6427 | 2.6493 | 2.5944 | 2.6073 | 2.5469 | 2.5659 |
| Croplands | 19.4740 | 18.849 | 18.872 | 18.243 | 18.289 | 17.658 | 17.724 | |
| Others classes | 35.1220 | 34.659 | 34.745 | 34.204 | 34.373 | 33.756 | 34.007 | |
| Total | 60.2390 | 59.103 | 59.219 | 57.997 | 58.225 | 56.919 | 57.256 | |
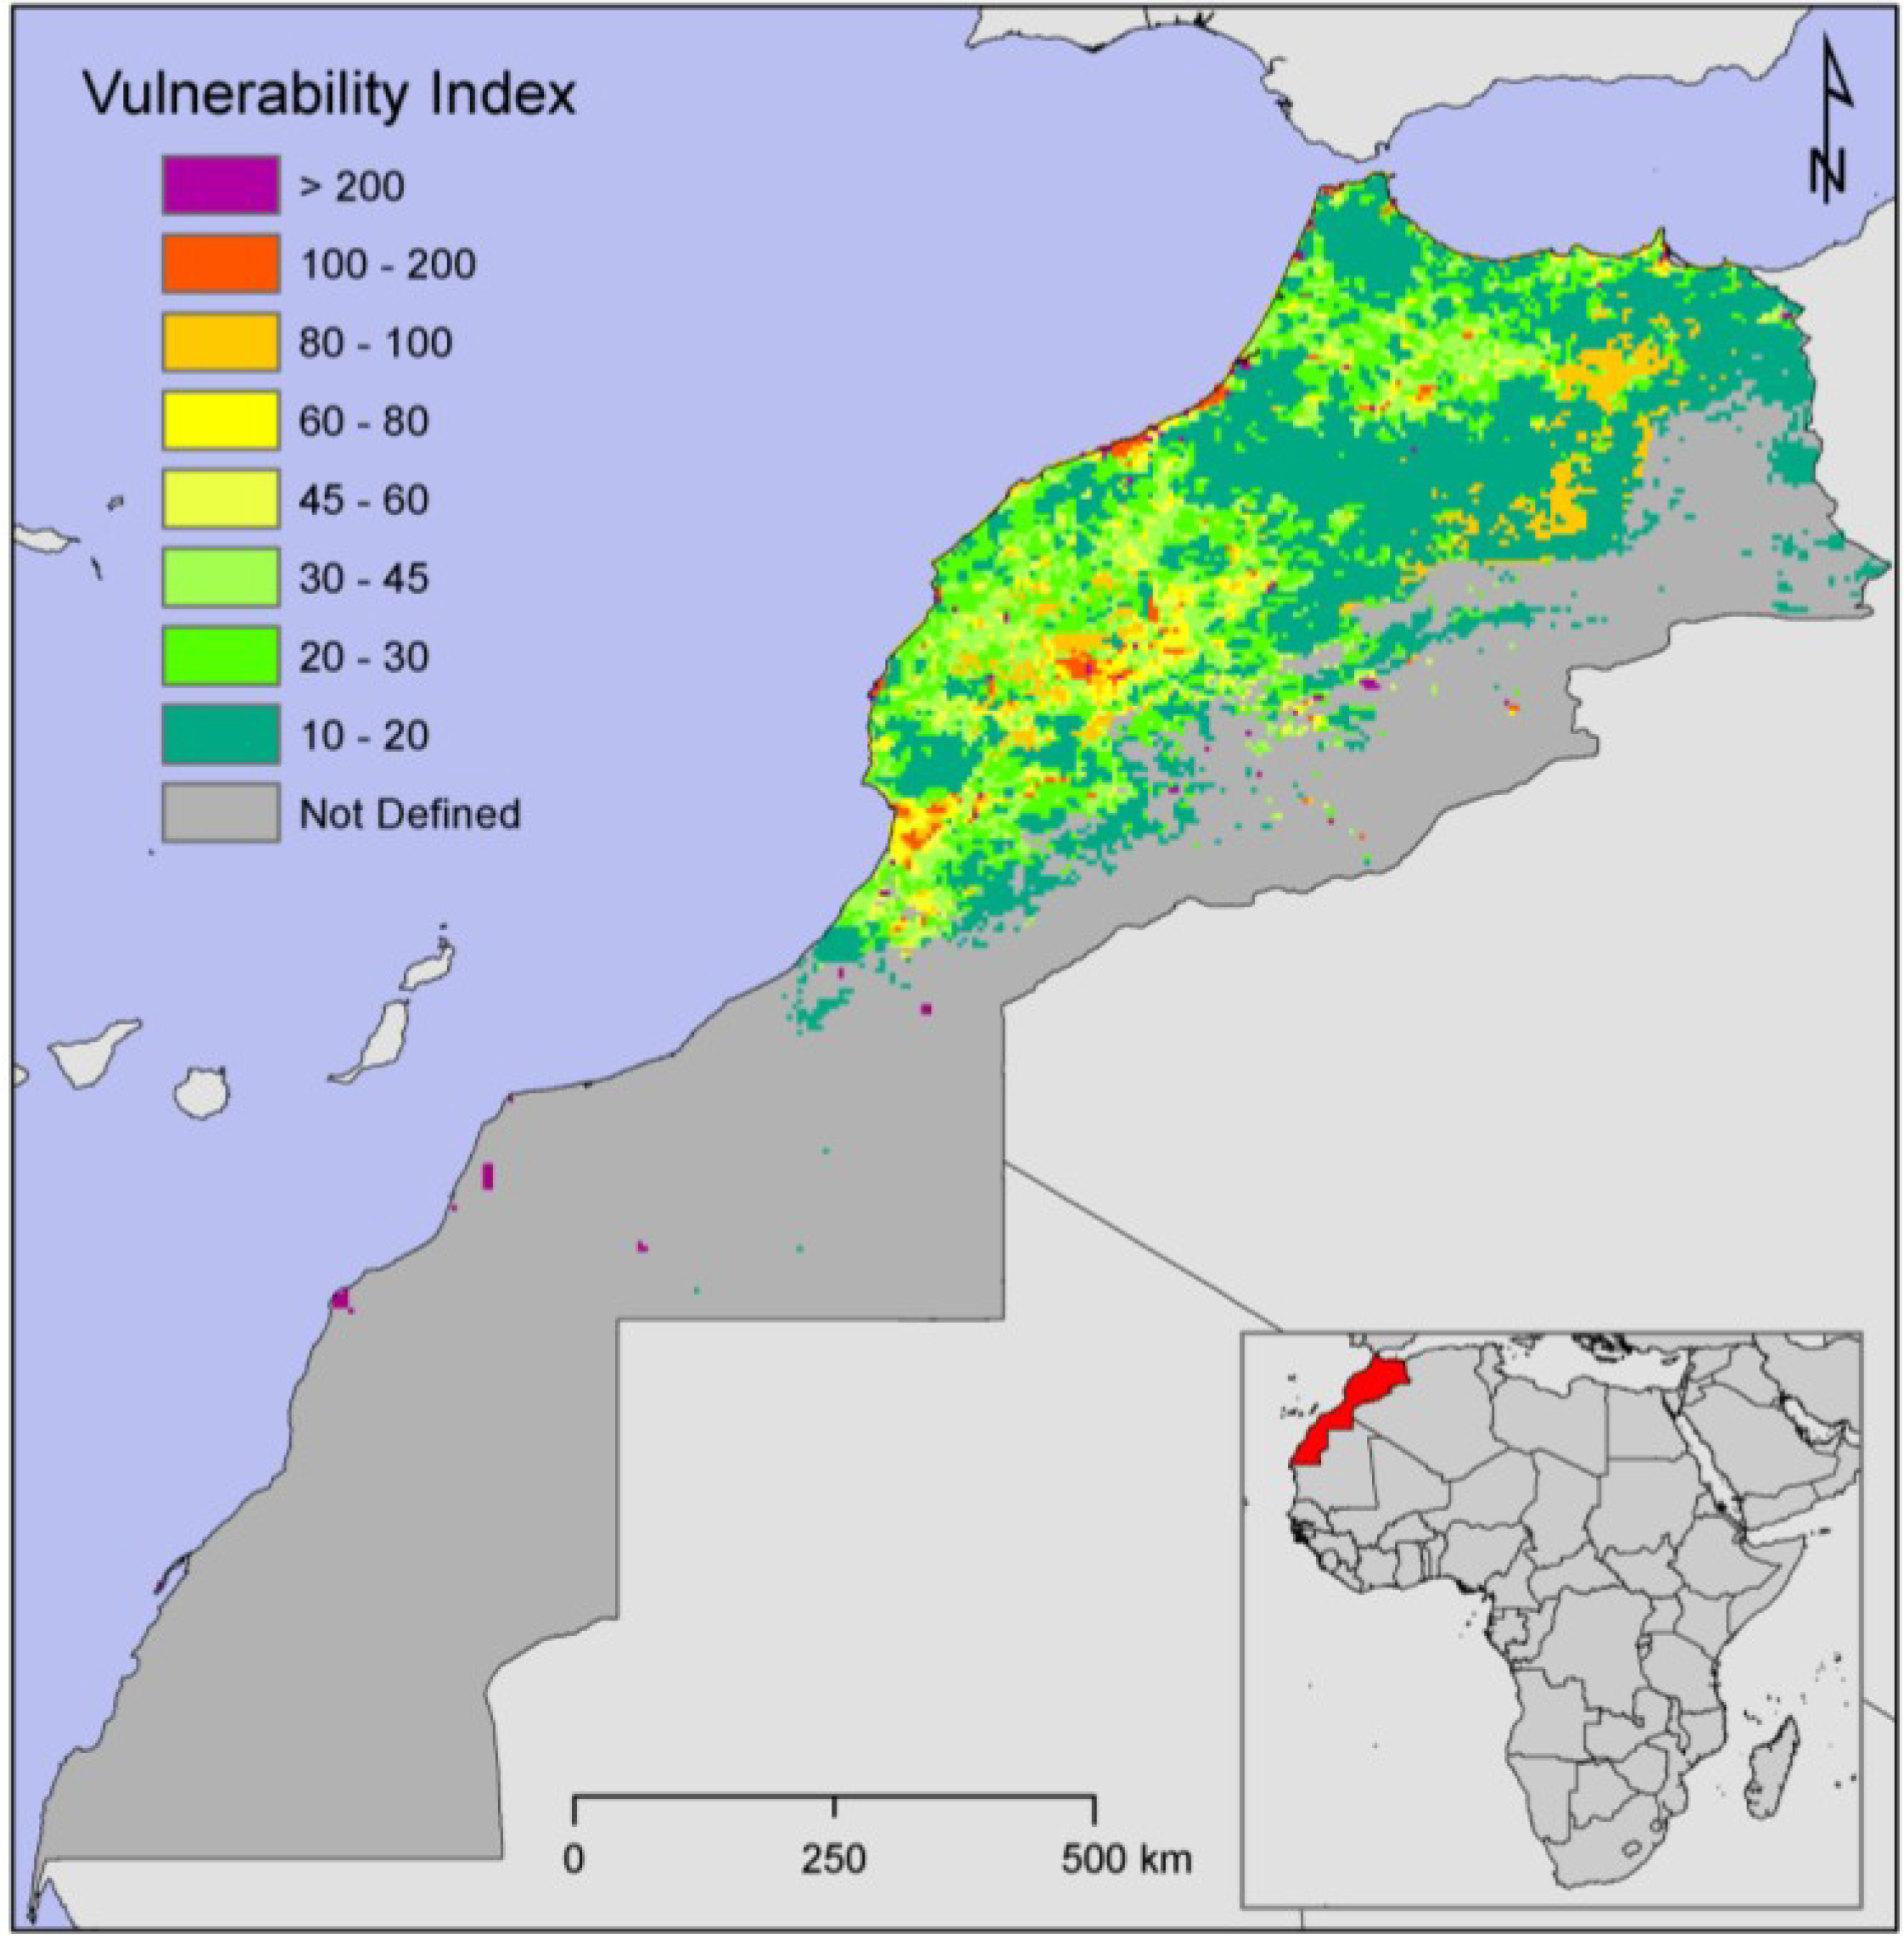
4.2.3. Plausible Future Situation
| Combination | Scenarios A2 | Scenario B2 | ||||||
|---|---|---|---|---|---|---|---|---|
| D | S | D | S | |||||
| 1 |  | - | - | - | 37.06 | 33.57 | ||
| 2 | - | | - | - | 59.50 | 36.83 | ||
| 3 | - | - | | - | 28.73 | 28.30 | ||
| 4 | - | - | - | | 56.92 | 57.26 | ||
| 5 | | | | | 71.58 | 56.92 | 39.53 | 57.26 |
| Vulnerability Index for 2025 (%) | 125.75 | 69.05 | ||||||
5. Concluding Remarks
Acknowledgments
Author Contributions
Conflicts of Interest
References
- International Panel on Climate Change (IPCC). Summary for Policymakers. In Climate Change 2007: Impacts, Adaptation and Vulnerability. Contribution of Working Group II to the Fourth Assessment Report of the Intergovernmental Panel on Climate Change; Cambridge University Press: Cambridge, UK, 2007; p. 976. [Google Scholar]
- Tagesson, T.; Mastepanov, M.; Tamstorf, M.P.; Eklundh, L.; Schubert, P.; Ekberg, A.; Sigsgaard, C.; Christensen, T.R.; Ström, L. High-resolution satellite data reveal an increase in peak growing season gross primary production in a high-Arctic wet tundra ecosystem 1992–2008. Int. J. Appl. Earth Obs. Geoinf. 2012, 18, 407–416. [Google Scholar] [CrossRef]
- Bounoua, L.; DeFries, R.S.; Imhoff, M.L.; Steininger, M.K. Land use and local climate: A case study near Santa Cruz, Bolivia. Meteorol. Atmos. Phys. 2004, 86, 73–85. [Google Scholar] [CrossRef]
- Easterling, W.E.; Aggarwal, P.K.; Batima, P.; Brander, K.M.; Erda, L.; Howden, S.M.; Kirilenko, A.; Morton, J.; Soussana, J.F.; Schmidhuber, J.; et al. Food, fibre and forest products. In Climate Change 2007: Impacts, Adaptation and Vulnerability. Contribution of Working Group II to the Fourth Assessment Report of the Intergovernmental Panel on Climate Change; Parry, M.L., Canziani, O.F., Palutikof, J.P., van der Linden, P.J., Hanson, C.E., Eds.; Cambridge University Press: Cambridge, UK, 2007; pp. 273–313. [Google Scholar]
- Droogers, P. Adaptation to climate change to enhance food security and preserve environmental quality: example for southern Sri Lanka. Agr. Water. Manage. 2004, 66, 15–33. [Google Scholar] [CrossRef]
- Droogers, P.; Aerts, J. Adaptation strategies to climate change and climate variability: A comparative study between seven contrasting river basins. Phys. Chem. Earth. 2005, 30, 339–346. [Google Scholar] [CrossRef]
- Rosenzweig, C.; Parry, M.L. Potential impact of climate change on world food supply. Nature 1994, 367, 133–138. [Google Scholar] [CrossRef]
- Food and Agriculture Organization (FAO). The State of World Fisheries and Aquaculture 2008; FAO: Rome, Italy, 2009; p. 176. Available online: ftp://ftp.fao.org/docrep/fao/011/i0250e/i0250e.pdf (accessed on 20 March 2014).
- FAO. Global hunger declining, but still unacceptably high. Available online: http://www.fao.org/docrep/012/al390e/al390e00.pdf (accessed on 20 March 2014).
- Imhoff, M.; Bounoua, L. Exploring global patterns of net primary production carbon supply and demand using satellite observations and statistical data. J. Geophys. Res. 2006, 111, D22S12. [Google Scholar]
- FAO. “Climate-Smart” Agriculture Policies, Practices and Financing for Food Security, Adaptation and Mitigation; FAO: Rome, Italy, 2010. Available online: http://www.fao.org/fileadmin/user_upload/newsroom/docs/the-hague-conference-fao-paper.pdf (accessed on 20 March 2013).
- Babqiqi, A.; Messouli, L. Simulation of climate and its implication on agriculture in Morocco using Statistical Downscaling. Int. J. Latest Res. Sci. Tech. 2013, 2, 83–96. [Google Scholar]
- Arnell, N.W.; Livermore, M.J.L.; Kovats, S.; Levy, P.E.; Nicholls, R.; Parry, M.L.; Gaffin, S.R. Climate and socio-economic scenarios for global-scale climate change impacts assessments: Characterising the SRES storylines. Glob. Environ. Change. 2004, 14, 3–20. [Google Scholar]
- Gommes, R.; Kanamaru, H.; El Hairech, T.; Rosillon, D.; Babqiqi, A.; Balaghi, R.; Doukkali, R.; Driouech, F.; El Ouali, A.; Jlibene, M.; et al. World Bank—Morocco study on the impact of Climate change on the agricultural sector. Available online: http://www.fao.org/nr/climpag/pub/FAO_WorldBank_Study_CC_Morocco_2008.pdf (accessed on 20 March 2014).
- Imhoff, M.; Bounoua, L.; Ricketts, T.; Loucks, C.; Harriss, R.; Lawrence, W.T. Global patterns in human consumption of net primary production. Nature 2004, 429, 870–873. [Google Scholar] [CrossRef]
- Recensement général de la population et de l’habitat (RGPH). Royaume Du Maroc, Haut Commissariat au Plan. Available online: http://www.hcp.ma/downloads/Demographie-Caracteristiques-demographiques-et-socio-economiques-RGPH-2004_t13063.html (accessed 20 March 2014). (In French)
- Zhao, M.; Running, S.W. Response to Comments on “Drought-Induced Reduction in Global Terrestrial Net Primary Production from 2000 through 2009”. Science 2011, 26, 1093. [Google Scholar] [CrossRef]
- PMV Plan Maroc Vert. L’Agriculture Marocaine en Chiffres 2010. Royaume de Maroc, Ministere de l’Agricultutre et de la Pêche Maritime. Available online: http://www.agriculture.gov.ma/sites/default/files/MA-AGRI%20EN%20CHIFFRES-VF.pdf (accessed 20 March 2014). (In French)
- Enquete Nationale Sur La Consommation Et Les Depenses Des Menages 2000/2001. In Royaume Du Maroc Haut Commissariat Au Plan, Division Des EnquetesAupres Des Menages. Available online: http://www.hcp.ma/file/103035/ (accessed on 28 March 2014). (In French)
- Tamsamani, Y. La tarification des produits pétroliers au Maroc revisitée. Observatoire français des conjonctures économiques. Available online: http://www.ofce.sciences-po.fr/blog/?p=2418 (accessed on 20 March 2014). (In French)
- Agence Nationale de Réglementation des Télécommunications. Evaluation de la qualité de service (QoS) des réseaux publics de télécommunications au Maroc. Available online: http://www.anrt.ma/sites/default/files/2013-QoS-2G-3G-fr.pdf (accessed on 20 March 2014). (In French)
- Programme Nationa De Gestion Des Dechets Menagers Et Assimiles. Royaume Du Maroc Conseil National De L’environement, 2007. Available online: http://www.benimellal.cci.ma/docs/112282011123932AM.pdf (accessed on 20 March 2014). (In French)
- Le soir. Papier-Carton: un secteur à remodeler. Available online: www.lesoir-echof.com/papier-carton-un-secteur-a-remodeler/economie/22446 (accessed on 5 March 2013). (In French)
- Council for Agricultural Science and Technology. Animal agriculture and global food supply. Task Force Rep. R135. Ames, Iowa. Available online: http://www.cast-science.org/cast/pub/anag_nr.htm (accessed on 15 January 2013).
- Sere, C.; Steinfeld, H. World Livestock Production Systems; Food and Agriculture Organization of the United Nations, 1995. Available online: http://www.fao.org/ag/againfo/programmes/en/lead/toolbox/Paper127/cover1.htm (accessed on 20 March 2014).
- Friedl, M.A.; McIver, D.K.; Hodges, J.C.F.; Zhang, X.Y.; Muchoney, D.; Strahler, A.H.; Woodcock, C.E.; Gopal, S.; Schneider, A.; Cooper, A.; et al. Global land cover mapping from MODIS: algorithms and early results. Remote Sens. Environ. 2002, 83, 287–302. [Google Scholar] [CrossRef]
- Giri, C.; Zhu, Z.; Reed, B. A comparative analysis of the Global Land Cover 2000 and MODIS land cover data sets. Remote Sens. Environ. 2005, 94, 123–132. [Google Scholar]
- Myneni, R.B.; Hoffmana, S.; Knyazikhina, Y.; Privette, J.L.; Glassyc, J.; Tiana, Y.; Wanga, Y.; Songa, X.; Zhanga, Y.; Smitha, G.R.; et al. Global products of vegetation leaf area and fraction absorbed PAR from year one of MODIS data. Remote Sens. Environ. 2002, 83, 214–231. [Google Scholar] [CrossRef]
- Balaghi, R.; Jlibene, M.; Tychon, B.; Eerens, H. La prédiction agrométéorologique des rendements céréaliers au Maroc. Available online: http://www.inra.org.ma/publications/ouvrages/prediction1212.pdf (accessed on 20 March 2014). (In French)
- FAO. Food Insecurity: When People must Live with Hunger and Fear Starvation. Available online: ftp://ftp.fao.org/docrep/fao/005/y7352e/y7352e00.pdf (accessed on 20 March 2014).
- Godfray, H.C.J.; Pretty, J.; Thomas, S.M.; Warham, E.J.; Beddington, J.R. Linking Policy on Climate and Food. Science 2011, 331, 1013–1014. [Google Scholar]
- Hanjra, M.A.; Qureshi, M.E. Global water crisis and future food security in an era of climate change. Food Policy 2010, 35, 365–377. [Google Scholar] [CrossRef]
- Holdren, J.P.; Ehrlich, P.R. Human population and the global environment. Am. Sci. 1974, 62, 282–292. [Google Scholar]
- Nakicenovic, N.; Alcamo, J.; Davis, G.; de Vries, B.; Fenhann, J.; Gaffin, S.; Gregory, K.; Grubler, A.; Jung, T.Y.; Kram, T.; et al. IPCC Special Report on Emissions Scenarios (SRES); Cambridge University Press: Cambridge, UK, 2000. [Google Scholar]
- Business for Social Responsibility. Waste Not, Want Not: An Overview of the Food Waste Issue. Available online: http://www.bsr.org/reports/BSR_Waste_Not_Want_Not_An_Overview_Food_Waste.pdf (accessed on 20 March 2014).
- Bounoua, L.; Collatz, G.J.; Sellers, P.J.; Randall, D.A.; Dazlich, D.; Los, S.; Berry, J.; Fung, I.; Tucker, C.J.; Field, C.; et al. Interactions between vegetation and climate: Radiative and physiological effects of doubled atmospheric CO2. J. Clim. 1999, 12, 309–323. [Google Scholar]
- Anjum, S.A.; Xie, X.; Wang, L.; Saleem, M.F.; Man, C.; Wang, L.W. Morphological, physiological and biochemical responses of plants to drought stress. Review. Afr. J. Agric. Res. 2011, 6, 2026–2032. [Google Scholar]
- Bindi, M.; Moriondo, M. Impact of a 2 °C global temperature rise on the Mediterranean region: Agriculture analysis assessment. In Climate Change Impacts In The Mediterranean Resulting From A 2 °C Global Temperature Rise; Giannakopoulos, C., Bindi, M., Moriondo, M., Tin, T., Eds.; World Wide Fund For Nature: Morges, Switzerland, 2005; pp. 54–66. [Google Scholar]
© 2014 by the authors; licensee MDPI, Basel, Switzerland. This article is an open access article distributed under the terms and conditions of the Creative Commons Attribution license (http://creativecommons.org/licenses/by/3.0/).
Share and Cite
Rochdane, S.; Bounoua, L.; Zhang, P.; Imhoff, M.L.; Messouli, M.; Yacoubi-Khebiza, M. Combining Satellite Data and Models to Assess Vulnerability to Climate Change and Its Impact on Food Security in Morocco. Sustainability 2014, 6, 1729-1746. https://doi.org/10.3390/su6041729
Rochdane S, Bounoua L, Zhang P, Imhoff ML, Messouli M, Yacoubi-Khebiza M. Combining Satellite Data and Models to Assess Vulnerability to Climate Change and Its Impact on Food Security in Morocco. Sustainability. 2014; 6(4):1729-1746. https://doi.org/10.3390/su6041729
Chicago/Turabian StyleRochdane, Saloua, Lahouari Bounoua, Ping Zhang, Marc L. Imhoff, Mohammed Messouli, and Mohammed Yacoubi-Khebiza. 2014. "Combining Satellite Data and Models to Assess Vulnerability to Climate Change and Its Impact on Food Security in Morocco" Sustainability 6, no. 4: 1729-1746. https://doi.org/10.3390/su6041729
APA StyleRochdane, S., Bounoua, L., Zhang, P., Imhoff, M. L., Messouli, M., & Yacoubi-Khebiza, M. (2014). Combining Satellite Data and Models to Assess Vulnerability to Climate Change and Its Impact on Food Security in Morocco. Sustainability, 6(4), 1729-1746. https://doi.org/10.3390/su6041729